Gauge Chart

Technician Installing Electricity Meter At Construction Site Ppt PowerPoint Presentation File Slideshow PDF
Pitch your topic with ease and precision using this technician installing electricity meter at construction site ppt powerpoint presentation file slideshow pdf. This layout presents information on technician installing electricity meter at construction site. It is also available for immediate download and adjustment. So, changes can be made in the color, design, graphics or any other component to create a unique layout.
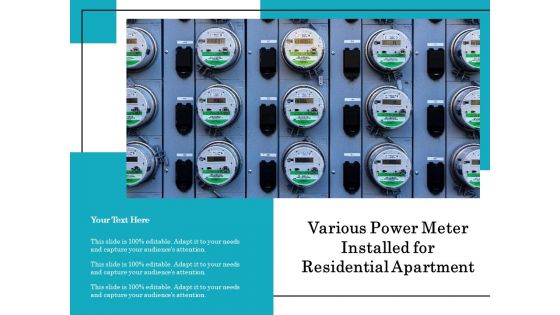
Various Power Meter Installed For Residential Apartment Ppt PowerPoint Presentation Gallery Layouts PDF
Showcasing this set of slides titled various power meter installed for residential apartment ppt powerpoint presentation gallery layouts pdf. The topics addressed in these templates are various power meter installed for residential apartment. All the content presented in this PPT design is completely editable. Download it and make adjustments in color, background, font etc. as per your unique business setting.

Various Power Meter Panel In Factory Control Room Ppt PowerPoint Presentation Gallery Smartart PDF
Pitch your topic with ease and precision using this various power meter panel in factory control room ppt powerpoint presentation gallery smartart pdf. This layout presents information on various power meter panel in factory control room. It is also available for immediate download and adjustment. So, changes can be made in the color, design, graphics or any other component to create a unique layout.
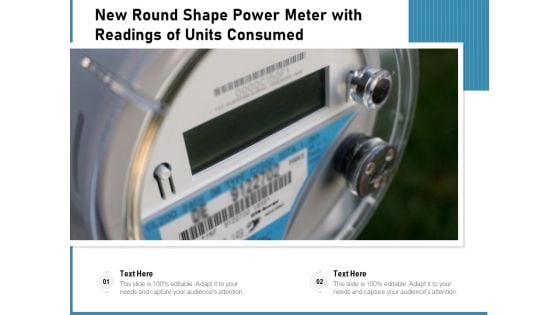
New Round Shape Power Meter With Readings Of Units Consumed Ppt PowerPoint Presentation File Show PDF
Showcasing this set of slides titled new round shape power meter with readings of units consumed ppt powerpoint presentation file show pdf. The topics addressed in these templates are new round shape power meter with readings of units consumed. All the content presented in this PPT design is completely editable. Download it and make adjustments in color, background, font etc. as per your unique business setting.
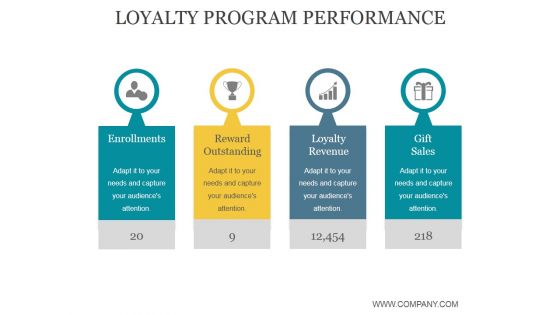
Loyalty Program Performance Ppt PowerPoint Presentation Portfolio
This is a loyalty program performance ppt powerpoint presentation portfolio. This is a four stage process. The stages in this process are enrollments, reward outstanding, loyalty revenue, gift sales.
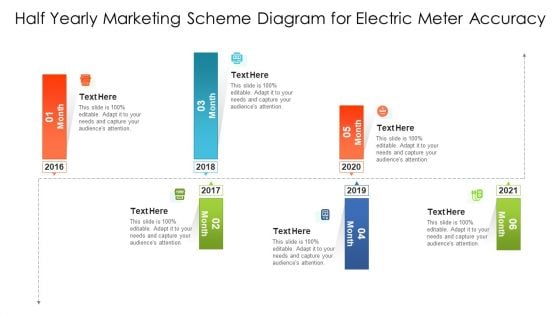
Half Yearly Marketing Scheme Diagram For Electric Meter Accuracy Ppt PowerPoint Presentation Gallery Maker PDF
Persuade your audience using this half yearly marketing scheme diagram for electric meter accuracy ppt powerpoint presentation gallery maker pdf. This PPT design covers six stages, thus making it a great tool to use. It also caters to a variety of topics including half yearly marketing scheme diagram for electric meter accuracy. Download this PPT design now to present a convincing pitch that not only emphasizes the topic but also showcases your presentation skills.
Client Satisfaction Level Meter Vector Icon Ppt PowerPoint Presentation Gallery Structure PDF
Presenting this set of slides with name client satisfaction level meter vector icon ppt powerpoint presentation gallery structure pdf. This is a three stage process. The stages in this process are client satisfaction level meter vector icon. This is a completely editable PowerPoint presentation and is available for immediate download. Download now and impress your audience.
Meter Showing High Risk Level Vector Icon Ppt PowerPoint Presentation Gallery Clipart PDF
Presenting this set of slides with name meter showing high risk level vector icon ppt powerpoint presentation gallery clipart pdf. This is a one stage process. The stage in this process is meter showing high risk level vector icon. This is a completely editable PowerPoint presentation and is available for immediate download. Download now and impress your audience.
Meter Performance Dashboard Vector Icon Ppt PowerPoint Presentation Gallery Backgrounds PDF
Presenting this set of slides with name meter performance dashboard vector icon ppt powerpoint presentation gallery backgrounds pdf. This is a three stage process. The stages in this process are meter performance dashboard vector icon. This is a completely editable PowerPoint presentation and is available for immediate download. Download now and impress your audience.
Measurement Of Blood Glucose Levels With Hemoglobin Meter Ppt PowerPoint Presentation Icon Layouts PDF
Pitch your topic with ease and precision using this measurement of blood glucose levels with hemoglobin meter ppt powerpoint presentation icon layouts pdf. This layout presents information on measurement of blood glucose levels with hemoglobin meter. It is also available for immediate download and adjustment. So, changes can be made in the color, design, graphics or any other component to create a unique layout.
Company Website Trust Meter Vector Icon Ppt PowerPoint Presentation Infographics Example PDF
Persuade your audience using this company website trust meter vector icon ppt powerpoint presentation infographics example pdf. This PPT design covers two stages, thus making it a great tool to use. It also caters to a variety of topics including company website trust meter vector icon. Download this PPT design now to present a convincing pitch that not only emphasizes the topic but also showcases your presentation skills.
Employee Trust Meter Vector Icon Ppt PowerPoint Presentation Infographics Good PDF
Persuade your audience using this employee trust meter vector icon ppt powerpoint presentation infographics good pdf. This PPT design covers three stages, thus making it a great tool to use. It also caters to a variety of topics including employee trust meter vector icon. Download this PPT design now to present a convincing pitch that not only emphasizes the topic but also showcases your presentation skills.
Security Shield And Meter Vector Icon Ppt PowerPoint Presentation Styles Summary PDF
Persuade your audience using this security shield and meter vector icon ppt powerpoint presentation styles summary pdf. This PPT design covers three stages, thus making it a great tool to use. It also caters to a variety of topics including security shield and meter vector icon. Download this PPT design now to present a convincing pitch that not only emphasizes the topic but also showcases your presentation skills.
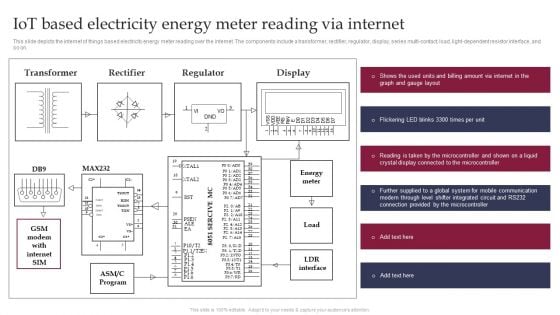
Smart Grid Technology Iot Based Electricity Energy Meter Reading Background PDF
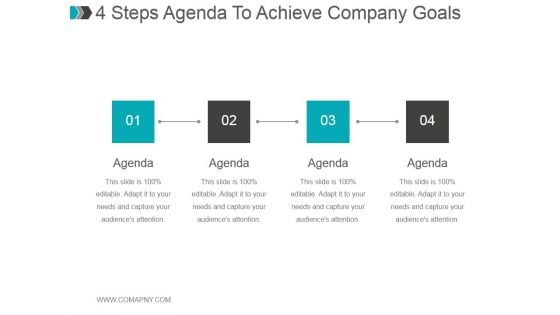
4 Steps Agenda To Achieve Company Goals Ppt PowerPoint Presentation Inspiration
This is a 4 steps agenda to achieve company goals ppt powerpoint presentation inspiration. This is a four stage process. The stages in this process are business, agenda, strategy, analysis, success.
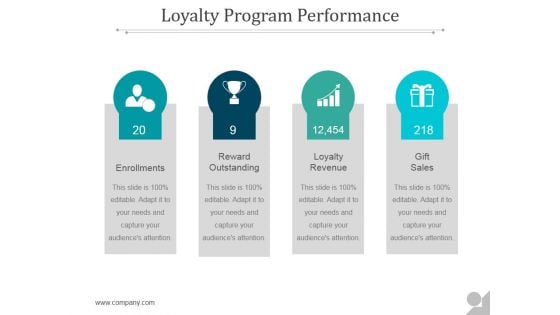
Loyalty Program Performance Ppt PowerPoint Presentation Tips
This is a loyalty program performance ppt powerpoint presentation tips. This is a four stage process. The stages in this process are enrollments, reward outstanding, loyalty revenue, gift sales.
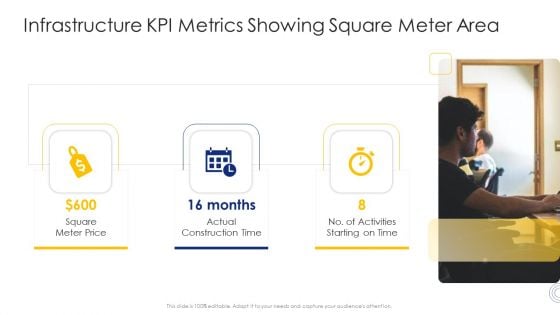
Construction Engineering And Industrial Facility Management Infrastructure KPI Metrics Showing Square Meter Area Ideas PDF
Presenting construction engineering and industrial facility management infrastructure kpi metrics showing square meter area ideas pdf to provide visual cues and insights. Share and navigate important information on three stages that need your due attention. This template can be used to pitch topics like square meter price, actual construction time, no of activities starting on time . In addtion, this PPT design contains high resolution images, graphics, etc, that are easily editable and available for immediate download.

Construction Management Services Infrastructure KPI Metrics Showing Square Meter Area Designs PDF
Presenting construction management services infrastructure kpi metrics showing square meter area designs pdf to provide visual cues and insights. Share and navigate important information on three stages that need your due attention. This template can be used to pitch topics like square meter price, actual construction time, activities. In addition, this PPT design contains high-resolution images, graphics, etc, that are easily editable and available for immediate download.
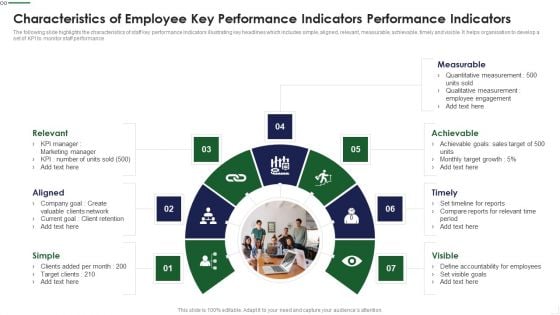
Characteristics Of Employee Key Performance Indicators Performance Indicators Guidelines PDF
The following slide highlights the characteristics of staff key performance Indicators illustrating key headlines which includes simple, aligned, relevant, measurable, achievable, timely and visible. It helps organisation to develop a set of KPI to monitor staff performance Presenting Characteristics Of Employee Key Performance Indicators Performance Indicators Guidelines PDF to dispense important information. This template comprises seven stages. It also presents valuable insights into the topics including Measurable, Achievable, Timely, Visible, Simple This is a completely customizable PowerPoint theme that can be put to use immediately. So, download it and address the topic impactfully.
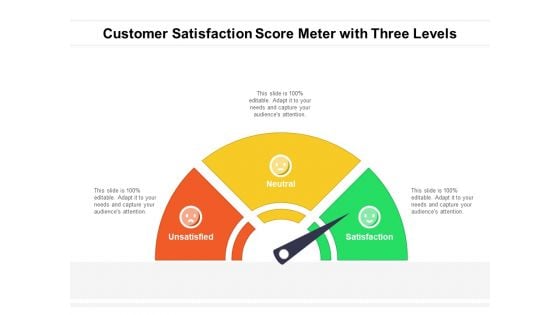
Customer Satisfaction Score Meter With Three Levels Ppt PowerPoint Presentation Gallery Smartart PDF
Presenting customer satisfaction score meter with three levels ppt powerpoint presentation gallery smartart pdf to dispense important information. This template comprises three stages. It also presents valuable insights into the topics including unsatisfied, neutral, satisfaction. This is a completely customizable PowerPoint theme that can be put to use immediately. So, download it and address the topic impactfully.
6 Point Goal For Company Management Ppt PowerPoint Presentation Slide
This is a 6 point goal for company management ppt powerpoint presentation slide. This is a six stage process. The stages in this process are agenda, business, strategy, icons, hexagon, marketing.
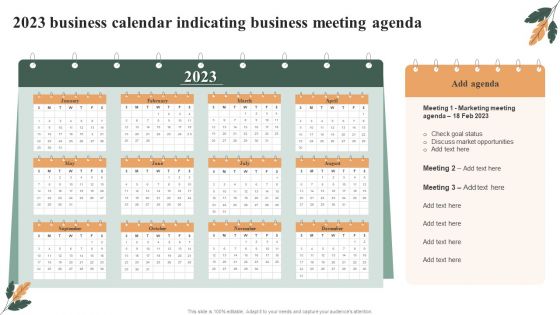
2023 Business Calendar Indicating Business Meeting Agenda Download PDF
Presenting 2023 Business Calendar Indicating Business Meeting Agenda Download PDF to dispense important information. This template comprises tweleve stages. It also presents valuable insights into the topics including Marketing Meeting, Market Opportunities, Check Goal Status. This is a completely customizable PowerPoint theme that can be put to use immediately. So, download it and address the topic impactfully.
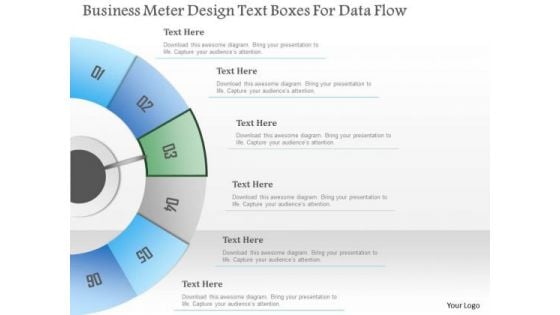
Busines Diagram Business Meter Design Text Boxes For Data Flow Presentation Template
Concept of data flow can be well defined with this exclusive business diagram. This slide contains the diagram of six steps in semi-circle. Use this professional diagram to impress your viewers.
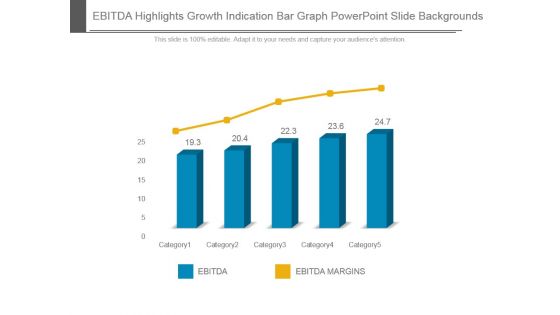
Ebitda Highlights Growth Indication Bar Graph Powerpoint Slide Backgrounds
This is a ebitda highlights growth indication bar graph powerpoint slide backgrounds. This is a five stage process. The stages in this process are ebitda, ebitda margins, category.
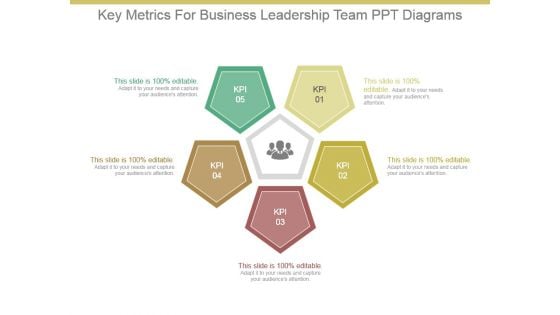
Key Metrics For Business Leadership Team Ppt Diagrams
This is a key metrics for business leadership team ppt diagrams. This is a five stage process. The stages in this process are kpi.
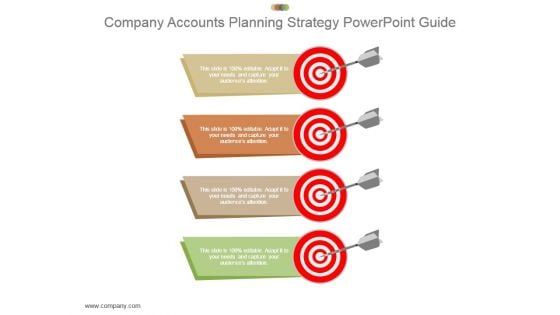
Company Accounts Planning Strategy Powerpoint Guide
This is a company accounts planning strategy powerpoint guide. This is a four stage process. The stages in this process are goal, target, planning, strategy, company.
Key Attributes Of Fixed Price Model Ppt PowerPoint Presentation Icon
This is a key attributes of fixed price model ppt powerpoint presentation icon. This is a six stage process. The stages in this process are fixed price model.
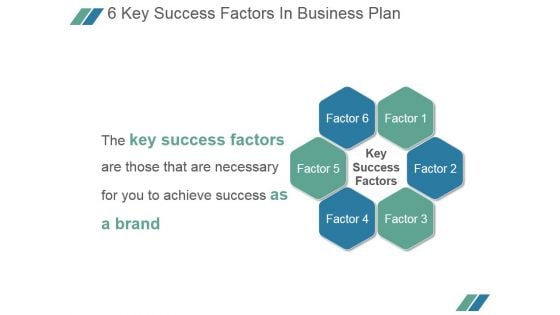
6 Key Success Factors In Business Plan Ppt PowerPoint Presentation Microsoft
This is a 6 key success factors in business plan ppt powerpoint presentation microsoft. This is a six stage process. The stages in this process are key success factors, factor.
Key Financial Ratios Template 2 Ppt PowerPoint Presentation Icon Slide Download
This is a key financial ratios template 2 ppt powerpoint presentation icon slide download. This is a six stage process. The stages in this process are price to earnings, debt to equity ratio, current ratio, return on, equity, return on , assets, return on investment.
Corporate Key Performance Indicator Icon Inspiration PDF
Showcasing this set of slides titled Corporate Key Performance Indicator Icon Inspiration PDF. The topics addressed in these templates are Corporate Key, Performance Indicator Icon. All the content presented in this PPT design is completely editable. Download it and make adjustments in color, background, font etc. as per your unique business setting.
Disagreement Icon Indicating B2b Challenges Professional PDF
Showcasing this set of slides titled Disagreement Icon Indicating B2b Challenges Professional PDF. The topics addressed in these templates are Disagreement Icon, Indicating B2b, Challenges. All the content presented in this PPT design is completely editable. Download it and make adjustments in color, background, font etc. as per your unique business setting.
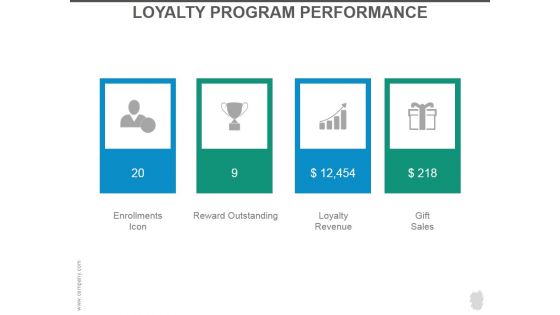
Loyalty Program Performance Ppt PowerPoint Presentation Slides
This is a loyalty program performance ppt powerpoint presentation slides. This is a four stage process. The stages in this process are enrollments icon, reward outstanding, loyalty revenue, gift sales.
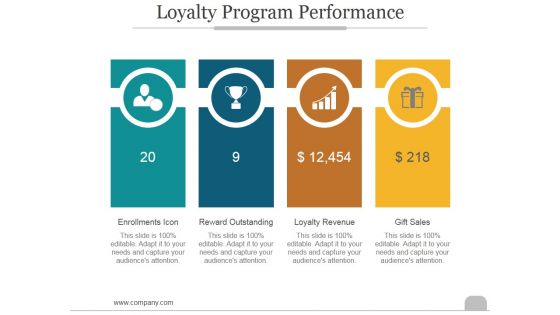
Loyalty Program Performance Ppt PowerPoint Presentation Introduction
This is a loyalty program performance ppt powerpoint presentation introduction. This is a four stage process. The stages in this process are enrollments icon, reward outstanding, loyalty revenue, gift sales.
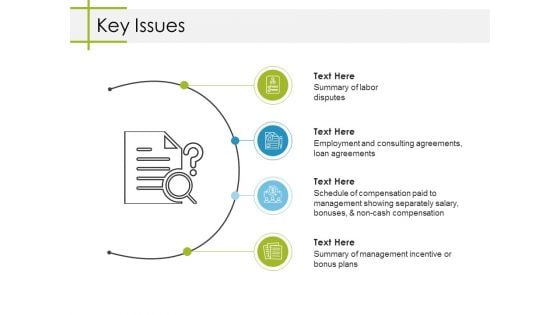
Key Issues Ppt PowerPoint Presentation Slides Deck
This is a key issues ppt powerpoint presentation slides deck. This is a four stage process. The stages in this process are key issues, business, marketing, icons, strategy.

Setting Short Term Goals Powerpoint Slide Graphics
This is a setting short term goals powerpoint slide graphics. This is a five stage process. The stages in this process are february, january, march, may, april.
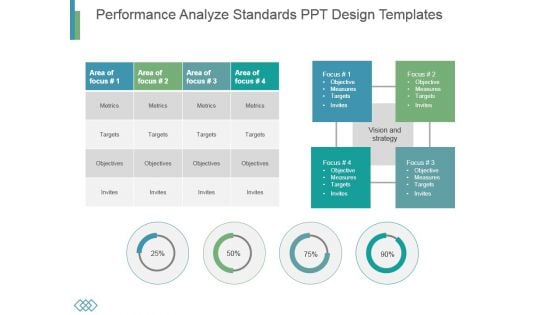
Performance Analyze Standards Ppt Design Templates
This is a performance analyze standards ppt design templates. This is a four stage process. The stages in this process are metrics, targets, objectives, invites.
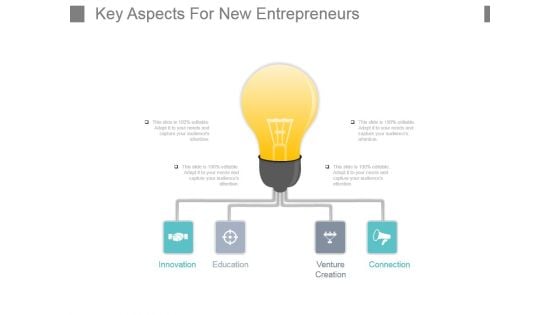
Key Aspects For New Entrepreneurs Powerpoint Slide Ideas
This is a key aspects for new entrepreneurs powerpoint slide ideas. This is a four stage process. The stages in this process are innovation, education, venture creation, connection.
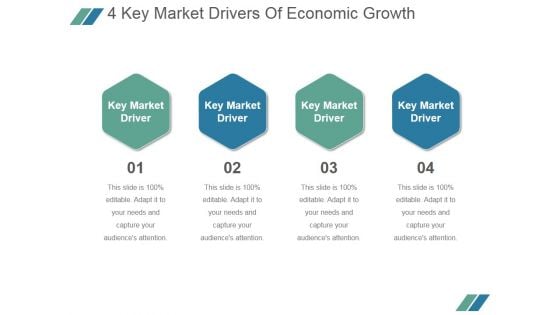
4 Key Market Drivers Of Economic Growth Ppt PowerPoint Presentation Templates
This is a 4 key market drivers of economic growth ppt powerpoint presentation templates. This is a four stage process. The stages in this process are key market driver.
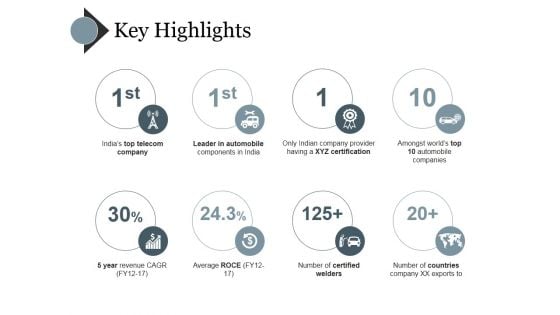
Key Highlights Ppt PowerPoint Presentation Gallery Deck
This is a key highlights ppt powerpoint presentation gallery deck. This is a eight stage process. The stages in this process are indias top telecom company, leader in automobile components in india, only indian company provider having a xyz certification, amongst worlds top 10 automobile companies, number of certified welders.
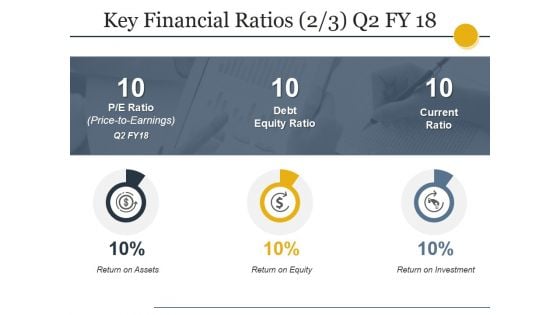
Key Financial Ratios Template Ppt PowerPoint Presentation Show Graphics Design
This is a key financial ratios template ppt powerpoint presentation show graphics design. This is a four stage process. The stages in this process are liquidity, profitability, activity, solvency.
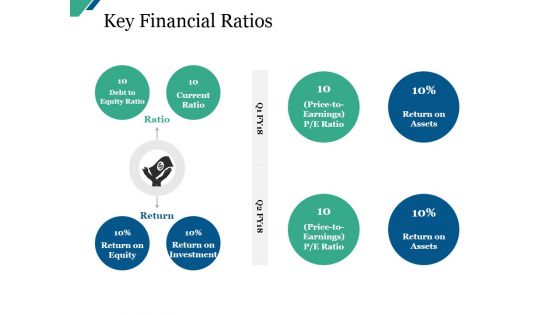
Key Financial Ratios Ppt PowerPoint Presentation Infographic Template Master Slide
This is a key financial ratios ppt powerpoint presentation infographic template master slide. This is a eight stage process. The stages in this process are debt to equity ratio, current ratio, return on equity, return on investment.
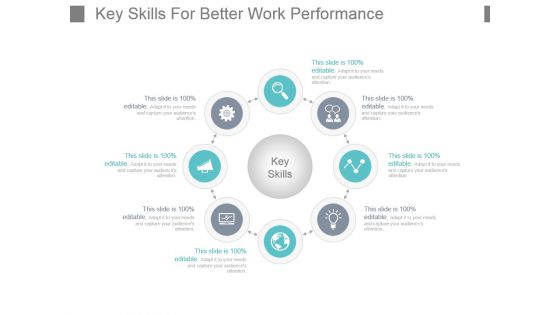
Key Skills For Better Work Performance Powerpoint Shapes
This is a key skills for better work performance powerpoint shapes. This is a four stage process. The stages in this process are key skills, flow, process, circle, icons.
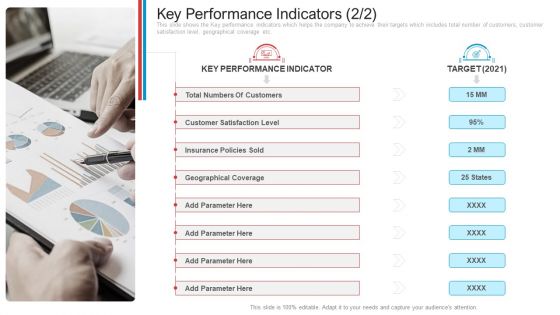
Key Performance Indicators Customers Introduction PDF
This slide shows the Key performance indicators which helps the company to achieve their targets which includes total number of customers, customer satisfaction level, geographical coverage etc. Presenting key performance indicators customers introduction pdf. to provide visual cues and insights. Share and navigate important information on seven stages that need your due attention. This template can be used to pitch topics like total numbers of customers, customer satisfaction level, insurance policies sold, geographical coverage, key performance indicator. In addtion, this PPT design contains high resolution images, graphics, etc, that are easily editable and available for immediate download.
Icon Indicating Scrum Task Project Kanban Board For Time Management Inspiration PDF
Presenting Icon Indicating Scrum Task Project Kanban Board For Time Management Inspiration PDF to dispense important information. This template comprises three stages. It also presents valuable insights into the topics including Icon Indicating Scrum Task, Project Kanban Board, Management. This is a completely customizable PowerPoint theme that can be put to use immediately. So, download it and address the topic impactfully.
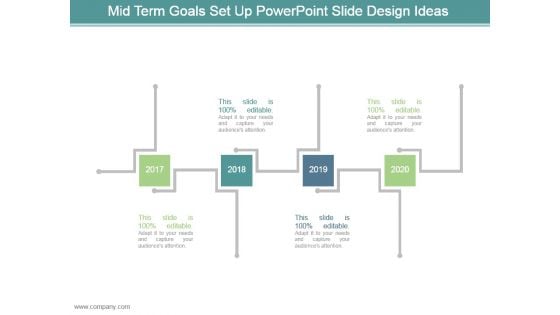
Mid Term Goals Set Up Powerpoint Slide Design Ideas
This is a mid term goals set up powerpoint slide design ideas. This is a four stage process. The stages in this process are arrows, business, marketing, planning, years.
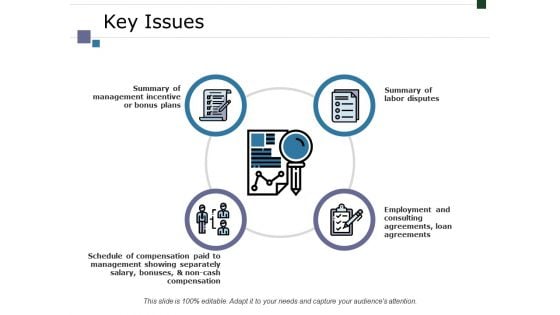
Key Issues Ppt PowerPoint Presentation Infographic Template Example 2015
This is a key issues ppt powerpoint presentation infographic template example 2015. This is a four stage process. The stages in this process are business, summary of management incentive or bonus plans, summary of labor disputes, employment and consulting agreements, loan agreements, management.
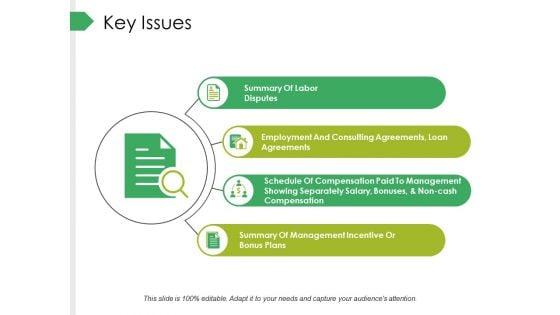
Key Issues Ppt PowerPoint Presentation Professional Design Inspiration
This is a key issues ppt powerpoint presentation professional design inspiration. This is a four stage process. The stages in this process are business, summary of labor disputes, summary of management incentive or bonus plans, employment and consulting agreements, loan agreements, marketing.
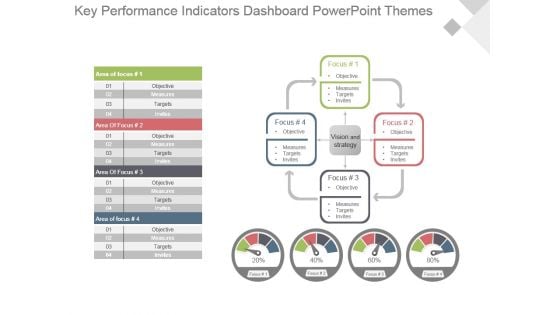
Key Performance Indicators Dashboard Powerpoint Themes
This is a key performance indicators dashboard powerpoint themes. This is a four stage process. The stages in this process are focus, objective, measures, targets, invites, vision and strategy, area of focus.
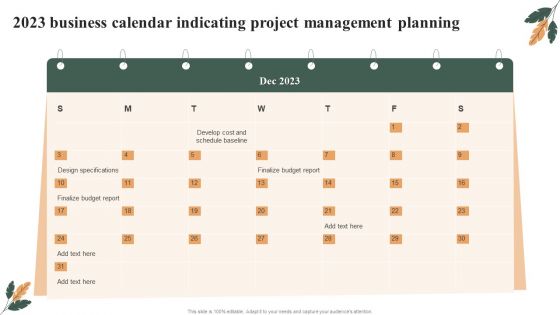
2023 Business Calendar Indicating Project Management Planning Brochure PDF
Presenting 2023 Business Calendar Indicating Project Management Planning Brochure PDF to dispense important information. This template comprises one stages. It also presents valuable insights into the topics including Design Specifications, Finalize Budget Report, Develop Cost. This is a completely customizable PowerPoint theme that can be put to use immediately. So, download it and address the topic impactfully.
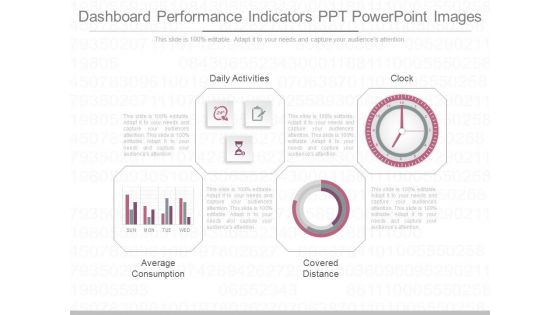
Dashboard Performance Indicators Ppt Powerpoint Images
This is a dashboard performance indicators ppt powerpoint images. This is a four stage process. The stages in this process are daily activities, average consumption, covered distance, clock.
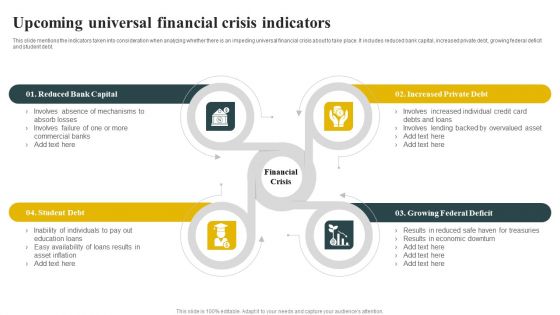
Upcoming Universal Financial Crisis Indicators Themes PDF
This slide mentions the indicators taken into consideration when analyzing whether there is an impeding universal financial crisis about to take place. It includes reduced bank capital, increased private debt, growing federal deficit and student debt. Persuade your audience using this Upcoming Universal Financial Crisis Indicators Themes PDF. This PPT design covers four stages, thus making it a great tool to use. It also caters to a variety of topics including Reduced Bank Capital, Increased Private Debt, Growing Federal Deficit, Student Debt. Download this PPT design now to present a convincing pitch that not only emphasizes the topic but also showcases your presentation skills.

Key Performance Indicators Sample Diagram Ppt Slides
This is a Key Performance Indicators Sample Diagram Ppt Slides. This is a four stage process. The stages in this process are strategize, measure, innovate, propagate.
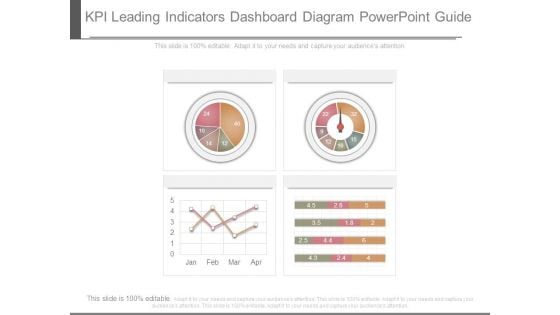
Kpi Leading Indicators Dashboard Diagram Powerpoint Guide
This is a kpi leading indicators dashboard diagram powerpoint guide. This is a four stage process. The stages in this process are business, success, process.
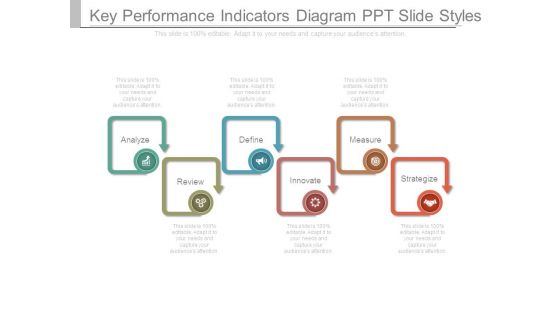
Key Performance Indicators Diagram Ppt Slide Styles
This is a key performance indicators diagram ppt slide styles. This is a six stage process. The stages in this process are analyze, define, measure, review, innovate, strategize.
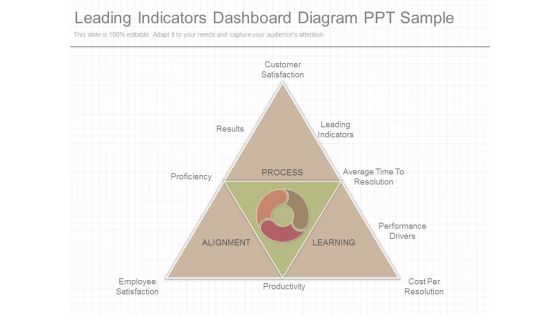
Leading Indicators Dashboard Diagram Ppt Sample
This is a leading indicators dashboard diagram ppt sample. This is a five stage process. The stages in this process are customer satisfaction, leading indicators, average time to resolution, performance drivers, cost per resolution, productivity, employee satisfaction, proficiency, results, process, learning, alignment.
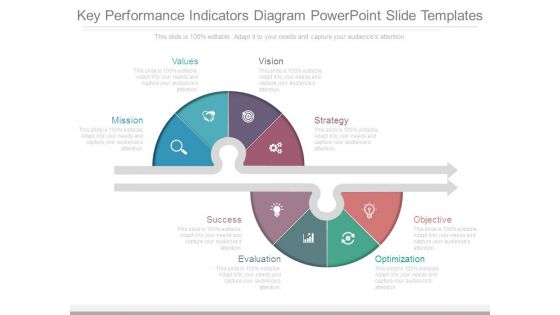
Key Performance Indicators Diagram Powerpoint Slide Templates
This is a key performance indicators diagram powerpoint slide templates. This is a eight stage process. The stages in this process are mission, values, vision, strategy, success, evaluation, optimization, objective.

Pharmaceutical Company Key Performance Indicators Clipart PDF
The slide shows the key Performance Indicator KPI s which will help the company to track the success rate of implemented strategies. Major KPIs include number of products sold, pharma products manufactures, research and development expenses per year, total number of patients, etc.Presenting pharmaceutical company key performance indicators clipart pdf to provide visual cues and insights. Share and navigate important information on one stage that need your due attention. This template can be used to pitch topics like research and development, key performance indicator, pharma products manufactured In addtion, this PPT design contains high resolution images, graphics, etc, that are easily editable and available for immediate download.
Bar Graph Showing Key Indicator Of Market Competitiveness Ppt PowerPoint Presentation Icon Example PDF
Showcasing this set of slides titled bar graph showing key indicator of market competitiveness ppt powerpoint presentation icon example pdf. The topics addressed in these templates are bar graph showing key indicator of market competitiveness. All the content presented in this PPT design is completely editable. Download it and make adjustments in color, background, font etc. as per your unique business setting.
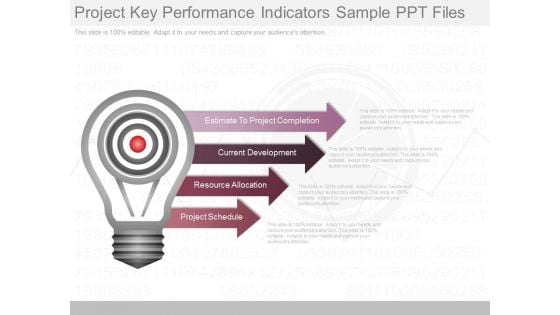
Project Key Performance Indicators Sample Ppt Files
This is a project key performance indicators sample ppt files. This is a four stage process. The stages in this process are estimate to project completion, current development, resource allocation, project schedule.
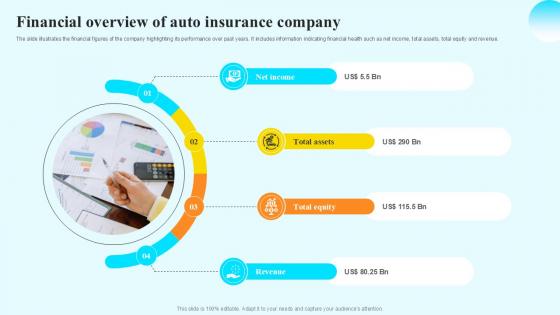
Financial Overview Of Auto Steps By Step Guide For Claiming Car PPT Sample
The slide illustrates the financial figures of the company highlighting its performance over past years. It includes information indicating financial health such as net income, total assets, total equity and revenue. If you are looking for a format to display your unique thoughts, then the professionally designed Financial Overview Of Auto Steps By Step Guide For Claiming Car PPT Sample is the one for you. You can use it as a Google Slides template or a PowerPoint template. Incorporate impressive visuals, symbols, images, and other charts. Modify or reorganize the text boxes as you desire. Experiment with shade schemes and font pairings. Alter, share or cooperate with other people on your work. Download Financial Overview Of Auto Steps By Step Guide For Claiming Car PPT Sample and find out how to give a successful presentation. Present a perfect display to your team and make your presentation unforgettable. The slide illustrates the financial figures of the company highlighting its performance over past years. It includes information indicating financial health such as net income, total assets, total equity and revenue.


 Continue with Email

 Home
Home


