Graph Icon
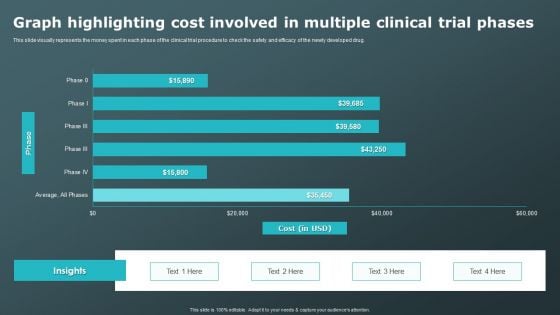
Graph Highlighting Cost Involved In Multiple Clinical Trial Phases Clinical Research Trial Phases Infographics PDF
This slide visually represents the money spent in each phase of the clinical trial procedure to check the safety and efficacy of the newly developed drug. Retrieve professionally designed Graph Highlighting Cost Involved In Multiple Clinical Trial Phases Clinical Research Trial Phases Infographics PDF to effectively convey your message and captivate your listeners. Save time by selecting pre-made slideshows that are appropriate for various topics, from business to educational purposes. These themes come in many different styles, from creative to corporate, and all of them are easily adjustable and can be edited quickly. Access them as PowerPoint templates or as Google Slides themes. You do not have to go on a hunt for the perfect presentation because Slidegeeks got you covered from everywhere.
Bar Graph And Pie Chart Global PowerPoint Templates And PowerPoint Themes 0612
Bar Graph And Pie Chart Global PowerPoint Templates And PowerPoint Themes Business PPT Templates-Bar and pie chart, background, business, success, finance, marketing Ditch the blues with our Bar Graph And Pie Chart Global PowerPoint Templates And PowerPoint Themes 0612. Your thoughts will find joy.
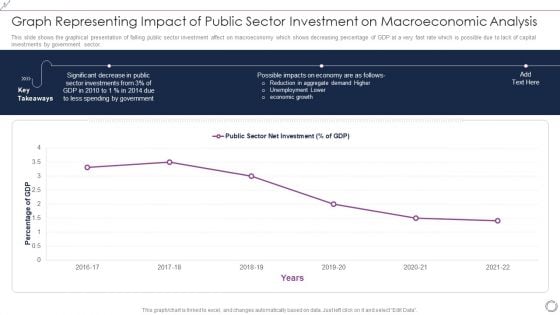
Graph Representing Impact Of Public Sector Investment On Macroeconomic Analysis Themes PDF
This slide shows the graphical presentation of falling public sector investment affect on macroeconomy which shows decreasing percentage of GDP at a very fast rate which is possible due to lack of capital investments by government sector. Showcasing this set of slides titled Graph Representing Impact Of Public Sector Investment On Macroeconomic Analysis Themes PDF. The topics addressed in these templates are Percentage GDP, 2016 to 2022, Public Sector Net Investment. All the content presented in this PPT design is completely editable. Download it and make adjustments in color, background, font etc. as per your unique business setting.
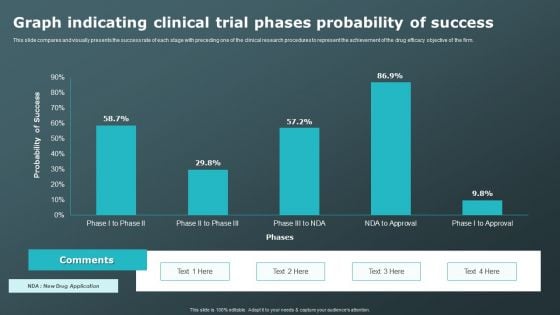
Graph Indicating Clinical Trial Phases Probability Of Success Clinical Research Trial Phases Professional PDF
This slide compares and visually presents the success rate of each stage with preceding one of the clinical research procedures to represent the achievement of the drug efficacy objective of the firm. Slidegeeks has constructed Graph Indicating Clinical Trial Phases Probability Of Success Clinical Research Trial Phases Professional PDF after conducting extensive research and examination. These presentation templates are constantly being generated and modified based on user preferences and critiques from editors. Here, you will find the most attractive templates for a range of purposes while taking into account ratings and remarks from users regarding the content. This is an excellent jumping-off point to explore our content and will give new users an insight into our top-notch PowerPoint Templates.
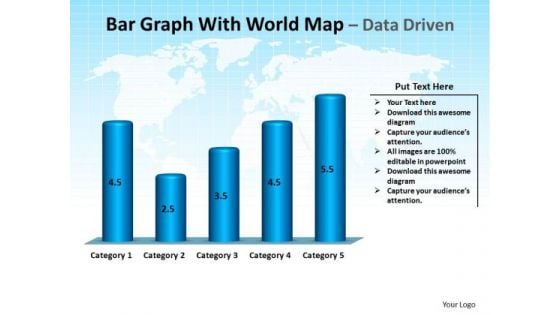
Business Success PowerPoint Templates Business Bar Graph With World Map Ppt Slides
Business Success PowerPoint Templates Business bar graph with world map PPT Slides-This PowerPoint Template is a illustration of bar garph with world map on blue background -Business Success PowerPoint Templates Business bar graph with world map PPT Slides-This ppt can be used for concepts relating to-animated, business, finance, sales, marketing, accounting, future, education, america, Antarctica, arrow, Asia, charts, statistics, budget, investment, abstract, australia, background, bar, blue, calculation, company and continents. Load up with our Business Success PowerPoint Templates Business Bar Graph With World Map Ppt Slides with our Business Success PowerPoint Templates Business Bar Graph With World Map Ppt Slides. You will be at the top of your game.
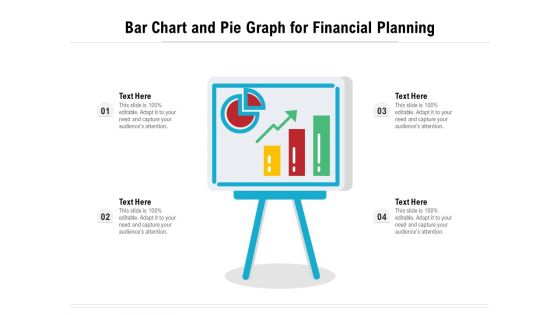
Bar Chart And Pie Graph For Financial Planning Ppt PowerPoint Presentation Infographics Graphics Example PDF
Presenting bar chart and pie graph for financial planning ppt powerpoint presentation infographics graphics example pdf. to dispense important information. This template comprises four stages. It also presents valuable insights into the topics including bar chart and pie graph for financial planning. This is a completely customizable PowerPoint theme that can be put to use immediately. So, download it and address the topic impactfully.
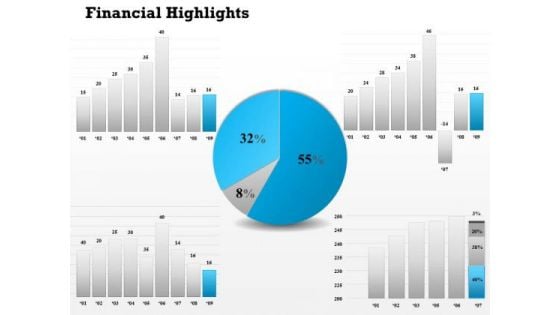
Consulting Diagram Financial Pie And Bar Graph Diagram Business Cycle Diagram
Doll Up Your Thoughts With Our Consulting Diagram Financial Pie And Bar Graph Diagram Business Cycle Diagram Powerpoint Templates. They Will Make A Pretty Picture. They Say A Dog Is Man's Best Friend. Our Consulting Diagram Financial Pie And Bar Graph Diagram Business Cycle Diagram Powerpoint Templates Come A Close Second.

Business Bar Graph Arrow Success PowerPoint Themes And PowerPoint Slides 0511
Microsoft PowerPoint Theme and Slide with a business chart/graph showing the decline of the financial money market Have the last laugh with our Business Bar Graph Arrow Success PowerPoint Themes And PowerPoint Slides 0511. Make sure your presentation gets the attention it deserves.
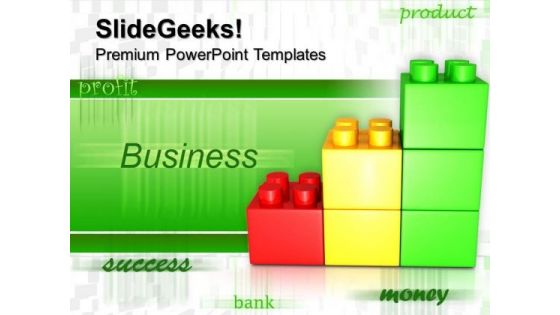
Lego Bar Graph Building Business PowerPoint Templates And PowerPoint Themes 0512
Lego Bar Graph Building Business PowerPoint Templates And PowerPoint Themes PPT designs-Microsoft Powerpoint Templates and Background with achievement chart from building blocks Develop your brand with our Lego Bar Graph Building Business PowerPoint Templates And PowerPoint Themes 0512. They will be a boon to your creativity.

Lego Bar Graph Steps Business PowerPoint Templates And PowerPoint Themes 0512
Lego Bar Graph Steps Business PowerPoint Templates And PowerPoint Themes PPT designs-Microsoft Powerpoint Templates and Background with achievement chart from building blocks Make informative presentations with our Lego Bar Graph Steps Business PowerPoint Templates And PowerPoint Themes 0512. Dont waste time struggling with PowerPoint. Let us do it for you.
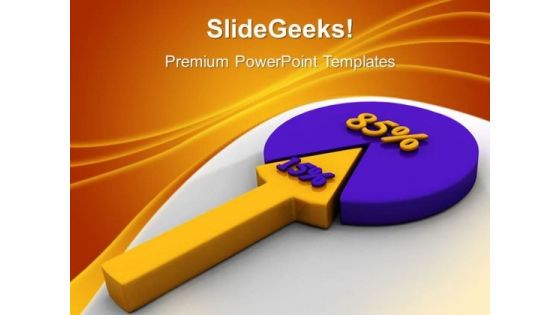
Pie Graph 15 85 Percent Business PowerPoint Templates And PowerPoint Themes 0512
Pie Graph 15 85 Percent Business PowerPoint Templates And PowerPoint Themes PPT designs-Microsoft Powerpoint Templates and Background with fifteen and eighty five percent proportion pie chart Our Pie Graph 15 85 Percent Business PowerPoint Templates And PowerPoint Themes 0512 can be very entertaining. Your audience will willingly lend you a ear.
Bar Graph And Pie Chat Business PowerPoint Templates And PowerPoint Themes 0712
Bar Graph And Pie Chat Business PowerPoint Templates And PowerPoint Themes 0712-Microsoft Powerpoint Templates and Background with bar and pie chart Alert your team to possibilities with our Bar Graph And Pie Chat Business PowerPoint Templates And PowerPoint Themes 0712. You will come out on top.
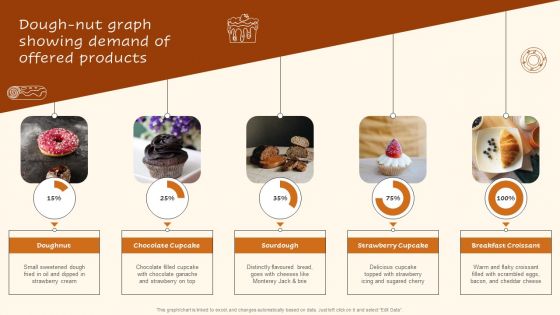
Digital Advertising Plan For Bakery Business Dough Nut Graph Showing Demand Rules PDF
Do you know about Slidesgeeks Digital Advertising Plan For Bakery Business Dough Nut Graph Showing Demand Rules PDF These are perfect for delivering any kind od presentation. Using it, create PowerPoint presentations that communicate your ideas and engage audiences. Save time and effort by using our pre designed presentation templates that are perfect for a wide range of topic. Our vast selection of designs covers a range of styles, from creative to business, and are all highly customizable and easy to edit. Download as a PowerPoint template or use them as Google Slides themes.
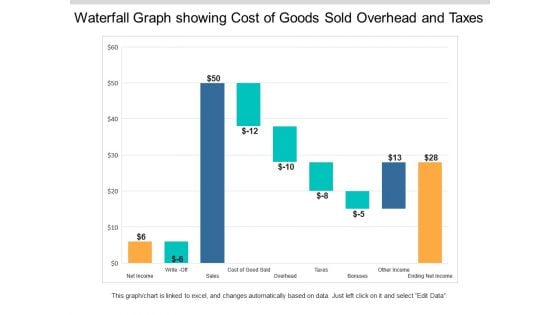
Waterfall Graph Showing Cost Of Goods Sold Overhead And Taxes Ppt PowerPoint Presentation Styles Example Topics
This is a waterfall graph showing cost of goods sold overhead and taxes ppt powerpoint presentation styles example topics. This is a three stage process. The stages in this process are profit and loss, balance sheet, income statement, benefit and loss.
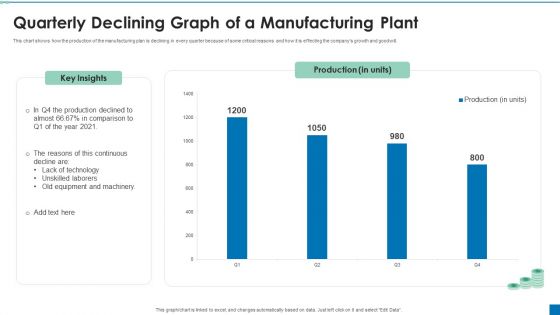
Quarterly Declining Graph Of A Manufacturing Plant Ppt PowerPoint Presentation File Example Topics PDF
This chart shows how the production of the manufacturing plan is declining in every quarter because of some critical reasons and how it is effecting the companys growth and goodwill. Showcasing this set of slides titled Quarterly Declining Graph Of A Manufacturing Plant Ppt PowerPoint Presentation File Example Topics PDF. The topics addressed in these templates are Production Declined, Lack Of Technology, Unskilled Laborers. All the content presented in this PPT design is completely editable. Download it and make adjustments in color, background, font etc. as per your unique business setting.
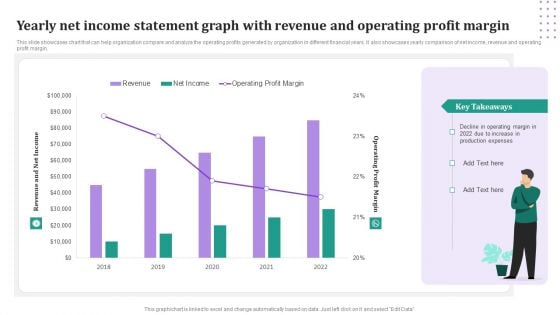
Yearly Net Income Statement Graph With Revenue And Operating Profit Margin Download PDF
This slide showcases chart that can help organization compare and analyze the operating profits generated by organization in different financial years. It also showcases yearly comparison of net income, revenue and operating profit margin. Pitch your topic with ease and precision using this Yearly Net Income Statement Graph With Revenue And Operating Profit Margin Download PDF. This layout presents information on Revenue, Net Income, Operating Profit Margin. It is also available for immediate download and adjustment. So, changes can be made in the color, design, graphics or any other component to create a unique layout.
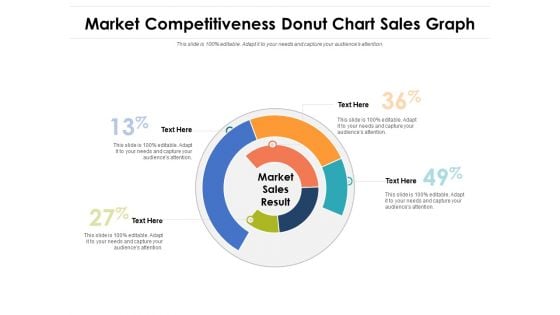
Market Competitiveness Donut Chart Sales Graph Ppt PowerPoint Presentation File Visual Aids PDF
Pitch your topic with ease and precision using this market competitiveness donut chart sales graph ppt powerpoint presentation file visual aids pdf. This layout presents information on market competitiveness donut chart sales graph. It is also available for immediate download and adjustment. So, changes can be made in the color, design, graphics or any other component to create a unique layout.
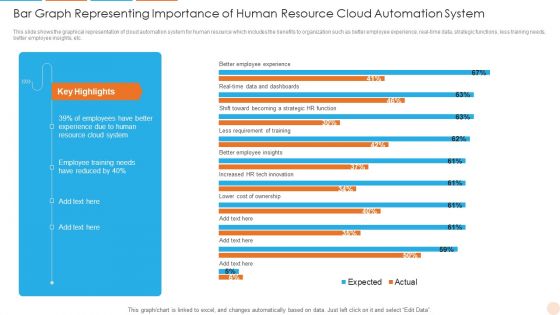
Bar Graph Representing Importance Of Human Resource Cloud Automation System Background PDF
This slide shows the graphical representation of cloud automation system for human resource which includes the benefits to organization such as better employee experience, real time data, strategic functions, less training needs, better employee insights, etc. Showcasing this set of slides titled Bar Graph Representing Importance Of Human Resource Cloud Automation System Background PDF. The topics addressed in these templates are System, Resource, Reduced. All the content presented in this PPT design is completely editable. Download it and make adjustments in color, background, font etc. as per your unique business setting.
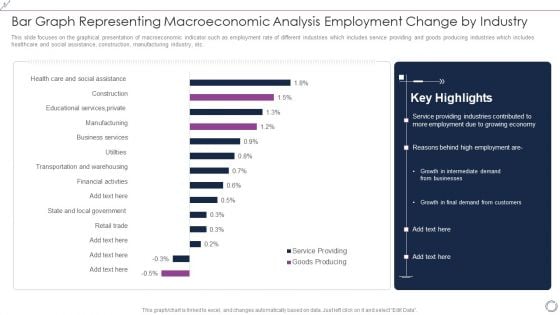
Bar Graph Representing Macroeconomic Analysis Employment Change By Industry Background PDF
This slide focuses on the graphical presentation of macroeconomic indicator such as employment rate of different industries which includes service providing and goods producing industries which includes healthcare and social assistance, construction, manufacturing industry, etc. Pitch your topic with ease and precision using this Bar Graph Representing Macroeconomic Analysis Employment Change By Industry Background PDF. This layout presents information on Goods Producing, Service Providing, Financial, Business. It is also available for immediate download and adjustment. So, changes can be made in the color, design, graphics or any other component to create a unique layout.
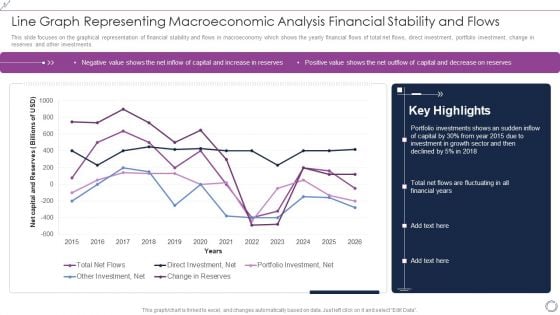
Line Graph Representing Macroeconomic Analysis Financial Stability And Flows Rules PDF
This slide focuses on the graphical representation of financial stability and flows in macroeconomy which shows the yearly financial flows of total net flows, direct investment, portfolio investment, change in reserves and other investments. Showcasing this set of slides titled Line Graph Representing Macroeconomic Analysis Financial Stability And Flows Rules PDF. The topics addressed in these templates are Total Net Flows, Direct Investment, Net, Portfolio Investment, Net. All the content presented in this PPT design is completely editable. Download it and make adjustments in color, background, font etc. as per your unique business setting.
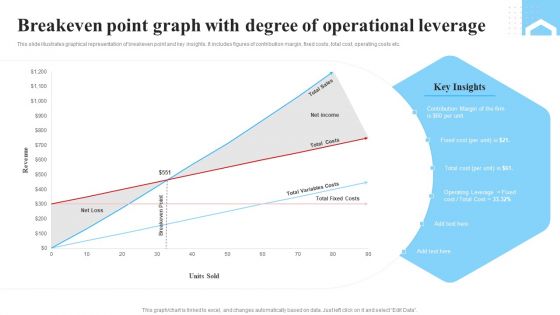
Breakeven Point Graph With Degree Of Operational Leverage Ppt Layouts Graphics Pictures PDF
This slide illustrates graphical representation of breakeven point and key insights. It includes figures of contribution margin, fixed costs, total cost, operating costs etc. Showcasing this set of slides titled Breakeven Point Graph With Degree Of Operational Leverage Ppt Layouts Graphics Pictures PDF. The topics addressed in these templates are Total Sales, Net income, Total Costs, Total Variables Costs. All the content presented in this PPT design is completely editable. Download it and make adjustments in color, background, font etc. as per your unique business setting.

6 Year Revenue Declining Graph Ppt PowerPoint Presentation Outline Sample PDF
This slide shows the revenues of the company over the last years to have a clear idea of organization growth and financial status . It includes the 6 year 2017 to 2022 revenue earned by the company.Showcasing this set of slides titled 6 Year Revenue Declining Graph Ppt PowerPoint Presentation Outline Sample PDF. The topics addressed in these templates are Revenue Company, Highest Comparison, Conditions Restrictions. All the content presented in this PPT design is completely editable. Download it and make adjustments in color, background, font etc. as per your unique business setting.
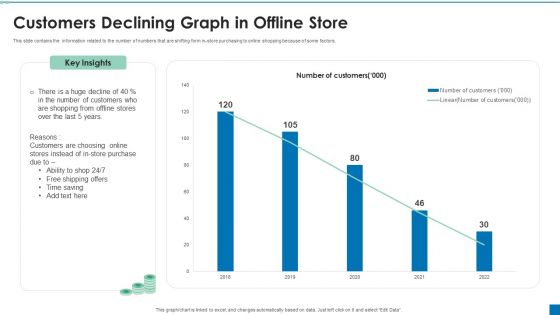
Customers Declining Graph In Offline Store Ppt PowerPoint Presentation Professional Clipart PDF
This slide contains the information related to the number of numbers that are shifting form in-store purchasing to online shopping because of some factors. Pitch your topic with ease and precision using this Customers Declining Graph In Offline Store Ppt PowerPoint Presentation Professional Clipart PDF. This layout presents information on Customers Choosing, Store Purchase, Time Saving. It is also available for immediate download and adjustment. So, changes can be made in the color, design, graphics or any other component to create a unique layout.
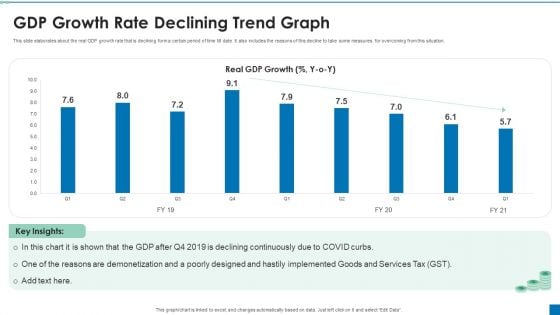
GDP Growth Rate Declining Trend Graph Ppt PowerPoint Presentation Slides Professional PDF
This slide elaborates about the real GDP growth rate that is declining form a certain period of time till date. It also includes the reasons of this decline to take some measures for overcoming from this situation. Showcasing this set of slides titled GDP Growth Rate Declining Trend Graph Ppt PowerPoint Presentation Slides Professional PDF. The topics addressed in these templates are Declining Continuously, Poorly Designed, Reasons Demonetization. All the content presented in this PPT design is completely editable. Download it and make adjustments in color, background, font etc. as per your unique business setting.
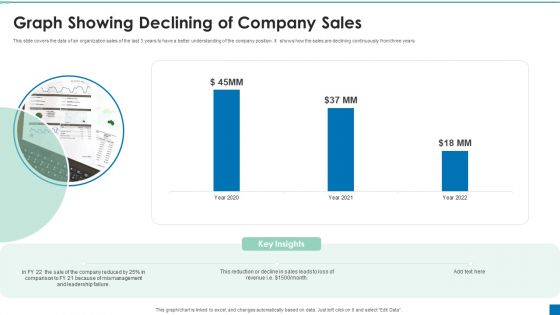
Graph Showing Declining Of Company Sales Ppt PowerPoint Presentation Portfolio Graphics Example PDF
This slide covers the data of an organization sales of the last 3 years to have a better understanding of the company position. It shows how the sales are declining continuously from three years.Pitch your topic with ease and precision using this Graph Showing Declining Of Company Sales Ppt PowerPoint Presentation Portfolio Graphics Example PDF. This layout presents information on Reduction Decline, Comparison, Mismanagement. It is also available for immediate download and adjustment. So, changes can be made in the color, design, graphics or any other component to create a unique layout.
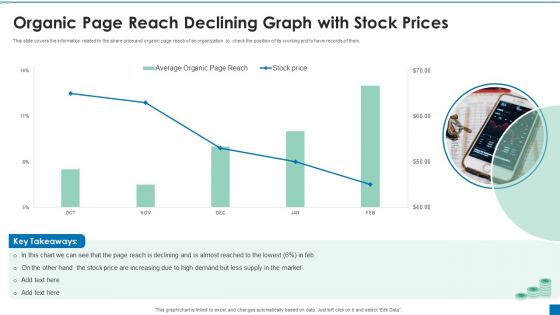
Organic Page Reach Declining Graph With Stock Prices Ppt PowerPoint Presentation Ideas Styles PDF
This slide covers the information related to the share price and organic page reach of an organization to check the position of its working and to have records of them.Pitch your topic with ease and precision using this Organic Page Reach Declining Graph With Stock Prices Ppt PowerPoint Presentation Ideas Styles PDF. This layout presents information on Increasing High, Reach Declining, Supply Market. It is also available for immediate download and adjustment. So, changes can be made in the color, design, graphics or any other component to create a unique layout.
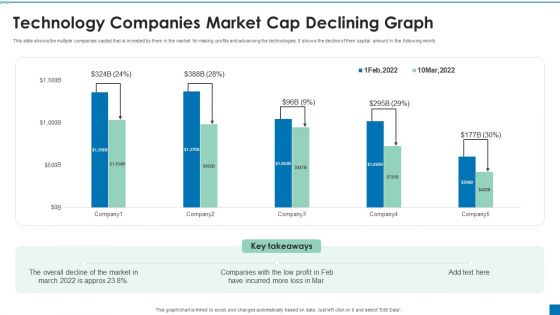
Technology Companies Market Cap Declining Graph Ppt PowerPoint Presentation File Smartart PDF
This slide shows the multiple companies capital that is invested by them in the market for making profits and advancing the technologies. It shows the decline of their capital amount in the following month. Pitch your topic with ease and precision using this Technology Companies Market Cap Declining Graph Ppt PowerPoint Presentation File Smartart PDF. This layout presents information on Overall Decline, Companies Low, Incurred Mor. It is also available for immediate download and adjustment. So, changes can be made in the color, design, graphics or any other component to create a unique layout.
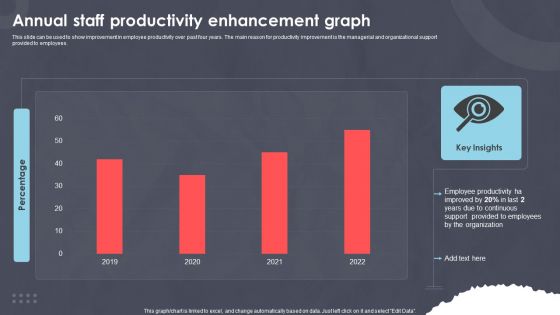
Annual Staff Productivity Enhancement Graph Ppt PowerPoint Presentation Styles Aids PDF
This slide can be used to show improvement in employee productivity over past four years. The main reason for productivity improvement is the managerial and organizational support provided to employees. Pitch your topic with ease and precision using this Annual Staff Productivity Enhancement Graph Ppt PowerPoint Presentation Styles Aids PDF. This layout presents information on Employee Productivity, Improved Last, Due Continuous. It is also available for immediate download and adjustment. So, changes can be made in the color, design, graphics or any other component to create a unique layout.
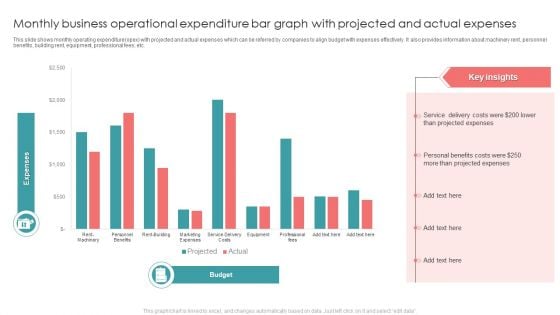
Monthly Business Operational Expenditure Bar Graph With Projected And Actual Expenses Introduction PDF
This slide shows monthly operating expenditure opex with projected and actual expenses which can be referred by companies to align budget with expenses effectively. It also provides information about machinery rent, personnel benefits, building rent, equipment, professional fees, etc. Pitch your topic with ease and precision using this Monthly Business Operational Expenditure Bar Graph With Projected And Actual Expenses Introduction PDF. This layout presents information on Projected Expenses, Costs, Service. It is also available for immediate download and adjustment. So, changes can be made in the color, design, graphics or any other component to create a unique layout.
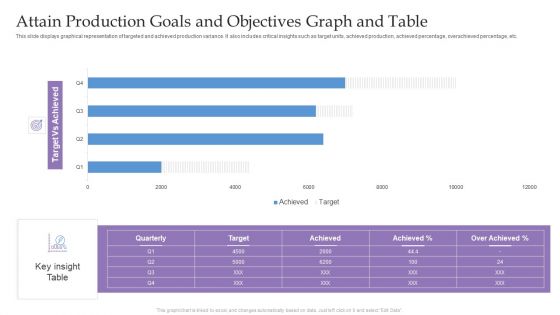
Attain Production Goals And Objectives Graph And Table Ppt Infographic Template Visuals PDF
This slide displays graphical representation of targeted and achieved production variance. It also includes critical insights such as target units, achieved production, achieved percentage, overachieved percentage, etc. Pitch your topic with ease and precision using this Attain Production Goals And Objectives Graph And Table Ppt Infographic Template Visuals PDF. This layout presents information on Target Vs Achieved, Key insight Table, Quarterly. It is also available for immediate download and adjustment. So, changes can be made in the color, design, graphics or any other component to create a unique layout.

Financial Planning And Examination Plan For Small And Large Enterprises Bar Graph Elements PDF
Slidegeeks is here to make your presentations a breeze with Financial Planning And Examination Plan For Small And Large Enterprises Bar Graph Elements PDF With our easy to use and customizable templates, you can focus on delivering your ideas rather than worrying about formatting. With a variety of designs to choose from, you are sure to find one that suits your needs. And with animations and unique photos, illustrations, and fonts, you can make your presentation pop. So whether you are giving a sales pitch or presenting to the board, make sure to check out Slidegeeks first.
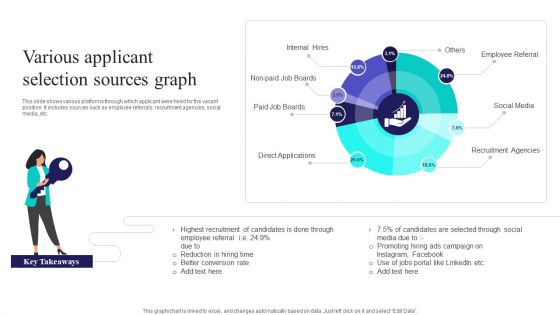
Various Applicant Selection Sources Graph Ppt PowerPoint Presentation Gallery Slide Download PDF
This slide shows various platforms through which applicant were hired for the vacant position. It includes sources such as employee referrals, recruitment agencies, social media, etc. Pitch your topic with ease and precision using this Various Applicant Selection Sources Graph Ppt PowerPoint Presentation Gallery Slide Download PDF. This layout presents information on Internal Hires, Paid Job Boards, Direct Applications. It is also available for immediate download and adjustment. So, changes can be made in the color, design, graphics or any other component to create a unique layout.
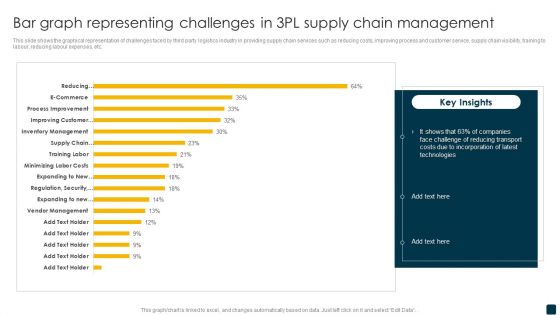
Bar Graph Representing Challenges In 3 PL Supply Chain Management Slides PDF
This slide shows the graphical representation of challenges faced by third party logistics industry in providing supply chain services such as reducing costs, improving process and customer service, supply chain visibility, training to labour, reducing labour expenses, etc. Showcasing this set of slides titled Bar Graph Representing Challenges In 3 PL Supply Chain Management Slides PDF. The topics addressed in these templates are Reducing Transport Costs, Technologies. All the content presented in this PPT design is completely editable. Download it and make adjustments in color, background, font etc. as per your unique business setting.
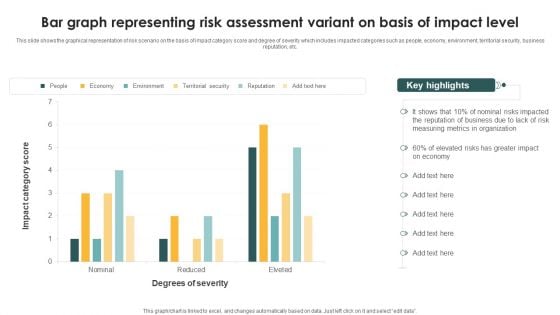
Bar Graph Representing Risk Assessment Variant On Basis Of Impact Level Topics PDF
This slide shows the graphical representation of risk scenario on the basis of impact category score and degree of severity which includes impacted categories such as people, economy, environment, territorial security, business reputation, etc. Showcasing this set of slides titled Bar Graph Representing Risk Assessment Variant On Basis Of Impact Level Topics PDF. The topics addressed in these templates are Measuring Metrics, Organization, Greater Impact. All the content presented in this PPT design is completely editable. Download it and make adjustments in color, background, font etc. as per your unique business setting.
Multiple Projects Progress Tracking Report Tracking Report With Bar Graph Information PDF
This slide shows the status report of various projects in order to help the project manager to track their performance. It includes project names, no.of tasks, start and end date, days taken for completion, progress and remaining percentage of projects.Showcasing this set of slides titled Multiple Projects Progress Tracking Report Tracking Report With Bar Graph Information PDF. The topics addressed in these templates are Multiple Projects, Progress Tracking, Report Tracking Report. All the content presented in this PPT design is completely editable. Download it and make adjustments in color, background, font etc. as per your unique business setting.
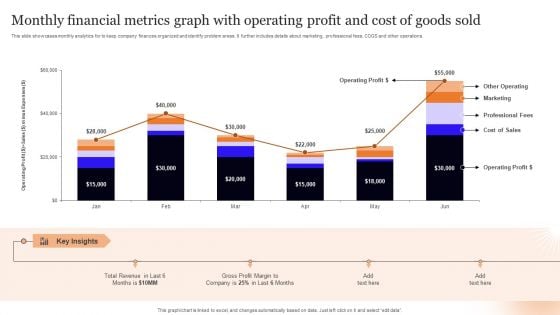
Monthly Financial Metrics Graph With Operating Profit And Cost Of Goods Sold Pictures PDF
This slide showcases monthly analytics for to keep company finances organized and identify problem areas. It further includes details about marketing, professional fees, COGS and other operations. Pitch your topic with ease and precision using this Monthly Financial Metrics Graph With Operating Profit And Cost Of Goods Sold Pictures PDF. This layout presents information on Key Insights, Operating Profit, Total Revenue. It is also available for immediate download and adjustment. So, changes can be made in the color, design, graphics or any other component to create a unique layout.
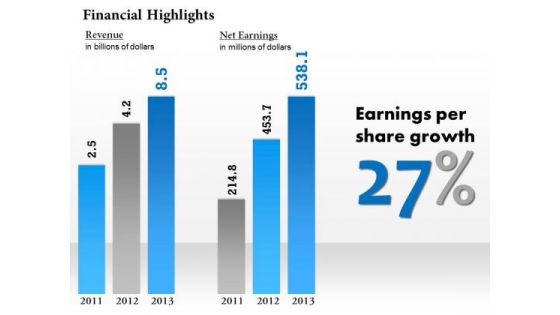
Sales Diagram Financial Result Display Bar Graph Diagram Business Framework Model
Our Sales Diagram Financial Result Display Bar Graph Diagram Business Framework Model Powerpoint Templates Deliver At Your Doorstep. Let Them In For A Wonderful Experience. Dig Out The Dope With Our Sales Diagram Financial Result Display Bar Graph Diagram Business Framework Model Powerpoint Templates. Your Thoughts Will Expose The Truth.
Bar Graph On Target01 Finance PowerPoint Templates And PowerPoint Themes 0512
Microsoft Powerpoint Templates and Background with achieving business targets-Bar Graph On Target01 Finance PowerPoint Templates And PowerPoint Themes 0512-These PowerPoint designs and slide layouts can be used for themes relating to -Achieving Business Targets, marketing, success, sales, finance, business Be an outperforming market competititor with our Bar Graph On Target01 Finance PowerPoint Templates And PowerPoint Themes 0512. They will make you look good.

Bar Graph With Person01 Success PowerPoint Templates And PowerPoint Themes 0512
Microsoft Powerpoint Templates and Background with success-Bar Graph With Person01 Success PowerPoint Templates And PowerPoint Themes 0512-These PowerPoint designs and slide layouts can be used for themes relating to -Success, business, shapes, marketing, sales, finance, shapes Play by the book with our Bar Graph With Person01 Success PowerPoint Templates And PowerPoint Themes 0512. They advocate a fair and square approach.

Successful Person And Bar Graph Business PowerPoint Templates And PowerPoint Themes 0512
Microsoft Powerpoint Templates and Background with success-Successful Person And Bar Graph Business PowerPoint Templates And PowerPoint Themes 0512-These PowerPoint designs and slide layouts can be used for themes relating to -Success, business, shapes, marketing, sales, finance Our Successful Person And Bar Graph Business PowerPoint Templates And PowerPoint Themes 0512 see it through your eyes. They agree with the basis of your assessment.
Bar Graph On Target01 Business PowerPoint Templates And PowerPoint Themes 0512
Microsoft Powerpoint Templates and Background with achieving business targets-These templates can be used for presentations relating to-Achieving Business Targets, marketing, success, sales, finance, business-Bar Graph On Target01 Business PowerPoint Templates And PowerPoint Themes 0512 Be absolutely professional with our Bar Graph On Target01 Business PowerPoint Templates And PowerPoint Themes 0512. Dont pass up this opportunity to shine.

Colored Bar Graph With Person Business PowerPoint Templates And PowerPoint Themes 0512
Microsoft Powerpoint Templates and Background with success-These templates can be used for presentations relating to-Success, business, shapes, marketing, sales, finance, shapes-Colored Bar Graph With Person Business PowerPoint Templates And PowerPoint Themes 0512 Our Colored Bar Graph With Person Business PowerPoint Templates And PowerPoint Themes 0512 save time creating a mind blowing presentation. With our money back guarantee you have nothing to lose.
Oil Barrel With Finance Graph Business PowerPoint Templates And PowerPoint Themes 0812
Oil Barrel With Finance Graph Business PowerPoint Templates And PowerPoint Themes 0812-Microsoft Powerpoint Templates and Background with oil barrels Our Oil Barrel With Finance Graph Business PowerPoint Templates And PowerPoint Themes 0812 afford a distinct approach. Your thoughts will acquire a different character.
Graph With Success Arrow Finance PowerPoint Templates And PowerPoint Themes 0912
Graph With Success Arrow Finance PowerPoint Templates And PowerPoint Themes 0912-Microsoft Powerpoint Templates and Background with business success with arrow-Business success with arrow, finance, marketing, business, arrows, success Recieve compliments with our Graph With Success Arrow Finance PowerPoint Templates And PowerPoint Themes 0912. The audience will eulogise you.

College Teacher Giving Lecture With Graph Ppt PowerPoint Presentation Themes PDF
Presenting this set of slides with name college teacher giving lecture with graph ppt powerpoint presentation themes pdf. This is a one stage process. The stage in this process is college teacher giving lecture with graph. This is a completely editable PowerPoint presentation and is available for immediate download. Download now and impress your audience.
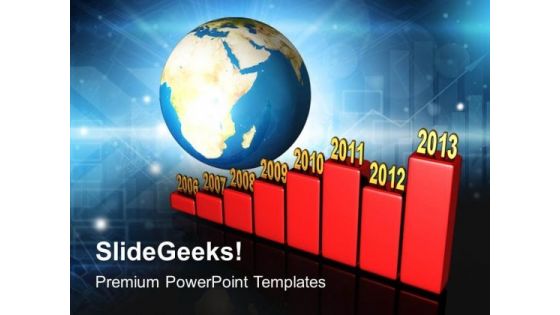
Bar Graph Yearly Along Earth PowerPoint Templates And PowerPoint Themes 1012
Bar Graph Yearly Along Earth PowerPoint Templates And PowerPoint Themes 1012-This PowerPoint Template shows the Annual growth Chart from 2006 to 2013 in the Graphical manner. It imitates the concept of Money, Business, Profit, Loss etc. Use this Template for Increasing and decreasing Bar Graph. Clarity of thought has been the key to your growth. Use our templates to illustrate your ability-Bar Graph Yearly Along Earth PowerPoint Templates And PowerPoint Themes 1012-This PowerPoint template can be used for presentations relating to-Bar graph showing the growth of profits, business, finance, success, earth, globe Our Bar Graph Yearly Along Earth PowerPoint Templates And PowerPoint Themes 1012 will blow your ideas. They will fan out across the audience.
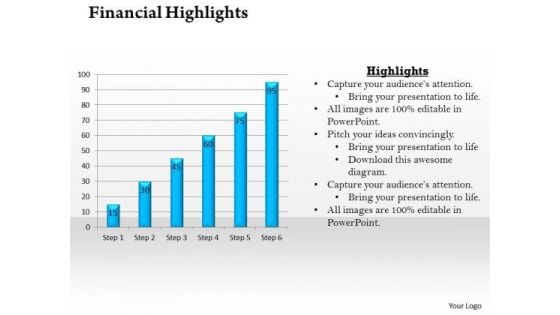
Strategic Management Bar Graph For Business And Financial Growth Business Diagram
Connect The Dots With Our Strategic Management Bar Graph For Business And Financial Growth Business Diagram Powerpoint Templates. Watch The Whole Picture Clearly Emerge. Dot Your Thoughts With Our Strategic Management Bar Graph For Business And Financial Growth Business Diagram Powerpoint Templates. Give Your Demeanor That Propel Look.

Man Run Up On Graph Business PowerPoint Templates And PowerPoint Backgrounds 0511
Microsoft PowerPoint Template and Background with man moving up on graph chart business growth success finances diagram improvement Give your thoughts the right exposure. Exhibit them with elan on our Man Run Up On Graph Business PowerPoint Templates And PowerPoint Backgrounds 0511.
E Business Graph Progress Presentation Success PowerPoint Templates And PowerPoint Themes 1012
E Business Graph Progress Presentation Success PowerPoint Templates And PowerPoint Themes 1012-Visually support your Microsoft office PPT Presentation with our above template illustrating a pc with profit growth bar graph. It is a useful captivating tool conceived to enable you to define your message in your Marketing PPT presentations. Our PPT images are so ideally designed that it reveals the very basis of our PPT template to make your clients understand. The ideas and plans are on your finger tips. Now imprint them on the minds of your audience via our slides.-E Business Graph Progress Presentation Success PowerPoint Templates And PowerPoint Themes 1012-This PowerPoint template can be used for presentations relating to-Business graph with arrow, technology, computer, business, success, arrows Give affirmative advice with our E Business Graph Progress Presentation Success PowerPoint Templates And PowerPoint Themes 1012. Get your audience to act correctly.
Group Of Pencils Forming Graph PowerPoint Templates And PowerPoint Themes 1012
Group Of Pencils Forming Graph PowerPoint Templates And PowerPoint Themes 1012-Use this PowerPoint Template to illustrate the business concept. This Template shows group of pencils forming bar graph symbolizing growth and success. The ideas and plans are on your fingertips. Now imprint them on the minds of your audience via our slides. This image has been conceived to enable you to emphatically communicate your ideas in your Marketing and Business PPT presentations.-Group Of Pencils Forming Graph PowerPoint Templates And PowerPoint Themes 1012-This PowerPoint template can be used for presentations relating to-Pencils forming a graph, business, education, children, shapes, success Exhibit your talent with our Group Of Pencils Forming Graph PowerPoint Templates And PowerPoint Themes 1012. Let the audience see your dexterity.
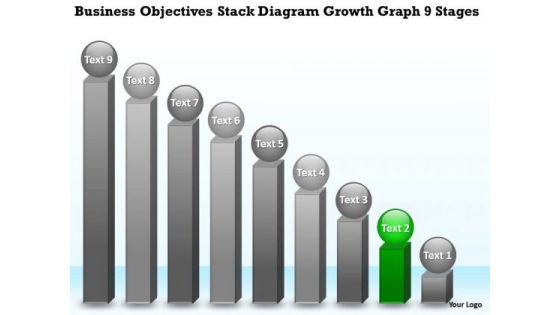
Stack Diagram Growth Graph 9 Stages Small Business Plan PowerPoint Templates
We present our stack diagram growth graph 9 stages small business plan PowerPoint templates.Download our Circle Charts PowerPoint Templates because Our PowerPoint Templates and Slides provide you with a vast range of viable options. Select the appropriate ones and just fill in your text. Download our Process and Flows PowerPoint Templates because It will Give impetus to the hopes of your colleagues. Our PowerPoint Templates and Slides will aid you in winning their trust. Present our Business PowerPoint Templates because Our PowerPoint Templates and Slides will let you Clearly mark the path for others to follow. Present our Success PowerPoint Templates because You can Be the star of the show with our PowerPoint Templates and Slides. Rock the stage with your ideas. Use our Marketing PowerPoint Templates because These PowerPoint Templates and Slides will give the updraft to your ideas. See them soar to great heights with ease.Use these PowerPoint slides for presentations relating to achievement, analyst, analyzing, arrow, aspirations, bar, bull, business, calculating, concepts, currency, development, diagram, dollar, factor, finance, financial, future, graph, graphic, growth, height, horizontal, illustration, improvement, investment, making, marketing, measuring, money, number, positivity, price, progress, savings, sign. The prominent colors used in the PowerPoint template are Green, Gray, Black. Exploit the ability of our Stack Diagram Growth Graph 9 Stages Small Business Plan PowerPoint Templates. They have many a useful attribute.
Bar Graph With Globe Business PowerPoint Templates And PowerPoint Backgrounds 1211
Microsoft PowerPoint Template and Background with a rising chart graph predicts global worldwide growth with a globe as symbol of success Enhance growth with our Bar Graph With Globe Business PowerPoint Templates And PowerPoint Backgrounds 1211. Download without worries with our money back guaranteee.
Tracking Progress Of Project Management Tasks Ppt PowerPoint Presentation Diagram Graph Charts PDF
The following slide illustrates task management tool for tracking project status. It provides information about requirements, coding, development, knowledge, user acceptance testing, standup meeting, etc. Welcome to our selection of the Tracking Progress Of Project Management Tasks Ppt PowerPoint Presentation Diagram Graph Charts PDF. These are designed to help you showcase your creativity and bring your sphere to life. Planning and Innovation are essential for any business that is just starting out. This collection contains the designs that you need for your everyday presentations. All of our PowerPoints are 100 percent editable, so you can customize them to suit your needs. This multi purpose template can be used in various situations. Grab these presentation templates today.
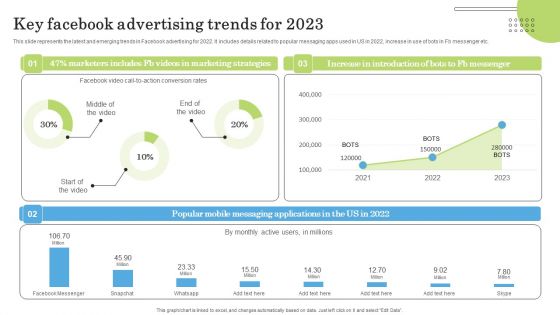
Key Facebook Advertising Trends For 2023 Ppt PowerPoint Presentation Diagram Graph Charts PDF
This slide represents the latest and emerging trends in Facebook advertising for 2022. It includes details related to popular messaging apps used in US in 2022, increase in use of bots in Fb messenger etc. Welcome to our selection of the Key Facebook Advertising Trends For 2023 Ppt PowerPoint Presentation Diagram Graph Charts PDF. These are designed to help you showcase your creativity and bring your sphere to life. Planning and Innovation are essential for any business that is just starting out. This collection contains the designs that you need for your everyday presentations. All of our PowerPoints are 100 percent editable, so you can customize them to suit your needs. This multi purpose template can be used in various situations. Grab these presentation templates today.
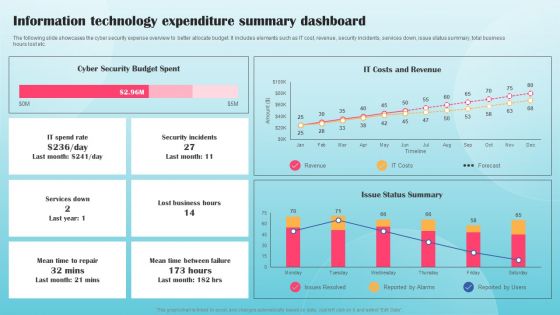
Information Technology Expenditure Summary Dashboard Ppt PowerPoint Presentation Diagram Graph Charts PDF
The following slide showcases the cyber security expense overview to better allocate budget. It includes elements such as IT cost, revenue, security incidents, services down, issue status summary, total business hours lost etc. This Information Technology Expenditure Summary Dashboard Ppt PowerPoint Presentation Diagram Graph Charts PDF from Slidegeeks makes it easy to present information on your topic with precision. It provides customization options, so you can make changes to the colors, design, graphics, or any other component to create a unique layout. It is also available for immediate download, so you can begin using it right away. Slidegeeks has done good research to ensure that you have everything you need to make your presentation stand out. Make a name out there for a brilliant performance.
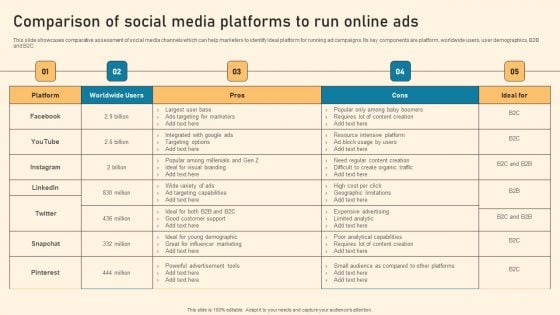
Comparison Of Social Media Platforms To Run Online Ads Ppt PowerPoint Presentation Diagram Graph Charts PDF
This slide showcases comparative assessment of social media channels which can help marketers to identify ideal platform for running ad campaigns. Its key components are platform, worldwide users, user demographics, B2B and B2C Slidegeeks is here to make your presentations a breeze with Comparison Of Social Media Platforms To Run Online Ads Ppt PowerPoint Presentation Diagram Graph Charts PDF With our easy to use and customizable templates, you can focus on delivering your ideas rather than worrying about formatting. With a variety of designs to choose from, you are sure to find one that suits your needs. And with animations and unique photos, illustrations, and fonts, you can make your presentation pop. So whether you are giving a sales pitch or presenting to the board, make sure to check out Slidegeeks first.
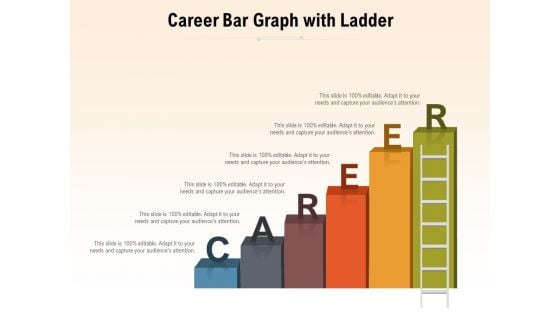
Career Bar Graph With Ladder Ppt PowerPoint Presentation File Infographics PDF
Presenting career bar graph with ladder ppt powerpoint presentation file infographics pdf to dispense important information. This template comprises six stages. It also presents valuable insights into the topics including career bar graph with ladder. This is a completely customizable PowerPoint theme that can be put to use immediately. So, download it and address the topic impactfully.

Vector Showing Career Growth Graph Of Businessman Ppt PowerPoint Presentation File Background Designs PDF
Presenting vector showing career growth graph of businessman ppt powerpoint presentation file background designs pdf to dispense important information. This template comprises three stages. It also presents valuable insights into the topics including vector showing career growth graph of businessman. This is a completely customizable PowerPoint theme that can be put to use immediately. So, download it and address the topic impactfully.
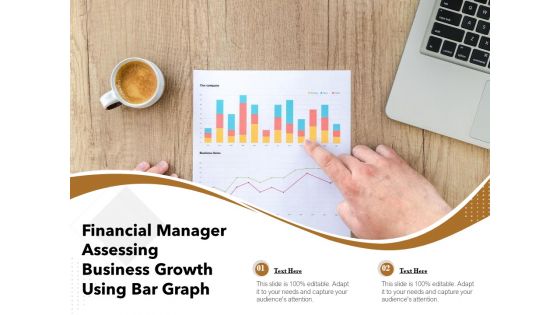
Financial Manager Assessing Business Growth Using Bar Graph Ppt PowerPoint Presentation Gallery Graphics PDF
Presenting financial manager assessing business growth using bar graph ppt powerpoint presentation gallery graphics pdf to dispense important information. This template comprises two stages. It also presents valuable insights into the topics including financial manager assessing business growth using bar graph. This is a completely customizable PowerPoint theme that can be put to use immediately. So, download it and address the topic impactfully.
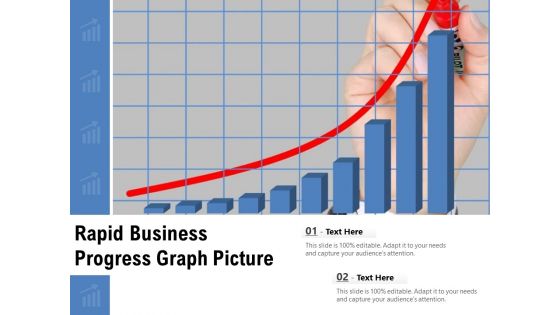
Rapid Business Progress Graph Picture Ppt PowerPoint Presentation Gallery File Formats PDF
Presenting rapid business progress graph picture ppt powerpoint presentation gallery file formats pdf to dispense important information. This template comprises two stages. It also presents valuable insights into the topics including rapid business progress graph picture. This is a completely customizable PowerPoint theme that can be put to use immediately. So, download it and address the topic impactfully.


 Continue with Email

 Home
Home


