Graph Icon
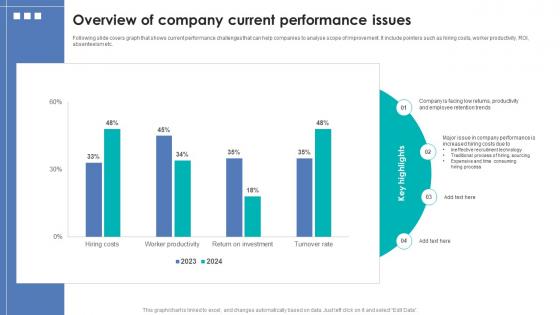
Integrating Automation For Effective Business Overview Of Company Current Performance Issues
Following slide covers graph that shows current performance challenges that can help companies to analyse scope of improvement. It include pointers such as hiring costs, worker productivity, ROI, absenteeism etc. Explore a selection of the finest Integrating Automation For Effective Business Overview Of Company Current Performance Issues here. With a plethora of professionally designed and pre-made slide templates, you can quickly and easily find the right one for your upcoming presentation. You can use our Integrating Automation For Effective Business Overview Of Company Current Performance Issues to effectively convey your message to a wider audience. Slidegeeks has done a lot of research before preparing these presentation templates. The content can be personalized and the slides are highly editable. Grab templates today from Slidegeeks. Following slide covers graph that shows current performance challenges that can help companies to analyse scope of improvement. It include pointers such as hiring costs, worker productivity, ROI, absenteeism etc.
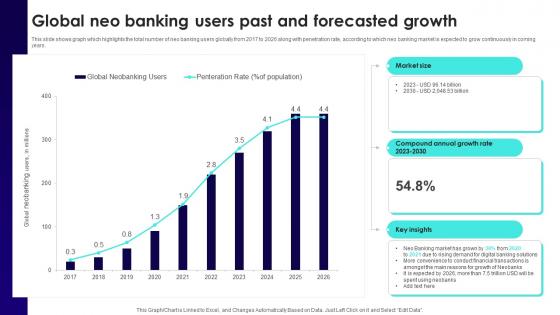
Wireless Banking To Improve Global Neo Banking Users Past And Forecasted Fin SS V
This slide shows graph which highlights the total number of neo banking users globally from 2017 to 2026 along with penetration rate, according to which neo banking market is expected to grow continuously in coming years. Slidegeeks has constructed Wireless Banking To Improve Global Neo Banking Users Past And Forecasted Fin SS V after conducting extensive research and examination. These presentation templates are constantly being generated and modified based on user preferences and critiques from editors. Here, you will find the most attractive templates for a range of purposes while taking into account ratings and remarks from users regarding the content. This is an excellent jumping-off point to explore our content and will give new users an insight into our top-notch PowerPoint Templates. This slide shows graph which highlights the total number of neo banking users globally from 2017 to 2026 along with penetration rate, according to which neo banking market is expected to grow continuously in coming years.
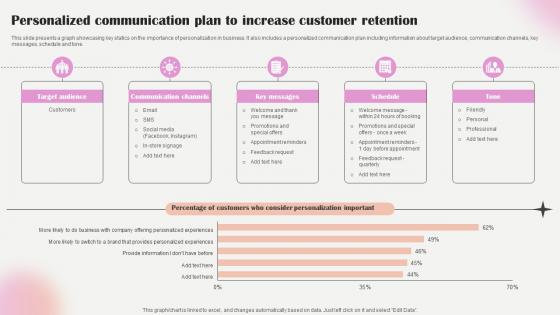
Salon Marketing Plan To Optimize Personalized Communication Plan To Increase Strategy SS V
This slide presents a graph showcasing key statics on the importance of personalization in business. It also includes a personalized communication plan including information about target audience, communication channels, key messages, schedule and tone. Crafting an eye-catching presentation has never been more straightforward. Let your presentation shine with this tasteful yet straightforward Salon Marketing Plan To Optimize Personalized Communication Plan To Increase Strategy SS V template. It offers a minimalistic and classy look that is great for making a statement. The colors have been employed intelligently to add a bit of playfulness while still remaining professional. Construct the ideal Salon Marketing Plan To Optimize Personalized Communication Plan To Increase Strategy SS V that effortlessly grabs the attention of your audience Begin now and be certain to wow your customers This slide presents a graph showcasing key statics on the importance of personalization in business. It also includes a personalized communication plan including information about target audience, communication channels, key messages, schedule and tone.
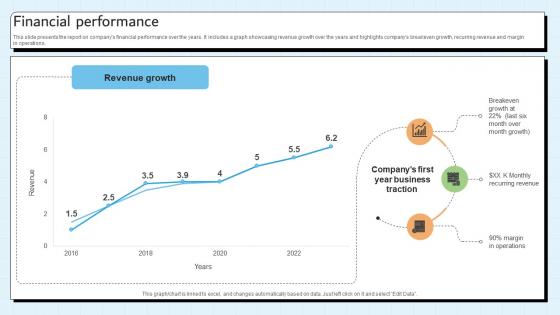
Financial Performance Customer Relationship Management Platform Pitch Deck
This slide presents the report on companys financial performance over the years. It includes a graph showcasing revenue growth over the years and highlights companys breakeven growth, recurring revenue and margin in operations. Present like a pro with Financial Performance Customer Relationship Management Platform Pitch Deck. Create beautiful presentations together with your team, using our easy-to-use presentation slides. Share your ideas in real-time and make changes on the fly by downloading our templates. So whether you are in the office, on the go, or in a remote location, you can stay in sync with your team and present your ideas with confidence. With Slidegeeks presentation got a whole lot easier. Grab these presentations today. This slide presents the report on companys financial performance over the years. It includes a graph showcasing revenue growth over the years and highlights companys breakeven growth, recurring revenue and margin in operations.
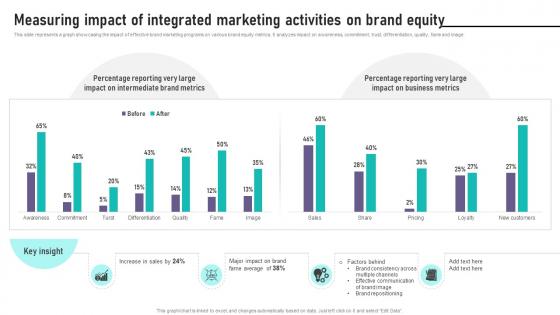
Brand Equity Management To Raise Measuring Impact Of Integrated Marketing Activities
This slide represents a graph showcasing the impact of effective brand marketing programs on various brand equity metrics. It analyzes impact on awareness, commitment, trust, differentiation, quality, fame and image. Boost your pitch with our creative Brand Equity Management To Raise Measuring Impact Of Integrated Marketing Activities. Deliver an awe-inspiring pitch that will mesmerize everyone. Using these presentation templates you will surely catch everyones attention. You can browse the ppts collection on our website. We have researchers who are experts at creating the right content for the templates. So you do not have to invest time in any additional work. Just grab the template now and use them. This slide represents a graph showcasing the impact of effective brand marketing programs on various brand equity metrics. It analyzes impact on awareness, commitment, trust, differentiation, quality, fame and image.

Increasing Business Awareness Introducing Social Media Marketing For Creating Strategy SS V
This slide presents an overview of social media marketing. It also include a graph showcasing the associated benefits of social media for insurers such as marketing, customer service, new sales leads, fraud detection and risk selection. Take your projects to the next level with our ultimate collection of Increasing Business Awareness Introducing Social Media Marketing For Creating Strategy SS V. Slidegeeks has designed a range of layouts that are perfect for representing task or activity duration, keeping track of all your deadlines at a glance. Tailor these designs to your exact needs and give them a truly corporate look with your own brand colors they will make your projects stand out from the rest This slide presents an overview of social media marketing. It also include a graph showcasing the associated benefits of social media for insurers such as marketing, customer service, new sales leads, fraud detection and risk selection
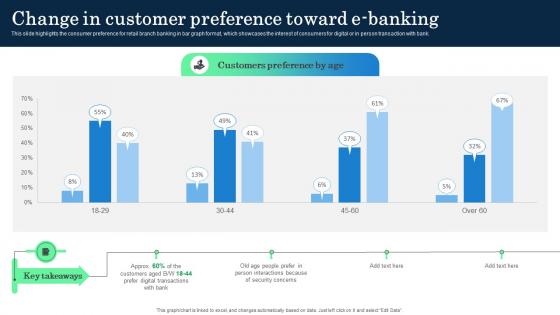
Change In Customer Preference Toward E Banking Incorporating Banking Operational Growth
This slide highlights the consumer preference for retail branch banking in bar graph format, which showcases the interest of consumers for digital or in person transaction with bank. Slidegeeks is here to make your presentations a breeze with Change In Customer Preference Toward E Banking Incorporating Banking Operational Growth With our easy-to-use and customizable templates, you can focus on delivering your ideas rather than worrying about formatting. With a variety of designs to choose from, you are sure to find one that suits your needs. And with animations and unique photos, illustrations, and fonts, you can make your presentation pop. So whether you are giving a sales pitch or presenting to the board, make sure to check out Slidegeeks first This slide highlights the consumer preference for retail branch banking in bar graph format, which showcases the interest of consumers for digital or in person transaction with bank.
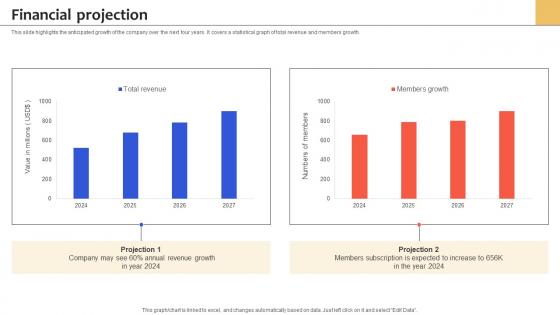
Financial Projection Health Insurance Services Management Platform Pitch Deck
This slide highlights the anticipated growth of the company over the next four years. It covers a statistical graph of total revenue and members growth. Slidegeeks is here to make your presentations a breeze with Financial Projection Health Insurance Services Management Platform Pitch Deck With our easy-to-use and customizable templates, you can focus on delivering your ideas rather than worrying about formatting. With a variety of designs to choose from, you are sure to find one that suits your needs. And with animations and unique photos, illustrations, and fonts, you can make your presentation pop. So whether you are giving a sales pitch or presenting to the board, make sure to check out Slidegeeks first This slide highlights the anticipated growth of the company over the next four years. It covers a statistical graph of total revenue and members growth.
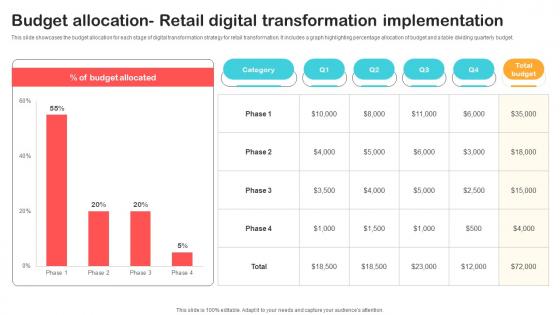
Budget Allocation Retail Digital Transformation Optimizing Retail Operations With Digital DT SS V
This slide showcases the budget allocation for each stage of digital transformation strategy for retail transformation. It includes a graph highlighting percentage allocation of budget and a table dividing quarterly budget.From laying roadmaps to briefing everything in detail, our templates are perfect for you. You can set the stage with your presentation slides. All you have to do is download these easy-to-edit and customizable templates. Budget Allocation Retail Digital Transformation Optimizing Retail Operations With Digital DT SS V will help you deliver an outstanding performance that everyone would remember and praise you for. Do download this presentation today. This slide showcases the budget allocation for each stage of digital transformation strategy for retail transformation. It includes a graph highlighting percentage allocation of budget and a table dividing quarterly budget.

Budget Allocation Retail Digital Transformation Implementation DT SS V
This slide showcases the budget allocation for each stage of digital transformation strategy for retail transformation. It includes a graph highlighting percentage allocation of budget and a table dividing quarterly budget.From laying roadmaps to briefing everything in detail, our templates are perfect for you. You can set the stage with your presentation slides. All you have to do is download these easy-to-edit and customizable templates. Budget Allocation Retail Digital Transformation Implementation DT SS V will help you deliver an outstanding performance that everyone would remember and praise you for. Do download this presentation today. This slide showcases the budget allocation for each stage of digital transformation strategy for retail transformation. It includes a graph highlighting percentage allocation of budget and a table dividing quarterly budget.
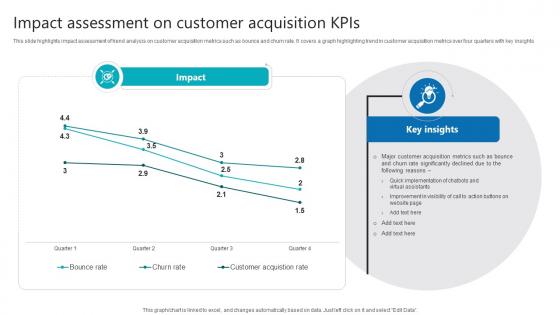
Impact Assessment On Customer Acquisition Kpis Product Analytics Implementation Data Analytics V
This slide highlights impact assessment of trend analysis on customer acquisition metrics such as bounce and churn rate. It covers a graph highlighting trend in customer acquisition metrics over four quarters with key insights The Impact Assessment On Customer Acquisition Kpis Product Analytics Implementation Data Analytics V is a compilation of the most recent design trends as a series of slides. It is suitable for any subject or industry presentation, containing attractive visuals and photo spots for businesses to clearly express their messages. This template contains a variety of slides for the user to input data, such as structures to contrast two elements, bullet points, and slides for written information. Slidegeeks is prepared to create an impression. This slide highlights impact assessment of trend analysis on customer acquisition metrics such as bounce and churn rate. It covers a graph highlighting trend in customer acquisition metrics over four quarters with key insights
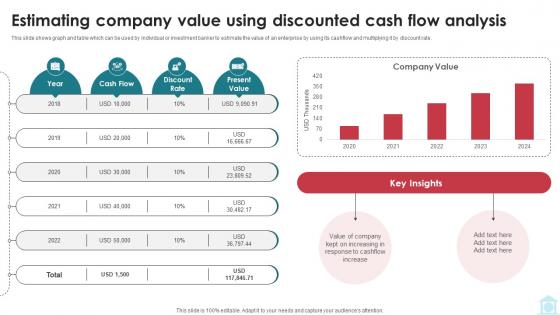
Estimating Company Value Using Discounted Cash Mastering Investment Banking Fin SS V
This slide shows graph and table which can be used by individual or investment banker to estimate the value of an enterprise by using its cashflow and multiplying it by discount rate. Coming up with a presentation necessitates that the majority of the effort goes into the content and the message you intend to convey. The visuals of a PowerPoint presentation can only be effective if it supplements and supports the story that is being told. Keeping this in mind our experts created Estimating Company Value Using Discounted Cash Mastering Investment Banking Fin SS V to reduce the time that goes into designing the presentation. This way, you can concentrate on the message while our designers take care of providing you with the right template for the situation. This slide shows graph and table which can be used by individual or investment banker to estimate the value of an enterprise by using its cashflow and multiplying it by discount rate.
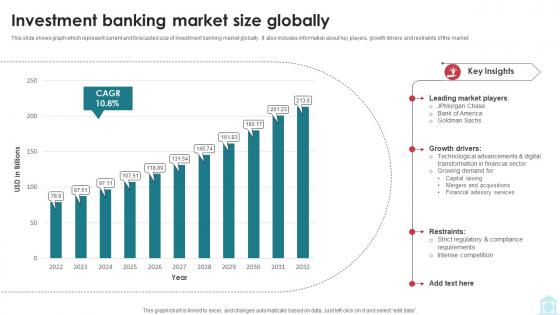
Investment Banking Market Size Globally Mastering Investment Banking Fin SS V
This slide shows graph which represent current and forecasted size of investment banking market globally . It also includes information about key players, growth drivers and restraints of the market. Explore a selection of the finest Investment Banking Market Size Globally Mastering Investment Banking Fin SS V here. With a plethora of professionally designed and pre-made slide templates, you can quickly and easily find the right one for your upcoming presentation. You can use our Investment Banking Market Size Globally Mastering Investment Banking Fin SS V to effectively convey your message to a wider audience. Slidegeeks has done a lot of research before preparing these presentation templates. The content can be personalized and the slides are highly editable. Grab templates today from Slidegeeks. This slide shows graph which represent current and forecasted size of investment banking market globally . It also includes information about key players, growth drivers and restraints of the market.

Estimating Company Value Using Investment Banking Simplified Functions Fin SS V
This slide shows graph and table which can be used by individual or investment banker to estimate the value of an enterprise by using its cashflow and multiplying it by discount rate. Coming up with a presentation necessitates that the majority of the effort goes into the content and the message you intend to convey. The visuals of a PowerPoint presentation can only be effective if it supplements and supports the story that is being told. Keeping this in mind our experts created Estimating Company Value Using Investment Banking Simplified Functions Fin SS V to reduce the time that goes into designing the presentation. This way, you can concentrate on the message while our designers take care of providing you with the right template for the situation. This slide shows graph and table which can be used by individual or investment banker to estimate the value of an enterprise by using its cashflow and multiplying it by discount rate.

Investment Banking Market Size Globally Investment Banking Simplified Functions Fin SS V
This slide shows graph which represent current and forecasted size of investment banking market globally . It also includes information about key players, growth drivers and restraints of the market. Explore a selection of the finest Investment Banking Market Size Globally Investment Banking Simplified Functions Fin SS V here. With a plethora of professionally designed and pre-made slide templates, you can quickly and easily find the right one for your upcoming presentation. You can use our Investment Banking Market Size Globally Investment Banking Simplified Functions Fin SS V to effectively convey your message to a wider audience. Slidegeeks has done a lot of research before preparing these presentation templates. The content can be personalized and the slides are highly editable. Grab templates today from Slidegeeks. This slide shows graph which represent current and forecasted size of investment banking market globally . It also includes information about key players, growth drivers and restraints of the market.
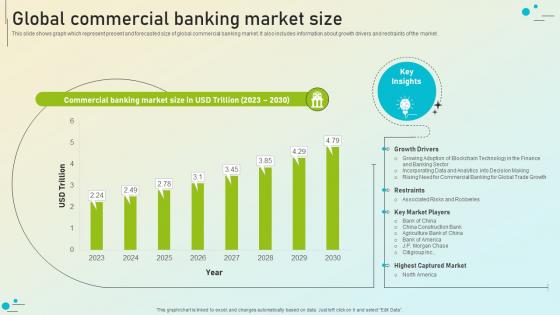
Beginners Guide To Commercial Global Commercial Banking Market Size Fin SS V
This slide shows graph which represent present and forecasted size of global commercial banking market. It also includes information about growth drivers and restraints of the market. The Beginners Guide To Commercial Global Commercial Banking Market Size Fin SS V is a compilation of the most recent design trends as a series of slides. It is suitable for any subject or industry presentation, containing attractive visuals and photo spots for businesses to clearly express their messages. This template contains a variety of slides for the user to input data, such as structures to contrast two elements, bullet points, and slides for written information. Slidegeeks is prepared to create an impression. This slide shows graph which represent present and forecasted size of global commercial banking market. It also includes information about growth drivers and restraints of the market.
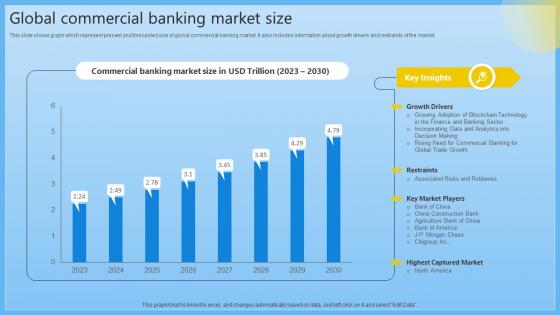
Global Commercial Banking Market Size Complete Guide On Managing Banking Fin SS V
This slide shows graph which represent present and forecasted size of global commercial banking market. It also includes information about growth drivers and restraints of the market. Explore a selection of the finest Global Commercial Banking Market Size Complete Guide On Managing Banking Fin SS V here. With a plethora of professionally designed and pre-made slide templates, you can quickly and easily find the right one for your upcoming presentation. You can use our Global Commercial Banking Market Size Complete Guide On Managing Banking Fin SS V to effectively convey your message to a wider audience. Slidegeeks has done a lot of research before preparing these presentation templates. The content can be personalized and the slides are highly editable. Grab templates today from Slidegeeks. This slide shows graph which represent present and forecasted size of global commercial banking market. It also includes information about growth drivers and restraints of the market.
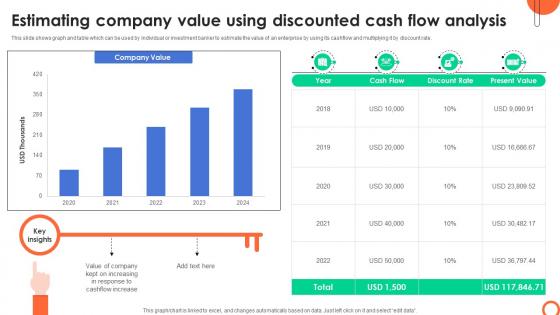
Estimating Company Value Using Discounted Understanding Investment Banking Framework Fin SS V
This slide shows graph and table which can be used by individual or investment banker to estimate the value of an enterprise by using its cashflow and multiplying it by discount rate. Coming up with a presentation necessitates that the majority of the effort goes into the content and the message you intend to convey. The visuals of a PowerPoint presentation can only be effective if it supplements and supports the story that is being told. Keeping this in mind our experts created Estimating Company Value Using Discounted Understanding Investment Banking Framework Fin SS V to reduce the time that goes into designing the presentation. This way, you can concentrate on the message while our designers take care of providing you with the right template for the situation. This slide shows graph and table which can be used by individual or investment banker to estimate the value of an enterprise by using its cashflow and multiplying it by discount rate.
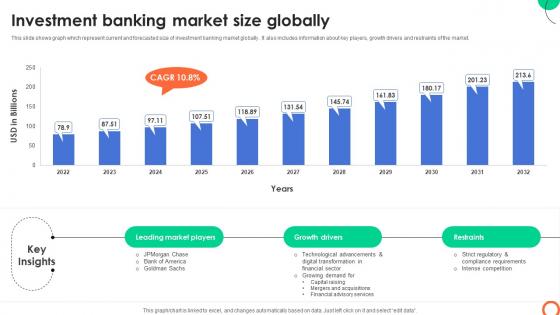
Investment Banking Market Size Globally Understanding Investment Banking Framework Fin SS V
This slide shows graph which represent current and forecasted size of investment banking market globally . It also includes information about key players, growth drivers and restraints of the market. Explore a selection of the finest Investment Banking Market Size Globally Understanding Investment Banking Framework Fin SS V here. With a plethora of professionally designed and pre-made slide templates, you can quickly and easily find the right one for your upcoming presentation. You can use our Investment Banking Market Size Globally Understanding Investment Banking Framework Fin SS V to effectively convey your message to a wider audience. Slidegeeks has done a lot of research before preparing these presentation templates. The content can be personalized and the slides are highly editable. Grab templates today from Slidegeeks. This slide shows graph which represent current and forecasted size of investment banking market globally . It also includes information about key players, growth drivers and restraints of the market.

Client Support Plan To Increase Customer Service Channel Preferences By Generation Strategy SS V
This slide shows graph which can be used by organizations to get understanding regarding the channels preferred by different generations. These generations are baby boomers, gen x and millennials. The best PPT templates are a great way to save time, energy, and resources. Slidegeeks have 100 percent editable powerpoint slides making them incredibly versatile. With these quality presentation templates, you can create a captivating and memorable presentation by combining visually appealing slides and effectively communicating your message. Download Client Support Plan To Increase Customer Service Channel Preferences By Generation Strategy SS V from Slidegeeks and deliver a wonderful presentation. This slide shows graph which can be used by organizations to get understanding regarding the channels preferred by different generations. These generations are baby boomers, gen x and millennials.
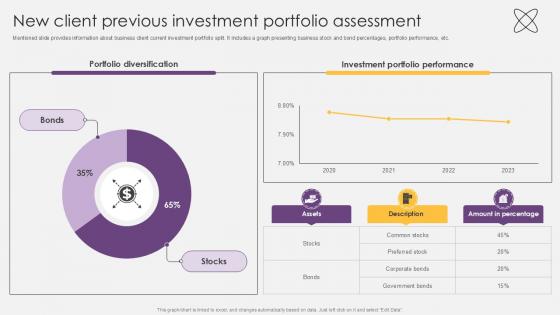
New Client Previous Investment Portfolio Assessment Investment Fund PPT Example
Mentioned slide provides information about business client current investment portfolio split.It includes a graph presenting business stock and bond percentages, portfolio performance, etc. This New Client Previous Investment Portfolio Assessment Investment Fund PPT Example from Slidegeeks makes it easy to present information on your topic with precision. It provides customization options, so you can make changes to the colors, design, graphics, or any other component to create a unique layout. It is also available for immediate download, so you can begin using it right away. Slidegeeks has done good research to ensure that you have everything you need to make your presentation stand out. Make a name out there for a brilliant performance. Mentioned slide provides information about business client current investment portfolio split.It includes a graph presenting business stock and bond percentages, portfolio performance, etc.

Market Potential Property Listings Platform Pitch Deck PPT Sample
This slide presents a line graph showcasing the real estate platform market potential in Latin America. It also highlights market opportunities by highlighting market size forecast, CAGR, active user numbers in Latin America. Are you in need of a template that can accommodate all of your creative concepts This one is crafted professionally and can be altered to fit any style. Use it with Google Slides or PowerPoint. Include striking photographs, symbols, depictions, and other visuals. Fill, move around, or remove text boxes as desired. Test out color palettes and font mixtures. Edit and save your work, or work with colleagues. Download Market Potential Property Listings Platform Pitch Deck PPT Sample and observe how to make your presentation outstanding. Give an impeccable presentation to your group and make your presentation unforgettable. This slide presents a line graph showcasing the real estate platform market potential in Latin America.It also highlights market opportunities by highlighting market size forecast, CAGR, active user numbers in Latin America.
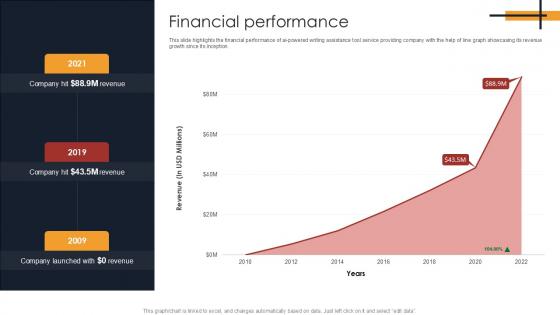
Financial Performance Writing Enhancement Software Pitch Deck PPT Example
This slide highlights the financial performance of ai powered writing assistance tool service providing company with the help of line graph showcasing its revenue growth since its inception. Find a pre designed and impeccable Financial Performance Writing Enhancement Software Pitch Deck PPT Example. The templates can ace your presentation without additional effort. You can download these easy to edit presentation templates to make your presentation stand out from others. So, what are you waiting for Download the template from Slidegeeks today and give a unique touch to your presentation. This slide highlights the financial performance of ai powered writing assistance tool service providing company with the help of line graph showcasing its revenue growth since its inception.
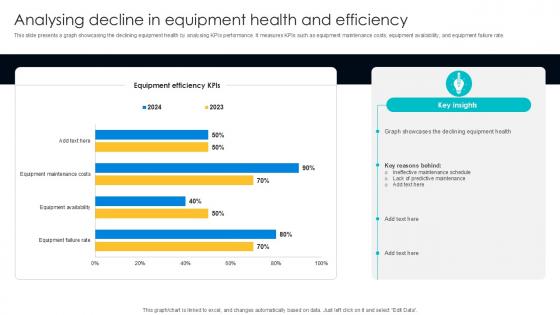
Analysing Decline In Equipment Digital Transformation Journey PPT Sample DT SS V
This slide presents a graph showcasing the declining equipment health by analysing KPIs performance. It measures KPIs such as equipment maintenance costs, equipment availability, and equipment failure rate. Slidegeeks is one of the best resources for PowerPoint templates. You can download easily and regulate Analysing Decline In Equipment Digital Transformation Journey PPT Sample DT SS V for your personal presentations from our wonderful collection. A few clicks is all it takes to discover and get the most relevant and appropriate templates. Use our Templates to add a unique zing and appeal to your presentation and meetings. All the slides are easy to edit and you can use them even for advertisement purposes. This slide presents a graph showcasing the declining equipment health by analysing KPIs performance. It measures KPIs such as equipment maintenance costs, equipment availability, and equipment failure rate.
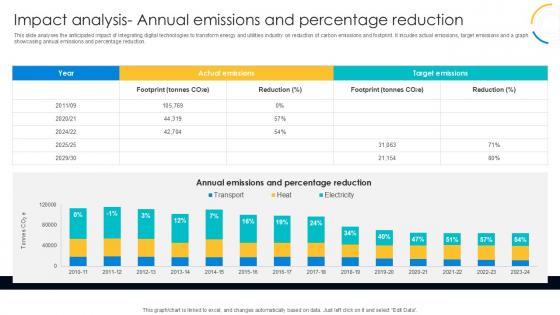
Impact Analysis Annual Emissions Digital Transformation Journey PPT Template DT SS V
This slide analyses the anticipated impact of integrating digital technologies to transform energy and utilities industry on reduction of carbon emissions and footprint. It incudes actual emissions, target emissions and a graph showcasing annual emissions and percentage reduction. The best PPT templates are a great way to save time, energy, and resources. Slidegeeks have 100 percent editable powerpoint slides making them incredibly versatile. With these quality presentation templates, you can create a captivating and memorable presentation by combining visually appealing slides and effectively communicating your message. Download Impact Analysis Annual Emissions Digital Transformation Journey PPT Template DT SS V from Slidegeeks and deliver a wonderful presentation. This slide analyses the anticipated impact of integrating digital technologies to transform energy and utilities industry on reduction of carbon emissions and footprint. It incudes actual emissions, target emissions and a graph showcasing annual emissions and percentage reduction.
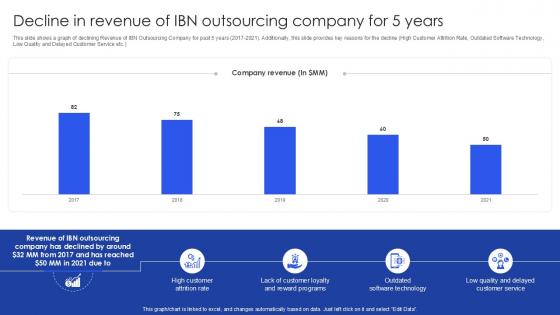
Decline In Revenue Of IBN Outsourcing Company For 5 Years PPT Example SS
This slide shows a graph of declining Revenue of IBN Outsourcing Company for past 5 years 2017-2021. Additionally, this slide provides key reasons for the decline High Customer Attrition Rate, Outdated Software Technology, Low Quality and Delayed Customer Service etc. From laying roadmaps to briefing everything in detail, our templates are perfect for you. You can set the stage with your presentation slides. All you have to do is download these easy-to-edit and customizable templates. Decline In Revenue Of IBN Outsourcing Company For 5 Years PPT Example SS will help you deliver an outstanding performance that everyone would remember and praise you for. Do download this presentation today. This slide shows a graph of declining Revenue of IBN Outsourcing Company for past 5 years 2017-2021. Additionally, this slide provides key reasons for the decline High Customer Attrition Rate, Outdated Software Technology, Low Quality and Delayed Customer Service etc.
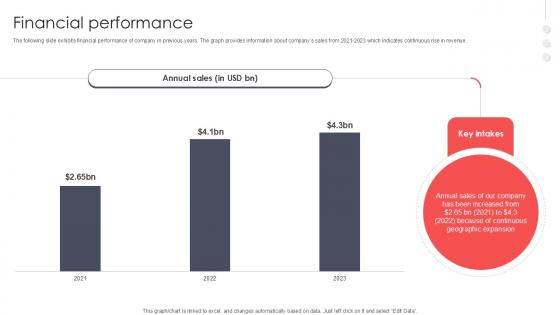
Financial Performance Virtual Meeting Investor Funding Elevator Pitch Deck PPT PowerPoint
The following slide exhibits financial performance of company in previous years. The graph provides information about companys sales from 2021-2023 which indicates continuous rise in revenue. From laying roadmaps to briefing everything in detail, our templates are perfect for you. You can set the stage with your presentation slides. All you have to do is download these easy-to-edit and customizable templates. Financial Performance Virtual Meeting Investor Funding Elevator Pitch Deck PPT PowerPoint will help you deliver an outstanding performance that everyone would remember and praise you for. Do download this presentation today. The following slide exhibits financial performance of company in previous years. The graph provides information about companys sales from 2021-2023 which indicates continuous rise in revenue.
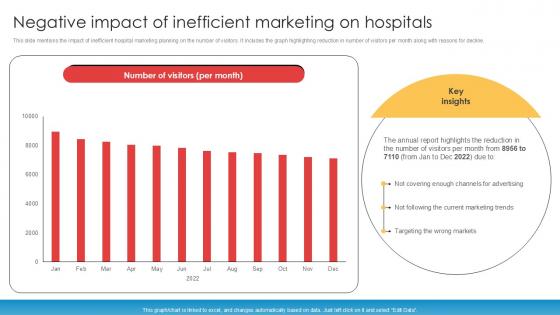
Negative Impact Of Inefficient Marketing On Implementation Of Online Ppt Example
This slide mentions the impact of inefficient hospital marketing planning on the number of visitors. It includes the graph highlighting reduction in number of visitors per month along with reasons for decline. Do you have to make sure that everyone on your team knows about any specific topic I yes, then you should give Negative Impact Of Inefficient Marketing On Implementation Of Online Ppt Example a try. Our experts have put a lot of knowledge and effort into creating this impeccable Negative Impact Of Inefficient Marketing On Implementation Of Online Ppt Example. You can use this template for your upcoming presentations, as the slides are perfect to represent even the tiniest detail. You can download these templates from the Slidegeeks website and these are easy to edit. So grab these today This slide mentions the impact of inefficient hospital marketing planning on the number of visitors. It includes the graph highlighting reduction in number of visitors per month along with reasons for decline.
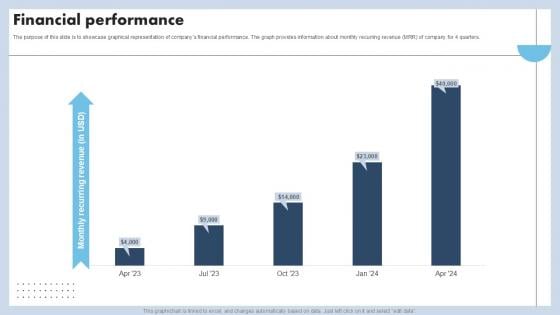
Financial Performance Capital Raising Pitch Deck For Advertising Services PPT Sample
The purpose of this slide is to showcase graphical representation of companys financial performance. The graph provides information about monthly recurring revenue MRR of company for 4 quarters. From laying roadmaps to briefing everything in detail, our templates are perfect for you. You can set the stage with your presentation slides. All you have to do is download these easy-to-edit and customizable templates. Financial Performance Capital Raising Pitch Deck For Advertising Services PPT Sample will help you deliver an outstanding performance that everyone would remember and praise you for. Do download this presentation today. The purpose of this slide is to showcase graphical representation of companys financial performance. The graph provides information about monthly recurring revenue MRR of company for 4 quarters.
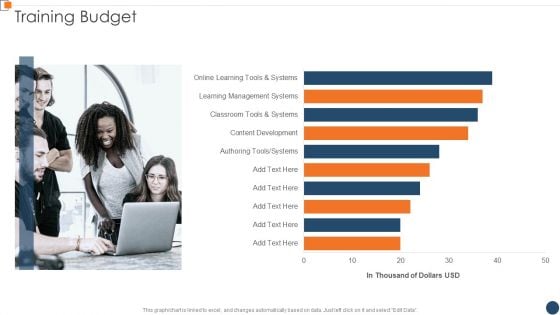
BANT Sales Lead Qualification Model Training Budget Template PDF
This graph or chart is linked to excel and change automatically based on data. Just left click on it and select Edit Data. Deliver an awe inspiring pitch with this creative BANT Sales Lead Qualification Model Training Budget Template PDF bundle. Topics like Content Development, Learning Management, Online Learning can be discussed with this completely editable template. It is available for immediate download depending on the needs and requirements of the user.
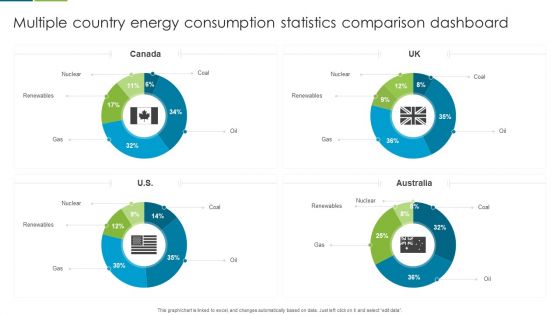
Multiple Country Energy Consumption Statistics Comparison Dashboard Formats PDF
This graph or chart is linked to excel, and changes automatically based on data. Just left click on it and select edit data. Pitch your topic with ease and precision using this Multiple Country Energy Consumption Statistics Comparison Dashboard Formats PDF. This layout presents information on Nuclear, Renewables, Gas. It is also available for immediate download and adjustment. So, changes can be made in the color, design, graphics or any other component to create a unique layout.
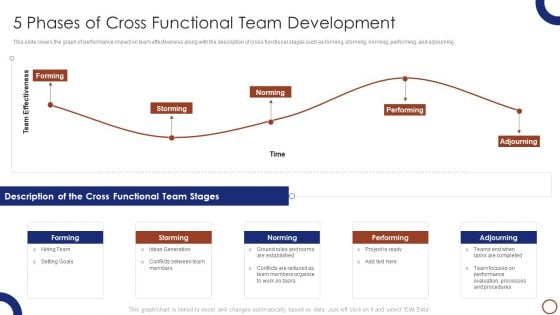
Teams Collaboration 5 Phases Of Cross Functional Team Development Introduction PDF
This slide covers the graph of performance impact on team effectiveness along with the description of cross functional stages such as forming, storming, norming, performing, and adjourning.Deliver and pitch your topic in the best possible manner with this Teams Collaboration 5 Phases Of Cross Functional Team Development Introduction PDF. Use them to share invaluable insights on Ground Rules, Project Is Ready, Tasks Are Completed and impress your audience. This template can be altered and modified as per your expectations. So, grab it now.
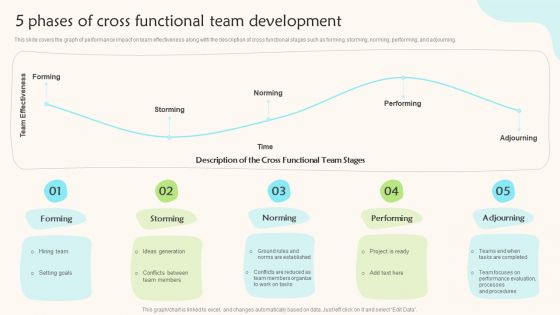
5 Phases Of Cross Functional Team Development Teams Working Towards A Shared Objective Microsoft PDF
This slide covers the graph of performance impact on team effectiveness along with the description of cross functional stages such as forming, storming, norming, performing, and adjourning.Deliver an awe inspiring pitch with this creative 5 Phases Of Cross Functional Team Development Teams Working Towards A Shared Objective Microsoft PDF bundle. Topics like Storming, Norming, Performing can be discussed with this completely editable template. It is available for immediate download depending on the needs and requirements of the user.
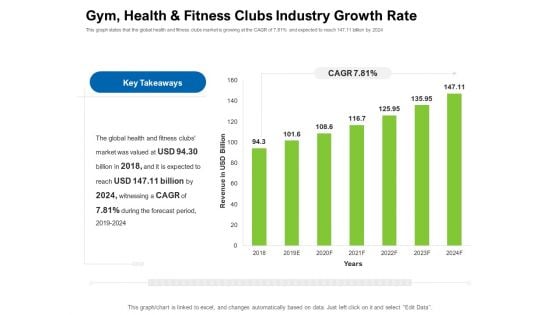
Strategies To Enter Physical Fitness Club Business Gym Health And Fitness Clubs Industry Growth Rate Summary PDF
This graph states that the global health and fitness clubs market is growing at the CAGR of 7.81 percent and expected to reach 147.11 billion by 2024. Deliver an awe inspiring pitch with this creative strategies to enter physical fitness club business gym health and fitness clubs industry growth rate summary pdf bundle. Topics like global, health, market, revenue can be discussed with this completely editable template. It is available for immediate download depending on the needs and requirements of the user.
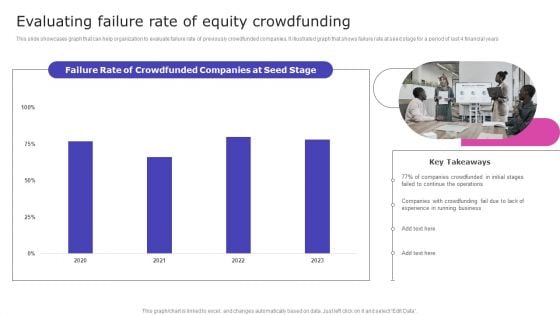
Strategic Fund Acquisition Plan For Business Opertions Expansion Evaluating Failure Rate Of Equity Crowdfunding Information PDF
This slide showcases graph that can help organization to evaluate failure rate of previously crowdfunded companies. It illustrated graph that shows failure rate at seed stage for a period of last 4 financial years. Slidegeeks is one of the best resources for PowerPoint templates. You can download easily and regulate Strategic Fund Acquisition Plan For Business Opertions Expansion Evaluating Failure Rate Of Equity Crowdfunding Information PDF for your personal presentations from our wonderful collection. A few clicks is all it takes to discover and get the most relevant and appropriate templates. Use our Templates to add a unique zing and appeal to your presentation and meetings. All the slides are easy to edit and you can use them even for advertisement purposes.
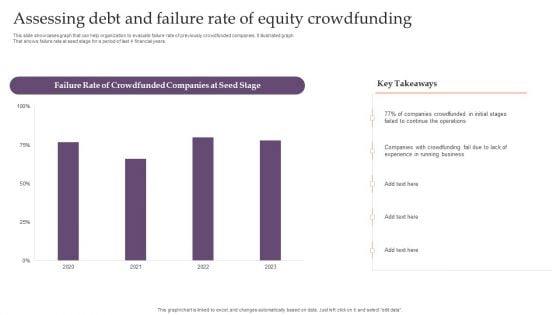
Assessing Debt And Equity Fundraising Alternatives For Business Growth Assessing Debt And Failure Rate Pictures PDF
This slide showcases graph that can help organization to evaluate failure rate of previously crowdfunded companies. It illustrated graph That shows failure rate at seed stage for a period of last 4 financial years. Here you can discover an assortment of the finest PowerPoint and Google Slides templates. With these templates, you can create presentations for a variety of purposes while simultaneously providing your audience with an eye catching visual experience. Download Assessing Debt And Equity Fundraising Alternatives For Business Growth Assessing Debt And Failure Rate Pictures PDF to deliver an impeccable presentation. These templates will make your job of preparing presentations much quicker, yet still, maintain a high level of quality. Slidegeeks has experienced researchers who prepare these templates and write high quality content for you. Later on, you can personalize the content by editing the Assessing Debt And Equity Fundraising Alternatives For Business Growth Assessing Debt And Failure Rate Pictures PDF.
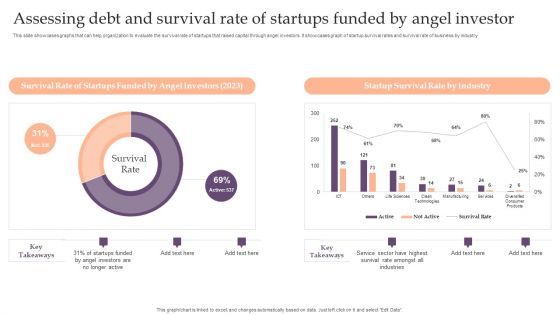
Assessing Debt And Equity Fundraising Alternatives For Business Growth Assessing Debt And Survival Rate Of Startups Background PDF
This slide showcases graphs that can help organization to evaluate the survival rate of startups that raised capital through angel investors. It showcases graph of startup survival rates and survival rate of business by industry. This Assessing Debt And Equity Fundraising Alternatives For Business Growth Assessing Debt And Survival Rate Of Startups Background PDF from Slidegeeks makes it easy to present information on your topic with precision. It provides customization options, so you can make changes to the colors, design, graphics, or any other component to create a unique layout. It is also available for immediate download, so you can begin using it right away. Slidegeeks has done good research to ensure that you have everything you need to make your presentation stand out. Make a name out there for a brilliant performance.
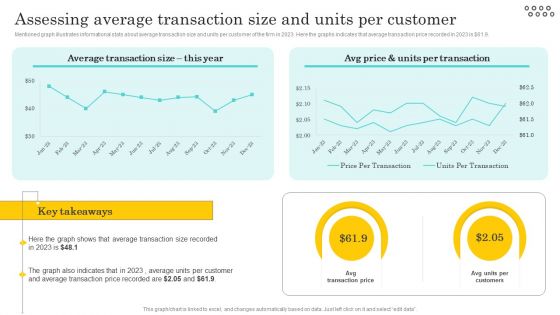
Optimizing And Managing Retail Assessing Average Transaction Size And Units Per Slides PDF
Mentioned graph illustrates informational stats about average transaction size and units per customer of the firm in 2023. Here the graphs indicates that average transaction price recorded in 2023 is dollar 61.9. Slidegeeks is one of the best resources for PowerPoint templates. You can download easily and regulate Optimizing And Managing Retail Assessing Average Transaction Size And Units Per Slides PDF for your personal presentations from our wonderful collection. A few clicks is all it takes to discover and get the most relevant and appropriate templates. Use our Templates to add a unique zing and appeal to your presentation and meetings. All the slides are easy to edit and you can use them even for advertisement purposes.
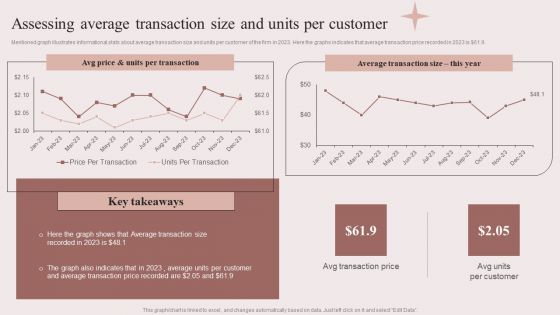
Enhancing Retail Process By Effective Inventory Management Assessing Average Transaction Size Units Clipart PDF
Mentioned graph illustrates informational stats about average transaction size and units per customer of the firm in 2023. Here the graphs indicates that average transaction price recorded in 2023 is doller 61.9. Slidegeeks is one of the best resources for PowerPoint templates. You can download easily and regulate Enhancing Retail Process By Effective Inventory Management Assessing Average Transaction Size Units Clipart PDF for your personal presentations from our wonderful collection. A few clicks is all it takes to discover and get the most relevant and appropriate templates. Use our Templates to add a unique zing and appeal to your presentation and meetings. All the slides are easy to edit and you can use them even for advertisement purposes.
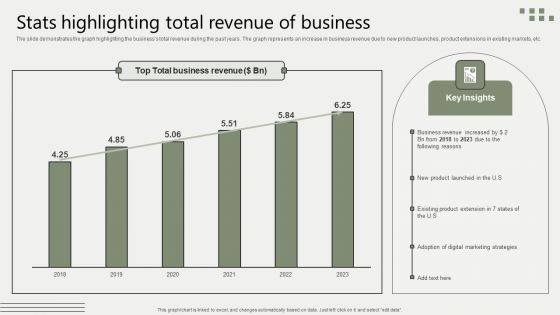
Global Business Market Development Guide Stats Highlighting Total Revenue Of Business Portrait PDF
The slide demonstrates the graph highlighting the businesss total revenue during the past years. The graph represents an increase in business revenue due to new product launches, product extensions in existing markets, etc. This modern and well arranged Global Business Market Development Guide Stats Highlighting Total Revenue Of Business Portrait PDF provides lots of creative possibilities. It is very simple to customize and edit with the Powerpoint Software. Just drag and drop your pictures into the shapes. All facets of this template can be edited with Powerpoint no extra software is necessary. Add your own material, put your images in the places assigned for them, adjust the colors, and then you can show your slides to the world, with an animated slide included.
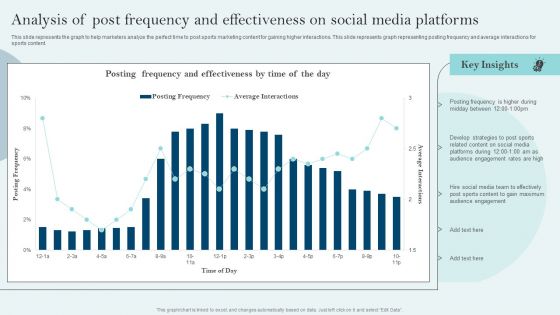
Comprehensive Sports Event Marketing Plan Analysis Of Post Frequency And Effectiveness On Social Slides PDF
This slide represents the graph to help marketers analyze the perfect time to post sports marketing content for gaining higher interactions. This slide represents graph representing posting frequency and average interactions for sports content. Boost your pitch with our creative Comprehensive Sports Event Marketing Plan Analysis Of Post Frequency And Effectiveness On Social Slides PDF. Deliver an awe-inspiring pitch that will mesmerize everyone. Using these presentation templates you will surely catch everyones attention. You can browse the ppts collection on our website. We have researchers who are experts at creating the right content for the templates. So you do not have to invest time in any additional work. Just grab the template now and use them.
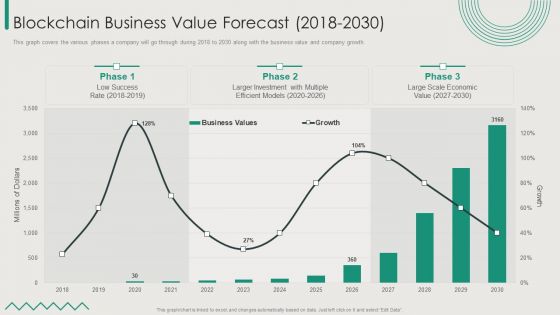
Organization Transition Blockchain Business Value Forecast 2018 To 2030 Diagrams PDF
This graph covers the various phases a company will go through during 2018 to 2030 along with the business value and company growth. Deliver an awe inspiring pitch with this creative Organization Transition Blockchain Business Value Forecast 2018 To 2030 Diagrams PDF bundle. Topics like Low Success Rate, Larger Investment, Business Values can be discussed with this completely editable template. It is available for immediate download depending on the needs and requirements of the user.
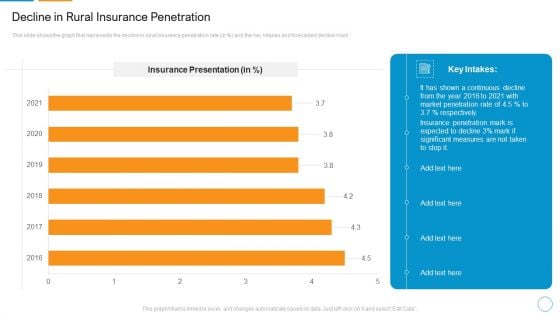
Decline In Rural Insurance Penetration Themes PDF
This slide shows the graph that represents the decline in rural insurance penetration rate in persent and the key intakes and forecasted decline mark.Deliver and pitch your topic in the best possible manner with this decline in rural insurance penetration themes pdf. Use them to share invaluable insights on decline in rural insurance penetration and impress your audience. This template can be altered and modified as per your expectations. So, grab it now.
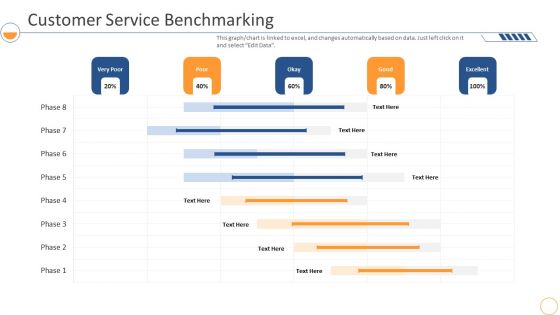
Monthly Company Performance Analysiscustomer Service Benchmarking Data Themes PDF
This graph or chart is linked to excel, and changes automatically based on data. Just left click on it and select Edit Data. Deliver an awe inspiring pitch with this creative monthly company performance analysiscustomer service benchmarking data themes pdf bundle. Topics like customer service benchmarking can be discussed with this completely editable template. It is available for immediate download depending on the needs and requirements of the user.
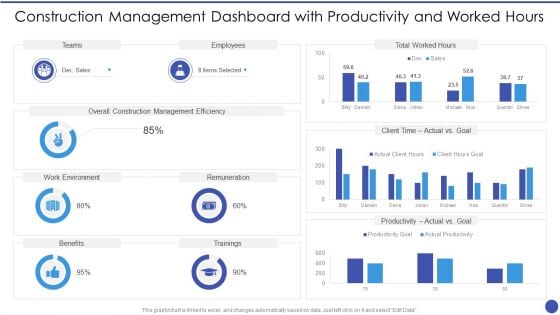
Construction Management Dashboard With Productivity And Worked Hours Themes PDF
This graph for chart is linked to excel, and changes automatically based on data. Just left click on it and select Edit Data. Deliver an awe inspiring pitch with this creative Construction Management Dashboard With Productivity And Worked Hours Themes PDF bundle. Topics like Teams, Employees, Overall Construction Management Efficiency, Remuneration, Work Environment can be discussed with this completely editable template. It is available for immediate download depending on the needs and requirements of the user.
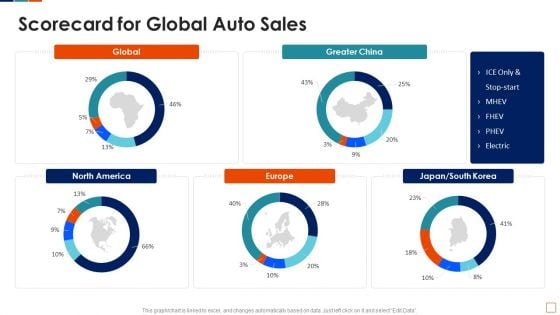
Automobile Sales Scorecard Scorecard For Global Auto Sales Themes PDF
This graph or chart is linked to excel, and changes automatically based on data. Just left click on it and select Edit Data. Deliver and pitch your topic in the best possible manner with this Automobile Sales Scorecard Scorecard For Global Auto Sales Themes PDF. Use them to share invaluable insights on Scorecard For Global, Auto Sales Global and impress your audience. This template can be altered and modified as per your expectations. So, grab it now.
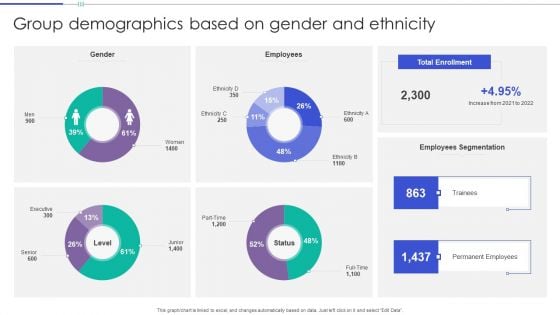
Group Demographics Based On Gender And Ethnicity Themes PDF
This graph or chart is linked to excel, and changes automatically based on data. Just left click on it and select Edit Data. Showcasing this set of slides titled Group Demographics Based On Gender And Ethnicity Themes PDF. The topics addressed in these templates are Gender, Employees, Total Enrollment. All the content presented in this PPT design is completely editable. Download it and make adjustments in color, background, font etc. as per your unique business setting.
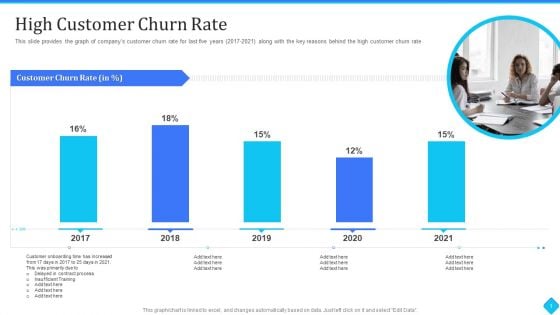
User Onboarding Process Development High Customer Churn Rate Themes PDF
This slide provides the graph of companys customer churn rate for last five years 2017-2021 along with the key reasons behind the high customer churn rate. Deliver and pitch your topic in the best possible manner with this User Onboarding Process Development High Customer Churn Rate Themes PDF. Use them to share invaluable insights on insufficient training, contract process, customer onboarding time and impress your audience. This template can be altered and modified as per your expectations. So, grab it now.
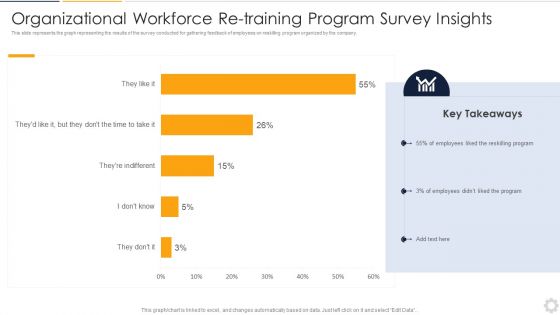
Organizational Workforce Re Training Program Survey Insights Themes PDF
This slide represents the graph representing the results of the survey conducted for gathering feedback of employees on reskilling program organized by the company. Pitch your topic with ease and precision using this Organizational Workforce Re Training Program Survey Insights Themes PDF. This layout presents information on Program Survey Insights, Workforce Re Training, Organizational. It is also available for immediate download and adjustment. So, changes can be made in the color, design, graphics or any other component to create a unique layout.
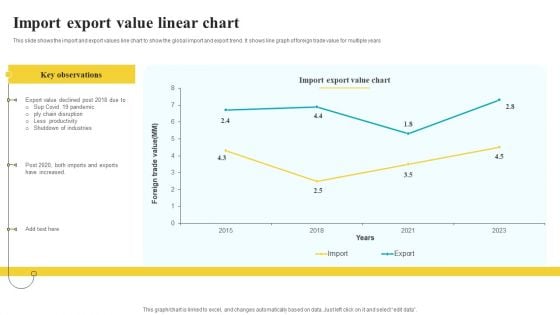
Import Export Value Linear Chart Summary PDF
This slide shows the import and export values line chart to show the global import and export trend. It shows line graph of foreign trade value for multiple years Showcasing this set of slides titled Import Export Value Linear Chart Summary PDF. The topics addressed in these templates are Key Observations, Value Chart, Industries. All the content presented in this PPT design is completely editable. Download it and make adjustments in color, background, font etc. as per your unique business setting.

Yearly Selling Forecasts Revenue Chart Summary PDF
This slide covers projections for yearly revenue generation from product sales. It includes forecasted revenue for different years and a graph depicting the projected sales revenue growth. Showcasing this set of slides titled Yearly Selling Forecasts Revenue Chart Summary PDF. The topics addressed in these templates are Project Sales Revenue, Forecasts Revenue Chart. All the content presented in this PPT design is completely editable. Download it and make adjustments in color, background, font etc. as per your unique business setting.
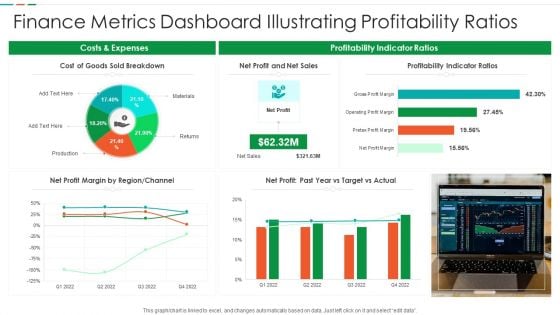
Finance Metrics Dashboard Illustrating Profitability Ratios Diagrams PDF
This graph or chart is linked to excel, and changes automatically based on data. Just left click on it and select edit data. Pitch your topic with ease and precision using this Finance Metrics Dashboard Illustrating Profitability Ratios Diagrams PDF. This layout presents information on Cost Goods Sold, Net Profit Net, Sales Profitability Indicator. It is also available for immediate download and adjustment. So, changes can be made in the color, design, graphics or any other component to create a unique layout.
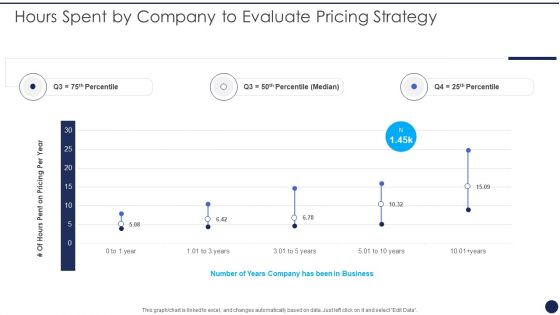
Hours Spent By Company To Evaluate Pricing Strategy Product Pricing Strategies Analysis Themes PDF
This graph or chart is linked to excel, and changes automatically based on data. Just left click on it and select Edit Data. Deliver and pitch your topic in the best possible manner with this Hours Spent By Company To Evaluate Pricing Strategy Product Pricing Strategies Analysis Themes PDF. Use them to share invaluable insights on Pricing Per Year, Number Years Business and impress your audience. This template can be altered and modified as per your expectations. So, grab it now.
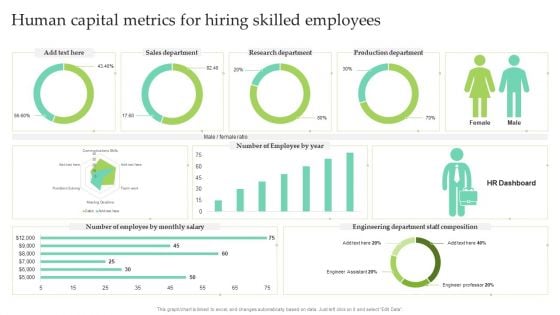
Human Capital Metrics For Hiring Skilled Employees Ppt Slides Themes PDF
This graph or chart is linked to excel, and changes automatically based on data. Just left click on it and select Edit Data. Showcasing this set of slides titled Human Capital Metrics For Hiring Skilled Employees Ppt Slides Themes PDF. The topics addressed in these templates are Sales Department, Research Department, Production Department. All the content presented in this PPT design is completely editable. Download it and make adjustments in color, background, font etc. as per your unique business setting.
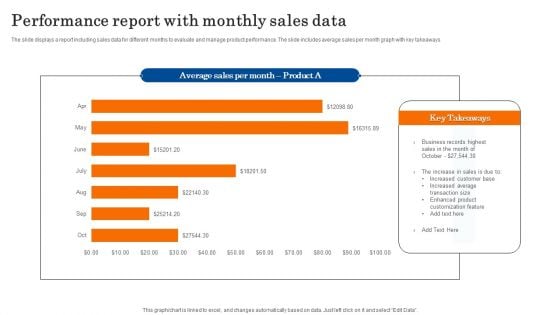
Performance Report With Monthly Sales Data Diagrams PDF
The slide displays a report including sales data for different months to evaluate and manage product performance. The slide includes average sales per month graph with key takeaways. Showcasing this set of slides titled Performance Report With Monthly Sales Data Diagrams PDF. The topics addressed in these templates are Business, Sales, Customization. All the content presented in this PPT design is completely editable. Download it and make adjustments in color, background, font etc. as per your unique business setting.
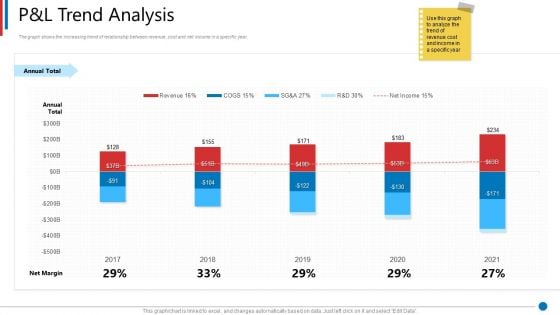
Business Synergies P And L Trend Analysis Ppt Gallery Themes PDF
The graph shows the increasing trend of relationship between revenue, cost and net income in a specific year. Deliver an awe-inspiring pitch with this creative business synergies p and l trend analysis ppt gallery themes pdf bundle. Topics like p and l trend analysis can be discussed with this completely editable template. It is available for immediate download depending on the needs and requirements of the user.
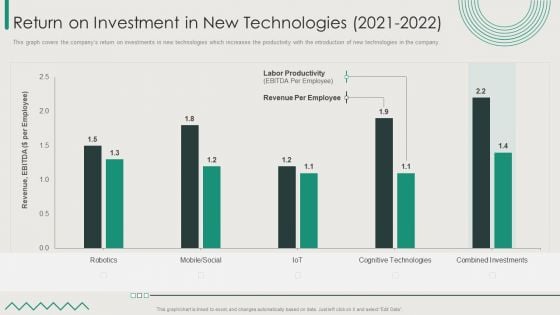
Organization Transition Return On Investment In New Technologies 2021 To 2022 Themes PDF
This graph covers the companys return on investments in new technologies which increases the productivity with the introduction of new technologies in the company. Deliver an awe inspiring pitch with this creative Organization Transition Return On Investment In New Technologies 2021 To 2022 Themes PDF bundle. Topics like Revenue per Employee, Labour Productivity, IOT can be discussed with this completely editable template. It is available for immediate download depending on the needs and requirements of the user.
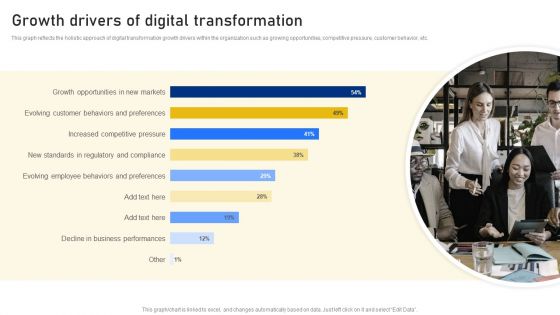
Reshaping Business In Digital Growth Drivers Of Digital Transformation Themes PDF
This graph reflects the holistic approach of digital transformation growth drivers within the organization such as growing opportunities, competitive pressure, customer behavior, etc. Deliver and pitch your topic in the best possible manner with this Reshaping Business In Digital Growth Drivers Of Digital Transformation Themes PDF. Use them to share invaluable insights on Growth Opportunities, New Markets, Evolving Customer and impress your audience. This template can be altered and modified as per your expectations. So, grab it now.
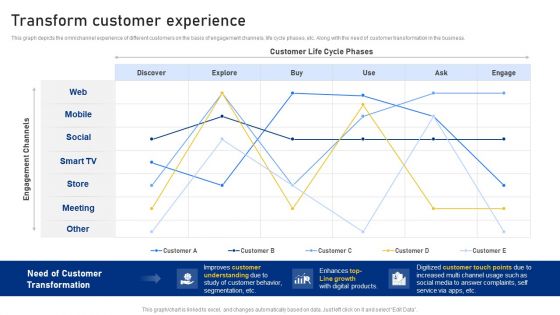
Reshaping Business In Digital Transform Customer Experience Mockup PDF
This graph depicts the omnichannel experience of different customers on the basis of engagement channels, life cycle phases, etc. Along with the need of customer transformation in the business. Deliver and pitch your topic in the best possible manner with this Reshaping Business In Digital Transform Customer Experience Mockup PDF. Use them to share invaluable insights on Customer Life, Cycle Phases, Improves Customer Understanding and impress your audience. This template can be altered and modified as per your expectations. So, grab it now.
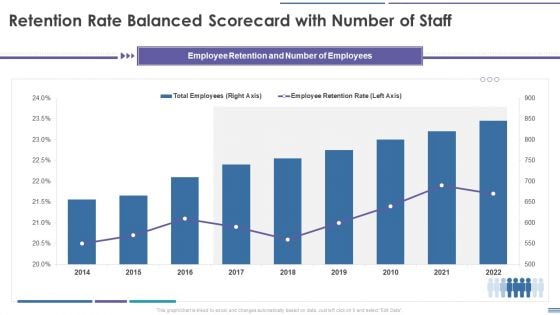
Staff Retention Balanced Scorecard Retention Rate Balanced Scorecard With Number Of Staff Diagrams PDF
This graph or chart is linked to excel, and changes automatically based on data. Just left click on it and select Edit Data. Deliver an awe inspiring pitch with this creative Staff Retention Balanced Scorecard Retention Rate Balanced Scorecard With Number Of Staff Diagrams PDF bundle. Topics like Total Employees, Employee Retention Rate, 2014 To 2022 can be discussed with this completely editable template. It is available for immediate download depending on the needs and requirements of the user.

Past Trends In Revenue Of XYZ Logistic Company Worldwide Diagrams PDF
This slide shows the past trends in revenue of XYZ Logistic Company worldwide. The graph shows a constant decline in sales since 2017.Deliver and pitch your topic in the best possible manner with this past trends in revenue of xyz logistic company worldwide diagrams pdf. Use them to share invaluable insights on past trends in revenue of xyz logistic company worldwide and impress your audience. This template can be altered and modified as per your expectations. So, grab it now.
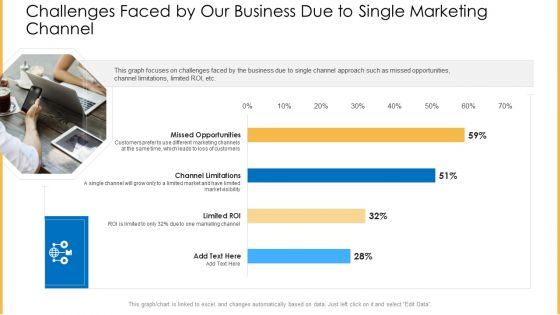
Amalgamation Marketing Pitch Deck Challenges Faced By Our Business Due To Single Marketing Channel Diagrams PDF
This graph focuses on challenges faced by the business due to single channel approach such as missed opportunities, channel limitations, limited ROI, etc. Deliver and pitch your topic in the best possible manner with this amalgamation marketing pitch deck challenges faced by our business due to single marketing channel diagrams pdf. Use them to share invaluable insights on opportunities, limitation, marketing and impress your audience. This template can be altered and modified as per your expectations. So, grab it now.
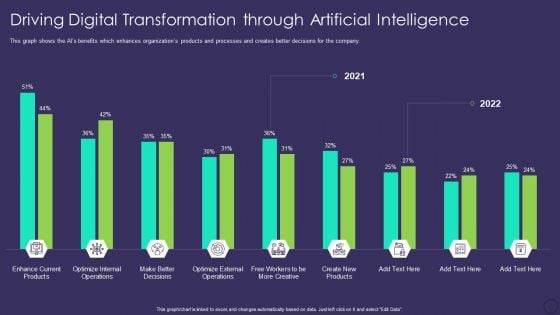
Comprehensive Business Digitization Deck Driving Digital Transformation Through Artificial Intelligence Diagrams PDF
This graph shows the AIs benefits which enhances organizations products and processes and creates better decisions for the company. Deliver and pitch your topic in the best possible manner with this comprehensive business digitization deck driving digital transformation through artificial intelligence diagrams pdf. Use them to share invaluable insights on driving digital transformation through artificial intelligence and impress your audience. This template can be altered and modified as per your expectations. So, grab it now.
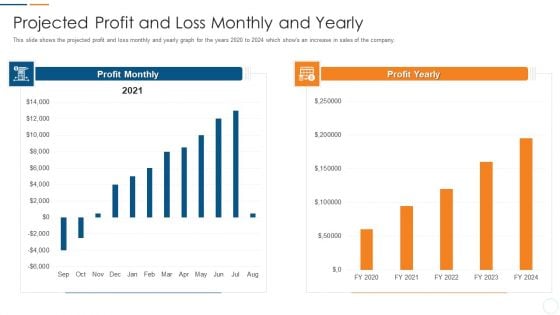
Organization Development Initiatives For Startups Projected Profit And Loss Monthly And Yearly Diagrams PDF
This slide shows the projected profit and loss monthly and yearly graph for the years 2020 to 2024 which shows an increase in sales of the company. Deliver an awe inspiring pitch with this creative organization development initiatives for startups projected profit and loss monthly and yearly diagrams pdf bundle. Topics like projected profit and loss monthly and yearly can be discussed with this completely editable template. It is available for immediate download depending on the needs and requirements of the user.
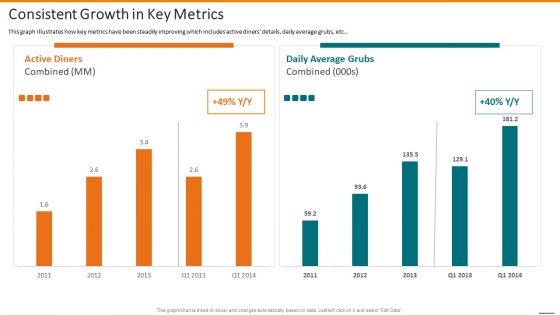
Grubhub Fund Raising Elevator Consistent Growth In Key Metrics Diagrams PDF
This graph illustrates how key metrics have been steadily improving which includes active diners details, daily average grubs, etc. Deliver and pitch your topic in the best possible manner with this grubhub fund raising elevator consistent growth in key metrics diagrams pdf. Use them to share invaluable insights on consistent growth in key metrics and impress your audience. This template can be altered and modified as per your expectations. So, grab it now.
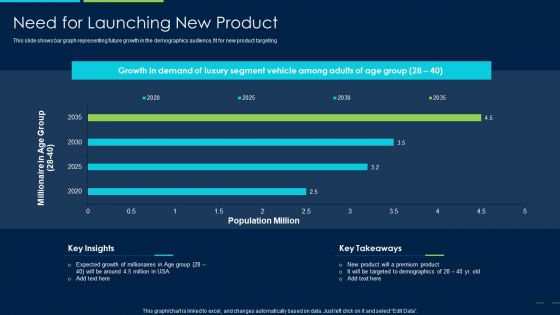
Marketing Strategy New Product Introduction Need For Launching New Product Diagrams PDF
This slide shows bar graph representing future growth in the demographics audience, fit for new product targeting Deliver an awe inspiring pitch with this creative marketing strategy new product introduction need for launching new product diagrams pdf bundle. Topics like need for launching new product can be discussed with this completely editable template. It is available for immediate download depending on the needs and requirements of the user.

Alejandro Cremades Investor Financing Pitch Deck SOMA Growing Potential User Base Of SOMA Diagrams PDF
The following slide provides information about the growing and increasing potential user base of SOMA along with graph showing percentage of increasing overweight population. Deliver and pitch your topic in the best possible manner with this alejandro cremades investor financing pitch deck soma growing potential user base of soma diagrams pdf. Use them to share invaluable insights on growing potential user base of soma and impress your audience. This template can be altered and modified as per your expectations. So, grab it now.
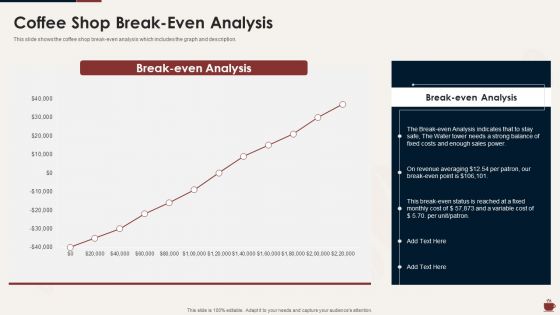
Master Plan For Opening Bistro Coffee Shop Break Even Analysis Diagrams PDF
This slide shows the coffee shop break even analysis which includes the graph and description. Deliver an awe inspiring pitch with this creative master plan for opening bistro coffee shop break even analysis diagrams pdf bundle. Topics like coffee shop break even analysis can be discussed with this completely editable template. It is available for immediate download depending on the needs and requirements of the user.
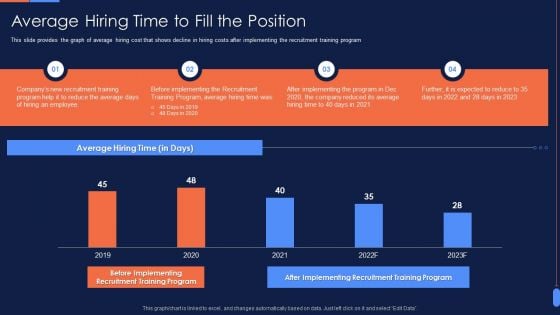
Recruitment Training To Optimize Average Hiring Time To Fill The Position Diagrams PDF
This slide provides the graph of average hiring cost that shows decline in hiring costs after implementing the recruitment training program. Deliver and pitch your topic in the best possible manner with this Recruitment Training To Optimize Average Hiring Time To Fill The Position Diagrams PDF. Use them to share invaluable insights on Average Hiring Time, 2019 To 2023, Employee and impress your audience. This template can be altered and modified as per your expectations. So, grab it now.
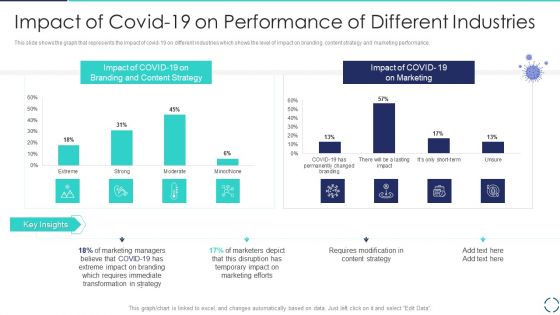
Optimizing E Business Promotion Plan Impact Of Covid 19 On Performance Of Different Industries Diagrams PDF
This slide shows the graph that represents the impact of covid 19 on different industries which shows the level of impact on branding, content strategy and marketing performance. Deliver an awe inspiring pitch with this creative Optimizing E Business Promotion Plan Impact Of Covid 19 On Performance Of Different Industries Diagrams PDF bundle. Topics like Strategy, Marketing, Branding can be discussed with this completely editable template. It is available for immediate download depending on the needs and requirements of the user.
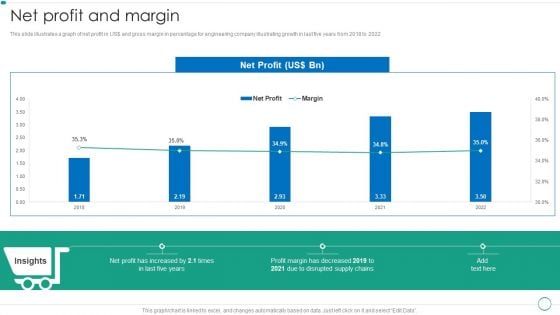
Real Estate Construction And Engineering Company Profile Net Profit And Margin Diagrams PDF
This slide illustrates a graph of net profit in US and gross margin in percentage for engineering company illustrating growth in last five years from 2018 to 2022.Deliver an awe inspiring pitch with this creative Real Estate Construction And Engineering Company Profile Net Profit And Margin Diagrams PDF bundle. Topics like Disrupted Supply, Profit Margin, Increased can be discussed with this completely editable template. It is available for immediate download depending on the needs and requirements of the user.
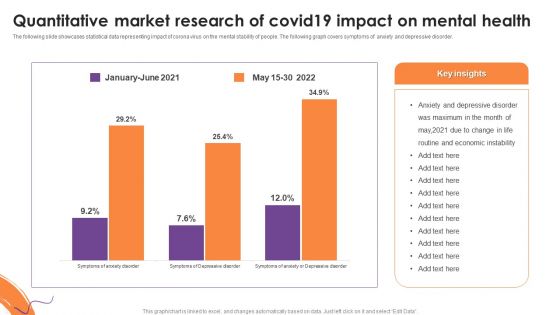
Quantitative Market Research Of Covid19 Impact On Mental Health Diagrams PDF
The following slide showcases statistical data representing impact of corona virus on the mental stability of people. The following graph covers symptoms of anxiety and depressive disorder. Showcasing this set of slides titled Quantitative Market Research Of Covid19 Impact On Mental Health Diagrams PDF. The topics addressed in these templates are Quantitative Market Research, Economic Instability. All the content presented in this PPT design is completely editable. Download it and make adjustments in color, background, font etc. as per your unique business setting.
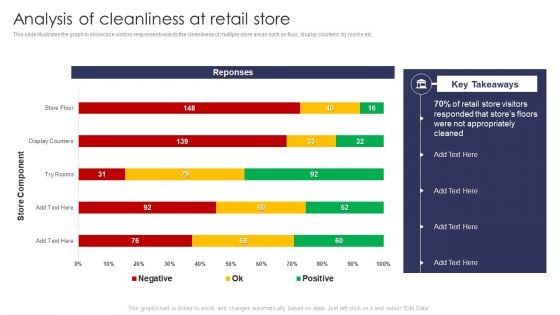
Analysis Of Cleanliness At Retail Store Retail Outlet Operations Performance Evaluation Diagrams PDF
This slide illustrates the graph to showcase visitors responses towards the cleanliness of multiple store areas such as floor, display counters, try rooms etc.Deliver and pitch your topic in the best possible manner with this Analysis Of Cleanliness At Retail Store Retail Outlet Operations Performance Evaluation Diagrams PDF. Use them to share invaluable insights on Retail Store, Visitors Responded, Stores Floors and impress your audience. This template can be altered and modified as per your expectations. So, grab it now.
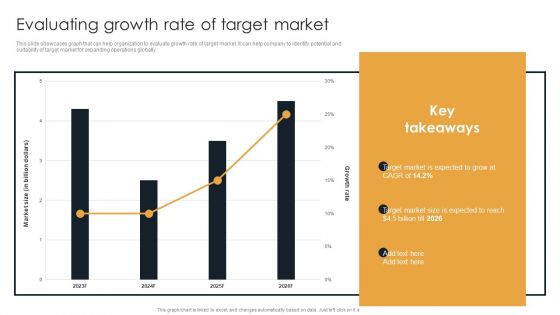
Target Customer Analysis Evaluating Growth Rate Of Target Market Diagrams PDF
This slide showcases graph that can help organization to evaluate growth rate of target market. It can help company to identify potential and suitability of target market for expanding operations globally. There are so many reasons you need a Target Customer Analysis Evaluating Growth Rate Of Target Market Diagrams PDF. The first reason is you cant spend time making everything from scratch, Thus, Slidegeeks has made presentation templates for you too. You can easily download these templates from our website easily.
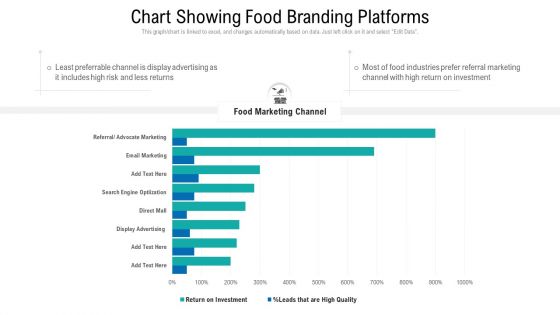
Chart Showing Food Branding Platforms Ppt Summary Gridlines PDF
This graph or chart is linked to excel, and changes automatically based on data. Just left click on it and select Edit Data. Showcasing this set of slides titled chart showing food branding platforms ppt summary gridlines pdf. The topics addressed in these templates are chart showing food branding platforms. All the content presented in this PPT design is completely editable. Download it and make adjustments in color, background, font etc. as per your unique business setting.
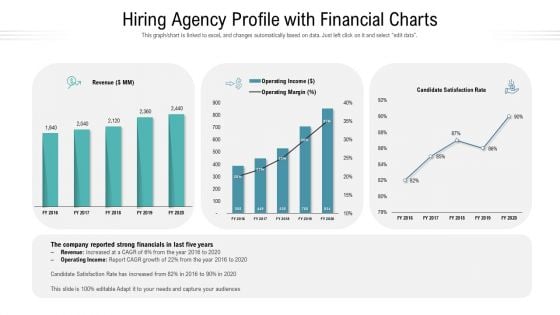
Hiring Agency Profile With Financial Charts Ppt Model Example PDF
This graph or chart is linked to excel, and changes automatically based on data. Just left click on it and select edit data. Pitch your topic with ease and precision using this hiring agency profile with financial charts ppt model example pdf. This layout presents information on revenue, operating income, operating margin, satisfaction rate. It is also available for immediate download and adjustment. So, changes can be made in the color, design, graphics or any other component to create a unique layout.
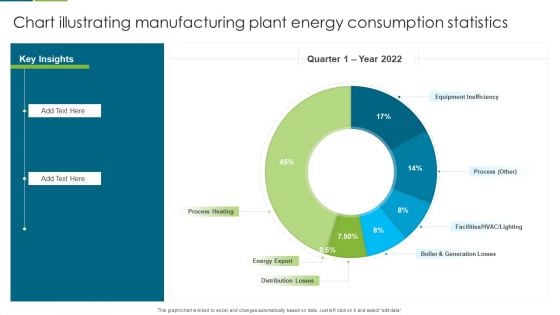
Chart Illustrating Manufacturing Plant Energy Consumption Statistics Slides PDF
This graph or chart is linked to excel, and changes automatically based on data. Just left click on it and select edit data. Pitch your topic with ease and precision using this Chart Illustrating Manufacturing Plant Energy Consumption Statistics Slides PDF. This layout presents information on Equipment Inefficiency, Process Heating, Energy Export. It is also available for immediate download and adjustment. So, changes can be made in the color, design, graphics or any other component to create a unique layout.
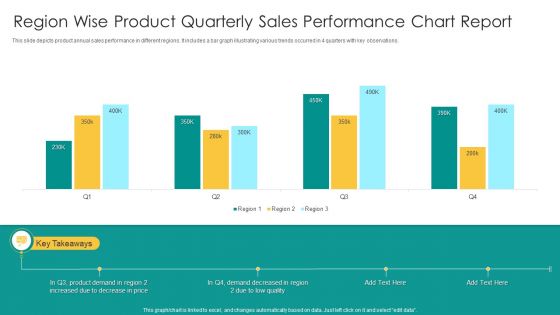
Region Wise Product Quarterly Sales Performance Chart Report Topics PDF
This slide depicts product annual sales performance in different regions. It includes a bar graph illustrating various trends occurred in 4 quarters with key observations. Showcasing this set of slides titled Region Wise Product Quarterly Sales Performance Chart Report Topics PDF. The topics addressed in these templates are Product Demand, Price, Low Quality. All the content presented in this PPT design is completely editable. Download it and make adjustments in color, background, font etc. as per your unique business setting.
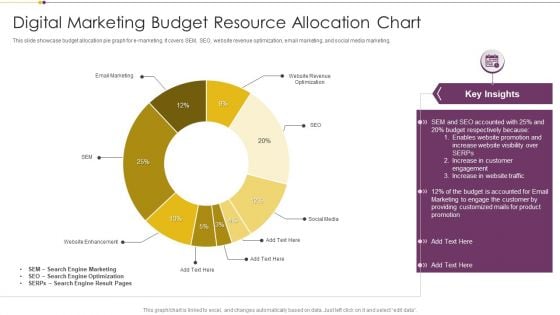
Digital Marketing Budget Resource Allocation Chart Download PDF
This slide showcase budget allocation pie graph for e marketing. It covers SEM, SEO, website revenue optimization, email marketing, and social media marketing. Pitch your topic with ease and precision using this Digital Marketing Budget Resource Allocation Chart Download PDF. This layout presents information on Search Engine Marketing, Search Engine Optimization, Budget. It is also available for immediate download and adjustment. So, changes can be made in the color, design, graphics or any other component to create a unique layout.
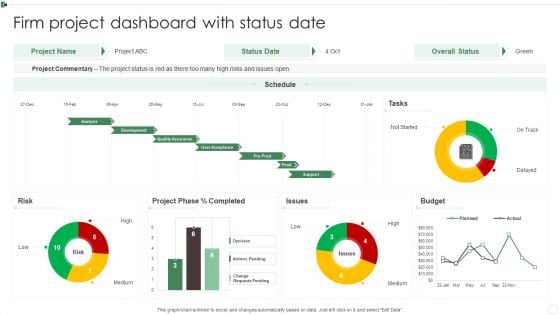
Firm Project Dashboard With Status Date Ppt Infographics Slides PDF
This graph or chart is linked to excel, and changes automatically based on data. Just left click on it and select Edit Data. Pitch your topic with ease and precision using this Firm Project Dashboard With Status Date Ppt Infographics Slides PDF. This layout presents information on Project Commentary, Budget, Project Phase, Risk. It is also available for immediate download and adjustment. So, changes can be made in the color, design, graphics or any other component to create a unique layout.
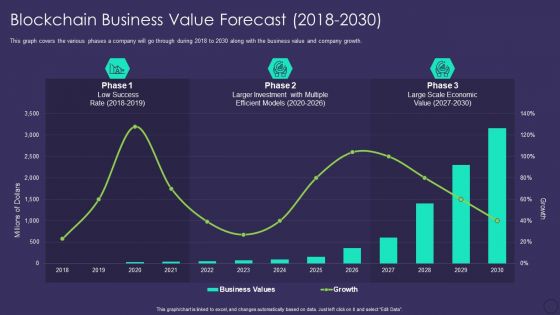
Comprehensive Business Digitization Deck Blockchain Business Value Forecast 2018 2030 Inspiration PDF
This graph covers the various phases a company will go through during 2018 to 2030 along with the business value and company growth. Deliver an awe inspiring pitch with this creative comprehensive business digitization deck blockchain business value forecast 2018 2030 inspiration pdf bundle. Topics like business value, growth, success rate, investment efficient, economic value can be discussed with this completely editable template. It is available for immediate download depending on the needs and requirements of the user.
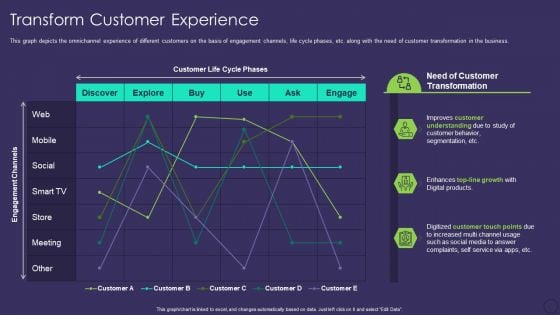
Comprehensive Business Digitization Deck Transform Customer Experience Formats PDF
This graph depicts the omnichannel experience of different customers on the basis of engagement channels, life cycle phases, etc. along with the need of customer transformation in the business. Deliver and pitch your topic in the best possible manner with this comprehensive business digitization deck transform customer experience formats pdf. Use them to share invaluable insights on segmentation, digital products, service, social media, growth and impress your audience. This template can be altered and modified as per your expectations. So, grab it now.
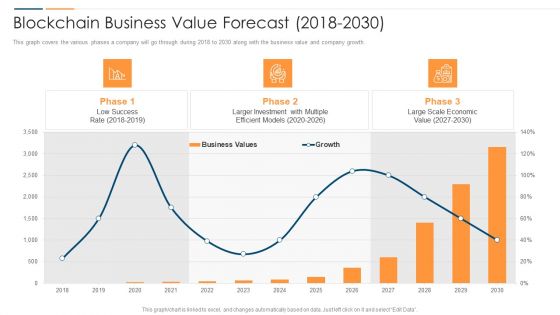
Revolution In Online Business Blockchain Business Value Forecast 2018 To 2030 Designs PDF
This graph covers the various phases a company will go through during 2018 to 2030 along with the business value and company growth. Deliver an awe inspiring pitch with this creative Revolution In Online Business Blockchain Business Value Forecast 2018 To 2030 Designs PDF bundle. Topics like Low Success Rate, Larger Investment Multiple, Large Scale Economic, 2017 To 2030 can be discussed with this completely editable template. It is available for immediate download depending on the needs and requirements of the user.
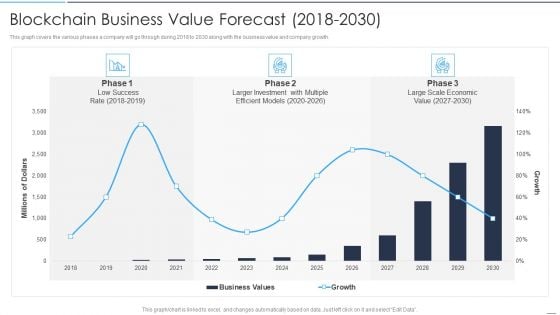
Accelerate Online Journey Now Blockchain Business Value Forecast 2018 To 2030 Designs PDF
This graph covers the various phases a company will go through during 2018 to 2030 along with the business value and company growth.Deliver an awe inspiring pitch with this creative Accelerate Online Journey Now Blockchain Business Value Forecast 2018 To 2030 Designs PDF bundle. Topics like Larger Investment, Multiple Efficient, Large Scale can be discussed with this completely editable template. It is available for immediate download depending on the needs and requirements of the user.
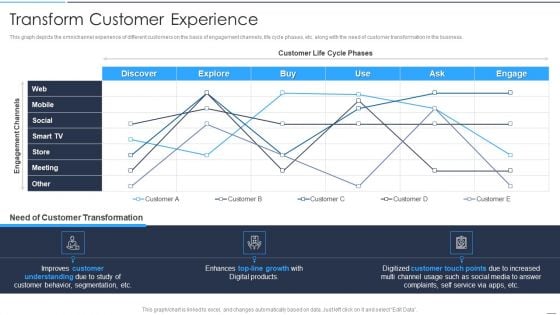
Accelerate Online Journey Now Transform Customer Experience Demonstration PDF
This graph depicts the omnichannel experience of different customers on the basis of engagement channels, life cycle phases, etc. along with the need of customer transformation in the business.Deliver an awe inspiring pitch with this creative Accelerate Online Journey Now Transform Customer Experience Demonstration PDF bundle. Topics like Understanding, Customer Points, Increased Channel can be discussed with this completely editable template. It is available for immediate download depending on the needs and requirements of the user.
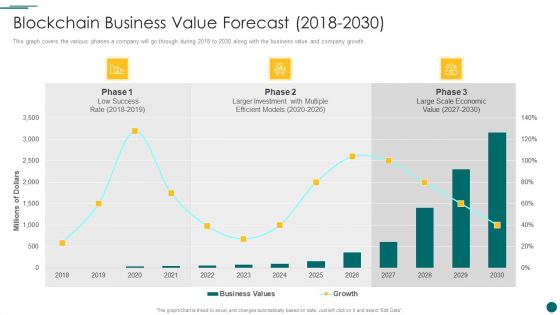
Organization Reinvention Blockchain Business Value Forecast 2018 To 2030 Topics PDF
This graph covers the various phases a company will go through during 2018 to 2030 along with the business value and company growth. Deliver an awe inspiring pitch with this creative Organization Reinvention Blockchain Business Value Forecast 2018 To 2030 Topics PDF bundle. Topics like Larger Investment, Large Scale Economic, Growth can be discussed with this completely editable template. It is available for immediate download depending on the needs and requirements of the user.
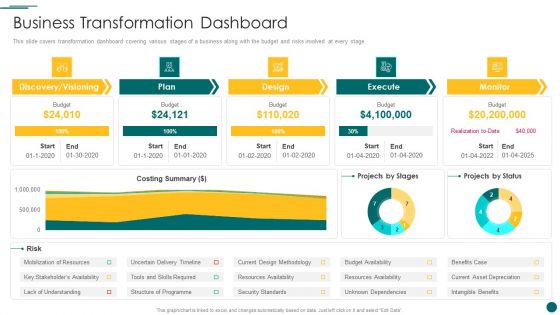
Organization Reinvention Business Transformation Dashboard Formats PDF
This graph covers the various phases a company will go through during 2018 to 2030 along with the business value and company growth. Deliver and pitch your topic in the best possible manner with this Organization Reinvention Business Transformation Dashboard Formats PDF. Use them to share invaluable insights on Plan, Design, Execute and impress your audience. This template can be altered and modified as per your expectations. So, grab it now.
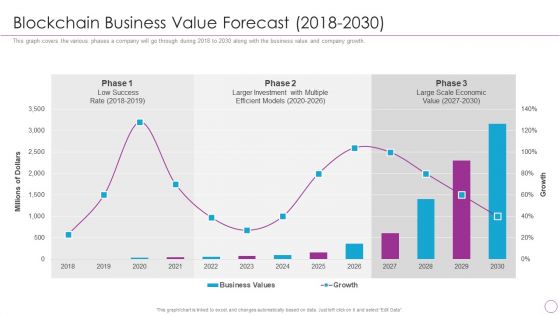
Integration Of Digital Technology In Organization Blockchain Business Value Forecast 2018 To 2030 Slides PDF
This graph covers the various phases a company will go through during 2018 to 2030 along with the business value and company growth.Deliver an awe inspiring pitch with this creative Integration Of Digital Technology In Organization Blockchain Business Value Forecast 2018 To 2030 Slides PDF bundle. Topics like Larger Investment, Scale Economic, Low Success can be discussed with this completely editable template. It is available for immediate download depending on the needs and requirements of the user.
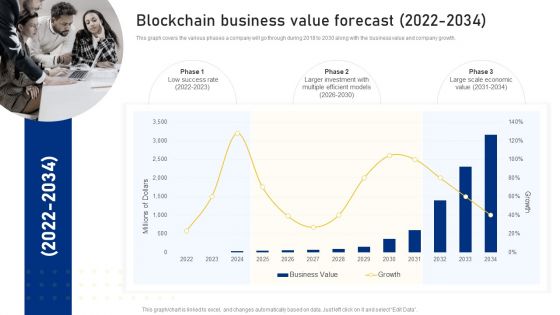
Reshaping Business In Digital Blockchain Business Value Forecast 2022 To 2034 Topics PDF
This graph covers the various phases a company will go through during 2018 to 2030 along with the business value and company growth Deliver an awe inspiring pitch with this creative Reshaping Business In Digital Blockchain Business Value Forecast 2022 To 2034 Topics PDF bundle. Topics like Low Success Rate, Larger Investment, Multiple Efficient Models can be discussed with this completely editable template. It is available for immediate download depending on the needs and requirements of the user.
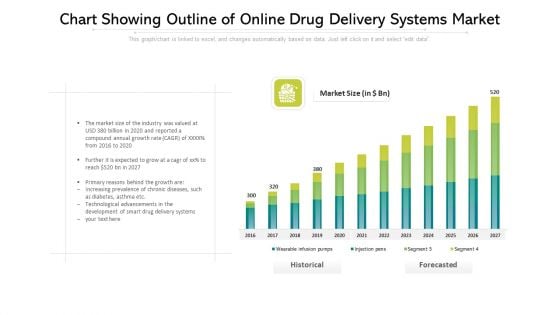
Chart Showing Outline Of Online Drug Delivery Systems Market Ppt PowerPoint Presentation File Clipart PDF
This graph or chart is linked to excel, and changes automatically based on data. Just left click on it and select edit data. Showcasing this set of slides titled chart showing outline of online drug delivery systems market ppt powerpoint presentation file clipart pdf. The topics addressed in these templates are technological, development, growth. All the content presented in this PPT design is completely editable. Download it and make adjustments in color, background, font etc. as per your unique business setting.
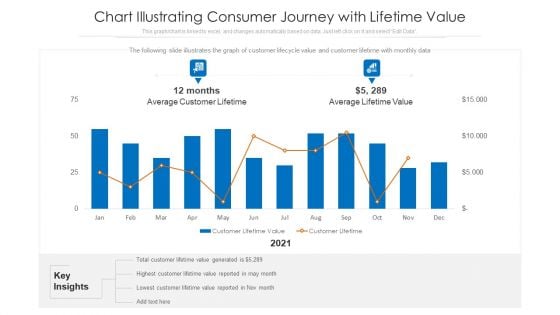
Chart Illustrating Consumer Journey With Lifetime Value Ppt PowerPoint Presentation File Background Images PDF
The following slide illustrates the graph of customer lifecycle value and customer lifetime with monthly data. Pitch your topic with ease and precision using this chart illustrating consumer journey with lifetime value ppt powerpoint presentation file background images pdf. This layout presents information on chart illustrating consumer journey with lifetime value. It is also available for immediate download and adjustment. So, changes can be made in the color, design, graphics or any other component to create a unique layout.
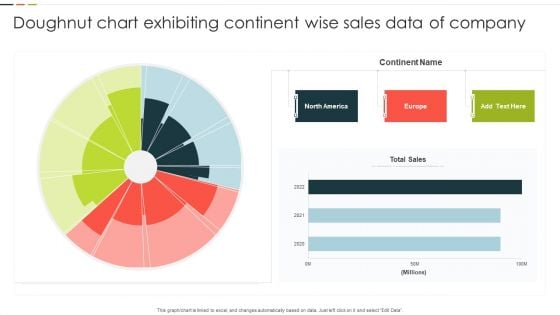
Doughnut Chart Exhibiting Continent Wise Sales Data Of Company Background PDF
This graph or chart is linked to excel, and changes automatically based on data. Just left click on it and select Edit Data. Showcasing this set of slides titled Doughnut Chart Exhibiting Continent Wise Sales Data Of Company Background PDF. The topics addressed in these templates are Continent Name, Total Sales, 2020 To 2022. All the content presented in this PPT design is completely editable. Download it and make adjustments in color, background, font etc. as per your unique business setting.
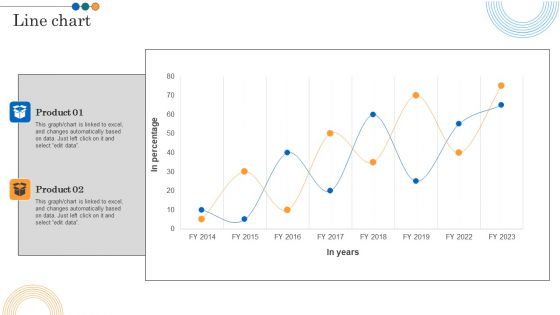
Implementing Marketing Strategies Line Chart Ppt PowerPoint Presentation File Mockup PDF
This graph or chart is linked to excel, and changes automatically based on data. Just left click on it and select edit data. There are so many reasons you need a Implementing Marketing Strategies Line Chart Ppt PowerPoint Presentation File Mockup PDF. The first reason is you can not spend time making everything from scratch, Thus, Slidegeeks has made presentation templates for you too. You can easily download these templates from our website easily.
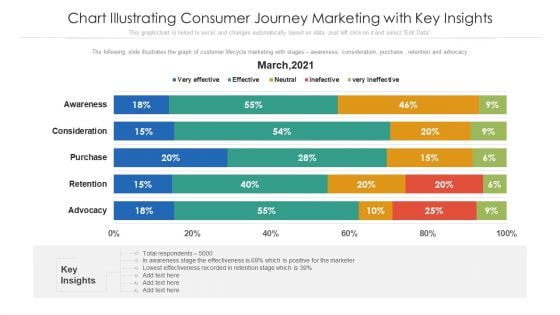
Chart Illustrating Consumer Journey Marketing With Key Insights Ppt PowerPoint Presentation File Demonstration PDF
The following slide illustrates the graph of customer lifecycle marketing with stages awareness, consideration, purchase , retention and advocacy. Showcasing this set of slides titled chart illustrating consumer journey marketing with key insights ppt powerpoint presentation file demonstration pdf. The topics addressed in these templates are awareness, consideration, purchase. All the content presented in this PPT design is completely editable. Download it and make adjustments in color, background, font etc. as per your unique business setting.
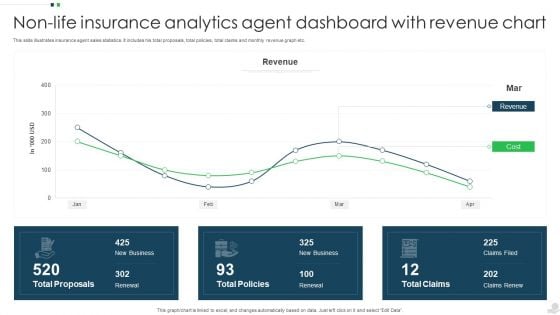
Non Life Insurance Analytics Agent Dashboard With Revenue Chart Infographics PDF
This slide illustrates insurance agent sales statistics. It includes his total proposals, total policies, total claims and monthly revenue graph etc. Showcasing this set of slides titled Non Life Insurance Analytics Agent Dashboard With Revenue Chart Infographics PDF. The topics addressed in these templates are Revenue, Cost, Total Proposals. All the content presented in this PPT design is completely editable. Download it and make adjustments in color, background, font etc. as per your unique business setting.
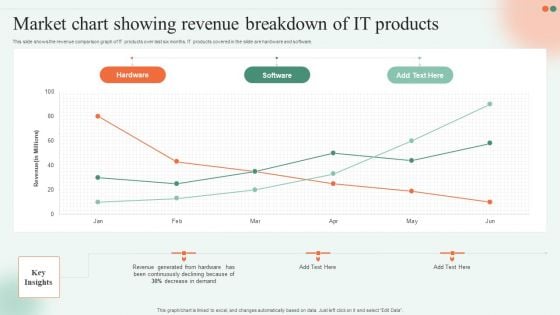
Market Chart Showing Revenue Breakdown Of IT Products Ppt File Elements PDF
This slide shows the revenue comparison graph of IT products over last six months. IT products covered in the slide are hardware and software. Pitch your topic with ease and precision using this Market Chart Showing Revenue Breakdown Of IT Products Ppt File Elements PDF. This layout presents information on Hardware, Software, Key Insights. It is also available for immediate download and adjustment. So, changes can be made in the color, design, graphics or any other component to create a unique layout.
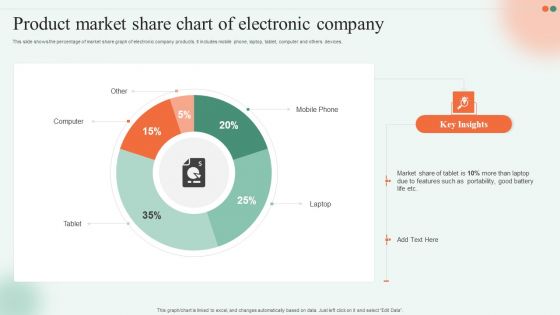
Product Market Share Chart Of Electronic Company Ppt Gallery Graphic Tips PDF
This slide shows the percentage of market share graph of electronic company products. It includes mobile phone, laptop, tablet, computer and others devices. Pitch your topic with ease and precision using this Product Market Share Chart Of Electronic Company Ppt Gallery Graphic Tips PDF. This layout presents information on Mobile Phone, Computer, Laptop, Tablet. It is also available for immediate download and adjustment. So, changes can be made in the color, design, graphics or any other component to create a unique layout.
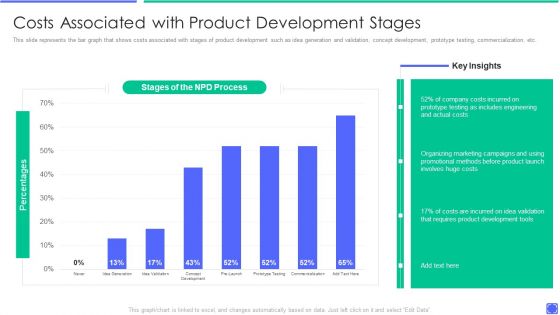
Best Techniques To Enhance New Product Management Efficiency Costs Associated With Product Formats PDF
This slide represents the bar graph that shows costs associated with stages of product development such as idea generation and validation, concept development, prototype testing, commercialization, etc. Deliver an awe inspiring pitch with this creative best techniques to enhance new product management efficiency comparing product metrics themes pdf bundle. Topics like costs associated with product development stages can be discussed with this completely editable template. It is available for immediate download depending on the needs and requirements of the user.
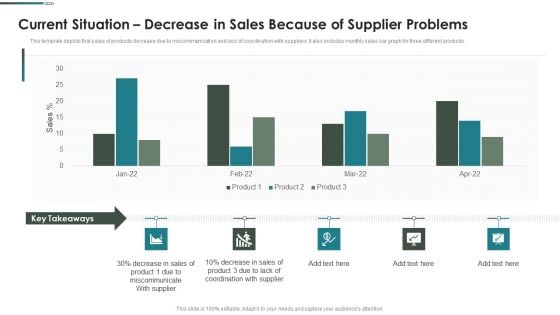
Purchase Assessment Process Current Situation Decrease In Sales Because Of Supplier Problems Sample PDF
This template depicts that sales of products decrease due to miscommunication and lack of coordination with suppliers. It also includes monthly sales bar graph for three different products.Deliver an awe inspiring pitch with this creative Purchase Assessment Process Current Situation Decrease In Sales Because Of Supplier Problems Sample PDF bundle. Topics like Coordination Supplier, Miscommunicate Supplier, Decrease Sale can be discussed with this completely editable template. It is available for immediate download depending on the needs and requirements of the user.
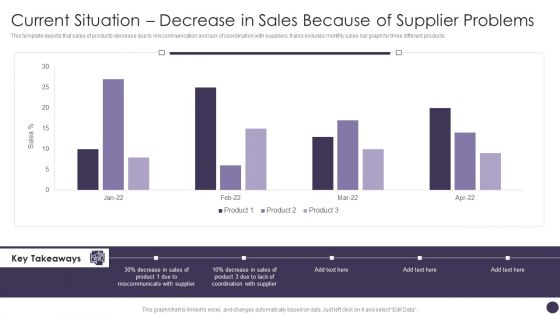
Current Situation Decrease In Sales Because Of Supplier Problems Mockup PDF
This template depicts that sales of products decrease due to miscommunication and lack of coordination with suppliers. It also includes monthly sales bar graph for three different products.Deliver and pitch your topic in the best possible manner with this Current Situation Decrease In Sales Because Of Supplier Problems Mockup PDF. Use them to share invaluable insights on Miscommunicate, Supplier, Coordination and impress your audience. This template can be altered and modified as per your expectations. So, grab it now.
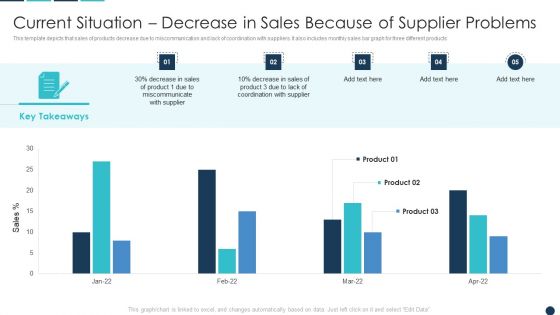
Current Situation Decrease In Sales Because Of Supplier Problems Download PDF
This template depicts that sales of products decrease due to miscommunication and lack of coordination with suppliers. It also includes monthly sales bar graph for three different products.Deliver and pitch your topic in the best possible manner with this Current Situation Decrease In Sales Because Of Supplier Problems Download PDF. Use them to share invaluable insights on Coordination Supplier, Key Takeaways, Miscommunicate Supplier and impress your audience. This template can be altered and modified as per your expectations. So, grab it now.
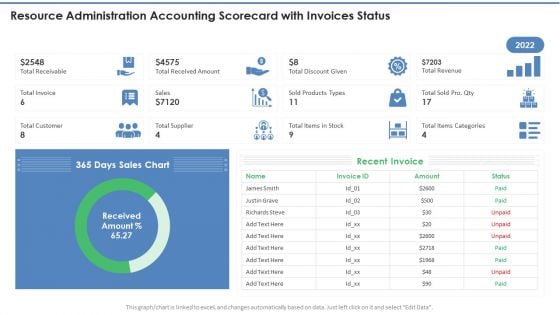
Resource Administration Accounting Scorecard With Invoices Status Topics PDF
This graph or chart is linked to excel, and changes automatically based on data. Just left click on it and select Edit Data. Deliver an awe inspiring pitch with this creative Resource Administration Accounting Scorecard With Invoices Status Topics PDF bundle. Topics like Recent Invoice, Sales Chart, Total Receivable can be discussed with this completely editable template. It is available for immediate download depending on the needs and requirements of the user.
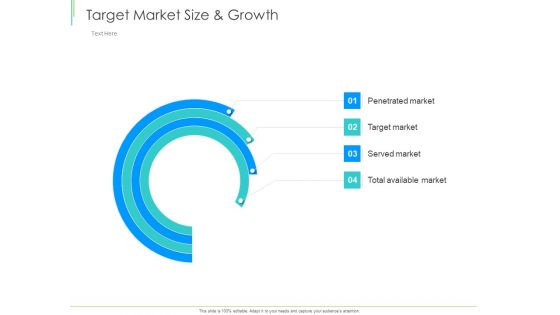
Marketing Plan Implementation Target Market Size And Growth Ppt File Model PDF
This graph or chart is linked to excel, and changes automatically based on data. Just left click on it and select Edit Data. Deliver an awe-inspiring pitch with this creative marketing plan implementation target market size and growth ppt file model pdf bundle. Topics like target market size and growth can be discussed with this completely editable template. It is available for immediate download depending on the needs and requirements of the user.
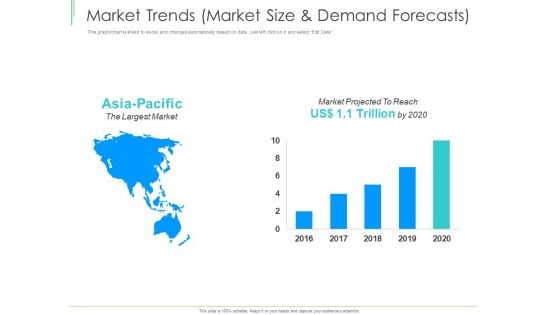
Marketing Plan Implementation Market Trends Market Size And Demand Forecasts Topics PDF
This graph or chart is linked to excel, and changes automatically based on data. Just left click on it and select Edit Data. Deliver an awe-inspiring pitch with this creative marketing plan implementation market trends market size and demand forecasts topics pdf bundle. Topics like market trends, market size and demand forecasts can be discussed with this completely editable template. It is available for immediate download depending on the needs and requirements of the user.
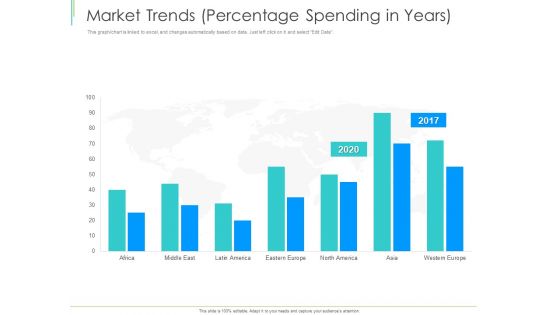
Marketing Plan Implementation Market Trends Percentage Spending In Years Demonstration PDF
This graph or chart is linked to excel, and changes automatically based on data. Just left click on it and select Edit Data. Deliver an awe-inspiring pitch with this creative marketing plan implementation market trends percentage spending in years demonstration pdf bundle. Topics like market trends, percentage spending in years can be discussed with this completely editable template. It is available for immediate download depending on the needs and requirements of the user.
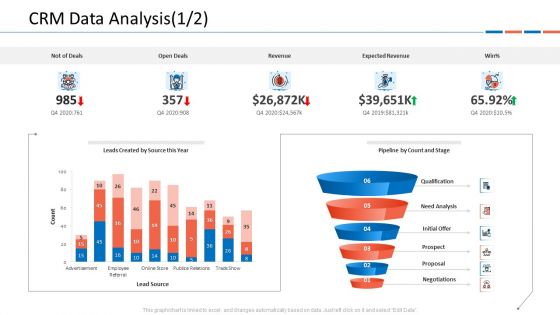
Customer Relationship Management Dashboard CRM Data Analysis Deals Ideas PDF
This graph or chart is linked to excel, and changes automatically based on data. Just left click on it and select Edit Data.Deliver and pitch your topic in the best possible manner with this customer relationship management dashboard crm data analysis deals ideas pdf. Use them to share invaluable insights on v and impress your audience. This template can be altered and modified as per your expectations. So, grab it now.
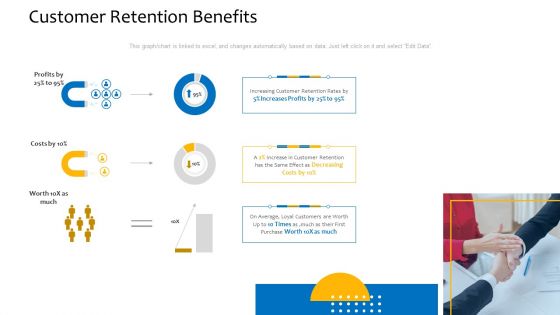
Customer Relationship Management Procedure Customer Retention Benefits Introduction PDF
This graph chart is linked to excel, and changes automatically based on data. Just left click on it and select Edit Data. Deliver an awe inspiring pitch with this creative customer relationship management procedure customer retention benefits introduction pdf bundle. Topics like customer retention benefits, profits, costs can be discussed with this completely editable template. It is available for immediate download depending on the needs and requirements of the user.
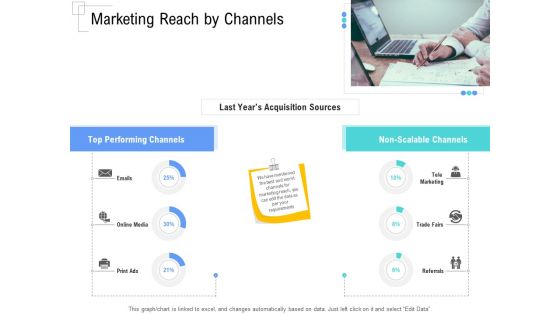
Managing Customer Experience Marketing Reach By Channels Elements PDF
This graph or chart is linked to excel, and changes automatically based on data. Just left click on it and select Edit Data.Deliver and pitch your topic in the best possible manner with this managing customer experience marketing reach by channels elements pdf. Use them to share invaluable insights on last years acquisition sources, top performing channels, non scalable channels and impress your audience. This template can be altered and modified as per your expectations. So, grab it now.
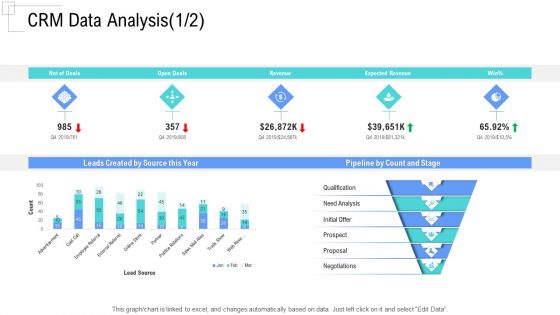
Managing Customer Experience CRM Data Analysis Revenue Designs PDF
This graph or chart is linked to excel, and changes automatically based on data. Just left click on it and select Edit Data.Deliver an awe-inspiring pitch with this creative managing customer experience crm data analysis revenue designs pdf bundle. Topics like leads created by source this year, pipeline by count and stage, qualification, need analysis, initial offer can be discussed with this completely editable template. It is available for immediate download depending on the needs and requirements of the user.
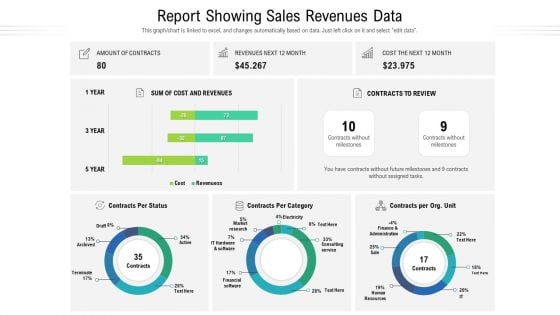
Report Showing Sales Revenues Data Ppt Show Backgrounds PDF
This graph or chart is linked to excel, and changes automatically based on data. Just left click on it and select edit data. Showcasing this set of slides titled report showing sales revenues data ppt show backgrounds pdf. The topics addressed in these templates are cost and revenues, market research, finance and administration. All the content presented in this PPT design is completely editable. Download it and make adjustments in color, background, font etc. as per your unique business setting.
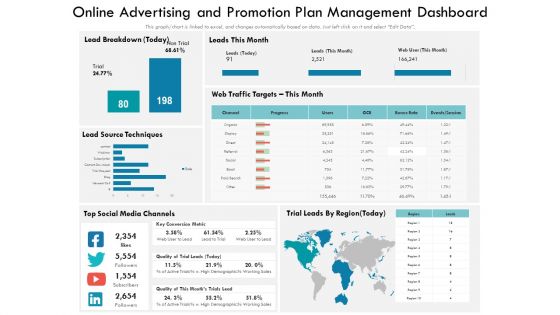
Online Advertising And Promotion Plan Management Dashboard Ppt PowerPoint Presentation Show Tips PDF
This graph chart is linked to excel, and changes automatically based on data. Just left click on it and select Edit Data. Showcasing this set of slides titled online advertising and promotion plan management dashboard ppt powerpoint presentation show tips pdf. The topics addressed in these templates are source techniques, social media channels, traffic targets. All the content presented in this PPT design is completely editable. Download it and make adjustments in color, background, font etc. as per your unique business setting.
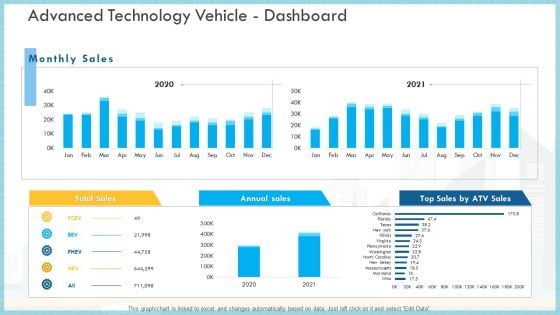
Loss Of Income And Financials Decline In An Automobile Organization Case Study Advanced Technology Vehicle Dashboard Infographics PDF
This graph or chart is linked to excel, and changes automatically based on data. Just left click on it and select Edit Data.Deliver an awe inspiring pitch with this creative loss of income and financials decline in an automobile organization case study advanced technology vehicle dashboard infographics pdf bundle. Topics like total sales, annual sales, monthly sales can be discussed with this completely editable template. It is available for immediate download depending on the needs and requirements of the user.
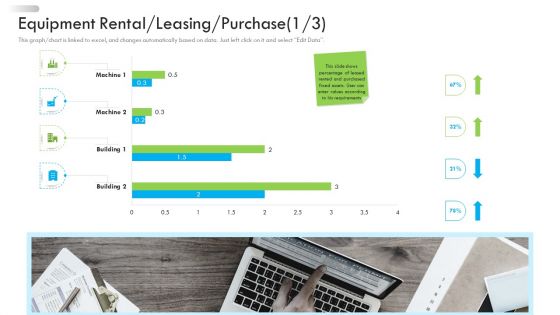
Enterprise Tactical Planning Equipment Rental Leasing Purchase Machine Brochure PDF
This graph or chart is linked to excel, and changes automatically based on data. Just left click on it and select Edit Data. Deliver an awe-inspiring pitch with this creative enterprise tactical planning equipment rental leasing purchase machine brochure pdf bundle. Topics like equipment rental, leasing, purchase can be discussed with this completely editable template. It is available for immediate download depending on the needs and requirements of the user.
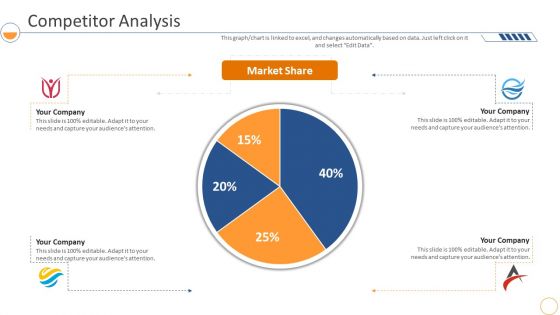
Monthly Company Performance Analysiscompetitor Analysis Market Formats PDF
This graph or chart is linked to excel, and changes automatically based on data. Just left click on it and select Edit Data. Deliver an awe inspiring pitch with this creative monthly company performance analysiscompetitor analysis market formats pdf bundle. Topics like competitor analysis, market share can be discussed with this completely editable template. It is available for immediate download depending on the needs and requirements of the user.
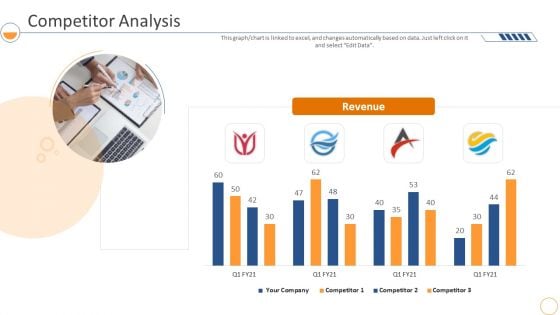
Monthly Company Performance Analysiscompetitor Analysis Pictures PDF
This graph or chart is linked to excel, and changes automatically based on data. Just left click on it and select Edit Data. Deliver and pitch your topic in the best possible manner with this monthly company performance analysiscompetitor analysis pictures pdf. Use them to share invaluable insights on revenue, competitor analysis and impress your audience. This template can be altered and modified as per your expectations. So, grab it now.
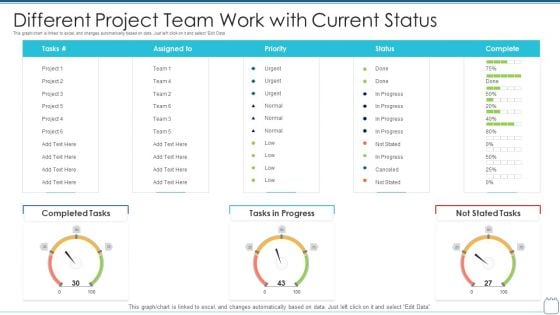
Different Project Team Work With Current Status Graphics PDF
This graph chart is linked to excel, and changes automatically based on data. Just left click on it and select Edit Data Showcasing this set of slides titled different project team work with current status graphics pdf . The topics addressed in these templates are different project team work with current status . All the content presented in this PPT design is completely editable. Download it and make adjustments in color, background, font etc. as per your unique business setting.
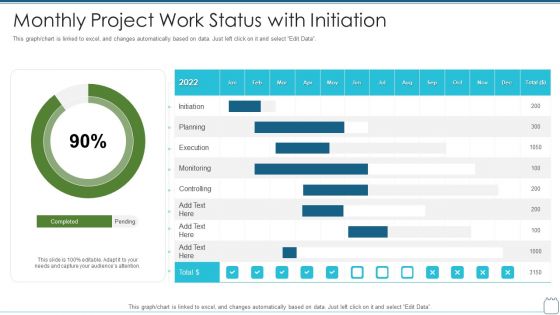
Monthly Project Work Status With Initiation Graphics PDF
This graph chart is linked to excel, and changes automatically based on data. Just left click on it and select Edit Data Showcasing this set of slides titled monthly project work status with initiation graphics pdf . The topics addressed in these templates are monthly project work status with initiation . All the content presented in this PPT design is completely editable. Download it and make adjustments in color, background, font etc. as per your unique business setting.
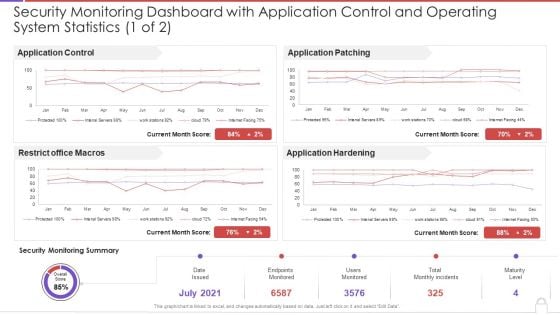
Security Monitoring Dashboard With Application Control And Operating System Statistics Template PDF
This graph or chart is linked to excel, and changes automatically based on data. Just left click on it and select Edit Data. Deliver and pitch your topic in the best possible manner with this security monitoring dashboard with application control and operating system statistics template pdf. Use them to share invaluable insights on application control, restrict office macros, application patching, application hardening and impress your audience. This template can be altered and modified as per your expectations. So, grab it now.
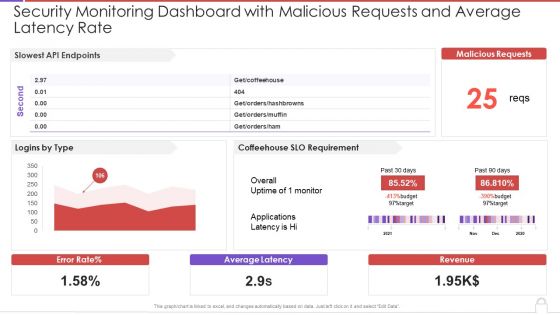
Security Monitoring Dashboard With Malicious Requests And Average Latency Rate Topics PDF
This graph or chart is linked to excel, and changes automatically based on data. Just left click on it and select Edit Data. Deliver an awe inspiring pitch with this creative security monitoring dashboard with malicious requests and average latency rate topics pdf bundle. Topics like slowest api endpoints, malicious requests, coffeehouse slo can be discussed with this completely editable template. It is available for immediate download depending on the needs and requirements of the user.
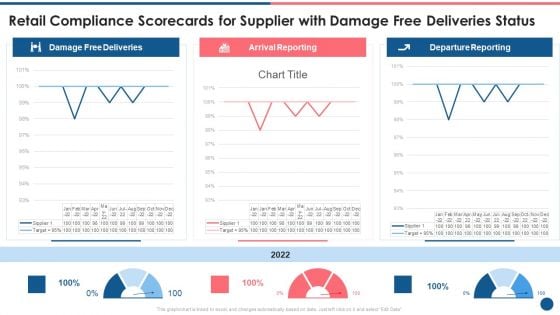
Supplier Scorecard Retail Compliance Scorecards For Supplier With Damage Free Deliveries Status Sample PDF
This graph or chart is linked to excel, and changes automatically based on data. Just left click on it and select Edit Data. Deliver and pitch your topic in the best possible manner with this supplier scorecard retail compliance scorecards for supplier with damage free deliveries status sample pdf. Use them to share invaluable insights on damage free deliveries, arrival reporting, departure reporting and impress your audience. This template can be altered and modified as per your expectations. So, grab it now.
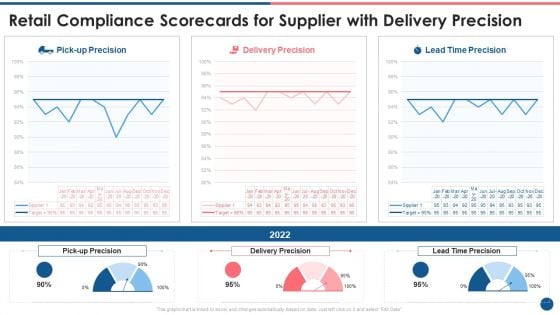
Supplier Scorecard Retail Compliance Scorecards For Supplier With Delivery Precision Clipart PDF
This graph or chart is linked to excel, and changes automatically based on data. Just left click on it and select Edit Data. Deliver an awe inspiring pitch with this creative supplier scorecard retail compliance scorecards for supplier with delivery precision clipart pdf bundle. Topics like pick up precision, delivery precision, lead time precision can be discussed with this completely editable template. It is available for immediate download depending on the needs and requirements of the user.
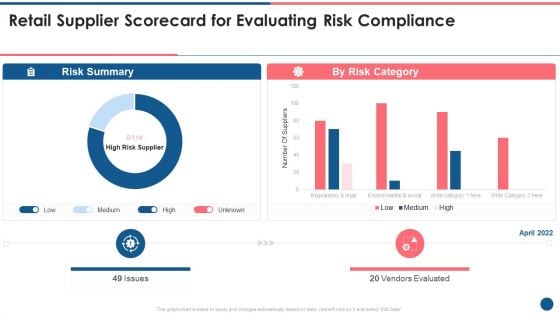
Supplier Scorecard Retail Supplier Scorecard For Evaluating Risk Compliance Clipart PDF
This graph or chart is linked to excel, and changes automatically based on data. Just left click on it and select Edit Data. Deliver and pitch your topic in the best possible manner with this supplier scorecard retail supplier scorecard for evaluating risk compliance clipart pdf. Use them to share invaluable insights on risk summary, risk category, vendors evaluated, low, medium, high and impress your audience. This template can be altered and modified as per your expectations. So, grab it now.
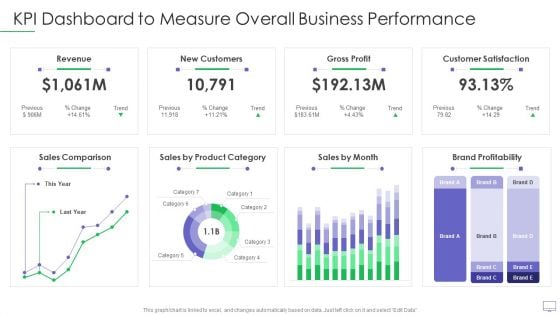
Guide For Software Developers KPI Dashboard To Measure Overall Business Performance Elements PDF
This graph or chart is linked to excel, and changes automatically based on data. Just left click on it and select Edit Data. Deliver an awe inspiring pitch with this creative guide for software developers kpi dashboard to measure overall business performance elements pdf bundle. Topics like revenue new customers, gross profit, customer satisfaction, sales comparison, brand profitability can be discussed with this completely editable template. It is available for immediate download depending on the needs and requirements of the user.
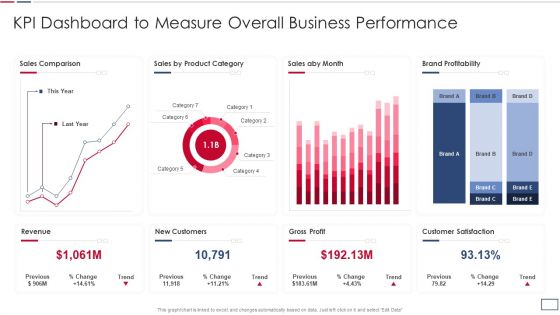
Software Developer Playbook Kpi Dashboard To Measure Overall Business Performance Topics PDF
This graph or chart is linked to excel, and changes automatically based on data. Just left click on it and select Edit Data. Deliver and pitch your topic in the best possible manner with this software developer playbook kpi dashboard to measure overall business performance topics pdf. Use them to share invaluable insights on revenue new customers, gross profit, customer satisfaction, sales comparison and impress your audience. This template can be altered and modified as per your expectations. So, grab it now.
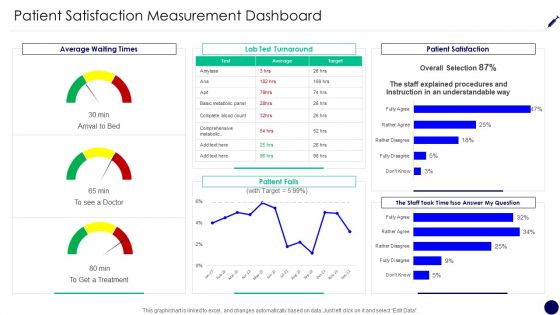
Consumer Retention Techniques Patient Satisfaction Measurement Dashboard Rules PDF
This graph or chart is linked to excel, and changes automatically based on data. Just left click on it and select Edit Data. Deliver and pitch your topic in the best possible manner with this consumer retention techniques patient satisfaction measurement dashboard rules pdf. Use them to share invaluable insights on average waiting times, lab test turnaround, patient satisfaction, patient falls and impress your audience. This template can be altered and modified as per your expectations. So, grab it now.
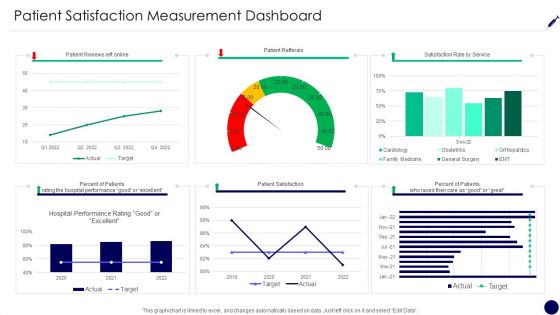
Patient Satisfaction Measurement Dashboard Consumer Retention Techniques Summary PDF
This graph or chart is linked to excel, and changes automatically based on data. Just left click on it and select Edit Data. Deliver and pitch your topic in the best possible manner with this patient satisfaction measurement dashboard consumer retention techniques summary pdf. Use them to share invaluable insights on patient reviews left online, patient refferals, satisfaction rate service, percent patients and impress your audience. This template can be altered and modified as per your expectations. So, grab it now.
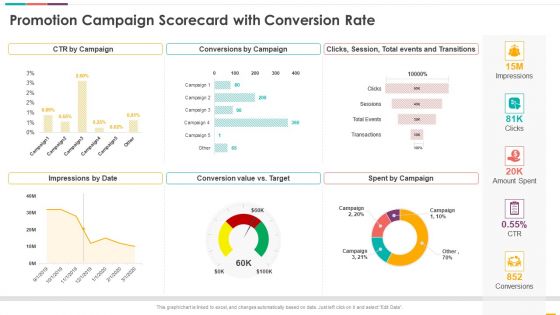
Promotion Campaign Scorecard With Conversion Rate Ppt Inspiration Graphics PDF
This graph or chart is linked to excel, and changes automatically based on data. Just left click on it and select Edit Data. Deliver an awe inspiring pitch with this creative promotion campaign scorecard with conversion rate ppt inspiration graphics pdf bundle. Topics like ctr by campaign, conversions by campaign, impressions by date, conversion value vs target, spent by campaign can be discussed with this completely editable template. It is available for immediate download depending on the needs and requirements of the user.
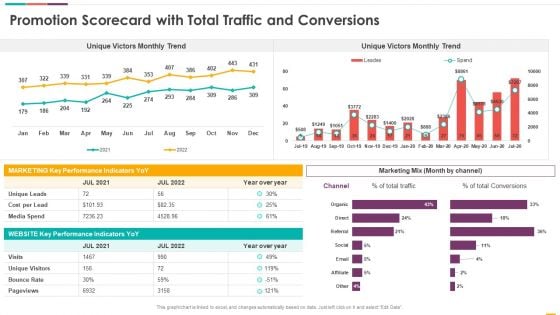
Promotion Scorecard With Total Traffic And Conversions Ppt Pictures Clipart Images PDF
This graph or chart is linked to excel, and changes automatically based on data. Just left click on it and select Edit Data. Deliver an awe inspiring pitch with this creative promotion scorecard with total traffic and conversions ppt pictures clipart images pdf bundle. Topics likeunique victors monthly trend, unique victors monthly trend, marketing mix can be discussed with this completely editable template. It is available for immediate download depending on the needs and requirements of the user.
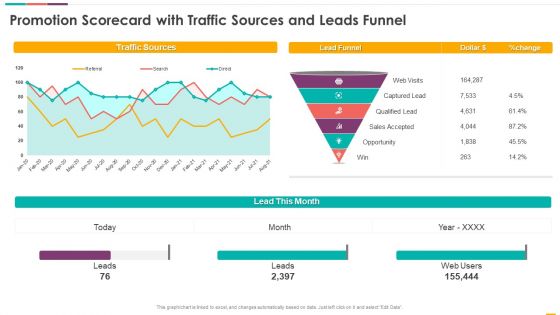
Promotion Scorecard With Traffic Sources And Leads Funnel Ppt Layouts Background PDF
This graph or chart is linked to excel, and changes automatically based on data. Just left click on it and select Edit Data. Deliver and pitch your topic in the best possible manner with this promotion scorecard with traffic sources and leads funnel ppt layouts background pdf. Use them to share invaluable insights on lead month, lead funnel, dollar, traffic sources and impress your audience. This template can be altered and modified as per your expectations. So, grab it now.
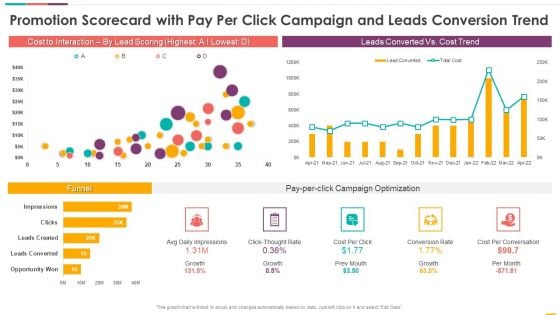
Promotion Scorecard With Pay Per Click Campaign And Leads Conversion Trend Topics PDF
This graph or chart is linked to excel, and changes automatically based on data. Just left click on it and select Edit Data. Deliver an awe inspiring pitch with this creative promotion scorecard with pay per click campaign and leads conversion trend topics pdf bundle. Topics like cost to interaction, by lead scoring, leads converted vs cost trend, funnel can be discussed with this completely editable template. It is available for immediate download depending on the needs and requirements of the user.

Summary Financial Accounting Statement Profit And Loss Analysis Dashboard Elements PDF
This graph or chart is linked to excel, and changes automatically based on data. Just left click on it and select Edit Data. Deliver an awe inspiring pitch with this creative Summary Financial Accounting Statement Profit And Loss Analysis Dashboard Elements PDF bundle. Topics like P And L Structure Dynamics, Dupont Rations, Debt Coverage Ratios, Creditworthiness Assessment can be discussed with this completely editable template. It is available for immediate download depending on the needs and requirements of the user.
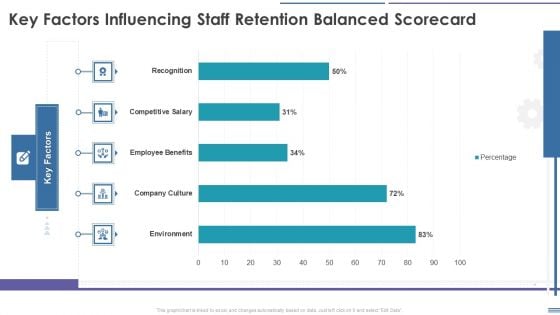
Staff Retention Balanced Scorecard Key Factors Influencing Staff Retention Balanced Scorecard Download PDF
This graph or chart is linked to excel, and changes automatically based on data. Just left click on it and select Edit Data. Deliver an awe inspiring pitch with this creative Staff Retention Balanced Scorecard Key Factors Influencing Staff Retention Balanced Scorecard Download PDF bundle. Topics like Environment, Company Culture, Employee Benefits, Competitive Salary can be discussed with this completely editable template. It is available for immediate download depending on the needs and requirements of the user.
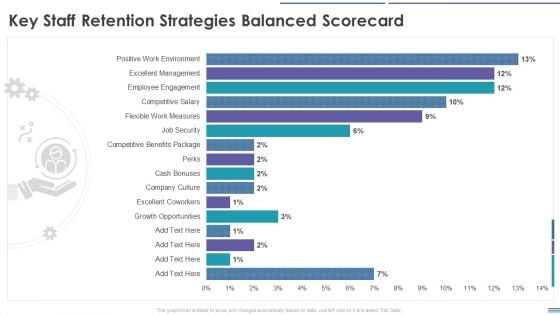
Staff Retention Balanced Scorecard Key Staff Retention Strategies Balanced Scorecard Rules PDF
This graph or chart is linked to excel, and changes automatically based on data. Just left click on it and select Edit Data. Deliver and pitch your topic in the best possible manner with this Staff Retention Balanced Scorecard Key Staff Retention Strategies Balanced Scorecard Rules PDF. Use them to share invaluable insights on Growth Opportunities, Excellent Coworkers, Company Culture, Excellent Management and impress your audience. This template can be altered and modified as per your expectations. So, grab it now.
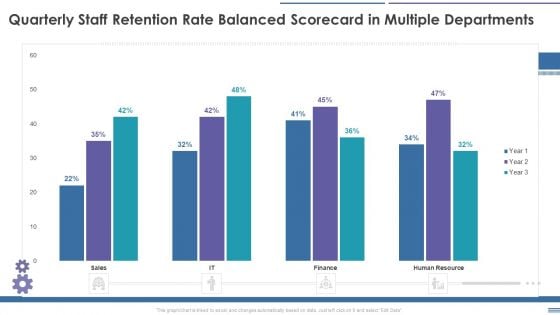
Staff Retention Balanced Scorecard Quarterly Staff Retention Rate Balanced Scorecard In Multiple Formats PDF
This graph or chart is linked to excel, and changes automatically based on data. Just left click on it and select Edit Data. Deliver an awe inspiring pitch with this creative Staff Retention Balanced Scorecard Quarterly Staff Retention Rate Balanced Scorecard In Multiple Formats PDF bundle. Topics like Staff Retention, Balanced Scorecard, Quarterly Staff Retention, Rate Balanced Scorecard can be discussed with this completely editable template. It is available for immediate download depending on the needs and requirements of the user.
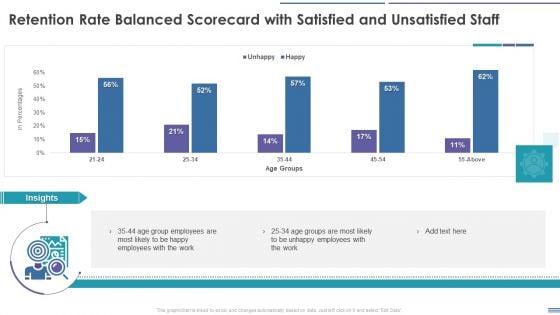
Staff Retention Balanced Scorecard Retention Rate Balanced Scorecard With Satisfied And Unsatisfied Summary PDF
This graph or chart is linked to excel, and changes automatically based on data. Just left click on it and select Edit Data. Deliver an awe inspiring pitch with this creative Staff Retention Balanced Scorecard Retention Rate Balanced Scorecard With Satisfied And Unsatisfied Summary PDF bundle. Topics like Employee, Retention Rate Balanced Scorecard, Satisfied And Unsatisfied Staff can be discussed with this completely editable template. It is available for immediate download depending on the needs and requirements of the user.
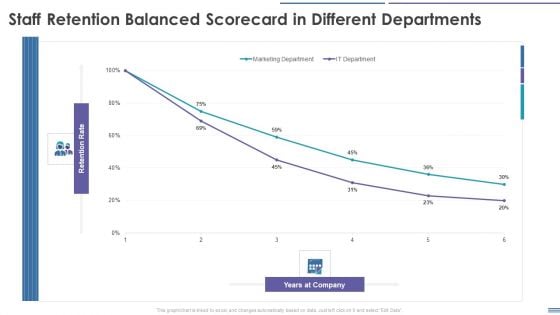
Staff Retention Balanced Scorecard Staff Retention Balanced Scorecard In Different Departments Template PDF
This graph or chart is linked to excel, and changes automatically based on data. Just left click on it and select Edit Data. Deliver and pitch your topic in the best possible manner with this Staff Retention Balanced Scorecard Staff Retention Balanced Scorecard In Different Departments Template PDF. Use them to share invaluable insights on Marketing Department, IT Department and impress your audience. This template can be altered and modified as per your expectations. So, grab it now.
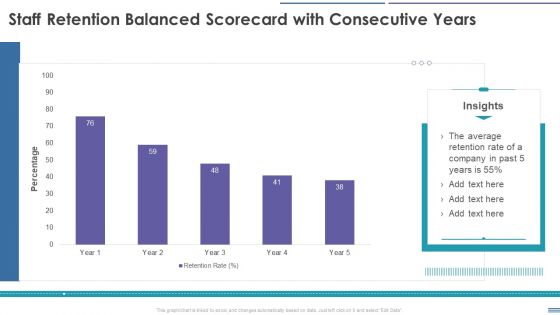
Staff Retention Balanced Scorecard Staff Retention Balanced Scorecard With Consecutive Years Download PDF
This graph or chart is linked to excel, and changes automatically based on data. Just left click on it and select Edit Data. Deliver an awe inspiring pitch with this creative Staff Retention Balanced Scorecard Staff Retention Balanced Scorecard With Consecutive Years Download PDF bundle. Topics like Retention Rate, Percentage can be discussed with this completely editable template. It is available for immediate download depending on the needs and requirements of the user.
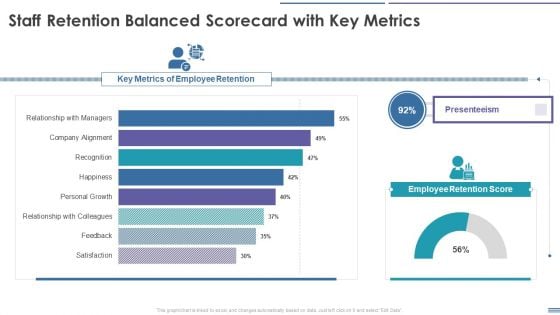
Staff Retention Balanced Scorecard Staff Retention Balanced Scorecard With Key Metrics Demonstration PDF
This graph or chart is linked to excel, and changes automatically based on data. Just left click on it and select Edit Data. Deliver and pitch your topic in the best possible manner with this Staff Retention Balanced Scorecard Staff Retention Balanced Scorecard With Key Metrics Demonstration PDF. Use them to share invaluable insights on Key Metrics Of Employee Retention, Presenteeism, Employee Retention Score and impress your audience. This template can be altered and modified as per your expectations. So, grab it now.
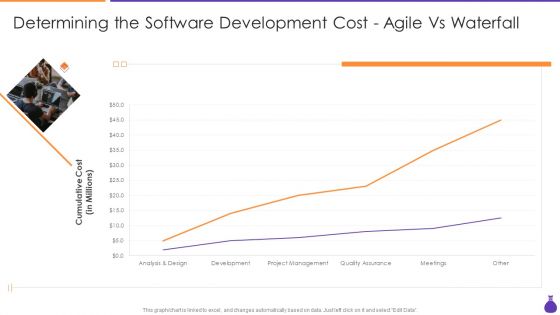
Why Is Agile Cost Effective IT Determining The Software Development Cost Agile Demonstration PDF
This graph or chart is linked to excel, and changes automatically based on data. Just left click on it and select Edit Data. Deliver and pitch your topic in the best possible manner with this Why Is Agile Cost Effective IT Determining The Software Development Cost Agile Demonstration PDF. Use them to share invaluable insights on Analysis And Design, Development, Project Management, Quality Assurance and impress your audience. This template can be altered and modified as per your expectations. So, grab it now.

Auto Sales Profit Scorecard For Two And Four Wheeler Vehicles Inspiration PDF
This graph or chart is linked to excel, and changes automatically based on data. Just left click on it and select Edit Data. Deliver an awe inspiring pitch with this creative Auto Sales Profit Scorecard For Two And Four Wheeler Vehicles Inspiration PDF bundle. Topics like Two Wheeler Vehicles, Four Wheeler Vehicles, Six Wheeler Vehicles can be discussed with this completely editable template. It is available for immediate download depending on the needs and requirements of the user.
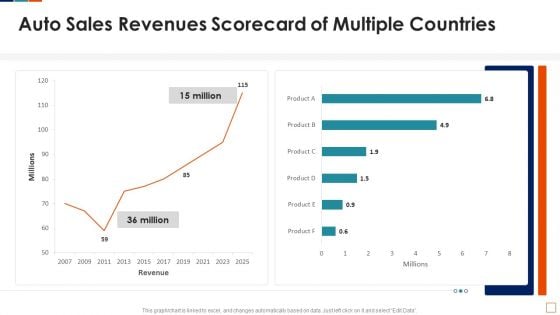
Auto Sales Revenues Scorecard Of Multiple Countries Inspiration PDF
This graph or chart is linked to excel, and changes automatically based on data. Just left click on it and select Edit Data. Deliver an awe inspiring pitch with this creative Auto Sales Revenues Scorecard Of Multiple Countries Inspiration PDF bundle. Topics like Auto Sales Revenues, Scorecard Multiple Countries can be discussed with this completely editable template. It is available for immediate download depending on the needs and requirements of the user.
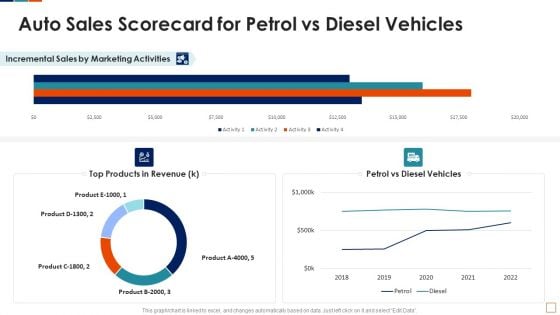
Auto Sales Scorecard For Petrol Vs Diesel Vehicles Template PDF
This graph or chart is linked to excel, and changes automatically based on data. Just left click on it and select Edit Data. Deliver an awe inspiring pitch with this creative Auto Sales Scorecard For Petrol Vs Diesel Vehicles Template PDF bundle. Topics like Top Products Revenue, Petrol Vs Diesel, Vehicles Incremental Sales, Marketing Activities Product can be discussed with this completely editable template. It is available for immediate download depending on the needs and requirements of the user.
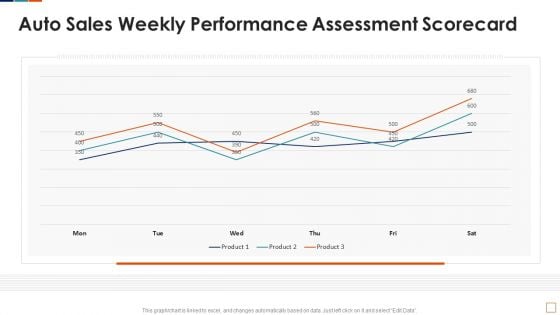
Auto Sales Weekly Performance Assessment Scorecard Background PDF
This graph or chart is linked to excel, and changes automatically based on data. Just left click on it and select Edit Data. Deliver and pitch your topic in the best possible manner with this Auto Sales Weekly Performance Assessment Scorecard Background PDF. Use them to share invaluable insights on Auto Sales Weekly, Performance Assessment Scorecard and impress your audience. This template can be altered and modified as per your expectations. So, grab it now.
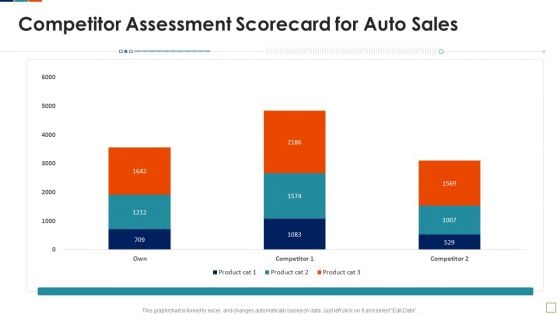
Automobile Sales Scorecard Competitor Assessment Scorecard For Auto Sales Demonstration PDF
This graph or chart is linked to excel, and changes automatically based on data. Just left click on it and select Edit Data. Deliver an awe inspiring pitch with this creative Automobile Sales Scorecard Competitor Assessment Scorecard For Auto Sales Demonstration PDF bundle. Topics like Competitor Assessment Scorecard, Auto Sales Product can be discussed with this completely editable template. It is available for immediate download depending on the needs and requirements of the user.
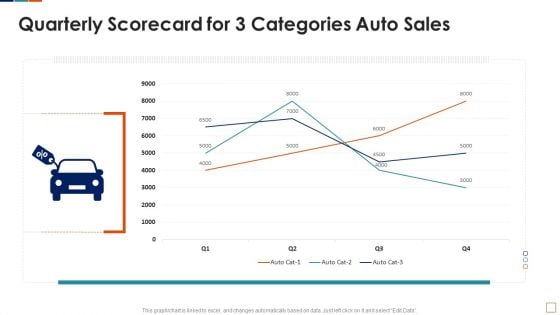
Automobile Sales Scorecard Quarterly Scorecard For 3 Categories Auto Sales Microsoft PDF
This graph or chart is linked to excel, and changes automatically based on data. Just left click on it and select Edit Data. Deliver an awe inspiring pitch with this creative Automobile Sales Scorecard Quarterly Scorecard For 3 Categories Auto Sales Microsoft PDF bundle. Topics like Quarterly Scorecard Three, Categories Auto Sales can be discussed with this completely editable template. It is available for immediate download depending on the needs and requirements of the user.
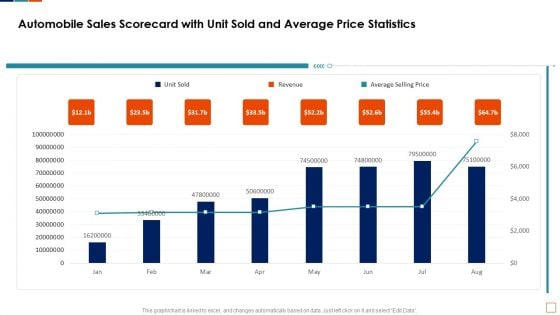
Automobile Sales Scorecard With Unit Sold And Average Price Statistics Formats PDF
This graph or chart is linked to excel, and changes automatically based on data. Just left click on it and select Edit Data. Deliver an awe inspiring pitch with this creative Automobile Sales Scorecard With Unit Sold And Average Price Statistics Formats PDF bundle. Topics like Automobile Sales Scorecard, Unit Sold Revenue, Average Price Statistics can be discussed with this completely editable template. It is available for immediate download depending on the needs and requirements of the user.
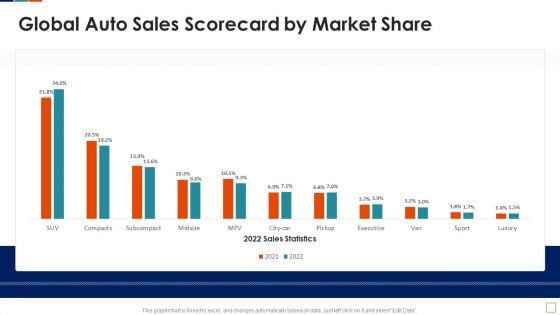
Global Auto Sales Scorecard By Market Share Ideas PDF
This graph or chart is linked to excel, and changes automatically based on data. Just left click on it and select Edit Data. Deliver an awe inspiring pitch with this creative Global Auto Sales Scorecard By Market Share Ideas PDF bundle. Topics like 2022 Sales Statistics, Global Auto Sales, Scorecard Market Share can be discussed with this completely editable template. It is available for immediate download depending on the needs and requirements of the user.
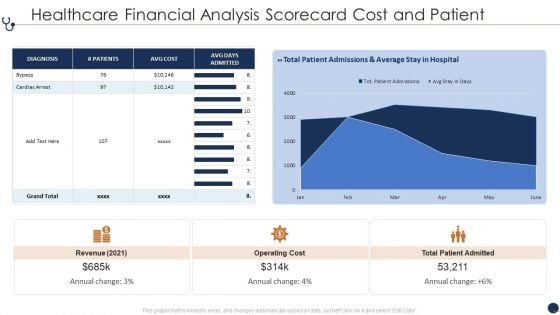
Healthcare Financial Analysis Scorecard Cost And Patient Ppt Pictures Rules PDF
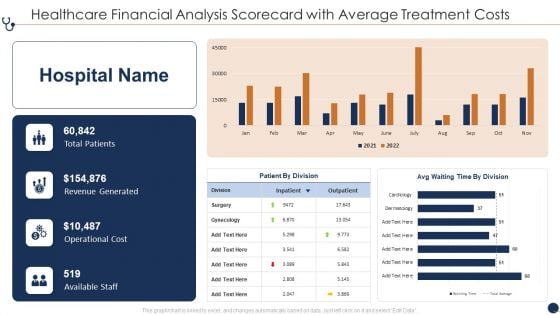
Healthcare Financial Analysis Scorecard With Average Treatment Costs Ppt Gallery Inspiration PDF
This graph or chart is linked to excel, and changes automatically based on data. Just left click on it and select Edit Data. Deliver and pitch your topic in the best possible manner with this Healthcare Financial Analysis Scorecard With Average Treatment Costs Ppt Gallery Inspiration PDF. Use them to share invaluable insights on Total Patients Revenue, Generated Operational Cost, Available Staff Outpatient and impress your audience. This template can be altered and modified as per your expectations. So, grab it now.
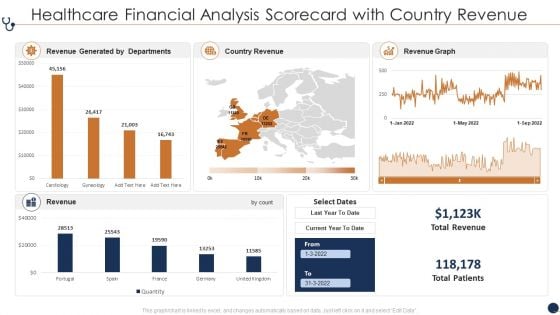
Healthcare Financial Analysis Scorecard With Country Revenue Ppt Layouts PDF
This graph or chart is linked to excel, and changes automatically based on data. Just left click on it and select Edit Data. Deliver an awe inspiring pitch with this creative Healthcare Financial Analysis Scorecard With Country Revenue Ppt Layouts PDF bundle. Topics like Revenue Generated Departments, Country Revenue Current can be discussed with this completely editable template. It is available for immediate download depending on the needs and requirements of the user.
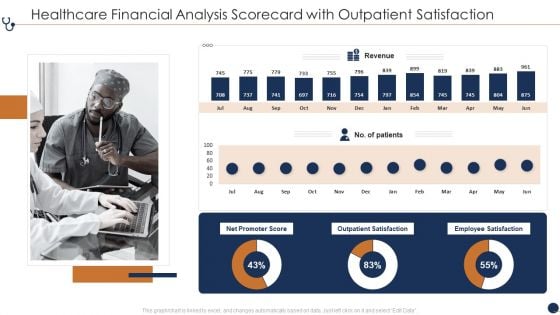
Healthcare Financial Analysis Scorecard With Outpatient Satisfaction Ppt Professional Background Image PDF
This graph or chart is linked to excel, and changes automatically based on data. Just left click on it and select Edit Data. Deliver and pitch your topic in the best possible manner with this Healthcare Financial Analysis Scorecard With Outpatient Satisfaction Ppt Professional Background Image PDF. Use them to share invaluable insights on Net Promoter Score, Outpatient Satisfaction Employee, Revenue Satisfaction Patients and impress your audience. This template can be altered and modified as per your expectations. So, grab it now.
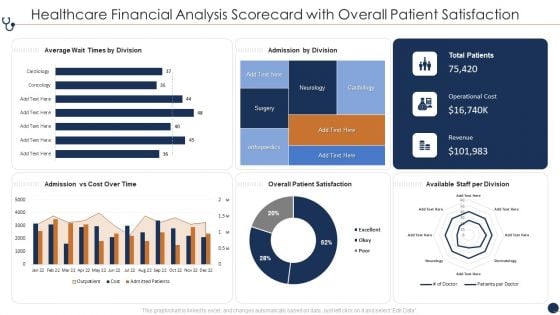
Healthcare Financial Analysis Scorecard With Overall Patient Satisfaction Ppt File Graphics PDF
This graph or chart is linked to excel, and changes automatically based on data. Just left click on it and select Edit Data. Deliver an awe inspiring pitch with this creative Healthcare Financial Analysis Scorecard With Overall Patient Satisfaction Ppt File Graphics PDF bundle. Topics like Average Wait Times, Admission By Division, Admission Vs Cost, Overall Patient Satisfaction can be discussed with this completely editable template. It is available for immediate download depending on the needs and requirements of the user.
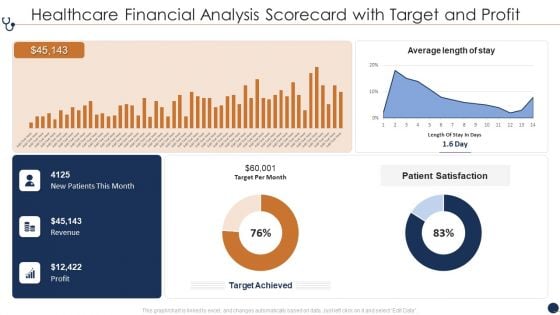
Healthcare Financial Analysis Scorecard With Target And Profit Ppt Gallery Example File PDF
This graph or chart is linked to excel, and changes automatically based on data. Just left click on it and select Edit Data. Deliver an awe inspiring pitch with this creative Avg Nurse Patient, Revenue And Expenses, Avg Treatment Costs bundle. Topics like Average Length Stay, Patient Satisfaction Target, Target Per Month can be discussed with this completely editable template. It is available for immediate download depending on the needs and requirements of the user.
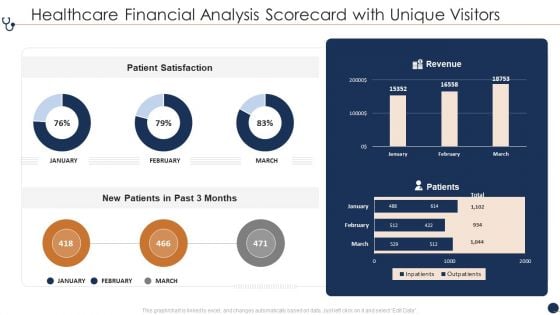
Healthcare Financial Analysis Scorecard With Unique Visitors Ppt File Visuals PDF
This graph or chart is linked to excel, and changes automatically based on data. Just left click on it and select Edit Data. Deliver an awe inspiring pitch with this creative Healthcare Financial Analysis Scorecard With Unique Visitors Ppt File Visuals PDF bundle. Topics like Patient Satisfaction Revenue, New Patients Past can be discussed with this completely editable template. It is available for immediate download depending on the needs and requirements of the user.
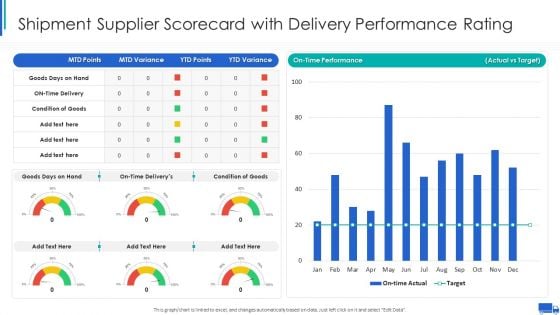
Shipment Supplier Scorecard With Delivery Performance Rating Ppt Ideas Graphic Tips PDF
This graph or chart is linked to excel, and changes automatically based on data. Just left click on it and select Edit Data. Deliver an awe inspiring pitch with this creative Shipment Supplier Scorecard With Delivery Performance Rating Ppt Ideas Graphic Tips PDF bundle. Topics like On Time Performance, Actual Vs Target, Goods Days Hand can be discussed with this completely editable template. It is available for immediate download depending on the needs and requirements of the user.
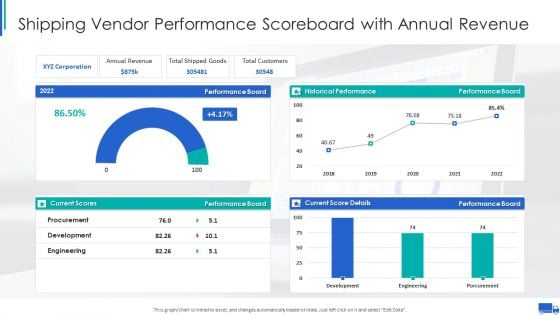
Shipping Vendor Performance Scoreboard With Annual Revenue Ppt Infographics Graphics PDF
This graph or chart is linked to excel, and changes automatically based on data. Just left click on it and select Edit Data. Deliver an awe inspiring pitch with this creative Shipping Vendor Performance Scoreboard With Annual Revenue Ppt Infographics Graphics PDF bundle. Topics like Annual Revenue Board, Total Shipped Goods, Total Customers Performance can be discussed with this completely editable template. It is available for immediate download depending on the needs and requirements of the user.
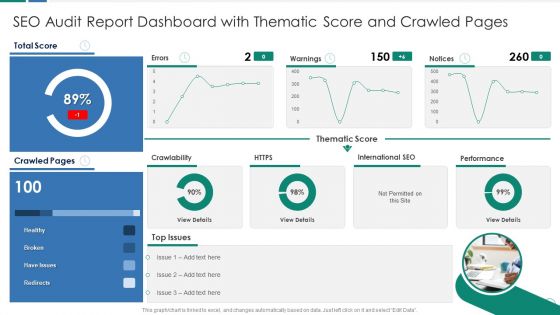
SEO Audit Report Dashboard With Thematic Score And Crawled Pages Download PDF
This graph or chart is linked to excel, and changes automatically based on data. Just left click on it and select Edit Data. Deliver and pitch your topic in the best possible manner with this SEO Audit Report Dashboard With Thematic Score And Crawled Pages Download PDF. Use them to share invaluable insights on Thematic Score Warnings, International SEO Performance, Total Score Healthy and impress your audience. This template can be altered and modified as per your expectations. So, grab it now.
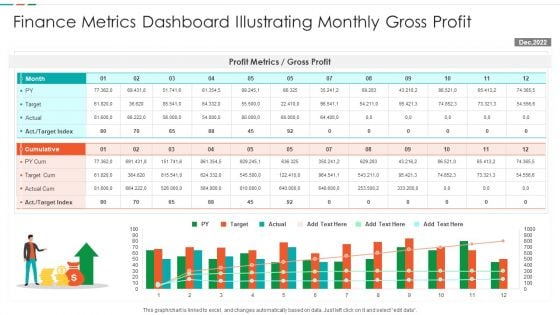
Finance Metrics Dashboard Illustrating Monthly Gross Profit Formats PDF
This graph or chart is linked to excel, and changes automatically based on data. Just left click on it and select edit data. Showcasing this set of slides titled Finance Metrics Dashboard Illustrating Monthly Gross Profit Formats PDF. The topics addressed in these templates are Profit Metrics Gross, Profit Target Cum, Actual Cum Target. All the content presented in this PPT design is completely editable. Download it and make adjustments in color, background, font etc. as per your unique business setting.
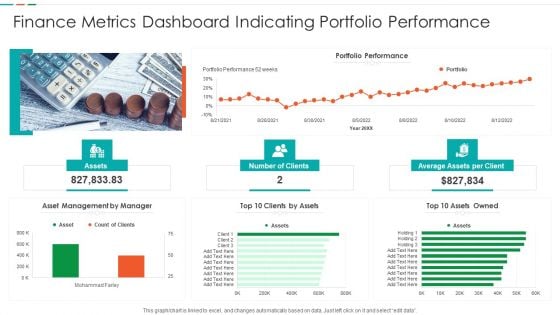
Finance Metrics Dashboard Indicating Portfolio Performance Microsoft PDF
This graph or chart is linked to excel, and changes automatically based on data. Just left click on it and select edit data. Pitch your topic with ease and precision using this Finance Metrics Dashboard Indicating Portfolio Performance Microsoft PDF. This layout presents information on Portfolio Performance Portfolio, Asset Management Manager, Top 10 Assets. It is also available for immediate download and adjustment. So, changes can be made in the color, design, graphics or any other component to create a unique layout.
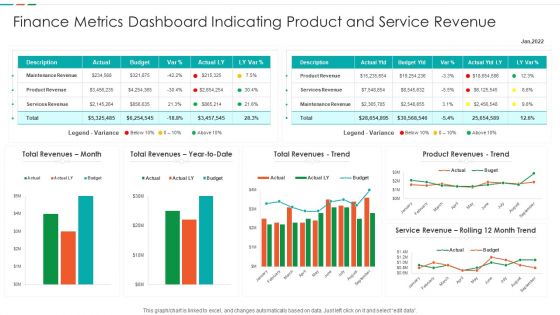
Finance Metrics Dashboard Indicating Product And Service Revenue Designs PDF
This graph or chart is linked to excel, and changes automatically based on data. Just left click on it and select edit data. Showcasing this set of slides titled Finance Metrics Dashboard Indicating Product And Service Revenue Designs PDF. The topics addressed in these templates are Maintenance Revenue Product, Revenue Product Revenues, Service Revenue Rolling. All the content presented in this PPT design is completely editable. Download it and make adjustments in color, background, font etc. as per your unique business setting.
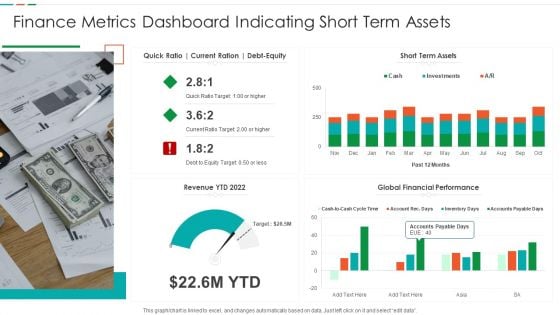
Finance Metrics Dashboard Indicating Short Term Assets Download PDF
This graph or chart is linked to excel, and changes automatically based on data. Just left click on it and select edit data. Pitch your topic with ease and precision using this Finance Metrics Dashboard Indicating Short Term Assets Download PDF. This layout presents information on Short Term Assets, Global Financial Performance, Revenue YTD 2022. It is also available for immediate download and adjustment. So, changes can be made in the color, design, graphics or any other component to create a unique layout.

Healthcare Hospital Performance Data Scorecard With Average Admission Cost Ppt Summary Grid PDF
This graph or chart is linked to excel, and changes automatically based on data. Just left click on it and select Edit Data. Deliver an awe inspiring pitch with this creative Healthcare Hospital Performance Data Scorecard With Average Admission Cost Ppt Summary Grid PDF bundle. Topics like Average Admission Cost, Total Cost Patients, Average Days Admitted, Total Patients Admitted can be discussed with this completely editable template. It is available for immediate download depending on the needs and requirements of the user.
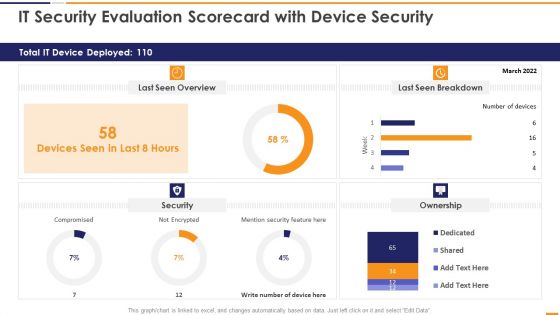
IT Security Evaluation Scorecard With Device Security Ppt Slides Good PDF
This graph or chart is linked to excel, and changes automatically based on data. Just left click on it and select Edit Data. Deliver an awe inspiring pitch with this creative IT Security Evaluation Scorecard With Device Security Ppt Slides Good PDF bundle. Topics like Total IT Device, Last Seen Overview, Last Seen Breakdown, Mention Security Feature can be discussed with this completely editable template. It is available for immediate download depending on the needs and requirements of the user.
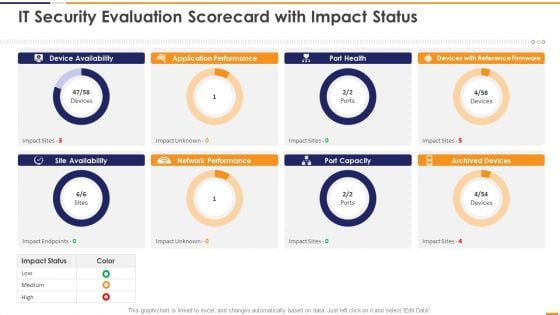
IT Security Evaluation Scorecard With Impact Status Ppt Portfolio Guidelines PDF
This graph or chart is linked to excel, and changes automatically based on data. Just left click on it and select Edit Data. Deliver and pitch your topic in the best possible manner with this IT Security Evaluation Scorecard With Impact Status Ppt Portfolio Guidelines PDF. Use them to share invaluable insights on Device Availability Application, Performance Port Health, Devices Reference Firmware and impress your audience. This template can be altered and modified as per your expectations. So, grab it now.
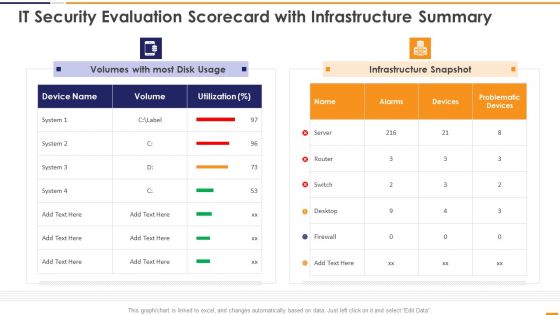
IT Security Evaluation Scorecard With Infrastructure Summary Ppt Slides Portrait PDF
This graph or chart is linked to excel, and changes automatically based on data. Just left click on it and select Edit Data. Deliver an awe inspiring pitch with this creative IT Security Evaluation Scorecard With Infrastructure Summary Ppt Slides Portrait PDF bundle. Topics like Volumes Most Disk, Usage Infrastructure Snapshot can be discussed with this completely editable template. It is available for immediate download depending on the needs and requirements of the user.
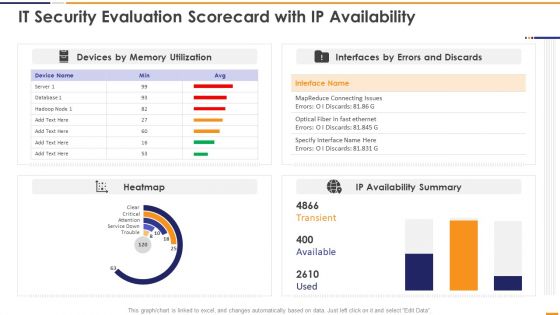
IT Security Evaluation Scorecard With Ip Availability Ppt Pictures Portrait PDF
This graph or chart is linked to excel, and changes automatically based on data. Just left click on it and select Edit Data. Deliver and pitch your topic in the best possible manner with this IT Security Evaluation Scorecard With Ip Availability Ppt Pictures Portrait PDF. Use them to share invaluable insights on Devices Memory Utilization, Interfaces Errors Discards, IP Availability Summary and impress your audience. This template can be altered and modified as per your expectations. So, grab it now.
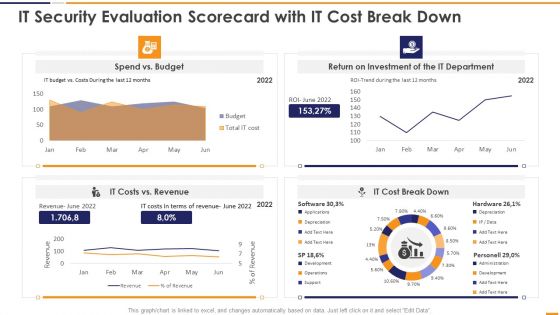
IT Security Evaluation Scorecard With It Cost Break Down Ppt Infographics Slideshow PDF
This graph or chart is linked to excel, and changes automatically based on data. Just left click on it and select Edit Data. Deliver an awe inspiring pitch with this creative IT Security Evaluation Scorecard With It Cost Break Down Ppt Infographics Slideshow PDF bundle. Topics like Spend Vs Budget, Return On Investment, IT Department Revenue, IT Costs Vs can be discussed with this completely editable template. It is available for immediate download depending on the needs and requirements of the user.
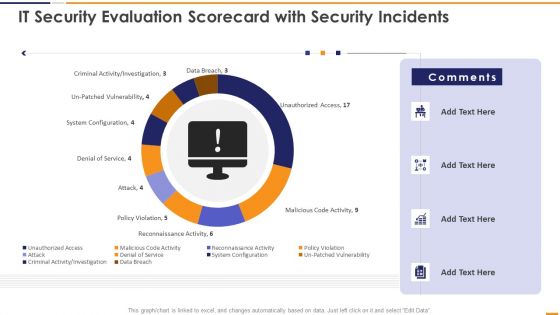
IT Security Evaluation Scorecard With Security Incidents Ppt Pictures Vector PDF
This graph or chart is linked to excel, and changes automatically based on data. Just left click on it and select Edit Data. Deliver and pitch your topic in the best possible manner with this IT Security Evaluation Scorecard With Security Incidents Ppt Pictures Vector PDF. Use them to share invaluable insights on Unauthorized Access Sales, Malicious Code Activity, Reconnaissance Activity Attack and impress your audience. This template can be altered and modified as per your expectations. So, grab it now.
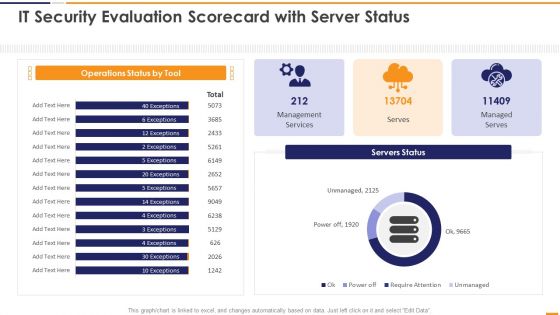
IT Security Evaluation Scorecard With Server Status Ppt Professional Images PDF
This graph or chart is linked to excel, and changes automatically based on data. Just left click on it and select Edit Data. Deliver an awe inspiring pitch with this creative IT Security Evaluation Scorecard With Server Status Ppt Professional Images PDF bundle. Topics like Operations Status Tool, Management Services Managed can be discussed with this completely editable template. It is available for immediate download depending on the needs and requirements of the user.
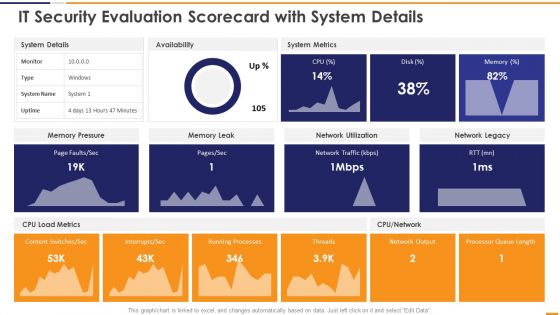
IT Security Evaluation Scorecard With System Details Ppt Inspiration Vector PDF
This graph or chart is linked to excel, and changes automatically based on data. Just left click on it and select Edit Data. Deliver and pitch your topic in the best possible manner with this IT Security Evaluation Scorecard With System Details Ppt Inspiration Vector PDF. Use them to share invaluable insights on System Details Availability, System Metrics Memory, Pressure Memory Leak and impress your audience. This template can be altered and modified as per your expectations. So, grab it now.
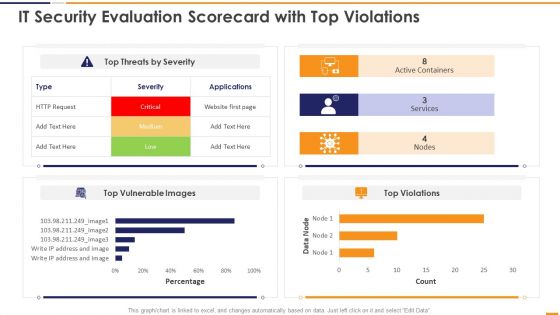
IT Security Evaluation Scorecard With Top Violations Ppt Portfolio Deck PDF
This graph or chart is linked to excel, and changes automatically based on data. Just left click on it and select Edit Data. Deliver an awe inspiring pitch with this creative IT Security Evaluation Scorecard With Top Violations Ppt Portfolio Deck PDF bundle. Topics like Top Threats Severity, Active Containers Services, Top Vulnerable Images can be discussed with this completely editable template. It is available for immediate download depending on the needs and requirements of the user.
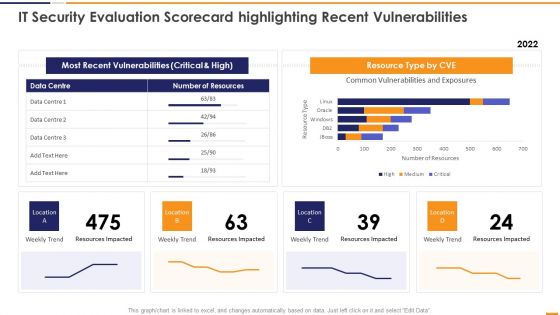
IT Security Evaluation Scorecard Highlighting Recent Vulnerabilities Introduction PDF
This graph or chart is linked to excel, and changes automatically based on data. Just left click on it and select Edit Data. Deliver an awe inspiring pitch with this creative IT Security Evaluation Scorecard Highlighting Recent Vulnerabilities Introduction PDF bundle. Topics like Most Recent Vulnerabilities, Resource Type CVE, Weekly Trend Location can be discussed with this completely editable template. It is available for immediate download depending on the needs and requirements of the user.
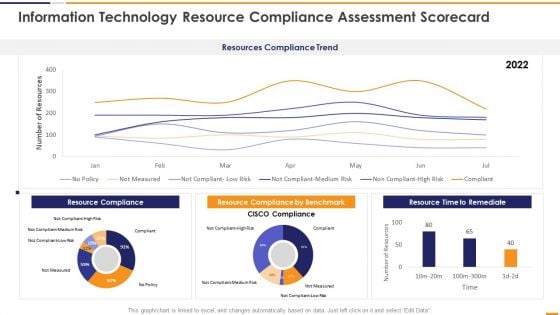
IT Security Evaluation Scorecard Information Technology Resource Compliance Background PDF
This graph or chart is linked to excel, and changes automatically based on data. Just left click on it and select Edit Data. Deliver and pitch your topic in the best possible manner with this IT Security Evaluation Scorecard Information Technology Resource Compliance Background PDF. Use them to share invaluable insights on Resources Compliance Trend, Resource Compliance 2022, Resource Compliance Benchmark, Resource Time Remediate and impress your audience. This template can be altered and modified as per your expectations. So, grab it now.
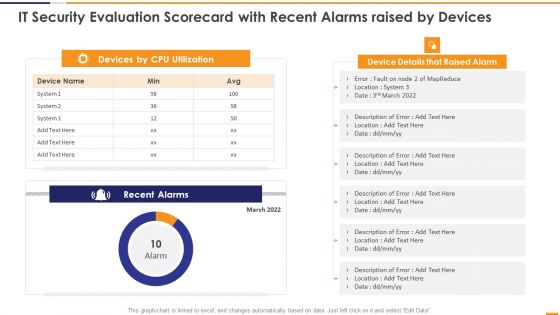
IT Security Evaluation Scorecard With Recent Alarms Raised By Devices Guidelines PDF
This graph or chart is linked to excel, and changes automatically based on data. Just left click on it and select Edit Data. Deliver an awe inspiring pitch with this creative IT Security Evaluation Scorecard With Recent Alarms Raised By Devices Guidelines PDF bundle. Topics like Devices CPU Utilization, Device Details Raised can be discussed with this completely editable template. It is available for immediate download depending on the needs and requirements of the user.

IT Security Evaluation Scorecard With Response Time And Availability Brochure PDF
This graph or chart is linked to excel, and changes automatically based on data. Just left click on it and select Edit Data. Deliver and pitch your topic in the best possible manner with this IT Security Evaluation Scorecard With Response Time And Availability Brochure PDF. Use them to share invaluable insights on Response Time 2022, Disk Utilization Availability and impress your audience. This template can be altered and modified as per your expectations. So, grab it now.
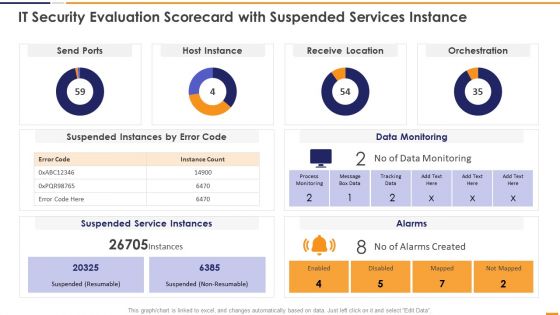
IT Security Evaluation Scorecard With Suspended Services Instance Graphics PDF
This graph or chart is linked to excel, and changes automatically based on data. Just left click on it and select Edit Data. Deliver and pitch your topic in the best possible manner with this IT Security Evaluation Scorecard With Suspended Services Instance Graphics PDF. Use them to share invaluable insights on Send Ports Alarms, Host Instance Orchestration, Receive Location Data and impress your audience. This template can be altered and modified as per your expectations. So, grab it now.
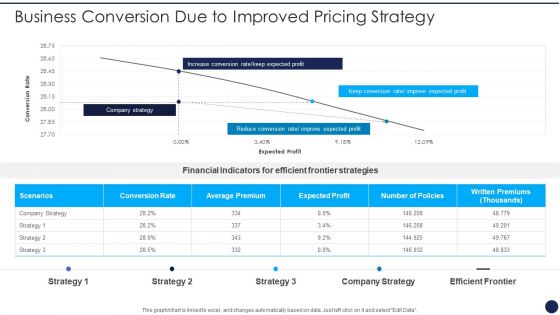
Product Pricing Strategies Analysis Business Conversion Due To Improved Pricing Strategy Slides PDF
This graph or chart is linked to excel, and changes automatically based on data. Just left click on it and select Edit Data. Deliver an awe inspiring pitch with this creative Product Pricing Strategies Analysis Business Conversion Due To Improved Pricing Strategy Slides PDF bundle. Topics like Increase Conversion Rate, Keep Expected Profit, Reduce Conversion Rate, Improve Expected Profit can be discussed with this completely editable template. It is available for immediate download depending on the needs and requirements of the user.
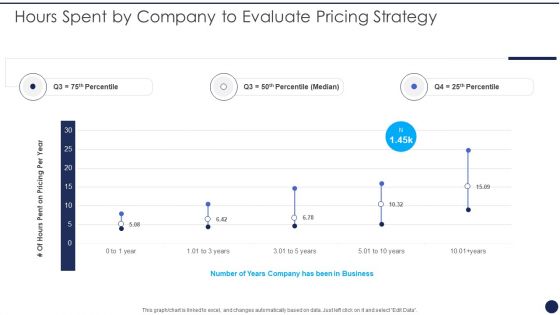
Product Pricing Strategies Analysis Hours Spent By Company To Evaluate Pricing Strategy Professional PDF
This graph or chart is linked to excel, and changes automatically based on data. Just left click on it and select Edit Data. Deliver an awe inspiring pitch with this creative Product Pricing Strategies Analysis Hours Spent By Company To Evaluate Pricing Strategy Professional PDF bundle. Topics like Pricing Per Year, Number Years Business can be discussed with this completely editable template. It is available for immediate download depending on the needs and requirements of the user.
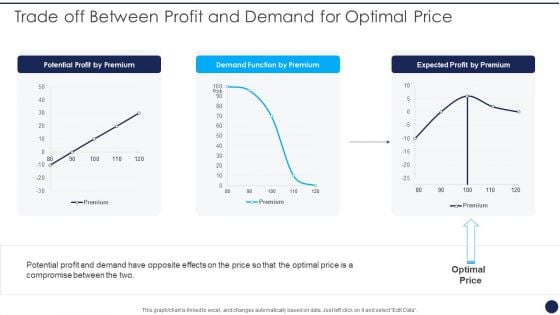
Product Pricing Strategies Analysis Trade Off Between Profit And Demand For Optimal Price Portrait PDF
This graph or chart is linked to excel, and changes automatically based on data. Just left click on it and select Edit Data. Deliver and pitch your topic in the best possible manner with this Product Pricing Strategies Analysis Trade Off Between Profit And Demand For Optimal Price Portrait PDF. Use them to share invaluable insights on Potential Profit Premium, Demand Function Premium and impress your audience. This template can be altered and modified as per your expectations. So, grab it now.
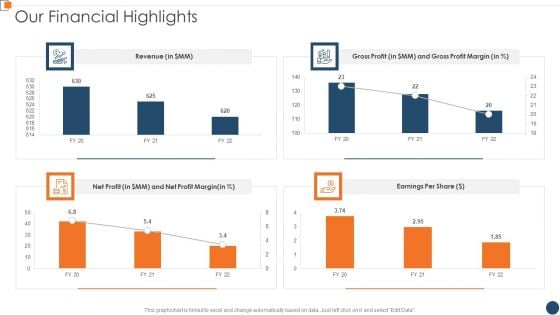
BANT Sales Lead Qualification Model Our Financial Highlights Background PDF
This graph or chart is linked to excel and change automatically based on data. Just left click on it and select Edit Data. Deliver an awe inspiring pitch with this creative BANT Sales Lead Qualification Model Our Financial Highlights Background PDF bundle. Topics like Gross Profit, Net Profit, Earnings Per can be discussed with this completely editable template. It is available for immediate download depending on the needs and requirements of the user.

 Home
Home