Graph Icon
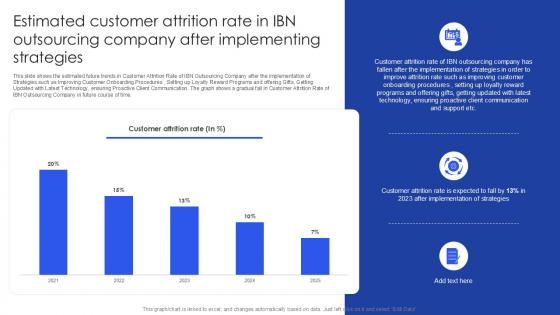
Estimated Customer Attrition Rate In IBN Outsourcing Company PPT PowerPoint SS
This slide shows the estimated future trends in Customer Attrition Rate of IBN Outsourcing Company after the implementation of Strategies such as Improving Customer Onboarding Procedures , Setting up Loyalty Reward Programs and offering Gifts, Getting Updated with Latest Technology, ensuring Proactive Client Communication. The graph shows a gradual fall in Customer Attrition Rate of IBN Outsourcing Company in future course of time. Slidegeeks is here to make your presentations a breeze with Estimated Customer Attrition Rate In IBN Outsourcing Company PPT PowerPoint SS With our easy-to-use and customizable templates, you can focus on delivering your ideas rather than worrying about formatting. With a variety of designs to choose from, you are sure to find one that suits your needs. And with animations and unique photos, illustrations, and fonts, you can make your presentation pop. So whether you are giving a sales pitch or presenting to the board, make sure to check out Slidegeeks first This slide shows the estimated future trends in Customer Attrition Rate of IBN Outsourcing Company after the implementation of Strategies such as Improving Customer Onboarding Procedures , Setting up Loyalty Reward Programs and offering Gifts, Getting Updated with Latest Technology, ensuring Proactive Client Communication. The graph shows a gradual fall in Customer Attrition Rate of IBN Outsourcing Company in future course of time.
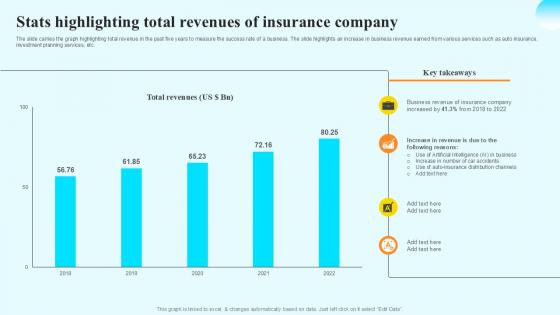
Stats Highlighting Total Revenues Steps By Step Guide For Claiming Car PPT Slide
The slide carries the graph highlighting total revenue in the past five years to measure the success rate of a business. The slide highlights an increase in business revenue earned from various services such as auto insurance, investment planning services, etc. Welcome to our selection of the Stats Highlighting Total Revenues Steps By Step Guide For Claiming Car PPT Slide. These are designed to help you showcase your creativity and bring your sphere to life. Planning and Innovation are essential for any business that is just starting out. This collection contains the designs that you need for your everyday presentations. All of our PowerPoints are 100Percent editable, so you can customize them to suit your needs. This multi-purpose template can be used in various situations. Grab these presentation templates today. The slide carries the graph highlighting total revenue in the past five years to measure the success rate of a business. The slide highlights an increase in business revenue earned from various services such as auto insurance, investment planning services, etc.
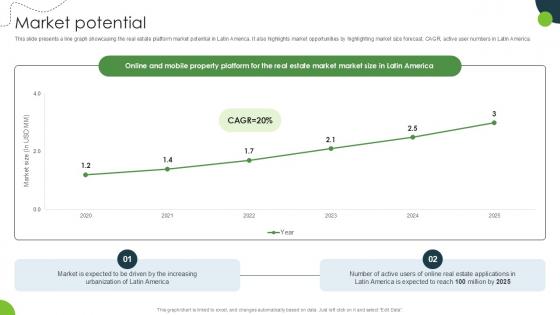
Market Potential Land And Property Marketplace Pitch Deck PPT Sample
This slide presents a line graph showcasing the real estate platform market potential in Latin America. It also highlights market opportunities by highlighting market size forecast, CAGR, active user numbers in Latin America. Are you in need of a template that can accommodate all of your creative concepts This one is crafted professionally and can be altered to fit any style. Use it with Google Slides or PowerPoint. Include striking photographs, symbols, depictions, and other visuals. Fill, move around, or remove text boxes as desired. Test out color palettes and font mixtures. Edit and save your work, or work with colleagues. Download Market Potential Land And Property Marketplace Pitch Deck PPT Sample and observe how to make your presentation outstanding. Give an impeccable presentation to your group and make your presentation unforgettable. This slide presents a line graph showcasing the real estate platform market potential in Latin America. It also highlights market opportunities by highlighting market size forecast, CAGR, active user numbers in Latin America.
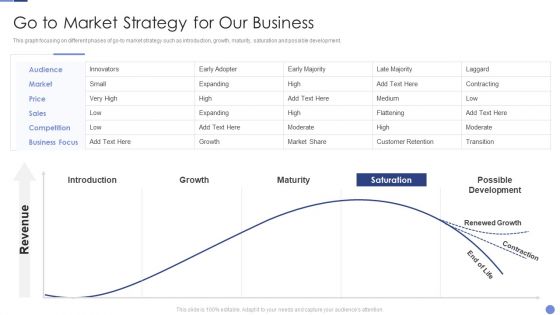
Go To Market Strategy For Our Business Resolving Chicken And Egg Problem In Organization Portrait PDF
This graph focusing on different phases of go-to market strategy such as introduction, growth, maturity, saturation and possible development.Deliver an awe inspiring pitch with this creative Go To Market Strategy For Our Business Resolving Chicken And Egg Problem In Organization Portrait PDF bundle. Topics like Introduction, Maturity, Possible Development can be discussed with this completely editable template. It is available for immediate download depending on the needs and requirements of the user.
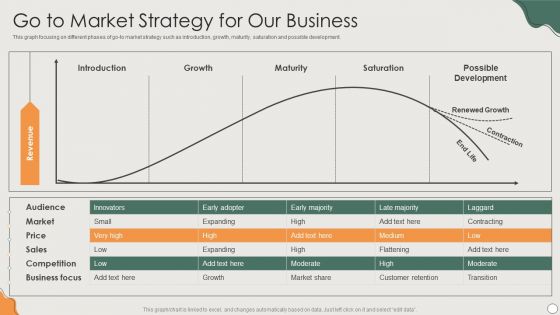
Platform Business Model Implementation In Firm Go To Market Strategy For Our Business Introduction PDF
This graph focusing on different phases of go-to market strategy such as introduction, growth, maturity, saturation and possible development.Deliver an awe inspiring pitch with this creative Platform Business Model Implementation In Firm Go To Market Strategy For Our Business Introduction PDF bundle. Topics like Introduction, Possible Development, Saturation can be discussed with this completely editable template. It is available for immediate download depending on the needs and requirements of the user.
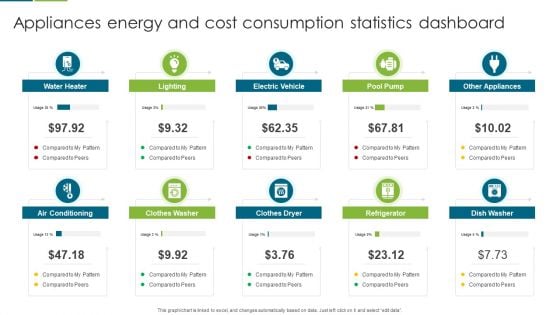
Appliances Energy And Cost Consumption Statistics Dashboard Download PDF
This graph or chart is linked to excel, and changes automatically based on data. Just left click on it and select edit data. Presenting Appliances Energy And Cost Consumption Statistics Dashboard Download PDF to dispense important information. This template comprises ten stages. It also presents valuable insights into the topics including Water Heater, Electric Vehicle, Pool Pump. This is a completely customizable PowerPoint theme that can be put to use immediately. So, download it and address the topic impactfully.
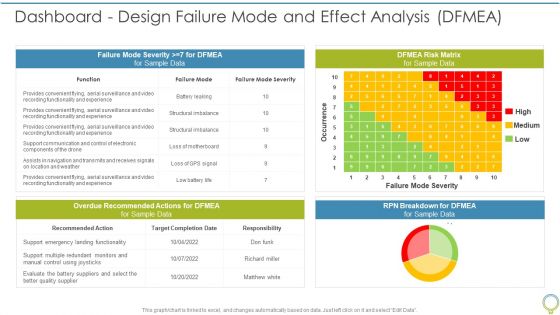
FMEA To Determine Potential Dashboard Design Failure Mode And Effect Analysis DFMEA Ppt Show Styles PDF
This graph or chart is linked to excel, and changes automatically based on data. Just left click on it and select Edit Data. Deliver an awe inspiring pitch with this creative FMEA To Determine Potential Dashboard Design Failure Mode And Effect Analysis DFMEA Ppt Show Styles PDF bundle. Topics like Target Completion, Recommended Action, RPN Breakdown can be discussed with this completely editable template. It is available for immediate download depending on the needs and requirements of the user.
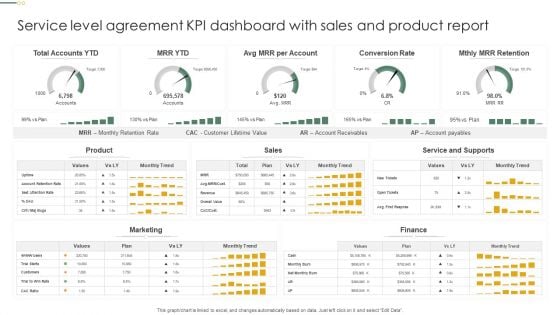
Service Level Agreement KPI Dashboard With Sales And Product Report Clipart PDF
This graph or chart is linked to excel, and changes automatically based on data. Just left click on it and select Edit Data. Showcasing this set of slides titled Service Level Agreement KPI Dashboard With Sales And Product Report Clipart PDF. The topics addressed in these templates are Total Accounts YTD, Conversion Rate, Mthly MRR Retention. All the content presented in this PPT design is completely editable. Download it and make adjustments in color, background, font etc. as per your unique business setting.
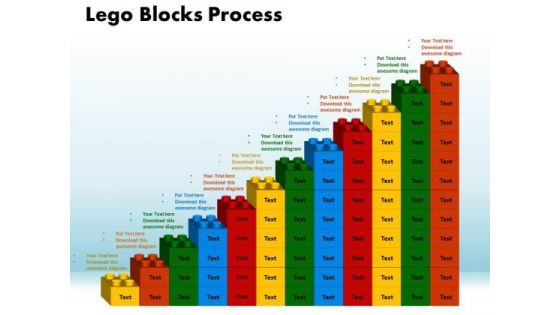
PowerPoint Process Lego Blocks Process Success Ppt Slides
PowerPoint Process Lego Blocks Process Success PPT Slides-This Business PowerPoint diagram consists of bar Graph of Lego blocks which is monotonically increasing. It refers to the Financial Growth of the Business. It Portrays the concept of Construction, Manufacturing, Design, Retail Market and Business Consultants.-PowerPoint Process Lego Blocks Process Success PPT Slides Spread your ideas far and wide. Our PowerPoint Process Lego Blocks Process Success Ppt Slides are dependable carriers.
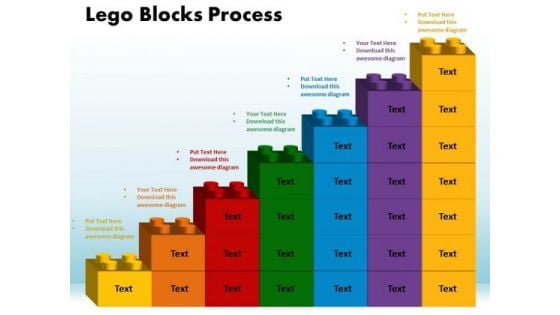
PowerPoint Template Lego Blocks Process Business Ppt Template
PowerPoint Template Lego Blocks Process Business PPT template-This PowerPoint diagram Consists of Lego Bar Graph which is Monotonically Increasing. Lego is a children's toy used for building models with small colorful plastic bricks that fit together and come apart again. It signifies action figure, balloon, beanbag, brick, building block, cap, catapult, Dinky Toy, dollhouse, doll Arouse their curiosity with our PowerPoint Template Lego Blocks Process Business Ppt Template. Your thoughts will provide the answers.
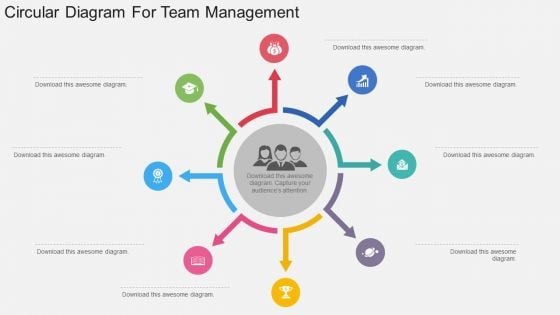
Circular Diagram For Team Management Powerpoint Template
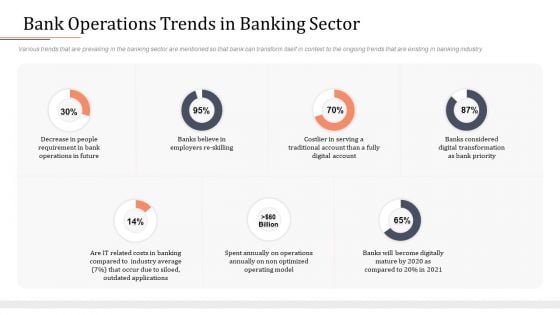
Modifying Banking Functionalities Bank Operations Trends In Banking Sector Professional PDF
Various trends that are prevailing in the banking sector are mentioned so that bank can transform itself in context to the ongoing trends that are existing in banking industry. Deliver an awe inspiring pitch with this creative enhancing financial institution operations bank operations trends in banking sector icons pdf bundle. Topics like digital, serving, priority, industry, operations can be discussed with this completely editable template. It is available for immediate download depending on the needs and requirements of the user.

Oracle Analytics Cloud Solutions Smart Mobile Sample PDF
This slide represents the predictive analytics solution of the oracle analytics cloud and how it is helpful to predict outputs and display quickly with the help of ML. Deliver and pitch your topic in the best possible manner with this oracle analytics cloud solutions predictive analytics icons pdf. Use them to share invaluable insights on oracle analytics cloud solutions smart mobile and impress your audience. This template can be altered and modified as per your expectations. So, grab it now.
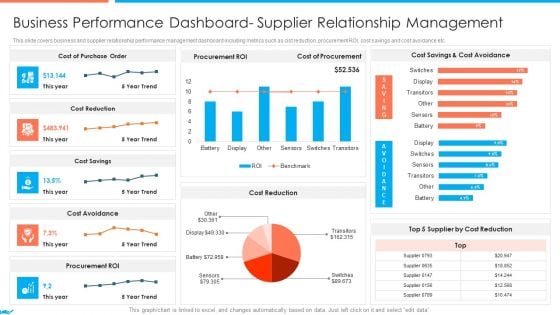
Supplier Association Management Techniques Business Performance Dashboard Portrait PDF
This slide covers business and supplier relationship performance management dashboard including metrics such as cist reduction, procurement ROI, cost savings and cost avoidance etc. Deliver an awe inspiring pitch with this creative icons slide for supplier association management techniques introduction pdf bundle. Topics like supplier association management techniques supplier performance management kpi dashboards guidelines pdf can be discussed with this completely editable template. It is available for immediate download depending on the needs and requirements of the user.
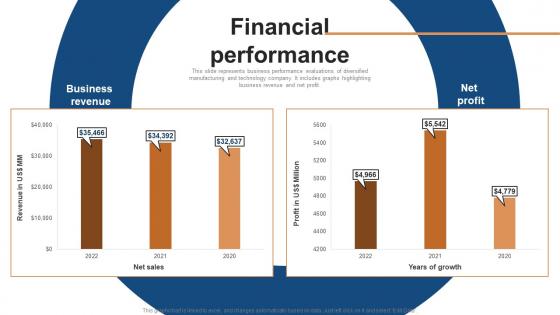
Financial Performance Conglomerate Company Fund Raising Pitch Deck Background Pdf
This slide represents business performance evaluations of diversified manufacturing and technology company. It includes graphs highlighting business revenue and net profit. From laying roadmaps to briefing everything in detail, our templates are perfect for you. You can set the stage with your presentation slides. All you have to do is download these easy-to-edit and customizable templates. Financial Performance Conglomerate Company Fund Raising Pitch Deck Background Pdf will help you deliver an outstanding performance that everyone would remember and praise you for. Do download this presentation today. This slide represents business performance evaluations of diversified manufacturing and technology company. It includes graphs highlighting business revenue and net profit.
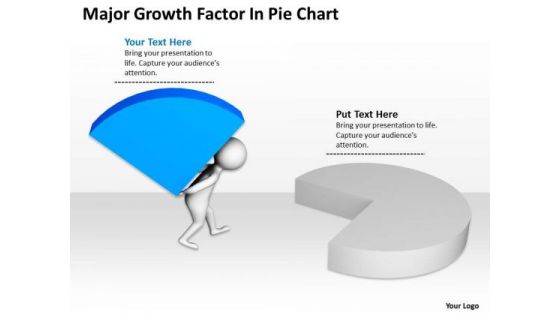
Business People Pictures Growth Factor Pie Chart PowerPoint Templates Ppt Backgrounds For Slides
We present our business people pictures growth factor pie chart PowerPoint templates PPT backgrounds for slides.Download our Success PowerPoint Templates because You can Create a matrix with our PowerPoint Templates and Slides. Feel the strength of your ideas click into place. Download our People PowerPoint Templates because They will bring a lot to the table. Their alluring flavours will make your audience salivate. Present our Business PowerPoint Templates because You have a driving passion to excel in your field. Our PowerPoint Templates and Slides will prove ideal vehicles for your ideas. Use our Finance PowerPoint Templates because Our PowerPoint Templates and Slides will generate and maintain the level of interest you desire. They will create the impression you want to imprint on your audience. Present our Marketing PowerPoint Templates because you can Set pulses racing with our PowerPoint Templates and Slides. They will raise the expectations of your team.Use these PowerPoint slides for presentations relating to icon, budget, investor, team, graph, pie, money, 3d, white, group, human, depositor, percent, guy, slice, activity, rate, business, contribution, deposit, contributor, teamwork, diagram, character, match, percentage, interest, finance, stock, bank, push, people, integration, idea, participant, economic, chart, share, person, together, profit, part, investment, assets, man, financial, economical, businessman, participation, capital. The prominent colors used in the PowerPoint template are Blue, Gray, Black. Branch out with our Business People Pictures Growth Factor Pie Chart PowerPoint Templates Ppt Backgrounds For Slides. You will come out on top.
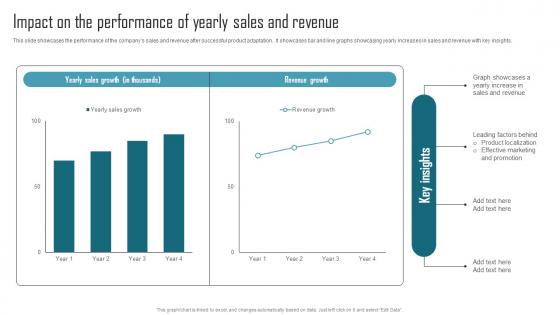
Effective Product Adaptation Impact On The Performance Of Yearly Sales And Revenue Introduction PDF
This slide showcases the performance of the companys sales and revenue after successful product adaptation.. It showcases bar and line graphs showcasing yearly increases in sales and revenue with key insights. Retrieve professionally designed Effective Product Adaptation Impact On The Performance Of Yearly Sales And Revenue Introduction PDF to effectively convey your message and captivate your listeners. Save time by selecting pre-made slideshows that are appropriate for various topics, from business to educational purposes. These themes come in many different styles, from creative to corporate, and all of them are easily adjustable and can be edited quickly. Access them as PowerPoint templates or as Google Slides themes. You do not have to go on a hunt for the perfect presentation because Slidegeeks got you covered from everywhere. This slide showcases the performance of the companys sales and revenue after successful product adaptation.. It showcases bar and line graphs showcasing yearly increases in sales and revenue with key insights.
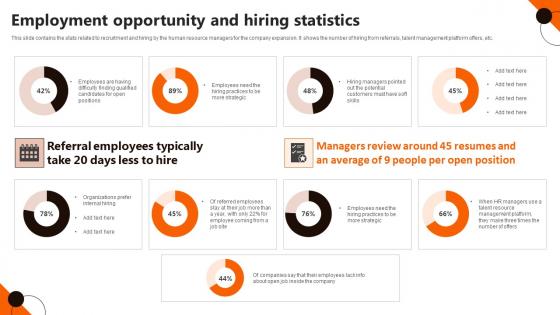
Employment Opportunity And Hiring Statistics Themes Pdf
Pitch your topic with ease and precision using this Employment Opportunity And Hiring Statistics Themes Pdf. This layout presents information on Employment Opportunity, Hiring Statistics. It is also available for immediate download and adjustment. So, changes can be made in the color, design, graphics or any other component to create a unique layout. This slide contains the stats related to recruitment and hiring by the human resource managers for the company expansion. It shows the number of hiring from referrals, talent management platform offers, etc.
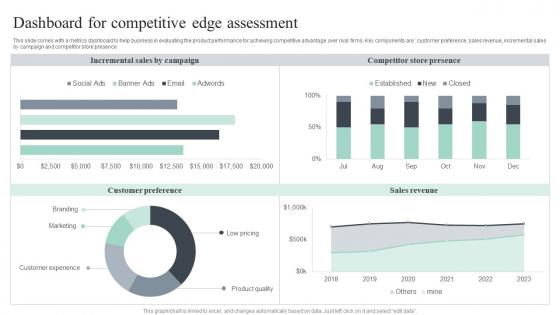
Dashboard For Competitive Edge Assessment Themes Pdf
This slide comes with a metrics dashboard to help business in evaluating the product performance for achieving competitive advantage over rival firms. Key components are customer preference, sales revenue, incremental sales by campaign and competitor store presence Pitch your topic with ease and precision using this Dashboard For Competitive Edge Assessment Themes Pdf. This layout presents information on Incremental Sales, Competitor Store Presence, Sales Revenue. It is also available for immediate download and adjustment. So, changes can be made in the color, design, graphics or any other component to create a unique layout. This slide comes with a metrics dashboard to help business in evaluating the product performance for achieving competitive advantage over rival firms. Key components are customer preference, sales revenue, incremental sales by campaign and competitor store presence
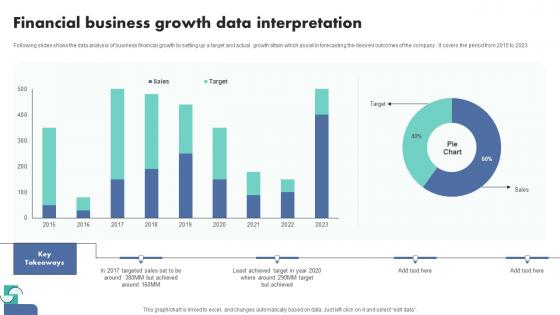
Financial Business Growth Data Interpretation Themes Pdf
Following slides shows the data analysis of business financial growth by setting up a target and actual growth attain which assist in forecasting the desired outcomes of the company . It covers the period from 2015 to 2023.Pitch your topic with ease and precision using this Financial Business Growth Data Interpretation Themes Pdf This layout presents information on Financial Business, Growth Data Interpretation It is also available for immediate download and adjustment. So, changes can be made in the color, design, graphics or any other component to create a unique layout. Following slides shows the data analysis of business financial growth by setting up a target and actual growth attain which assist in forecasting the desired outcomes of the company . It covers the period from 2015 to 2023.
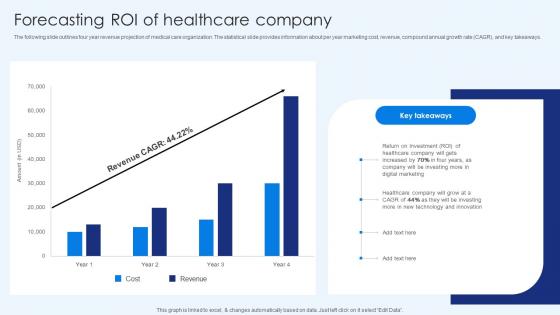
Forecasting Roi Of Healthcare Company Healthcare Promotion Themes Pdf
The following slide outlines four year revenue projection of medical care organization. The statistical slide provides information about per year marketing cost, revenue, compound annual growth rate CAGR, and key takeaways. Find highly impressive Forecasting Roi Of Healthcare Company Healthcare Promotion Themes Pdf on Slidegeeks to deliver a meaningful presentation. You can save an ample amount of time using these presentation templates. No need to worry to prepare everything from scratch because Slidegeeks experts have already done a huge research and work for you. You need to download Forecasting Roi Of Healthcare Company Healthcare Promotion Themes Pdf for your upcoming presentation. All the presentation templates are 100 percent editable and you can change the color and personalize the content accordingly. Download now The following slide outlines four year revenue projection of medical care organization. The statistical slide provides information about per year marketing cost, revenue, compound annual growth rate CAGR, and key takeaways.
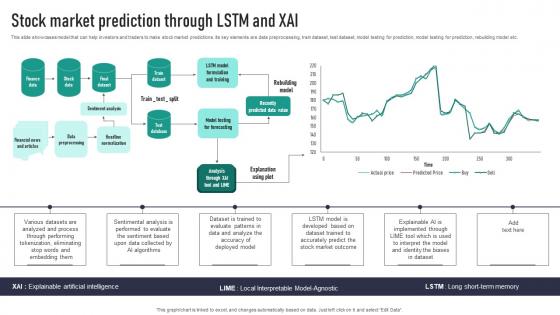
Stock Market Prediction Through LSTM And XAI Themes Pdf
This slide showcases model that can help investors and traders to make stock market predictions. Its key elements are data preprocessing, train dataset, test dataset, model testing for prediction, model testing for prediction, rebuilding model etc. Want to ace your presentation in front of a live audience Our Stock Market Prediction Through LSTM And XAI Themes Pdf can help you do that by engaging all the users towards you. Slidegeeks experts have put their efforts and expertise into creating these impeccable powerpoint presentations so that you can communicate your ideas clearly. Moreover, all the templates are customizable, and easy-to-edit and downloadable. Use these for both personal and commercial use. This slide showcases model that can help investors and traders to make stock market predictions. Its key elements are data preprocessing, train dataset, test dataset, model testing for prediction, model testing for prediction, rebuilding model etc.
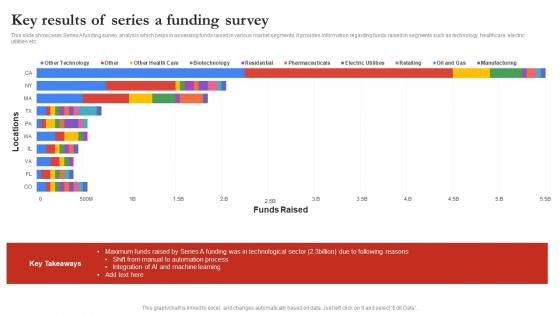
Key Results Of Series A Funding Survey Themes Pdf
This slide showcases Series A funding survey analysis which helps in assessing funds raised in various market segments. It provides information regarding funds raised in segments such as technology, healthcare, electric utilities etc. Pitch your topic with ease and precision using this Key Results Of Series A Funding Survey Themes Pdf. This layout presents information on Automation Process, Key Results, Series A Funding Survey. It is also available for immediate download and adjustment. So, changes can be made in the color, design, graphics or any other component to create a unique layout. This slide showcases Series A funding survey analysis which helps in assessing funds raised in various market segments. It provides information regarding funds raised in segments such as technology, healthcare, electric utilities etc.
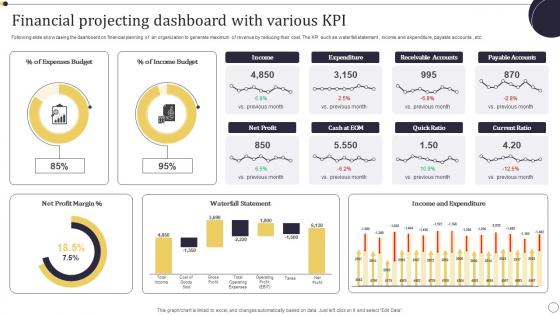
Financial Projecting Dashboard With Various KPI Themes Pdf
Following slide showcasing the dashboard on financial planning of an organization to generate maximum of revenue by reducing their cost. The KPI such as waterfall statement , income and expenditure, payable accounts , etc . Pitch your topic with ease and precision using this Financial Projecting Dashboard With Various KPI Themes Pdf. This layout presents information on Income Budget, Expenses Budget, Net Profit Margin. It is also available for immediate download and adjustment. So, changes can be made in the color, design, graphics or any other component to create a unique layout. Following slide showcasing the dashboard on financial planning of an organization to generate maximum of revenue by reducing their cost. The KPI such as waterfall statement , income and expenditure, payable accounts , etc .

Sales Outreach Challenges With Effective Solution Themes Pdf
Mentioned slide displays multiple challenges faced by business in sales communication with respective solution to achieve business milestones. It includes challenges such as lead generation, website management, low budget, developing targeting content and obsolete technology. Pitch your topic with ease and precision using this Sales Outreach Challenges With Effective Solution Themes Pdf. This layout presents information on Sales Outreach Challenges, Developing Targeting Content, Obsolete Technology. It is also available for immediate download and adjustment. So, changes can be made in the color, design, graphics or any other component to create a unique layout. Mentioned slide displays multiple challenges faced by business in sales communication with respective solution to achieve business milestones. It includes challenges such as lead generation, website management, low budget, developing targeting content and obsolete technology.
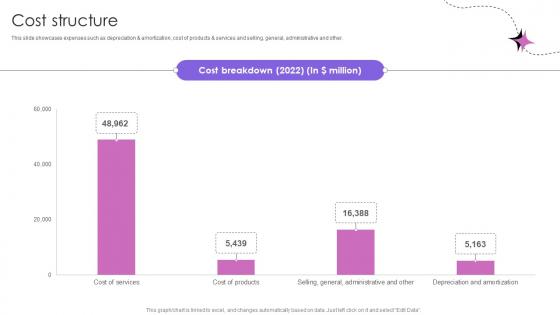
Cost Structure Theme Park And Attractions Providing Company Business Model BMC SS V
This slide showcases expenses such as depreciation and amortization, cost of products and services and selling, general, administrative and other. Create an editable Cost Structure Theme Park And Attractions Providing Company Business Model BMC SS V that communicates your idea and engages your audience. Whether you are presenting a business or an educational presentation, pre-designed presentation templates help save time. Cost Structure Theme Park And Attractions Providing Company Business Model BMC SS V is highly customizable and very easy to edit, covering many different styles from creative to business presentations. Slidegeeks has creative team members who have crafted amazing templates. So, go and get them without any delay. This slide showcases expenses such as depreciation and amortization, cost of products and services and selling, general, administrative and other.
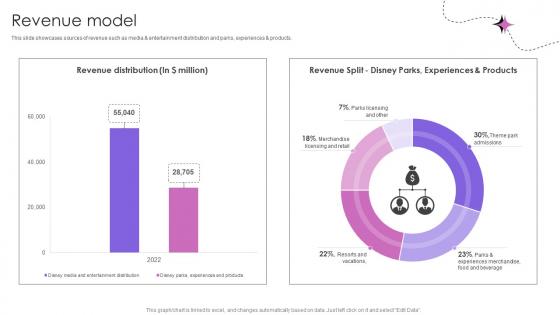
Revenue Model Theme Park And Attractions Providing Company Business Model BMC SS V
This slide showcases sources of revenue such as media and entertainment distribution and parks, experiences and products. Create an editable Revenue Model Theme Park And Attractions Providing Company Business Model BMC SS V that communicates your idea and engages your audience. Whether you are presenting a business or an educational presentation, pre-designed presentation templates help save time. Revenue Model Theme Park And Attractions Providing Company Business Model BMC SS V is highly customizable and very easy to edit, covering many different styles from creative to business presentations. Slidegeeks has creative team members who have crafted amazing templates. So, go and get them without any delay. This slide showcases sources of revenue such as media and entertainment distribution and parks, experiences and products.
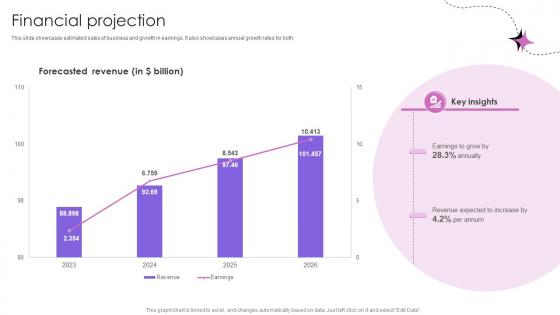
Financial Projection Theme Park And Attractions Providing Company Business Model BMC SS V
This slide showcases estimated sales of business and growth in earnings. It also showcases annual growth rates for both. There are so many reasons you need a Financial Projection Theme Park And Attractions Providing Company Business Model BMC SS V. The first reason is you can not spend time making everything from scratch, Thus, Slidegeeks has made presentation templates for you too. You can easily download these templates from our website easily. This slide showcases estimated sales of business and growth in earnings. It also showcases annual growth rates for both.
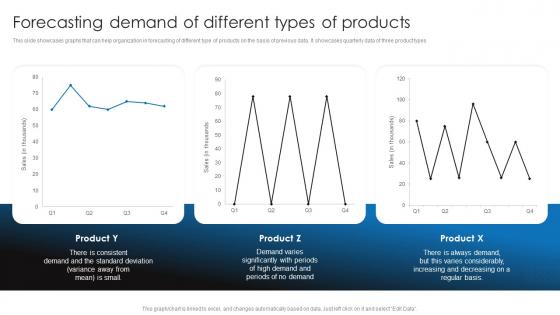
Forecasting Demand Of Different Types Of Retail Stock Administration Strategies Topic Pdf
This slide showcases graphs that can help organization in forecasting of different type of products on the basis of previous data. It showcases quarterly data of three product types.The best PPT templates are a great way to save time, energy, and resources. Slidegeeks have 100Precent editable powerpoint slides making them incredibly versatile. With these quality presentation templates, you can create a captivating and memorable presentation by combining visually appealing slides and effectively communicating your message. Download Forecasting Demand Of Different Types Of Retail Stock Administration Strategies Topic Pdf from Slidegeeks and deliver a wonderful presentation. This slide showcases graphs that can help organization in forecasting of different type of products on the basis of previous data. It showcases quarterly data of three product types
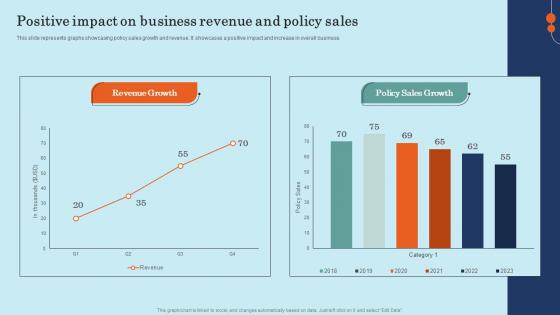
Positive Impact On Business Revenue And Policy Sales Effective General Insurance Marketing Microsoft Pdf
This slide represents graphs showcasing policy sales growth and revenue. It showcases a positive impact and increase in overall business.Find highly impressive Positive Impact On Business Revenue And Policy Sales Effective General Insurance Marketing Microsoft Pdf on Slidegeeks to deliver a meaningful presentation. You can save an ample amount of time using these presentation templates. No need to worry to prepare everything from scratch because Slidegeeks experts have already done a huge research and work for you. You need to download Positive Impact On Business Revenue And Policy Sales Effective General Insurance Marketing Microsoft Pdf for your upcoming presentation. All the presentation templates are 100Precent editable and you can change the color and personalize the content accordingly. Download now. This slide represents graphs showcasing policy sales growth and revenue. It showcases a positive impact and increase in overall business.
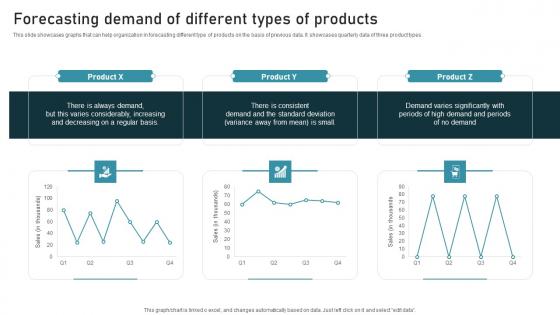
Forecasting Demand Inventory Administration Techniques For Enhanced Stock Accuracy Elements Pdf
This slide showcases graphs that can help organization in forecasting different type of products on the basis of previous data. It showcases quarterly data of three product types. Crafting an eye catching presentation has never been more straightforward. Let your presentation shine with this tasteful yet straightforward Forecasting Demand Inventory Administration Techniques For Enhanced Stock Accuracy Elements Pdf template. It offers a minimalistic and classy look that is great for making a statement. The colors have been employed intelligently to add a bit of playfulness while still remaining professional. Construct the ideal Forecasting Demand Inventory Administration Techniques For Enhanced Stock Accuracy Elements Pdf that effortlessly grabs the attention of your audience Begin now and be certain to wow your customers This slide showcases graphs that can help organization in forecasting different type of products on the basis of previous data. It showcases quarterly data of three product types.
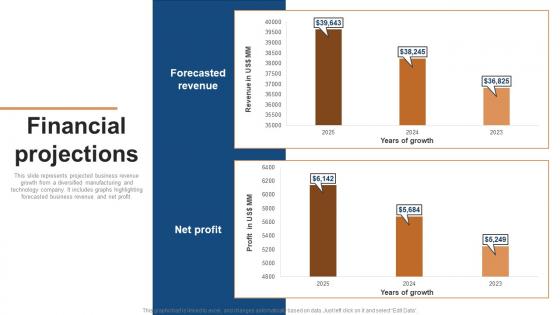
Financial Projections Conglomerate Company Fund Raising Pitch Deck Background Pdf
This slide represents projected business revenue growth from a diversified manufacturing and technology company. It includes graphs highlighting forecasted business revenue and net profit. Present like a pro with Financial Projections Conglomerate Company Fund Raising Pitch Deck Background Pdf Create beautiful presentations together with your team, using our easy-to-use presentation slides. Share your ideas in real-time and make changes on the fly by downloading our templates. So whether you are in the office, on the go, or in a remote location, you can stay in sync with your team and present your ideas with confidence. With Slidegeeks presentation got a whole lot easier. Grab these presentations today. This slide represents projected business revenue growth from a diversified manufacturing and technology company. It includes graphs highlighting forecasted business revenue and net profit.
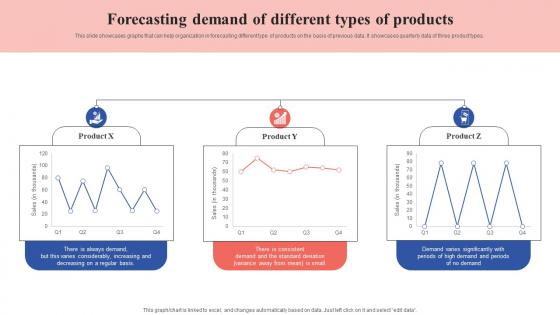
Forecasting Demand Of Different Types Of Products Tactical Guide Stock Administration Microsoft Pdf
This slide showcases graphs that can help organization in forecasting different type of products on the basis of previous data. It showcases quarterly data of three product types. If your project calls for a presentation, then Slidegeeks is your go-to partner because we have professionally designed, easy-to-edit templates that are perfect for any presentation. After downloading, you can easily edit Forecasting Demand Of Different Types Of Products Tactical Guide Stock Administration Microsoft Pdf and make the changes accordingly. You can rearrange slides or fill them with different images. Check out all the handy templates This slide showcases graphs that can help organization in forecasting different type of products on the basis of previous data. It showcases quarterly data of three product types.
Paid Media Advertising Marketing Performance Tracking Dashboard Clipart Pdf
This slide illustrates dashboard measuring performance of paid media advertising aimed at making quicker marketing decisions, boost sales by increasing brand value. It covers performance of key marketing metrics with graphs and data from ads Pitch your topic with ease and precision using this Paid Media Advertising Marketing Performance Tracking Dashboard Clipart Pdf. This layout presents information on Cost, Impressions, Clicks . It is also available for immediate download and adjustment. So, changes can be made in the color, design, graphics or any other component to create a unique layout. This slide illustrates dashboard measuring performance of paid media advertising aimed at making quicker marketing decisions, boost sales by increasing brand value. It covers performance of key marketing metrics with graphs and data from ads
Executing And Monitoring Project Using Project Management Dashboard For Tracking PM SS V
This slide showcases dashboard for tracing project performance. This template focuses on changing the status of each task and graphs automatically tracking overall status. It covers aspects related to task priority, budget, etc. Slidegeeks has constructed Executing And Monitoring Project Using Project Management Dashboard For Tracking PM SS V after conducting extensive research and examination. These presentation templates are constantly being generated and modified based on user preferences and critiques from editors. Here, you will find the most attractive templates for a range of purposes while taking into account ratings and remarks from users regarding the content. This is an excellent jumping-off point to explore our content and will give new users an insight into our top-notch PowerPoint Templates. This slide showcases dashboard for tracing project performance. This template focuses on changing the status of each task and graphs automatically tracking overall status. It covers aspects related to task priority, budget, etc.
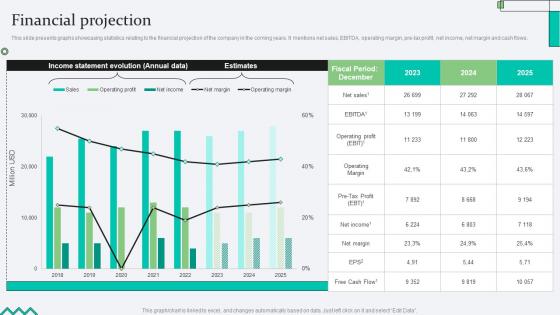
Financial Projection Biopharma Research Organization Pitch Deck
This slide presents graphs showcasing statistics relating to the financial projection of the company in the coming years. It mentions net sales, EBITDA, operating margin, pre-tax profit, net income, net margin and cash flows. Slidegeeks is here to make your presentations a breeze with Financial Projection Biopharma Research Organization Pitch Deck With our easy-to-use and customizable templates, you can focus on delivering your ideas rather than worrying about formatting. With a variety of designs to choose from, you are sure to find one that suits your needs. And with animations and unique photos, illustrations, and fonts, you can make your presentation pop. So whether you are giving a sales pitch or presenting to the board, make sure to check out Slidegeeks first This slide presents graphs showcasing statistics relating to the financial projection of the company in the coming years. It mentions net sales, EBITDA, operating margin, pre-tax profit, net income, net margin and cash flows.
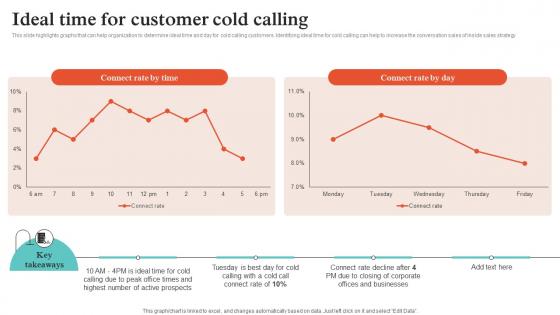
Virtual Sales Strategies Ideal Time For Customer Cold Calling Strategy SS V
This slide highlights graphs that can help organization to determine ideal time and day for cold calling customers. Identifying ideal time for cold calling can help to increase the conversation sales of inside sales strategy. The Virtual Sales Strategies Ideal Time For Customer Cold Calling Strategy SS V is a compilation of the most recent design trends as a series of slides. It is suitable for any subject or industry presentation, containing attractive visuals and photo spots for businesses to clearly express their messages. This template contains a variety of slides for the user to input data, such as structures to contrast two elements, bullet points, and slides for written information. Slidegeeks is prepared to create an impression. This slide highlights graphs that can help organization to determine ideal time and day for cold calling customers. Identifying ideal time for cold calling can help to increase the conversation sales of inside sales strategy.
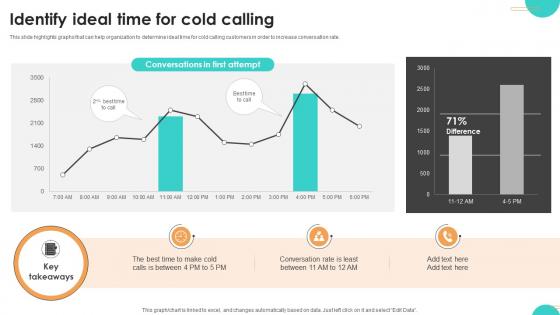
Ultimate Guide To Cold Identify Ideal Time For Cold Calling SA SS V
This slide highlights graphs that can help organization to determine ideal time for cold calling customers in order to increase conversation rate. Explore a selection of the finest Ultimate Guide To Cold Identify Ideal Time For Cold Calling SA SS V here. With a plethora of professionally designed and pre-made slide templates, you can quickly and easily find the right one for your upcoming presentation. You can use our Ultimate Guide To Cold Identify Ideal Time For Cold Calling SA SS V to effectively convey your message to a wider audience. Slidegeeks has done a lot of research before preparing these presentation templates. The content can be personalized and the slides are highly editable. Grab templates today from Slidegeeks. This slide highlights graphs that can help organization to determine ideal time for cold calling customers in order to increase conversation rate.

Increasing Business Awareness Positive Impact On Business Revenue And Policy Sales Strategy SS V
This slide represents graphs showcasing policy sales growth and revenue. It showcases a positive impact and increase in overall business. Do you have an important presentation coming up Are you looking for something that will make your presentation stand out from the rest Look no further than Increasing Business Awareness Positive Impact On Business Revenue And Policy Sales Strategy SS V. With our professional designs, you can trust that your presentation will pop and make delivering it a smooth process. And with Slidegeeks, you can trust that your presentation will be unique and memorable. So why wait Grab Increasing Business Awareness Positive Impact On Business Revenue And Policy Sales Strategy SS V today and make your presentation stand out from the rest This slide represents graphs showcasing policy sales growth and revenue. It showcases a positive impact and increase in overall business.

Analysing Impact Of Customer Support Boosting Customer Retention Rate With Live Chat
The following slide depicts graphs to evaluate impact of implementing strategies for optimizing customer support. It includes elements such as customer satisfaction score CSAT , net promotor score NPS along with key insights. Create an editable Analysing Impact Of Customer Support Boosting Customer Retention Rate With Live Chat that communicates your idea and engages your audience. Whether you are presenting a business or an educational presentation, pre-designed presentation templates help save time. Analysing Impact Of Customer Support Boosting Customer Retention Rate With Live Chat is highly customizable and very easy to edit, covering many different styles from creative to business presentations. Slidegeeks has creative team members who have crafted amazing templates. So, go and get them without any delay. The following slide depicts graphs to evaluate impact of implementing strategies for optimizing customer support. It includes elements such as customer satisfaction score CSAT , net promotor score NPS along with key insights.
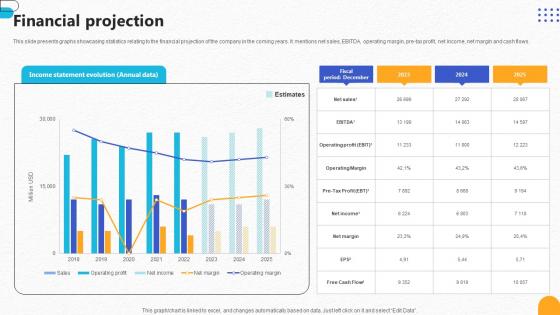
Financial Projection Pharmaceutical R And D Company Pitch Deck
This slide presents graphs showcasing statistics relating to the financial projection of the company in the coming years. It mentions net sales, EBITDA, operating margin, pre-tax profit, net income, net margin and cash flows. Slidegeeks is here to make your presentations a breeze with Financial Projection Pharmaceutical R And D Company Pitch Deck With our easy-to-use and customizable templates, you can focus on delivering your ideas rather than worrying about formatting. With a variety of designs to choose from, you are sure to find one that suits your needs. And with animations and unique photos, illustrations, and fonts, you can make your presentation pop. So whether you are giving a sales pitch or presenting to the board, make sure to check out Slidegeeks first This slide presents graphs showcasing statistics relating to the financial projection of the company in the coming years. It mentions net sales, EBITDA, operating margin, pre-tax profit, net income, net margin and cash flows.
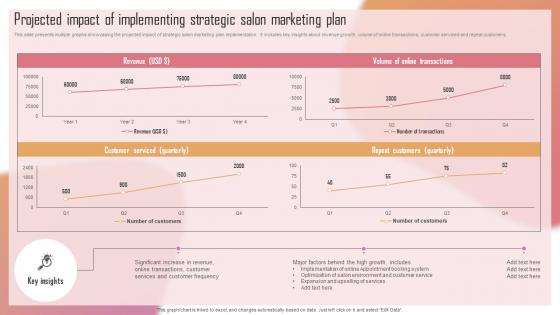
Customizing The Salon Experience Projected Impact Of Implementing Strategic Salon Marketing Strategy SS V
This slide presents multiple graphs showcasing the projected impact of strategic salon marketing plan implementation. It includes key insights about revenue growth, volume of online transactions, customer serviced and repeat customers. Crafting an eye-catching presentation has never been more straightforward. Let your presentation shine with this tasteful yet straightforward Customizing The Salon Experience Projected Impact Of Implementing Strategic Salon Marketing Strategy SS V template. It offers a minimalistic and classy look that is great for making a statement. The colors have been employed intelligently to add a bit of playfulness while still remaining professional. Construct the ideal Customizing The Salon Experience Projected Impact Of Implementing Strategic Salon Marketing Strategy SS V that effortlessly grabs the attention of your audience Begin now and be certain to wow your customers This slide presents multiple graphs showcasing the projected impact of strategic salon marketing plan implementation. It includes key insights about revenue growth, volume of online transactions, customer serviced and repeat customers.

Remote Sales Plan For Ideal Time For Customer Cold Calling Strategy SS V
This slide highlights graphs that can help organization to determine ideal time and day for cold calling customers. Identifying ideal time for cold calling can help to increase the conversation sales of inside sales strategy. Make sure to capture your audiences attention in your business displays with our gratis customizable Remote Sales Plan For Ideal Time For Customer Cold Calling Strategy SS V. These are great for business strategies, office conferences, capital raising or task suggestions. If you desire to acquire more customers for your tech business and ensure they stay satisfied, create your own sales presentation with these plain slides. This slide highlights graphs that can help organization to determine ideal time and day for cold calling customers. Identifying ideal time for cold calling can help to increase the conversation sales of inside sales strategy.
Project Management Dashboard For Tracking Performance Closing A Project By Fulfilling PM SS V
This slide showcases dashboard for tracing project performance. This template focuses on changing the status of each task and graphs automatically tracking overall status. It covers aspects related to task priority, budget, etc. Find a pre-designed and impeccable Project Management Dashboard For Tracking Performance Closing A Project By Fulfilling PM SS V. The templates can ace your presentation without additional effort. You can download these easy-to-edit presentation templates to make your presentation stand out from others. So, what are you waiting for Download the template from Slidegeeks today and give a unique touch to your presentation. This slide showcases dashboard for tracing project performance. This template focuses on changing the status of each task and graphs automatically tracking overall status. It covers aspects related to task priority, budget, etc.
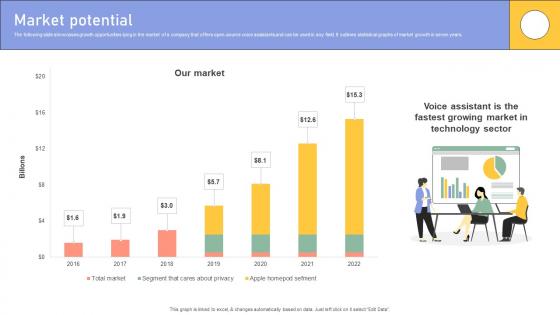
Market Potential Enterprise Software Application Investor Funding Elevator Pitch Deck
The following slide showcases growth opportunities lying in the market of a company that offers open-source voice assistants and can be used in any field. It outlines statistical graphs of market growth in seven years. Crafting an eye-catching presentation has never been more straightforward. Let your presentation shine with this tasteful yet straightforward Market Potential Enterprise Software Application Investor Funding Elevator Pitch Deck template. It offers a minimalistic and classy look that is great for making a statement. The colors have been employed intelligently to add a bit of playfulness while still remaining professional. Construct the ideal Market Potential Enterprise Software Application Investor Funding Elevator Pitch Deck that effortlessly grabs the attention of your audience Begin now and be certain to wow your customers The following slide showcases growth opportunities lying in the market of a company that offers open-source voice assistants and can be used in any field. It outlines statistical graphs of market growth in seven years.
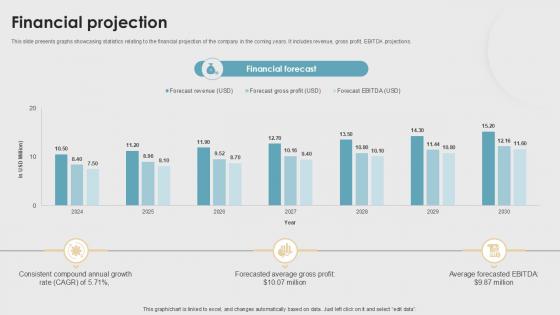
Financial Projection Property Listings Platform Pitch Deck PPT Sample
This slide presents graphs showcasing statistics relating to the financial projection of the company in the coming years. It includes revenue, gross profit, EBITDA projections. Slidegeeks is here to make your presentations a breeze with Financial Projection Property Listings Platform Pitch Deck PPT Sample With our easy to use and customizable templates, you can focus on delivering your ideas rather than worrying about formatting. With a variety of designs to choose from, you are sure to find one that suits your needs. And with animations and unique photos, illustrations, and fonts, you can make your presentation pop. So whether you are giving a sales pitch or presenting to the board, make sure to check out Slidegeeks first This slide presents graphs showcasing statistics relating to the financial projection of the company in the coming years.It includes revenue, gross profit, EBITDA projections.
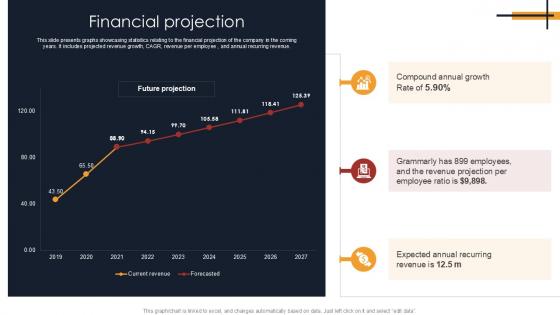
Financial Projection Writing Enhancement Software Pitch Deck PPT Sample
This slide presents graphs showcasing statistics relating to the financial projection of the company in the coming years. It includes projected revenue growth, CAGR, revenue per employee , and annual recurring revenue. Boost your pitch with our creative Financial Projection Writing Enhancement Software Pitch Deck PPT Sample. Deliver an awe inspiring pitch that will mesmerize everyone. Using these presentation templates you will surely catch everyones attention. You can browse the ppts collection on our website. We have researchers who are experts at creating the right content for the templates. So you do not have to invest time in any additional work. Just grab the template now and use them. This slide presents graphs showcasing statistics relating to the financial projection of the company in the coming years.It includes projected revenue growth, CAGR, revenue per employee , and annual recurring revenue.
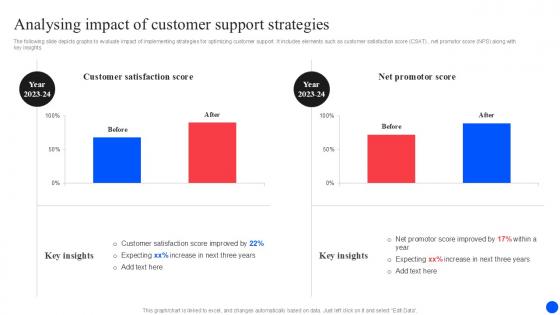
Analysing Impact Of Improving Customer Retention PPT Example
The following slide depicts graphs to evaluate impact of implementing strategies for optimizing customer support. It includes elements such as customer satisfaction score CSAT , net promotor score NPS along with key insights. Create an editable Analysing Impact Of Improving Customer Retention PPT Example that communicates your idea and engages your audience. Whether you are presenting a business or an educational presentation, pre-designed presentation templates help save time. Analysing Impact Of Improving Customer Retention PPT Example is highly customizable and very easy to edit, covering many different styles from creative to business presentations. Slidegeeks has creative team members who have crafted amazing templates. So, go and get them without any delay. The following slide depicts graphs to evaluate impact of implementing strategies for optimizing customer support. It includes elements such as customer satisfaction score CSAT , net promotor score NPS along with key insights.
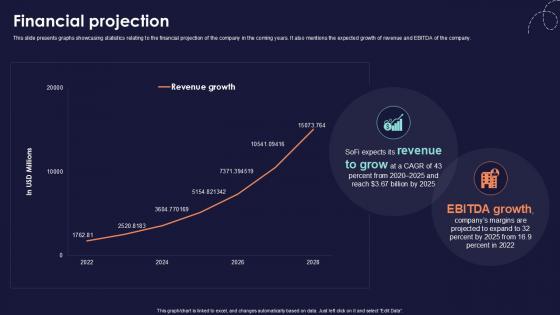
Financial Projection Online Financial Services Platform Ppt Template
This slide presents graphs showcasing statistics relating to the financial projection of the company in the coming years. It also mentions the expected growth of revenue and EBITDA of the company. Slidegeeks is here to make your presentations a breeze with Financial Projection Online Financial Services Platform Ppt Template With our easy-to-use and customizable templates, you can focus on delivering your ideas rather than worrying about formatting. With a variety of designs to choose from, you are sure to find one that suits your needs. And with animations and unique photos, illustrations, and fonts, you can make your presentation pop. So whether you are giving a sales pitch or presenting to the board, make sure to check out Slidegeeks first This slide presents graphs showcasing statistics relating to the financial projection of the company in the coming years. It also mentions the expected growth of revenue and EBITDA of the company.
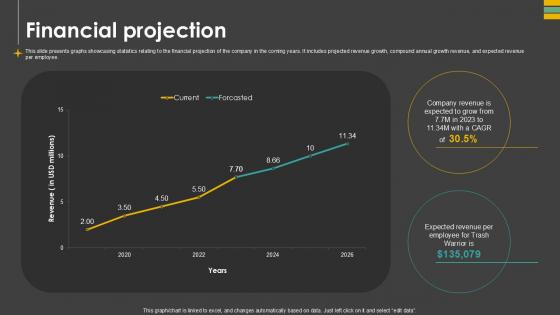
Financial Projection Waste Control Platform Pitch Deck Ppt Sample
This slide presents graphs showcasing statistics relating to the financial projection of the company in the coming years. It includes projected revenue growth, compound annual growth revenue, and expected revenue per employee. Do you have an important presentation coming up Are you looking for something that will make your presentation stand out from the rest Look no further than Financial Projection Waste Control Platform Pitch Deck Ppt Sample. With our professional designs, you can trust that your presentation will pop and make delivering it a smooth process. And with Slidegeeks, you can trust that your presentation will be unique and memorable. So why wait Grab Financial Projection Waste Control Platform Pitch Deck Ppt Sample today and make your presentation stand out from the rest This slide presents graphs showcasing statistics relating to the financial projection of the company in the coming years. It includes projected revenue growth, compound annual growth revenue, and expected revenue per employee.
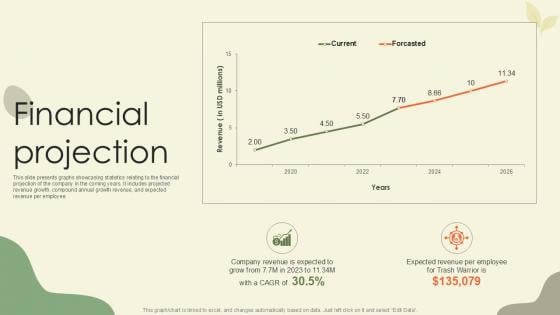
Financial Projection Waste Disposal Platform Pitch Deck Ppt Sample
This slide presents graphs showcasing statistics relating to the financial projection of the company in the coming years. It includes projected revenue growth, compound annual growth revenue, and expected revenue per employee. Slidegeeks is here to make your presentations a breeze with Financial Projection Waste Disposal Platform Pitch Deck Ppt Sample With our easy-to-use and customizable templates, you can focus on delivering your ideas rather than worrying about formatting. With a variety of designs to choose from, you are sure to find one that suits your needs. And with animations and unique photos, illustrations, and fonts, you can make your presentation pop. So whether you are giving a sales pitch or presenting to the board, make sure to check out Slidegeeks first This slide presents graphs showcasing statistics relating to the financial projection of the company in the coming years. It includes projected revenue growth, compound annual growth revenue, and expected revenue per employee.
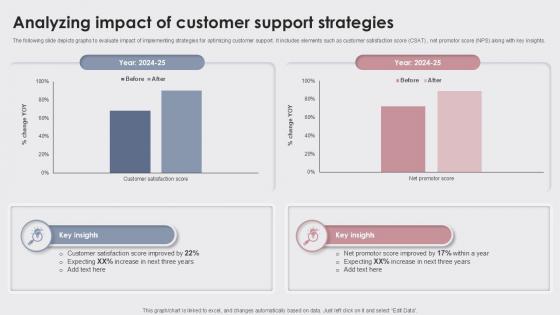
Analyzing Impact Of Enhancing Customer Experience Ppt Powerpoint
The following slide depicts graphs to evaluate impact of implementing strategies for optimizing customer support. It includes elements such as customer satisfaction score CSAT , net promotor score NPS along with key insights. Create an editable Analyzing Impact Of Enhancing Customer Experience Ppt Powerpoint that communicates your idea and engages your audience. Whether you are presenting a business or an educational presentation, pre-designed presentation templates help save time. Analyzing Impact Of Enhancing Customer Experience Ppt Powerpoint is highly customizable and very easy to edit, covering many different styles from creative to business presentations. Slidegeeks has creative team members who have crafted amazing templates. So, go and get them without any delay. The following slide depicts graphs to evaluate impact of implementing strategies for optimizing customer support. It includes elements such as customer satisfaction score CSAT , net promotor score NPS along with key insights.
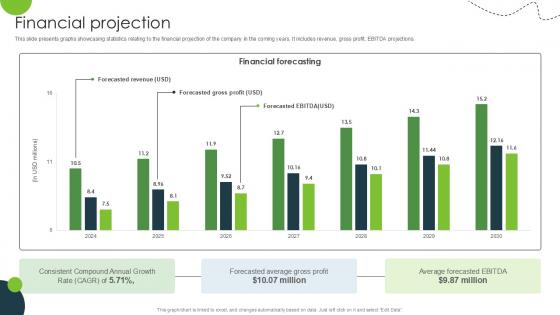
Financial Projection Land And Property Marketplace Pitch Deck PPT Example
This slide presents graphs showcasing statistics relating to the financial projection of the company in the coming years. It includes revenue, gross profit, EBITDA projections. Slidegeeks is here to make your presentations a breeze with Financial Projection Land And Property Marketplace Pitch Deck PPT Example With our easy-to-use and customizable templates, you can focus on delivering your ideas rather than worrying about formatting. With a variety of designs to choose from, you are sure to find one that suits your needs. And with animations and unique photos, illustrations, and fonts, you can make your presentation pop. So whether you are giving a sales pitch or presenting to the board, make sure to check out Slidegeeks first This slide presents graphs showcasing statistics relating to the financial projection of the company in the coming years. It includes revenue, gross profit, EBITDA projections.
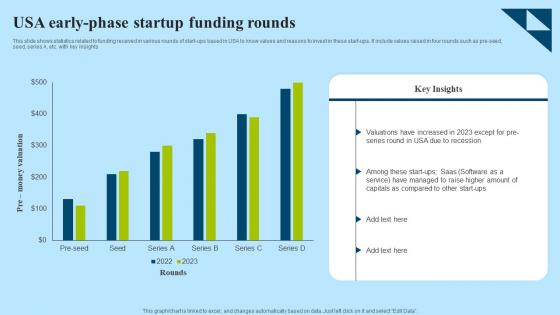
USA Early Phase Startup Funding Rounds Ideas Pdf
This slide shows statistics related to funding received in various rounds of start-ups based in USA to know values and reasons to invest in these start-ups. It include values raised in four rounds such as pre-seed, seed, series A, etc. with key insights. Pitch your topic with ease and precision using this USA Early Phase Startup Funding Rounds Ideas Pdf. This layout presents information on Early Phase, Startup Funding Rounds. It is also available for immediate download and adjustment. So, changes can be made in the color, design, graphics or any other component to create a unique layout. This slide shows statistics related to funding received in various rounds of start-ups based in USA to know values and reasons to invest in these start-ups. It include values raised in four rounds such as pre-seed, seed, series A, etc. with key insights.
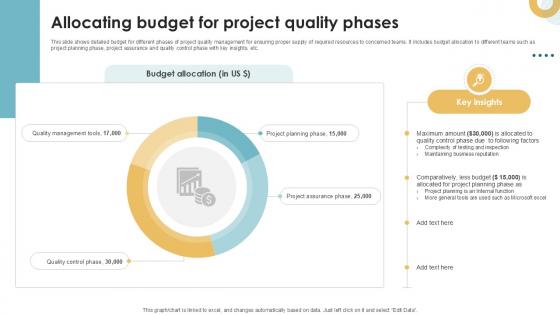
Allocating Budget For Project Quality Phases Executing Quality Ppt Example PM SS V
This slide shows detailed budget for different phases of project quality management for ensuring proper supply of required resources to concerned teams. It includes budget allocation to different teams such as project planning phase, project assurance and quality control phase with key insights, etc. Create an editable Allocating Budget For Project Quality Phases Executing Quality Ppt Example PM SS V that communicates your idea and engages your audience. Whether you are presenting a business or an educational presentation, pre-designed presentation templates help save time. Allocating Budget For Project Quality Phases Executing Quality Ppt Example PM SS V is highly customizable and very easy to edit, covering many different styles from creative to business presentations. Slidegeeks has creative team members who have crafted amazing templates. So, go and get them without any delay. This slide shows detailed budget for different phases of project quality management for ensuring proper supply of required resources to concerned teams. It includes budget allocation to different teams such as project planning phase, project assurance and quality control phase with key insights, etc.
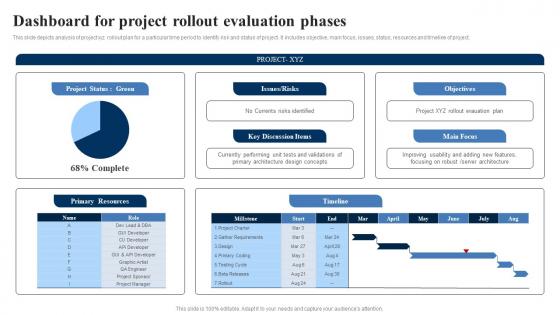
Dashboard For Project Rollout Evaluation Phases Sample Pdf
This slide depicts analysis of project xyz rollout plan for a particular time period to identify risk and status of project. It includes objective, main focus, issues, status, resources and timeline of project.Showcasing this set of slides titled Dashboard For Project Rollout Evaluation Phases Sample Pdf The topics addressed in these templates are Improving Usability, Discussion Items, Rollout Evauation All the content presented in this PPT design is completely editable. Download it and make adjustments in color, background, font etc. as per your unique business setting. This slide depicts analysis of project xyz rollout plan for a particular time period to identify risk and status of project. It includes objective, main focus, issues, status, resources and timeline of project.
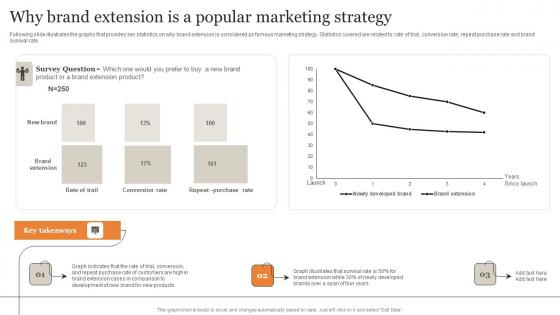
Why Brand Extension Is A Popular Marketing Strategy Ultimate Guide Implementing Inspiration Pdf
Following slide illustrates the graphs that provides key statistics on why brand extension is considered as famous marketing strategy. Statistics covered are related to rate of trial, conversion rate, repeat purchase rate and brand survival rate. Do you have to make sure that everyone on your team knows about any specific topic I yes, then you should give Why Brand Extension Is A Popular Marketing Strategy Ultimate Guide Implementing Inspiration Pdf a try. Our experts have put a lot of knowledge and effort into creating this impeccable Why Brand Extension Is A Popular Marketing Strategy Ultimate Guide Implementing Inspiration Pdf You can use this template for your upcoming presentations, as the slides are perfect to represent even the tiniest detail. You can download these templates from the Slidegeeks website and these are easy to edit. So grab these today. Following slide illustrates the graphs that provides key statistics on why brand extension is considered as famous marketing strategy. Statistics covered are related to rate of trial, conversion rate, repeat purchase rate and brand survival rate.
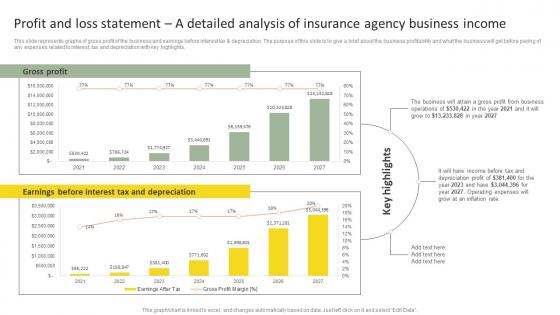
Profit And Loss Statement A Insurance Agency Startup Business Plan Go To Market Strategy Topics Pdf
This slide represents graphs of gross profit of the business and earnings before interest tax and depreciation. The purpose of this slide is to give a brief about the business profitability and what the business will get before paying of any expenses related to interest, tax and depreciation with key highlights. Slidegeeks is here to make your presentations a breeze with Profit And Loss Statement A Insurance Agency Startup Business Plan Go To Market Strategy Topics Pdf With our easy-to-use and customizable templates, you can focus on delivering your ideas rather than worrying about formatting. With a variety of designs to choose from, you are sure to find one that suits your needs. And with animations and unique photos, illustrations, and fonts, you can make your presentation pop. So whether you are giving a sales pitch or presenting to the board, make sure to check out Slidegeeks first This slide represents graphs of gross profit of the business and earnings before interest tax and depreciation. The purpose of this slide is to give a brief about the business profitability and what the business will get before paying of any expenses related to interest, tax and depreciation with key highlights.
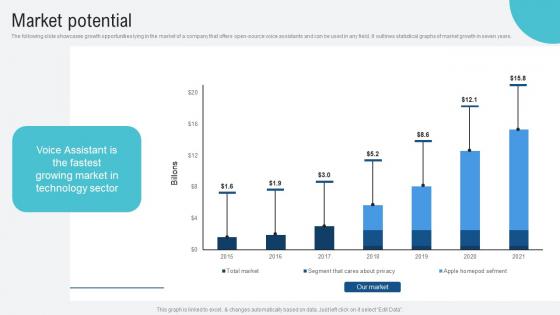
Market Potential Voice Assistance Security Platform Investor Funding Presentation Download Pdf
The following slide showcases growth opportunities lying in the market of a company that offers open source voice assistants and can be used in any field. It outlines statistical graphs of market growth in seven years. Presenting this PowerPoint presentation, titled Market Potential Voice Assistance Security Platform Investor Funding Presentation Download Pdf, with topics curated by our researchers after extensive research. This editable presentation is available for immediate download and provides attractive features when used. Download now and captivate your audience. Presenting this Market Potential Voice Assistance Security Platform Investor Funding Presentation Download Pdf. Our researchers have carefully researched and created these slides with all aspects taken into consideration. This is a completely customizable Market Potential Voice Assistance Security Platform Investor Funding Presentation Download Pdf that is available for immediate downloading. Download now and make an impact on your audience. Highlight the attractive features available with our PPTs. The following slide showcases growth opportunities lying in the market of a company that offers open source voice assistants and can be used in any field. It outlines statistical graphs of market growth in seven years.

Insurance Firm Start Up Financial Detailed Analysis Of Insurance Agency Business Income Formats Pdf
This slide represents graphs of gross profit of the business and earnings before interest tax and depreciation. The purpose of this slide is to give a brief about the business profitability and what the business will get before paying of any expenses related to interest, tax and depreciation with key highlights. Want to ace your presentation in front of a live audience Our Insurance Firm Start Up Financial Detailed Analysis Of Insurance Agency Business Income Formats Pdf can help you do that by engaging all the users towards you. Slidegeeks experts have put their efforts and expertise into creating these impeccable powerpoint presentations so that you can communicate your ideas clearly. Moreover, all the templates are customizable, and easy-to-edit and downloadable. Use these for both personal and commercial use. This slide represents graphs of gross profit of the business and earnings before interest tax and depreciation. The purpose of this slide is to give a brief about the business profitability and what the business will get before paying of any expenses related to interest, tax and depreciation with key highlights.
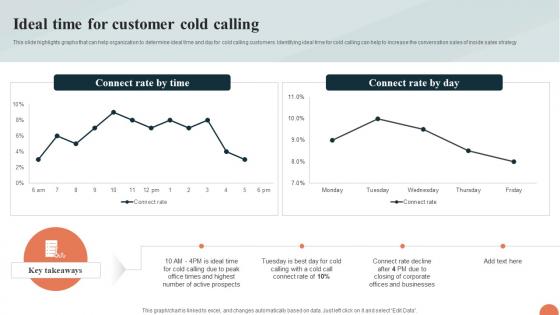
Telesales Strategy For Targeting Ideal Time For Customer Cold Calling Strategy SS V
This slide highlights graphs that can help organization to determine ideal time and day for cold calling customers. Identifying ideal time for cold calling can help to increase the conversation sales of inside sales strategy. Formulating a presentation can take up a lot of effort and time, so the content and message should always be the primary focus. The visuals of the PowerPoint can enhance the presenters message, so our Telesales Strategy For Targeting Ideal Time For Customer Cold Calling Strategy SS V was created to help save time. Instead of worrying about the design, the presenter can concentrate on the message while our designers work on creating the ideal templates for whatever situation is needed. Slidegeeks has experts for everything from amazing designs to valuable content, we have put everything into Telesales Strategy For Targeting Ideal Time For Customer Cold Calling Strategy SS V. This slide highlights graphs that can help organization to determine ideal time and day for cold calling customers. Identifying ideal time for cold calling can help to increase the conversation sales of inside sales strategy.
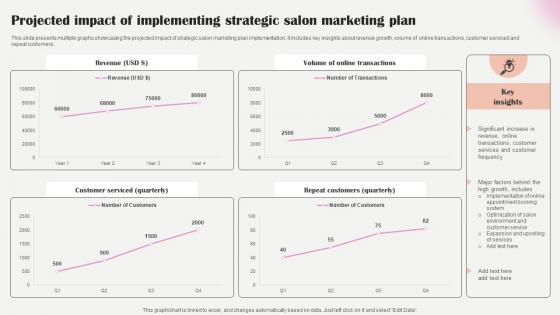
Salon Marketing Plan To Optimize Projected Impact Of Implementing Strategic Strategy SS V
This slide presents multiple graphs showcasing the projected impact of strategic salon marketing plan implementation. It includes key insights about revenue growth, volume of online transactions, customer serviced and repeat customers. Formulating a presentation can take up a lot of effort and time, so the content and message should always be the primary focus. The visuals of the PowerPoint can enhance the presenters message, so our Salon Marketing Plan To Optimize Projected Impact Of Implementing Strategic Strategy SS V was created to help save time. Instead of worrying about the design, the presenter can concentrate on the message while our designers work on creating the ideal templates for whatever situation is needed. Slidegeeks has experts for everything from amazing designs to valuable content, we have put everything into Salon Marketing Plan To Optimize Projected Impact Of Implementing Strategic Strategy SS V This slide presents multiple graphs showcasing the projected impact of strategic salon marketing plan implementation. It includes key insights about revenue growth, volume of online transactions, customer serviced and repeat customers.
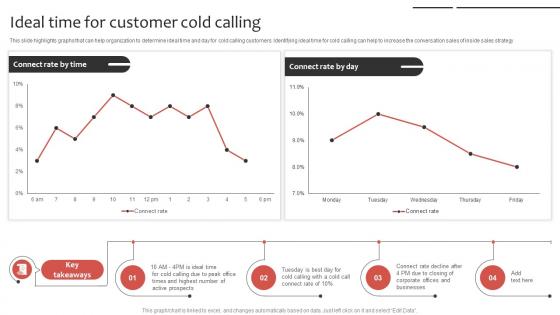
Phone Sales Strategy To Drive Ideal Time For Customer Cold Calling Strategy SS V
This slide highlights graphs that can help organization to determine ideal time and day for cold calling customers. Identifying ideal time for cold calling can help to increase the conversation sales of inside sales strategy. Formulating a presentation can take up a lot of effort and time, so the content and message should always be the primary focus. The visuals of the PowerPoint can enhance the presenters message, so our Phone Sales Strategy To Drive Ideal Time For Customer Cold Calling Strategy SS V was created to help save time. Instead of worrying about the design, the presenter can concentrate on the message while our designers work on creating the ideal templates for whatever situation is needed. Slidegeeks has experts for everything from amazing designs to valuable content, we have put everything into Phone Sales Strategy To Drive Ideal Time For Customer Cold Calling Strategy SS V. This slide highlights graphs that can help organization to determine ideal time and day for cold calling customers. Identifying ideal time for cold calling can help to increase the conversation sales of inside sales strategy.
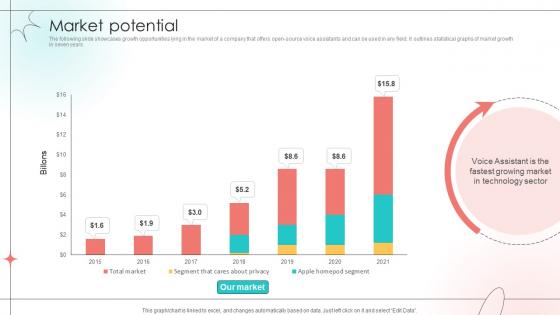
Market Potential Open Source Solution Investor Funding Elevator Pitch Deck
The following slide showcases growth opportunities lying in the market of a company that offers open-source voice assistants and can be used in any field. It outlines statistical graphs of market growth in seven years. Are you in need of a template that can accommodate all of your creative concepts This one is crafted professionally and can be altered to fit any style. Use it with Google Slides or PowerPoint. Include striking photographs, symbols, depictions, and other visuals. Fill, move around, or remove text boxes as desired. Test out color palettes and font mixtures. Edit and save your work, or work with colleagues. Download Market Potential Open Source Solution Investor Funding Elevator Pitch Deck and observe how to make your presentation outstanding. Give an impeccable presentation to your group and make your presentation unforgettable. The following slide showcases growth opportunities lying in the market of a company that offers open-source voice assistants and can be used in any field. It outlines statistical graphs of market growth in seven years.
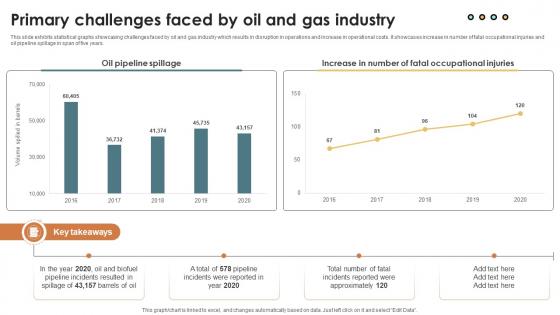
IoT Solutions For Oil Primary Challenges Faced By Oil And Gas Industry IoT SS V
This slide exhibits statistical graphs showcasing challenges faced by oil and gas industry which results in disruption in operations and increase in operational costs. It showcases increase in number of fatal occupational injuries and oil pipeline spillage in span of five years. Slidegeeks is one of the best resources for PowerPoint templates. You can download easily and regulate IoT Solutions For Oil Primary Challenges Faced By Oil And Gas Industry IoT SS V for your personal presentations from our wonderful collection. A few clicks is all it takes to discover and get the most relevant and appropriate templates. Use our Templates to add a unique zing and appeal to your presentation and meetings. All the slides are easy to edit and you can use them even for advertisement purposes. This slide exhibits statistical graphs showcasing challenges faced by oil and gas industry which results in disruption in operations and increase in operational costs. It showcases increase in number of fatal occupational injuries and oil pipeline spillage in span of five years.
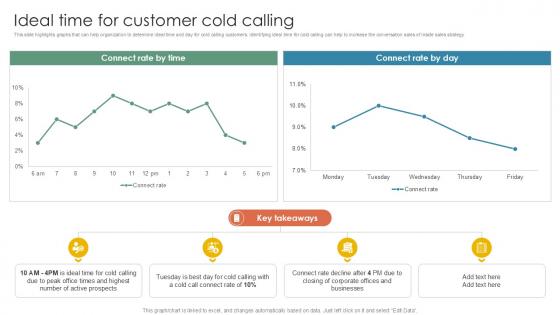
Ideal Time For Customer Cold Calling Inside Vs Outside Sales PPT Example Strategy SS V
This slide highlights graphs that can help organization to determine ideal time and day for cold calling customers. Identifying ideal time for cold calling can help to increase the conversation sales of inside sales strategy. Formulating a presentation can take up a lot of effort and time, so the content and message should always be the primary focus. The visuals of the PowerPoint can enhance the presenters message, so our Ideal Time For Customer Cold Calling Inside Vs Outside Sales PPT Example Strategy SS V was created to help save time. Instead of worrying about the design, the presenter can concentrate on the message while our designers work on creating the ideal templates for whatever situation is needed. Slidegeeks has experts for everything from amazing designs to valuable content, we have put everything into Ideal Time For Customer Cold Calling Inside Vs Outside Sales PPT Example Strategy SS V This slide highlights graphs that can help organization to determine ideal time and day for cold calling customers. Identifying ideal time for cold calling can help to increase the conversation sales of inside sales strategy
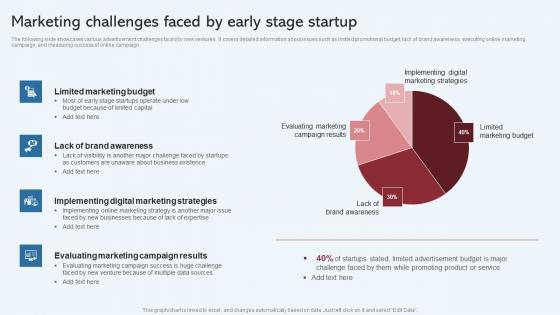
Marketing Challenges Faced By Early Stage Startup Effective Startup Promotion Plan Guidelines Pdf
The following slide showcases various advertisement challenges faced by new ventures. It covers detailed information about issues such as limited promotional budget, lack of brand awareness, executing online marketing campaign, and measuring success of online campaign. The Marketing Challenges Faced By Early Stage Startup Effective Startup Promotion Plan Guidelines Pdf is a compilation of the most recent design trends as a series of slides. It is suitable for any subject or industry presentation, containing attractive visuals and photo spots for businesses to clearly express their messages. This template contains a variety of slides for the user to input data, such as structures to contrast two elements, bullet points, and slides for written information. Slidegeeks is prepared to create an impression. The following slide showcases various advertisement challenges faced by new ventures. It covers detailed information about issues such as limited promotional budget, lack of brand awareness, executing online marketing campaign, and measuring success of online campaign.
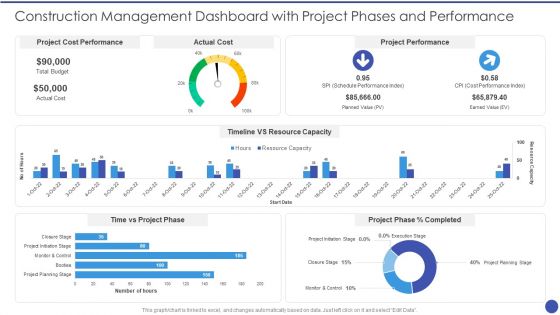
Construction Management Dashboard With Project Phases And Performance Inspiration PDF
This graph for chart is linked to excel, and changes automatically based on data. Just left click on it and select Edit Data. Deliver and pitch your topic in the best possible manner with this Construction Management Dashboard With Project Phases And Performance Inspiration PDF. Use them to share invaluable insights on Project Cost Performance, Actual Cost, Project Performance, Timeline VS Resource Capacity, Time vs Project Phase and impress your audience. This template can be altered and modified as per your expectations. So, grab it now.
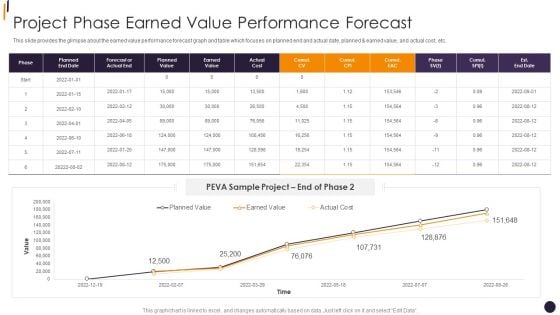
PMP Tools Project Phase Earned Value Performance Forecast Demonstration PDF
This slide provides the glimpse about the earned value performance forecast graph and table which focuses on planned end and actual date, planned and earned value, and actual cost, etc.Deliver and pitch your topic in the best possible manner with this PMP Tools Project Phase Earned Value Performance Forecast Demonstration PDF Use them to share invaluable insights on Forecast Or Actual, Earned Value, Actual Cost and impress your audience. This template can be altered and modified as per your expectations. So, grab it now.
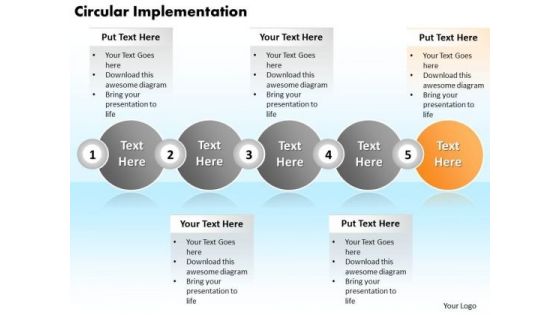
Ppt Circular Implementation Of 5 Create PowerPoint Macro Involved Procedure Templates
PPT circular implementation of 5 create powerpoint macro involved procedure Templates-The above template displays a diagram of five Circular text boxes arranged in Horizontal manner. The Orange Circular Box Highlighted in the Diagram Implies that fifth stage is under processing. Use this diagram to make your Business PPT more attractive and interesting. Deliver this amazing presentation slide to mesmerize your audience. You can change color, size and orientation of any icon to your liking.-PPT circular implementation of 5 create powerpoint macro involved procedure Templates-Abstract, Art, Artistic, Backdrop, Background, Bend, Black, Business, Circle, Copy-Space, Create, Design, Dot, Dotted, Draw, Element, Flower, Gradient, Grid, Icon, Illustration, Leaf, Leaves, Logo, Mold, Motif, Nature, Pattern, Petal, Radiate, Retro, Round Achieve strong & sustainable quality gains with our Ppt Circular Implementation Of 5 Create PowerPoint Macro Involved Procedure Templates. They will make you look good.
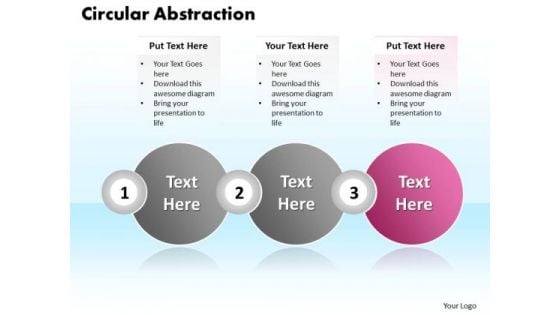
Ppt Circular Motion PowerPoint Abstraction Of Three Text Boxes Templates
PPT circular motion powerpoint abstraction of three text boxes Templates-Use this 3D PowerPoint Diagram to describe three steps to make efficient use of Limited resources through circular Boxes. This diagram shows the Pink Circular box explaining its significance. It can be used to represent global business issues such as financial data, stock market Exchange, increase in sales, corporate presentations and more. PowerPoint text boxes diagrams are designed to help you place your text in a professional layout. You can change color, size and orientation of any icon to your liking.-PPT circular motion powerpoint abstraction of three text boxes Templates-Abstract, Art, Artistic, Backdrop, Background, Bend, Black, Business, Circle, Copy-Space, Create, Design, Dot, Dotted, Draw, Element, Flower, Gradient, Grid, Icon, Illustration, Leaf, Leaves, Logo, Mold, Motif, Nature, Pattern, Petal, Radiate, Retro, Round Nourish the self-esteem of your employees. Acknowledge their accomplishments with our Ppt Circular Motion PowerPoint Abstraction Of Three Text Boxes Templates.

Business Operation Modeling Approaches Project Phase Earned Value Performance Forecast Formats PDF
This slide provides the glimpse about the earned value performance forecast graph and table which focuses on planned end and actual date, planned and earned value, and actual cost, etc.Deliver and pitch your topic in the best possible manner with this business operation modeling approaches project phase earned value performance forecast formats pdf Use them to share invaluable insights on project phase earned value performance forecast and impress your audience. This template can be altered and modified as per your expectations. So, grab it now.
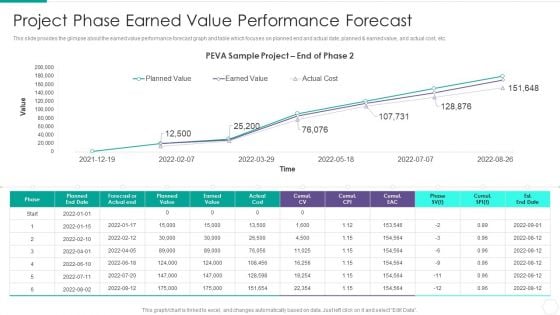
Quantitative Risk Assessment Project Phase Earned Value Performance Forecast Microsoft PDF
This slide provides the glimpse about the earned value performance forecast graph and table which focuses on planned end and actual date, planned and earned value, and actual cost, etc. Deliver and pitch your topic in the best possible manner with this Quantitative Risk Assessment Project Phase Earned Value Performance Forecast Microsoft PDF. Use them to share invaluable insights on Project Phase Earned Value Performance Forecast and impress your audience. This template can be altered and modified as per your expectations. So, grab it now.
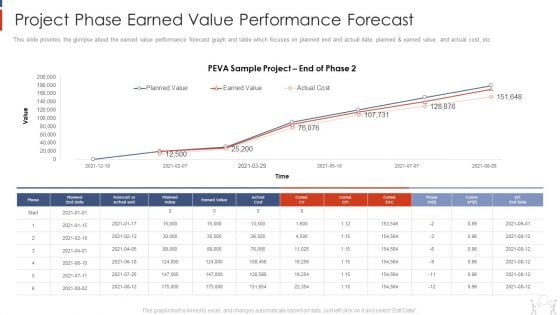
Project Management Modelling Techniques IT Project Phase Earned Value Performance Forecast Portrait PDF
This slide provides the glimpse about the earned value performance forecast graph and table which focuses on planned end and actual date, planned and earned value, and actual cost, etc. Deliver and pitch your topic in the best possible manner with this project management modelling techniques it project phase earned value performance forecast portrait pdf. Use them to share invaluable insights on planned, earned value, actual cost and impress your audience. This template can be altered and modified as per your expectations. So, grab it now.
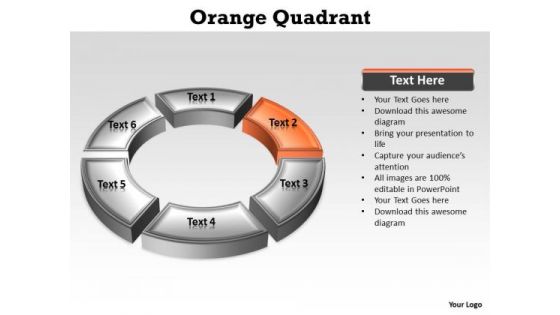
Ppt Orange Stage Through PowerPoint Presentation Circular Diagram Templates
PPT orange stage through powerpoint presentation circular diagram Templates-Create visually stunning and define your PPT Presentations in a unique and inspiring manner using our above Diagram which contains a graphic of of a Circular process. This correlative six stages diagram is a tool that can help your team work productively and successfully. Our colorful image makes your presentations inviting, friendly, simpler, professional showing that you care about even the smallest details. You can change color, size and orientation of any icon to your liking.-PPT orange stage through powerpoint presentation circular diagram Templates-abstract, accuracy, arrow, blue, chronometer, circle, clock, elegance, glass, glossy, graphic, icon, illustration, measure, asurement, mechanism, metal, point, quartz, round, shape, sign, single, slow, stylish, symbol, technology, timepiece, timer, vector, Our Ppt Orange Stage Through PowerPoint Presentation Circular Diagram Templates are really captivating. The audience will not take their eyes off you.
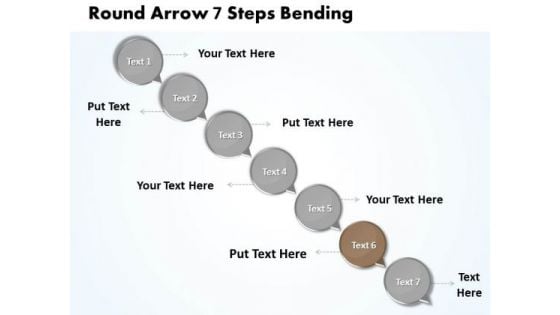
Ppt Descending Process 7 PowerPoint Slide Numbers Diagram Templates
PPT descending process 7 powerpoint slide numbers diagram Templates-This Appealing PowerPoint Diagram consists of our pre-designed circle organized charts for you. This PowerPoint Diagram is particularly suitable for displaying contexts, relations and individual steps of a concept or consecutive items. This Diagram will fit for Business Presentations. You can change color, size and orientation of any icon to your liking. -PPT descending process 7 powerpoint slide numbers diagram Templates-Add, Aqua, Arrows, Badges, Bar, Blend, Blue, Bright, Bubbles, Buttons, Caution, Circle, Drop, Elements, Glossy, Glowing, Graphic, Heart, Help, Icons, Idea, Illustration, Navigation, Oblong, Plus, Round, Service, Shadow, Shiny, Sign, Speech, Squares Enhance connectivity with our Ppt Descending Process 7 PowerPoint Slide Numbers Diagram Templates. They will always keep you in touch.
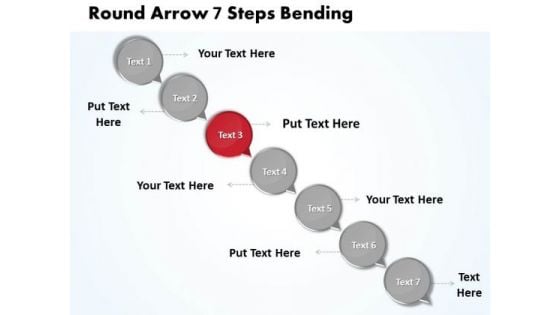
Ppt Circle Arrow Process 7 Steps Free Fishbone Diagram PowerPoint Template Templates
PPT circle arrow process 7 steps free fishbone diagram powerpoint template Templates-Deliver amazing Presentations with our above Diagram illustrating the Seven steps of the process to be explained in one single slide. This Diagram shows the Third stage with red color. Clarity of thought has been the key to your growth. Use our Diagram to illustrate your ability. You can change color, size and orientation of any icon to your liking. -PPT circle arrow process 7 steps free fishbone diagram powerpoint template Templates-Add, Aqua, Arrows, Badges, Bar, Blend, Blue, Bright, Bubbles, Buttons, Caution, Circle, Drop, Elements, Glossy, Glowing, Graphic, Heart, Help, Icons, Idea, Illustration, Navigation, Oblong, Plus, Round, Service, Shadow, Shiny, Sign, Speech, Squares Our Ppt Circle Arrow Process 7 Steps Free Fishbone Diagram PowerPoint Template Templates will keep u sane. Your thoughts will bolt across the line.
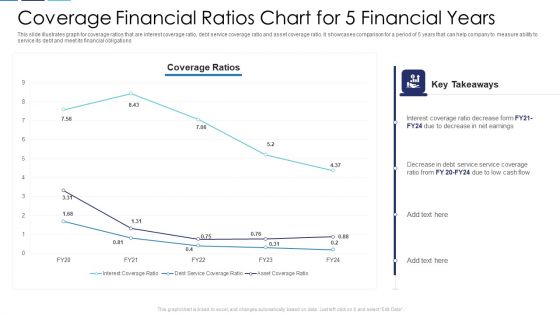
Coverage Financial Ratios Chart For 5 Financial Years Themes PDF
This slide illustrates graph for coverage ratios that are interest coverage ratio, debt service coverage ratio and asset coverage ratio. It showcases comparison for a period of 5 years that can help company to measure ability to service its debt and meet its financial obligations Showcasing this set of slides titled coverage financial ratios chart for 5 financial years themes pdf. The topics addressed in these templates are coverage financial ratios chart for 5 financial years. All the content presented in this PPT design is completely editable. Download it and make adjustments in color, background, font etc. as per your unique business setting.

Dividend Payout Financial Ratios Chart Comparison Themes PDF
This slide showcases dividend payout ratio graph that can help organization to determine the percentage of the companys earnings that is paid out to shareholders by way of dividend. It showcases comparison for a period of 8 years Showcasing this set of slides titled dividend payout financial ratios chart comparison themes pdf. The topics addressed in these templates are dividend payout financial ratios chart comparison. All the content presented in this PPT design is completely editable. Download it and make adjustments in color, background, font etc. as per your unique business setting.
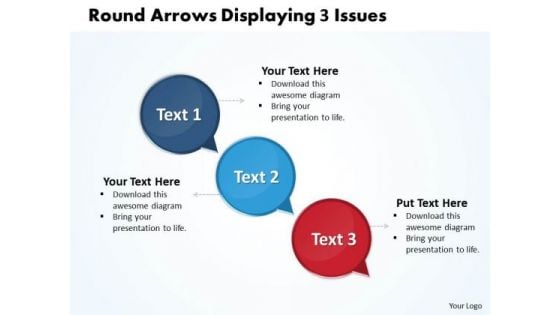
Ppt Circle PowerPoint Presentation 3d Arrows Displaying Issues Templates
PPT circle powerpoint presentation 3d arrows displaying issues Templates-This PowerPoint diagram is particularly useful for displaying how a process currently functions or could ideally function in Circular text boxes. Use this 3D awesome List and Circular text boxes PowerPoint templates to create awesome marketing and sales priority lists or any other types of lists. You can change color, size and orientation of any icon to your liking. -PPT circle powerpoint presentation 3d arrows displaying issues Templates-Add, Aqua, Arrows, Badges, Bar, Blend, Blue, Bright, Bubbles, Buttons, Caution, Circle, Drop, Elements, Glossy, Glowing, Graphic, Heart, Help, Icons, Idea, Illustration, Navigation, Oblong, Plus, Round, Service, Shadow, Shiny, Sign, Speech, Squares Educate your team with a winning presentation with our Ppt Circle PowerPoint Presentation 3d Arrows Displaying Issues Templates. You will come out on top.
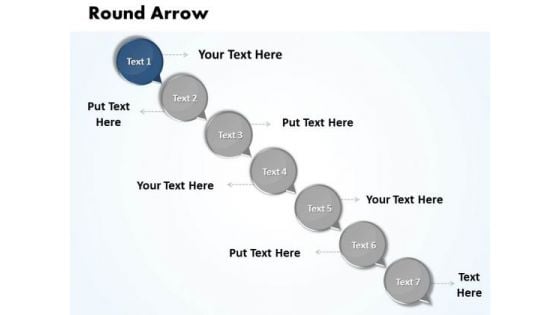
Ppt Bending Arrow 7 Create PowerPoint Macro Business Templates
PPT bending arrow 7 create powerpoint macro Business Templates-This PowerPoint diagram is particularly useful for displaying how a process currently functions or could ideally function in Circular text boxes. Use this 3D awesome List and Circular text boxes PowerPoint templates to create awesome marketing and sales priority lists or any other types of lists. You can change color, size and orientation of any icon to your liking. -PPT bending arrow 7 create powerpoint macro Business Templates-Add, Aqua, Arrows, Badges, Bar, Blend, Blue, Bright, Bubbles, Buttons, Caution, Circle, Drop, Elements, Glossy, Glowing, Graphic, Heart, Help, Icons, Idea, Illustration, Navigation, Oblong, Plus, Round, Service, Shadow, Shiny, Sign, Speech, Squares Guide your team with our Ppt Bending Arrow 7 Create PowerPoint Macro Business Templates. Download without worries with our money back guaranteee.
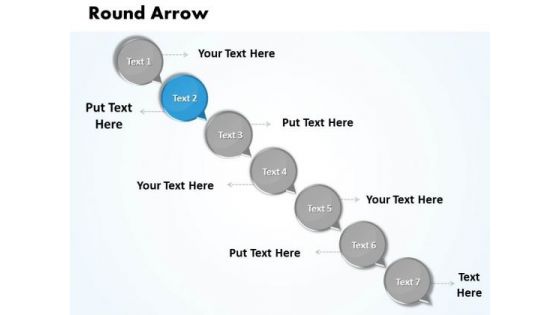
Ppt Text Circles With Circular Arrows PowerPoint 2007 Steps Business Templates
PPT text circles with circular arrows powerpoint 2007 steps Business Templates-Use this layout to define the outcome and the multiple possibilities in a way that is used in calculation of probabilities, genetics and strategic reasoning. This chart visualizes the concept of process steps, reoccurrences and components or of your company structure or product features. You can change color, size and orientation of any icon to your liking. -PPT text circles with circular arrows powerpoint 2007 steps Business Templates-Add, Aqua, Arrows, Badges, Bar, Blend, Blue, Bright, Bubbles, Buttons, Caution, Circle, Drop, Elements, Glossy, Glowing, Graphic, Heart, Help, Icons, Idea, Illustration, Navigation, Oblong, Plus, Round, Service, Shadow, Shiny, Sign, Speech, Squares Make use of the facilities our Ppt Text Circles With Circular Arrows PowerPoint 2007 Steps Business Templates offer. You will be delighted with the choices available.
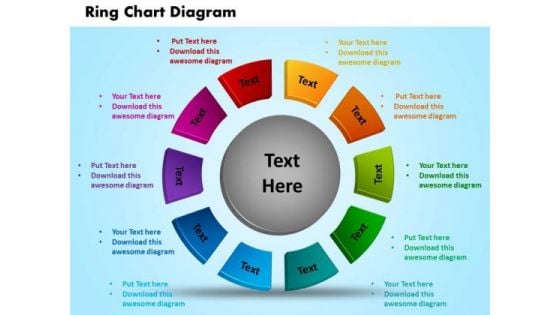
PowerPoint Slide Ring Chart Diagram Business Ppt Themes
PowerPoint Slide Ring Chart Diagram Business PPT Themes-This Multi-colored PowerPoint Diagram showing ten different parts which are forming the Ring, explaining these topics in sequence. Use this PowerPoint Diagram for Business Presentations. You can Edit color, size and orientation of any icon to your liking.-PowerPoint Slide Ring Chart Diagram Business PPT Themes Make your presentations quickly with our PowerPoint Slide Ring Chart Diagram Business Ppt Themes. You'll always stay ahead of the game.
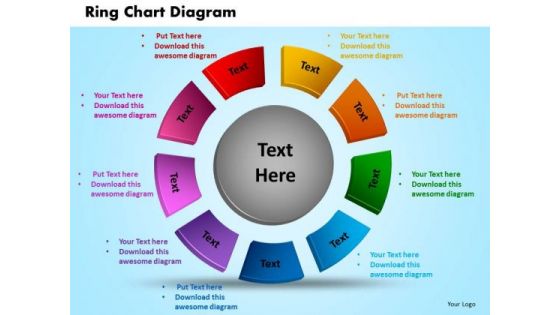
PowerPoint Templates Ring Chart Diagram Business Ppt Theme
PowerPoint Templates Ring Chart Diagram Business PPT Theme-This PowerPoint Diagram shows the ring strategy which signifies adapt, adjust, agree to, concert, construct, contrive, decide, design, determine, devise, direct, draft, establish, frame. You can change color, size and orientation of any icon to your liking. This Diagram will fit for Business related Presentations.-PowerPoint Templates Ring Chart Diagram Business PPT Theme Earn the esteem of your colleagues with our PowerPoint Templates Ring Chart Diagram Business Ppt Theme. Give your thoughts that something special.
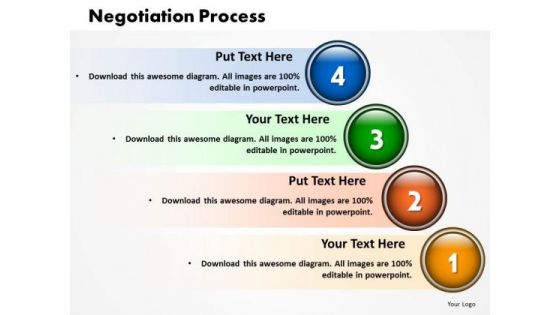
Business Growth PowerPoint Templates Business Four Stages Of Negotiation Process Ppt Slides
Business Growth PowerPoint Templates Business Four Stages Of Negotiation Process PPT Slides-Use this Negotiation Process Diagram which can be used to explain the four steps or actions involved in Process. You can change color, size and orientation of any icon to your liking.-Business Growth PowerPoint Templates Business Four Stages Of Negotiation Process PPT Slides Exhibit your erudition on our Business Growth PowerPoint Templates Business Four Stages Of Negotiation Process Ppt Slides. Give the audience a taste of your profound knowledge.

1 Wireless Computer Networking Wifi Access Point Connected To Globe Computers Ppt Slides
This image slide displays wireless computer networking Wi-Fi access point connected to globe computers. This image slide has been designed with graphic of globe, wireless router and various technology devices. This image slide depicts networking. You may change size, color and orientation of any icon to your liking. Use this PowerPoint template to express views on global, wireless networking in your presentations. This image may also be used in computer education presentations. This image slide will impart professional appearance to your presentations.

Business Charts PowerPoint Templates An Illustration Of Angry Emotion Sales
Business Charts PowerPoint templates an illustration of angry emotion Sales-This PowerPoint Diagram Illustrates all the Angry Emoticons which will help you to express exasperation, irritability, antagonism etc. .You can change color, size and orientation of any icon to your liking. Our Business Charts PowerPoint Templates An Illustration Of Angry Emotion Sales will ensure you get an A. You will be glad you tried us out.
PowerPoint Design Rings Strategy Ppt Template
PowerPoint Design Rings Strategy PPT Template-This PowerPoint Diagram Shows the Colorful rings Connected to each other. This Template can be used as a Background for Business Presentations. This PowerPoint Template Signifies the Strategy, Planning required for Business. You can Edit color, size and orientation of any icon to your liking.-PowerPoint Design Rings Strategy PPT Template Demand it all from our PowerPoint Design Rings Strategy Ppt Template. They will deliver without fail.
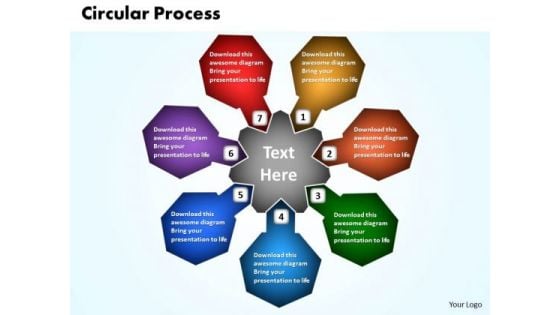
Business Process PowerPoint Templates Business Circular Process Of Decision Making Ppt Slides
Business Process PowerPoint Templates Business Circular Process Of Decision Making PPT Slides-Use this Circular Process to represent a continuing sequence of stages, tasks, or events in a circular flow and emphasize the connection between all components. You can change color, size and orientation of any icon to your liking.-Business Process PowerPoint Templates Business Circular Process Of Decision Making PPT Slides Achieve high-impact with our Business Process PowerPoint Templates Business Circular Process Of Decision Making Ppt Slides. They will make you look good.
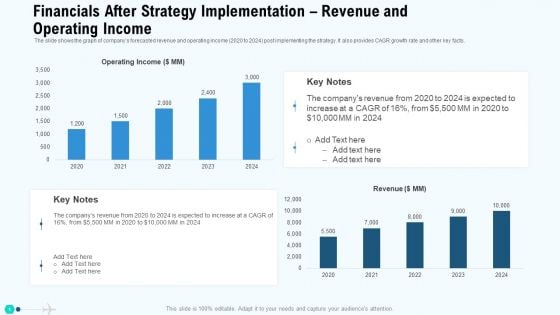
Financials After Strategy Implementation Revenue And Operating Income Themes PDF
The slide shows the graph of companys forecasted revenue and operating income 2020 to 2024 post implementing the strategy. It also provides CAGR growth rate and other key facts. Deliver and pitch your topic in the best possible manner with this financials after strategy implementation revenue and operating income themes pdf. Use them to share invaluable insights on financials after strategy implementation revenue and operating income and impress your audience. This template can be altered and modified as per your expectations. So, grab it now.
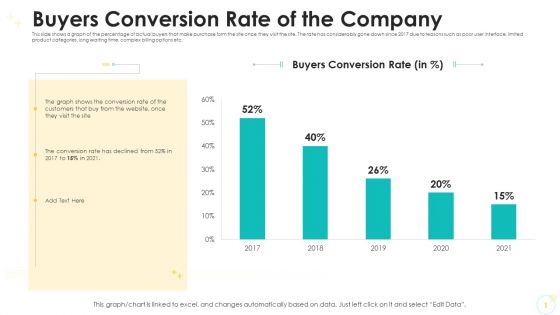
Buyers Conversion Rate Of The Company Themes PDF
This slide shows a graph of the percentage of actual buyers that make purchase form the site once they visit the site. The rate has considerably gone down since 2017 due to reasons such as poor user interface, limited product categories, long waiting time, complex billing options etc. Deliver an awe-inspiring pitch with this creative buyers conversion rate of the company themes pdf. bundle. Topics like buyers conversion rate, 2016 to 2021 can be discussed with this completely editable template. It is available for immediate download depending on the needs and requirements of the user.
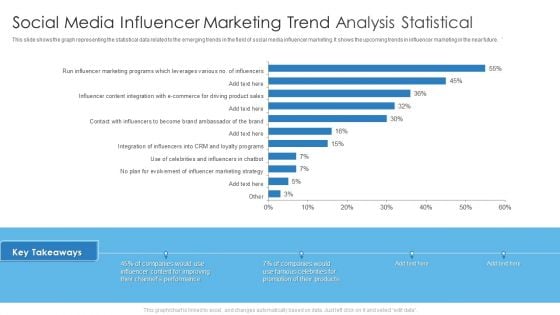
Social Media Influencer Marketing Trend Analysis Statistical Themes PDF
This slide shows the graph representing the statistical data related to the emerging trends in the field of social media influencer marketing. It shows the upcoming trends in influencer marketing in the near future. Deliver an awe inspiring pitch with this creative Social Media Influencer Marketing Trend Analysis Statistical Themes PDF bundle. Topics like Social Media Influencer, Marketing Trend Analysis Statistical can be discussed with this completely editable template. It is available for immediate download depending on the needs and requirements of the user.
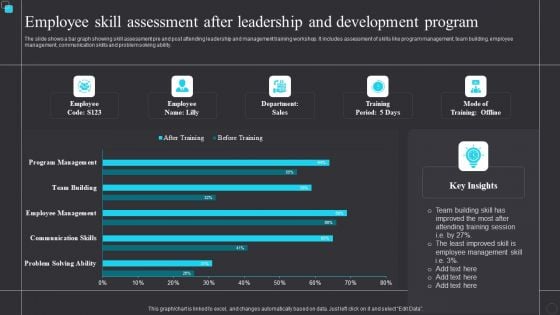
Employee Skill Assessment After Leadership And Development Program Themes PDF
The slide shows a bar graph showing skill assessment pre and post attending leadership and management training workshop. It includes assessment of skills like program management, team building, employee management, communication skills and problem solving ability. Showcasing this set of slides titled Employee Skill Assessment After Leadership And Development Program Themes PDF. The topics addressed in these templates are Team, Employee Management. All the content presented in this PPT design is completely editable. Download it and make adjustments in color, background, font etc. as per your unique business setting.
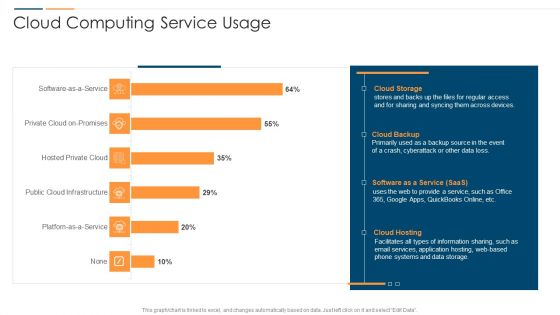
Revolution In Online Business Cloud Computing Service Usage Ppt PowerPoint Presentation File Themes PDF
This graph or chart is linked to excel, and changes automatically based on data. Just left click on it and select Edit Data. Deliver and pitch your topic in the best possible manner with this Revolution In Online Business Cloud Computing Service Usage Ppt PowerPoint Presentation File Themes PDF. Use them to share invaluable insights on Cloud Storage System, Cloud Backup Saas, Cloud Hosting Storage and impress your audience. This template can be altered and modified as per your expectations. So, grab it now.
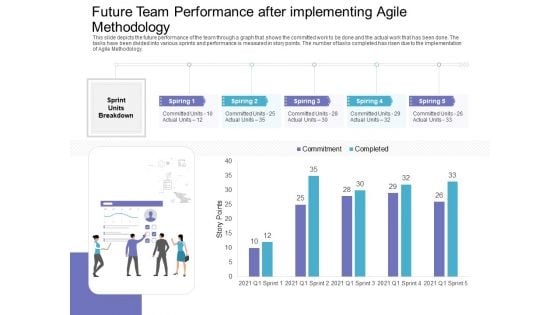
Future Team Performance After Implementing Agile Methodology Diagrams PDF
This slide depicts the future performance of the team through a graph that shows the committed work to be done and the actual work that has been done. The tasks have been divided into various sprints and performance is measured in story points. The number of tasks completed has risen due to the implementation of Agile Methodology. Deliver and pitch your topic in the best possible manner with this future team performance after implementing agile methodology diagrams pdf. Use them to share invaluable insights on future team performance after implementing agile methodology and impress your audience. This template can be altered and modified as per your expectations. So, grab it now.
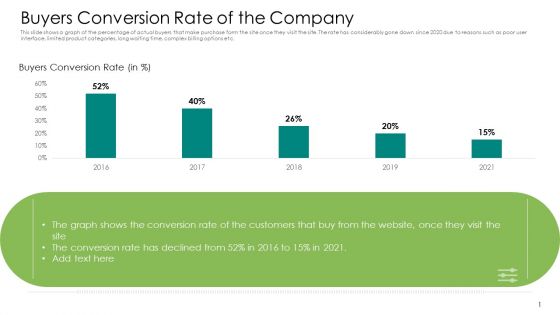
Buyers Conversion Rate Of The Company Diagrams PDF
This slide shows a graph of the percentage of actual buyers that make purchase form the site once they visit the site. The rate has considerably gone down since 2020 due to reasons such as poor user interface, limited product categories, long waiting time, complex billing options etc. Deliver an awe-inspiring pitch with this creative buyers conversion rate of the company diagrams pdf. bundle. Topics like buyers conversion rate, 2016 to 2021 can be discussed with this completely editable template. It is available for immediate download depending on the needs and requirements of the user.
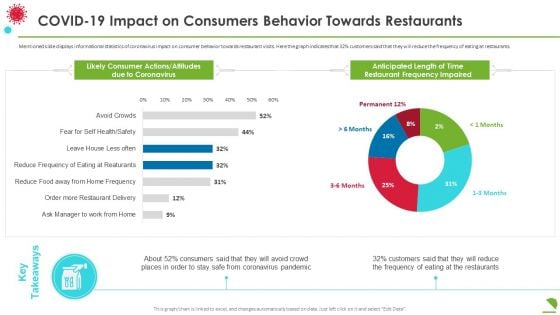
Covid19 Impact On Consumers Behavior Towards Restaurants Diagrams PDF
Mentioned slide displays informational statistics of coronavirus impact on consumer behavior towards restaurant visits. Here the graph indicates that 32 percentage customers said that they will reduce the frequency of eating at restaurants. Deliver an awe inspiring pitch with this creative covid19 impact on consumers behavior towards restaurants diagrams pdf bundle. Topics like covid 19 impact on consumers behavior towards restaurants can be discussed with this completely editable template. It is available for immediate download depending on the needs and requirements of the user.
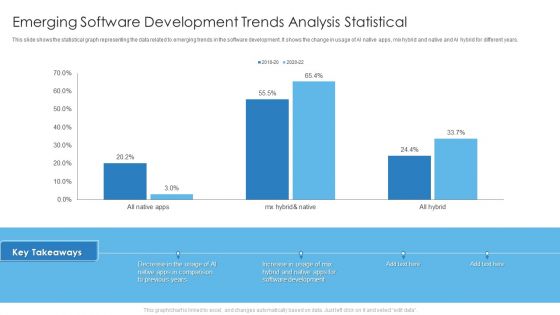
Emerging Software Development Trends Analysis Statistical Diagrams PDF
This slide shows the statistical graph representing the data related to emerging trends in the software development. It shows the change in usage of AI native apps, mix hybrid and native and AI hybrid for different years. Deliver and pitch your topic in the best possible manner with this Emerging Software Development Trends Analysis Statistical Diagrams PDF. Use them to share invaluable insights on Emerging Software Development, Trends Analysis Statistical and impress your audience. This template can be altered and modified as per your expectations. So, grab it now.
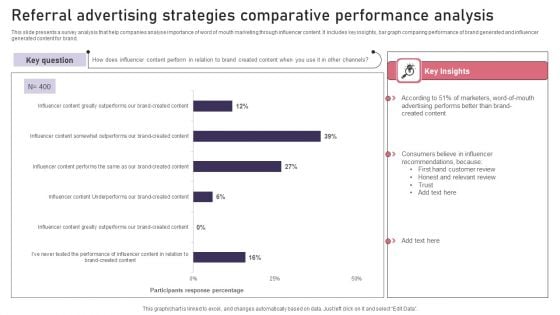
Referral Advertising Strategies Comparative Performance Analysis Diagrams PDF
This slide presents a survey analysis that help companies analyse importance of word of mouth marketing through influencer content. It includes key insights, bar graph comparing performance of brand generated and influencer generated content for brand. Showcasing this set of slides titled Referral Advertising Strategies Comparative Performance Analysis Diagrams PDF. The topics addressed in these templates are Referral Advertising, Strategies Comparative, Performance Analysis. All the content presented in this PPT design is completely editable. Download it and make adjustments in color, background, font etc. as per your unique business setting.
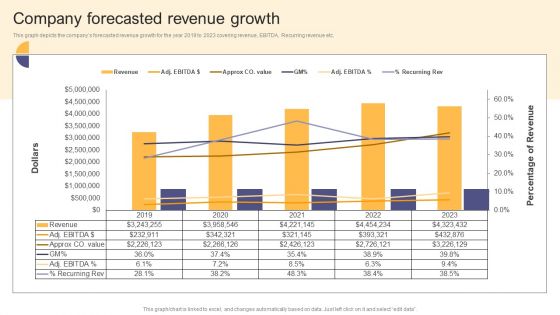
Per Device Pricing Strategy For Managed Solutions Company Forecasted Revenue Growth Themes PDF
This graph depicts the companys forecasted revenue growth for the year 2019 to 2023 covering revenue, EBITDA, Recurring revenue etc. Get a simple yet stunning designed Per Device Pricing Strategy For Managed Solutions Company Forecasted Revenue Growth Themes PDF. It is the best one to establish the tone in your meetings. It is an excellent way to make your presentations highly effective. So, download this PPT today from Slidegeeks and see the positive impacts. Our easy to edit Per Device Pricing Strategy For Managed Solutions Company Forecasted Revenue Growth Themes PDF can be your go to option for all upcoming conferences and meetings. So, what are you waiting for Grab this template today.
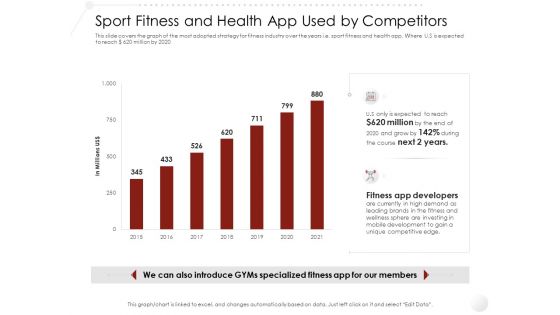
Market Entry Strategy Gym Clubs Industry Sport Fitness And Health App Used By Competitors Themes PDF
This slide covers the graph of the most adopted strategy for fitness industry over the years i.e. sport fitness and health app. Where U.S is expected to reach Dollar 620 million by 2020. Deliver and pitch your topic in the best possible manner with this market entry strategy gym clubs industry sport fitness and health app used by competitors themes pdf. Use them to share invaluable insights on fitness developers, investing, unique competitive, 2015 to 2021 and impress your audience. This template can be altered and modified as per your expectations. So, grab it now.
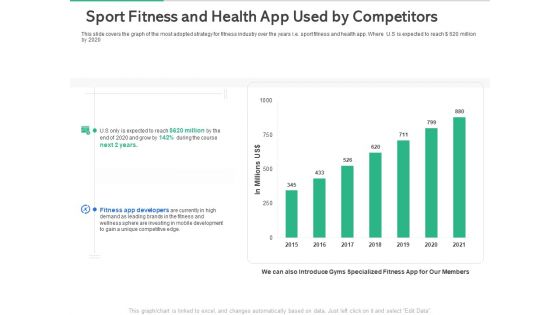
Market Overview Fitness Industry Sport Fitness And Health App Used By Competitors Themes PDF
This slide covers the graph of the most adopted strategy for fitness industry over the years i.e. sport fitness and health app. Where U.S is expected to reach dollar 620 million by 2020. Deliver and pitch your topic in the best possible manner with this market overview fitness industry sport fitness and health app used by competitors themes pdf. Use them to share invaluable insights on sport fitness and health app used by competitors and impress your audience. This template can be altered and modified as per your expectations. So, grab it now.
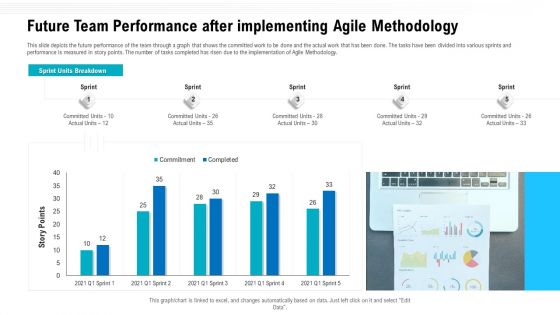
Future Team Performance After Implementing Agile Methodology Ppt Layouts Themes PDF
This slide depicts the future performance of the team through a graph that shows the committed work to be done and the actual work that has been done. The tasks have been divided into various sprints and performance is measured in story points. The number of tasks completed has risen due to the implementation of Agile Methodology. Deliver and pitch your topic in the best possible manner with this future team performance after implementing agile methodology ppt layouts themes pdf. Use them to share invaluable insights on future team performance after implementing agile methodology and impress your audience. This template can be altered and modified as per your expectations. So, grab it now.
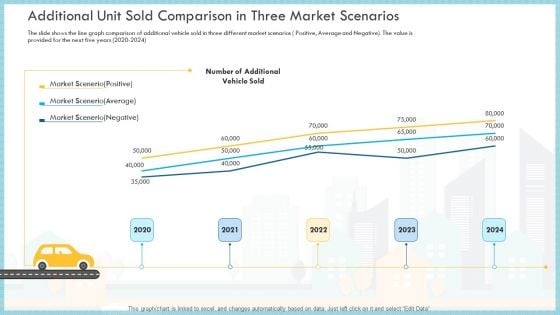
Additional Unit Sold Comparison In Three Market Scenarios Sold Themes PDF
The slide shows the line graph comparison of additional vehicle sold in three different market scenarios Positive, Average and Negative. The value is provided for the next five years 2020 to 2024 Deliver an awe inspiring pitch with this creative additional unit sold comparison in three market scenarios sold themes pdf bundle. Topics like market scenario positive, market scenario average, market scenario negative can be discussed with this completely editable template. It is available for immediate download depending on the needs and requirements of the user.
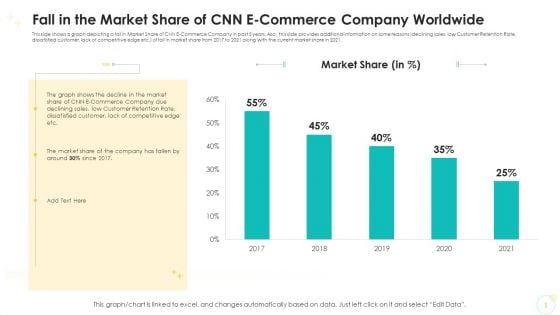
Fall In The Market Share Of CNN E Commerce Company Worldwide Themes PDF
This slide shows a graph depicting a fall in Market Share of CNN E Commerce Company in past 5 years. Also, this slide provides additional information on some reasons declining sales, low Customer Retention Rate, dissatisfied customer, lack of competitive edge etc. of fall in market share from 2017 to 2021 along with the current market share in 2021.Deliver an awe-inspiring pitch with this creative fall in the market share of CNN e commerce company worldwide themes pdf. bundle. Topics like market share, 2017 to 2021 can be discussed with this completely editable template. It is available for immediate download depending on the needs and requirements of the user.
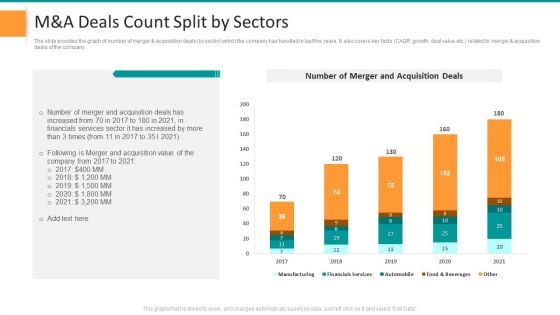
Pitch Deck For General Advisory Deal M And A Deals Count Split By Sectors Themes PDF
The slide provides the graph of number of merger and acquisition deals by sector which the company has handled in last five years. It also covers key facts CAGR growth, deal value etc. related to merger and acquisition deals of the company. Deliver an awe inspiring pitch with this creative pitch deck for general advisory deal m and a deals count split by sectors themes pdf bundle. Topics like m and a deals count split by sectors can be discussed with this completely editable template. It is available for immediate download depending on the needs and requirements of the user.
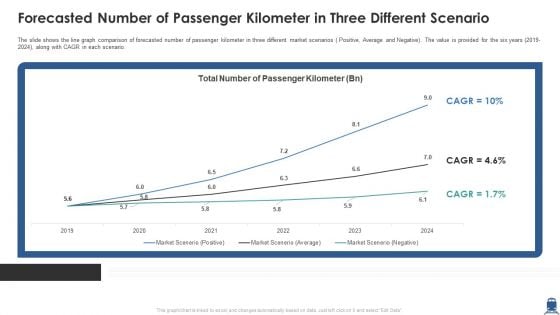
Forecasted Number Of Passenger Kilometer In Three Different Scenario Themes PDF
The slide shows the line graph comparison of forecasted number of passenger kilometer in three different market scenarios Positive, Average and Negative. The value is provided for the six years 2019-2024, along with CAGR in each scenario. Deliver and pitch your topic in the best possible manner with this forecasted number of passenger kilometer in three different scenario themes pdf. Use them to share invaluable insights on forecasted number of passenger kilometer in three different scenario and impress your audience. This template can be altered and modified as per your expectations. So, grab it now.
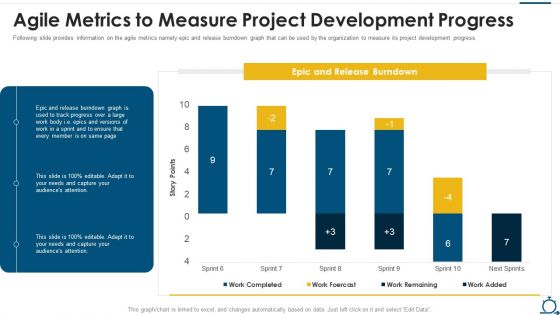
Agile SDLC IT Agile Metrics To Measure Project Development Progress Themes PDF
Following slide provides information on the agile metrics namely epic and release burndown graph that can be used by the organization to measure its project development progress. Deliver and pitch your topic in the best possible manner with this agile sdlc it agile metrics to measure project development progress themes pdf. Use them to share invaluable insights on agile metrics to measure project development progress and impress your audience. This template can be altered and modified as per your expectations. So, grab it now.
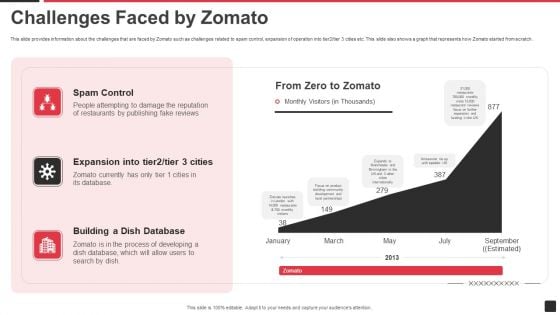
Zomato Venture Capitalist Fundraising Pitch Deck Challenges Faced By Zomato Themes PDF
This slide provides information about the challenges that are faced by Zomato such as challenges related to spam control, expansion of operation into tier2 or tier 3 cities etc. This slide also shows a graph that represents how Zomato started from scratch. Deliver an awe inspiring pitch with this creative zomato venture capitalist fundraising pitch deck challenges faced by zomato themes pdf bundle. Topics like spam control, expansion into tier2 or tier 3 cities, building a dish database can be discussed with this completely editable template. It is available for immediate download depending on the needs and requirements of the user.
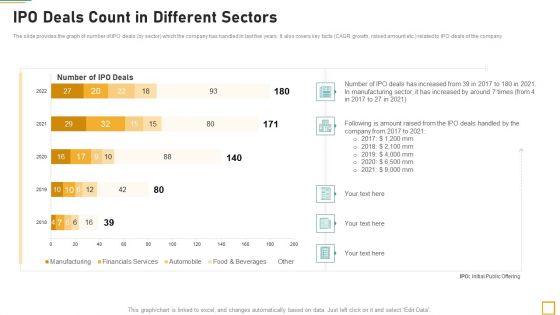
Pitch Book For Investor Funding Contract IPO Deals Count In Different Sectors Themes PDF
The slide provides the graph of number of IPO deals by sector which the company has handled in last five years. It also covers key facts CAGR growth, raised amount etc. related to IPO deals of the company. Deliver an awe inspiring pitch with this creative pitch book for investor funding contract ipo deals count in different sectors themes pdf bundle. Topics like ipo deals count in different sectors can be discussed with this completely editable template. It is available for immediate download depending on the needs and requirements of the user.
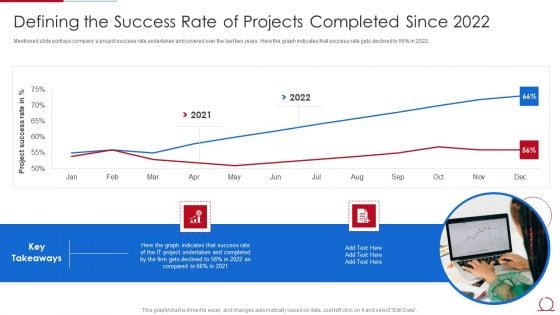
Quality Assurance Model For Agile IT Defining The Success Rate Of Projects Completed Themes PDF
Mentioned slide portrays companys project success rate undertaken and covered over the last two years. Here the graph indicates that success rate gets declined to 56 percent in 2022. Deliver an awe inspiring pitch with this creative quality assurance model for agile it defining the success rate of projects completed themes pdf bundle. Topics like success rate, it project, 2021 to 2022 can be discussed with this completely editable template. It is available for immediate download depending on the needs and requirements of the user.

Quality Assurance Model For Agile IT Forecasted Impact Of Adopting Agile Model Themes PDF
Mentioned slide portrays forecasted companys project success rate after adopting agile mode. Here the graph indicates that success rate will get increased to 73 percent in 2023. Deliver and pitch your topic in the best possible manner with this quality assurance model for agile it forecasted impact of adopting agile model themes pdf. Use them to share invaluable insights on success rate, it project, 2022 to 2023 and impress your audience. This template can be altered and modified as per your expectations. So, grab it now.
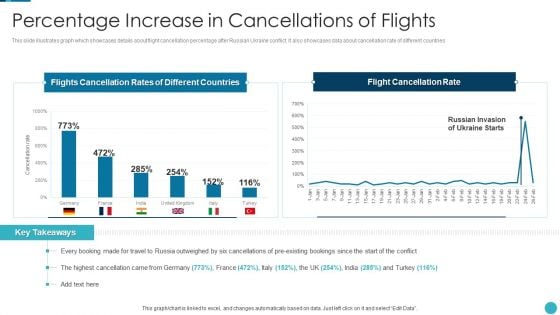
Russia Ukraine War Influence On Airline Sector Percentage Increase In Cancellations Of Flights Themes PDF
This slide illustrates graph which showcases details about flight cancellation percentage after Russian Ukraine conflict. It also showcases data about cancellation rate of different countries Deliver and pitch your topic in the best possible manner with this russia ukraine war influence on airline sector percentage increase in cancellations of flights themes pdf Use them to share invaluable insights on percentage increase in cancellations of flights and impress your audience. This template can be altered and modified as per your expectations. So, grab it now.
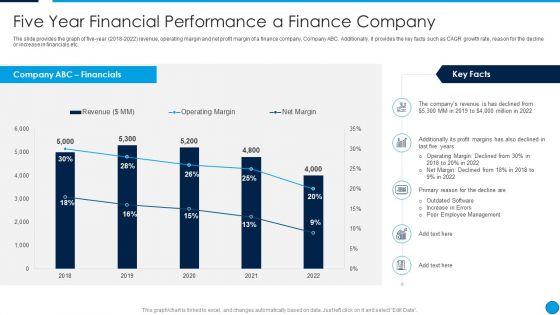
Summary Financial Five Year Financial Performance A Finance Company Themes PDF
The slide provides the graph of five-year 2018 to 2022 revenue, operating margin and net profit margin of a finance company, Company ABC. Additionally, it provides the key facts such as CAGR growth rate, reason for the decline or increase in financials etc. Deliver and pitch your topic in the best possible manner with this Summary Financial Five Year Financial Performance A Finance Company Themes PDF. Use them to share invaluable insights on Revenue, Operating Margin, Net Margin, 2018 To 2022 and impress your audience. This template can be altered and modified as per your expectations. So, grab it now.
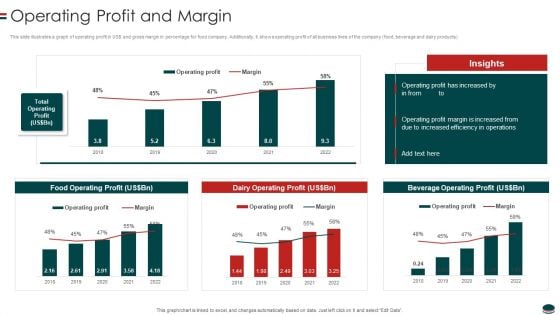
Instant Snacks And Food Firm Details Operating Profit And Margin Themes PDF
This slide illustrates a graph of operating profit in US and gross margin in percentage for food company. Additionally, it shows operating profit of all business lines of the company food, beverage and dairy products.Deliver an awe inspiring pitch with this creative Instant Snacks And Food Firm Details Operating Profit And Margin Themes PDF bundle. Topics like Operating Profit, Increased Efficiency, Beverage Operating can be discussed with this completely editable template. It is available for immediate download depending on the needs and requirements of the user.
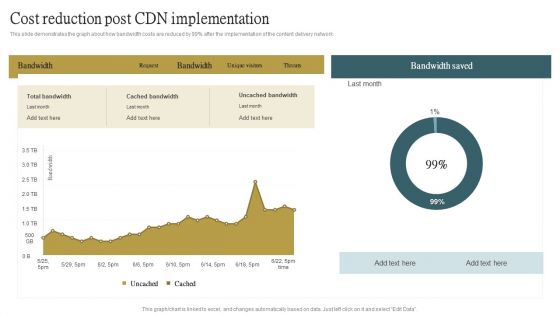
Cloud Content Delivery Network Cost Reduction Post CDN Implementation Themes PDF
This slide demonstrates the graph about how bandwidth costs are reduced by 99 percent after the implementation of the content delivery network. This Cloud Content Delivery Network Cost Reduction Post CDN Implementation Themes PDF from Slidegeeks makes it easy to present information on your topic with precision. It provides customization options, so you can make changes to the colors, design, graphics, or any other component to create a unique layout. It is also available for immediate download, so you can begin using it right away. Slidegeeks has done good research to ensure that you have everything you need to make your presentation stand out. Make a name out there for a brilliant performance.
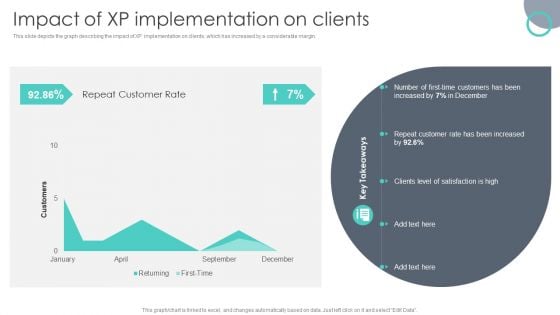
Extreme Programming Methodology Impact Of XP Implementation On Clients Themes PDF
This slide depicts the graph describing the impact of XP implementation on clients, which has increased by a considerable margin. Want to ace your presentation in front of a live audience Our Extreme Programming Methodology Impact Of XP Implementation On Clients Themes PDF can help you do that by engaging all the users towards you. Slidegeeks experts have put their efforts and expertise into creating these impeccable powerpoint presentations so that you can communicate your ideas clearly. Moreover, all the templates are customizable, and easy to edit and downloadable. Use these for both personal and commercial use.
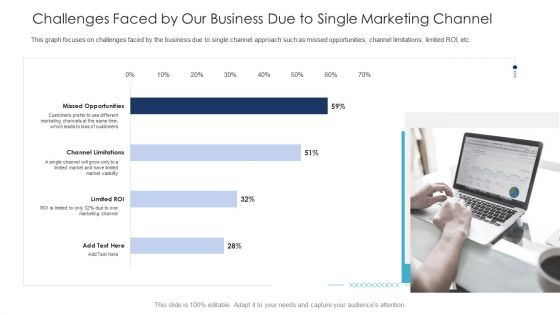
B2C Marketing Initiatives Strategies For Business Challenges Faced By Our Business Due To Single Marketing Channel Themes PDF
This graph focuses on challenges faced by the business due to single channel approach such as missed opportunities, channel limitations, limited ROI, etc. Deliver and pitch your topic in the best possible manner with this B2C marketing initiatives strategies for business challenges faced by our business due to single marketing channel themes pdf. Use them to share invaluable insights on opportunities, marketing channels, market visibility and impress your audience. This template can be altered and modified as per your expectations. So, grab it now.
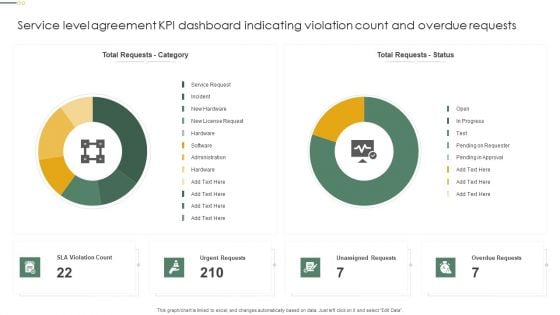
Service Level Agreement KPI Dashboard Indicating Violation Count And Overdue Requests Diagrams PDF
This graph or chart is linked to excel, and changes automatically based on data. Just left click on it and select Edit Data. Showcasing this set of slides titled Service Level Agreement KPI Dashboard Indicating Violation Count And Overdue Requests Diagrams PDF. The topics addressed in these templates are Total Requests Category, Total Requests Status, Urgent Requests. All the content presented in this PPT design is completely editable. Download it and make adjustments in color, background, font etc. as per your unique business setting.
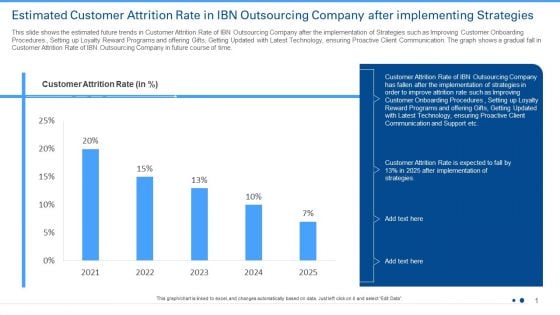
Estimated Customer Attrition Rate In IBN Outsourcing Company After Implementing Strategies Ppt Visual Aids Diagrams PDF
This slide shows a graph of decrease in level of Customer Satisfaction in IBN Outsourcing Company for past 5 years. Additionally, this slide provides information on some reasons High Response Time, Insufficient Knowledge with the Agent, Inability in Prioritizing Customer Requests etc. of fall in customer satisfaction level from 2017 to 2021.Deliver and pitch your topic in the best possible manner with this estimated customer attrition rate in ibn outsourcing company after implementing strategies ppt visual aids diagrams pdf. Use them to share invaluable insights on customer attrition rate, 2021 to 2025 and impress your audience. This template can be altered and modified as per your expectations. So, grab it now.
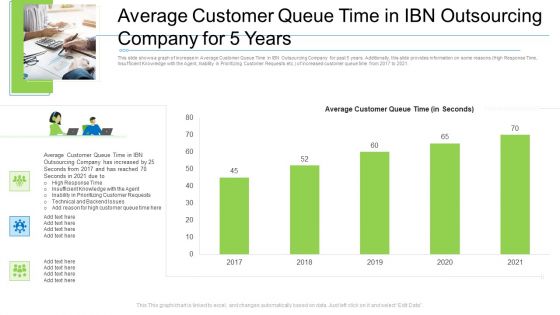
Average Customer Queue Time In Ibn Outsourcing Company For 5 Years Diagrams PDF
This slide shows a graph of increase in Average Customer Queue Time in IBN Outsourcing Company for past 5 years. Additionally, this slide provides information on some reasons High Response Time, Insufficient Knowledge with the Agent, Inability in Prioritizing Customer Requests etc. of increased customer queue time from 2017 to 2021. Deliver an awe-inspiring pitch with this creative average customer queue time in ibn outsourcing company for 5 years diagrams pdf. bundle. Topics like average customer queue time in ibn outsourcing company for 5 years can be discussed with this completely editable template. It is available for immediate download depending on the needs and requirements of the user.
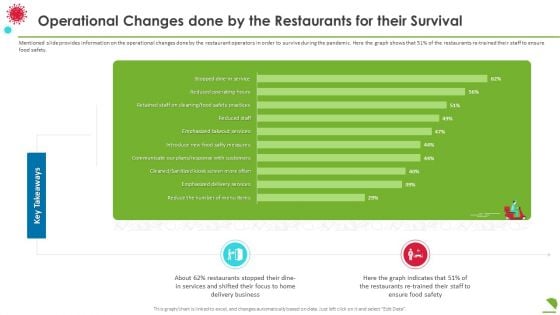
Operational Changes Done By The Restaurants For Their Survival Diagrams PDF
Mentioned slide provides information on the operational changes done by the restaurant operators in order to survive during the pandemic. Here the graph shows that 51 percentage of the restaurants re trained their staff to ensure food safety. Deliver an awe inspiring pitch with this creative operational changes done by the restaurants for their survival diagrams pdf bundle. Topics like business, services, key takeaways can be discussed with this completely editable template. It is available for immediate download depending on the needs and requirements of the user.
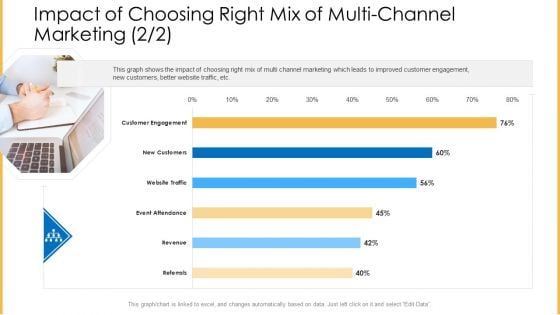
Amalgamation Marketing Pitch Deck Impact Of Choosing Right Mix Of Multi Channel Marketing Customer Diagrams PDF
This graph shows the impact of choosing right mix of multi channel marketing which leads to improved customer engagement, new customers, better website traffic, etc. Deliver and pitch your topic in the best possible manner with this amalgamation marketing pitch deck impact of choosing right mix of multi channel marketing customer diagrams pdf. Use them to share invaluable insights on engagement, website, traffic, revenue, referrals and impress your audience. This template can be altered and modified as per your expectations. So, grab it now.
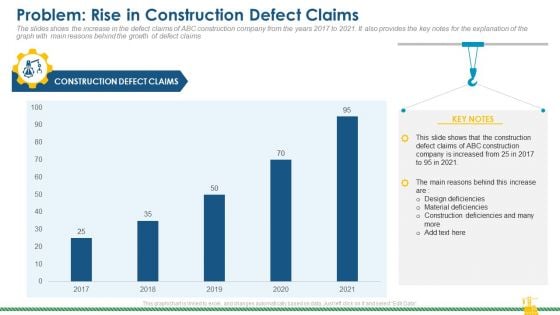
Rising Construction Defect Claims Against The Corporation Problem Rise In Construction Defect Claims Diagrams PDF
The slides shows the increase in the defect claims of ABC construction company from the years 2017 to 2021. It also provides the key notes for the explanation of the graph with main reasons behind the growth of defect claims. Deliver and pitch your topic in the best possible manner with this rising construction defect claims against the corporation problem rise in construction defect claims diagrams pdf. Use them to share invaluable insights on defect, claims, material deficiencies, design deficiencies and impress your audience. This template can be altered and modified as per your expectations. So, grab it now.
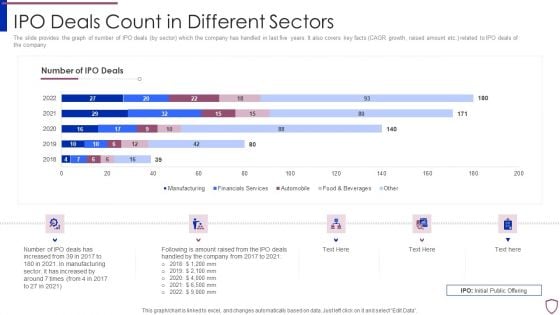
Financing Catalogue For Security Underwriting Agreement IPO Deals Count In Different Sectors Diagrams PDF
The slide provides the graph of number of IPO deals by sector which the company has handled in last five years. It also covers key facts CAGR growth, raised amount etc. related to IPO deals of the company. Deliver an awe inspiring pitch with this creative financing catalogue for security underwriting agreement ipo deals count in different sectors diagrams pdf bundle. Topics like manufacturing, financial services, automobile, food and beverages can be discussed with this completely editable template. It is available for immediate download depending on the needs and requirements of the user.
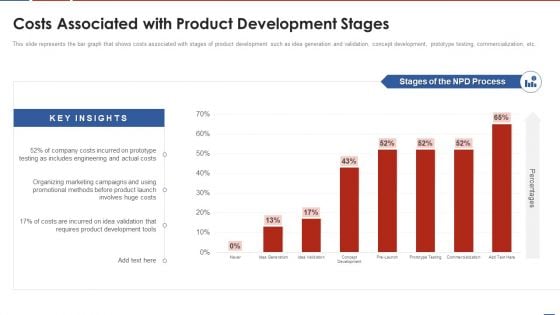
Formulating Product Development Action Plan To Enhance Client Experience Costs Associated With Product Diagrams PDF
This slide represents the bar graph that shows costs associated with stages of product development such as idea generation and validation, concept development, prototype testing, commercialization, etc. Deliver and pitch your topic in the best possible manner with this formulating product development action plan to enhance client experience costs associated with product diagrams pdf. Use them to share invaluable insights on development, costs, organizing, marketing, campaigns and impress your audience. This template can be altered and modified as per your expectations. So, grab it now.
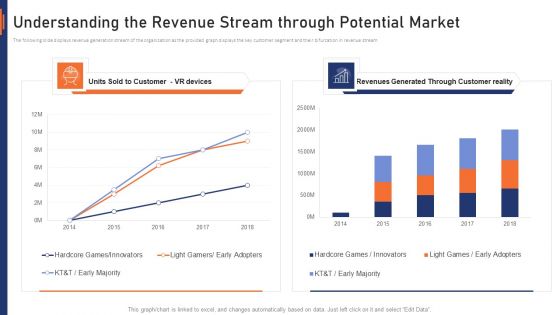
VR Market Capital Raising Elevator Pitch Deck Understanding The Revenue Stream Through Potential Market Diagrams PDF
The following slide displays revenue generation stream of the organization as the provided graph displays the key customer segment and their bifurcation in revenue stream. Deliver and pitch your topic in the best possible manner with this vr market capital raising elevator pitch deck understanding the revenue stream through potential market diagrams pdf. Use them to share invaluable insights on understanding the revenue stream through potential market and impress your audience. This template can be altered and modified as per your expectations. So, grab it now.
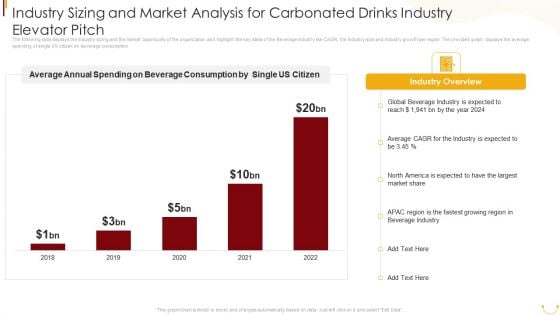
Industry Sizing And Market Analysis For Carbonated Drinks Industry Elevator Pitch Diagrams PDF
The following slide displays the Industry sizing and the market opportunity of the organization as it highlight the key stats of the Beverage industry like CAGR, the Industry size and Industry growth per region. The provided graph displays the average spending of single US citizen on beverage consumption. Deliver and pitch your topic in the best possible manner with this Industry Sizing And Market Analysis For Carbonated Drinks Industry Elevator Pitch Diagrams PDF. Use them to share invaluable insights on Average Annual Spending, Beverage Consumption, Single US Citizen, Global Beverage Industry, 2018 To 2022 and impress your audience. This template can be altered and modified as per your expectations. So, grab it now.
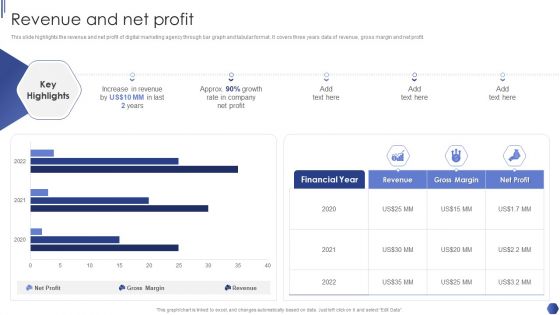
Digital Marketing Agency Business Profile Revenue And Net Profit Diagrams PDF
This slide highlights the revenue and net profit of digital marketing agency through bar graph and tabular format. It covers three years data of revenue, gross margin and net profit. Deliver and pitch your topic in the best possible manner with this Digital Marketing Agency Business Profile Revenue And Net Profit Diagrams PDF. Use them to share invaluable insights on Increase In Revenue, Growth Rate, Net Profit and impress your audience. This template can be altered and modified as per your expectations. So, grab it now.
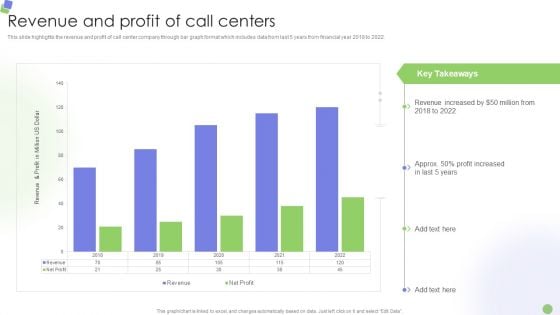
Knowledge Process Outsourcing Company Profile Revenue And Profit Of Call Centers Diagrams PDF
This slide highlights the revenue and profit of call center company through bar graph format which includes data from last 5 years from financial year 2018 to 2022.Deliver and pitch your topic in the best possible manner with this Knowledge Process Outsourcing Company Profile Revenue And Profit Of Call Centers Diagrams PDF. Use them to share invaluable insights on Revenue Increased, Profit Increased, Key Takeaways and impress your audience. This template can be altered and modified as per your expectations. So, grab it now.
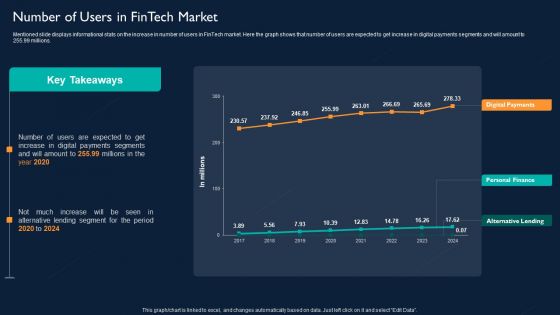
Technology Investment To Enhance Business Growth Number Of Users In Fintech Market Diagrams PDF
Mentioned slide displays informational stats on the increase in number of users in FinTech market. Here the graph shows that number of users are expected to get increase in digital payments segments and will amount to 255.99 millions. Deliver and pitch your topic in the best possible manner with this Technology Investment To Enhance Business Growth Number Of Users In Fintech Market Diagrams PDF. Use them to share invaluable insights on Alternative Lending, Personal Finance, Digital Payments and impress your audience. This template can be altered and modified as per your expectations. So, grab it now.

Expectations After Expanding Into Global Markets Ppt PowerPoint Presentation Diagram Lists PDF
This slide showcase graph that can help organization to estimate the impact on organizational sales after global expansion. It showcases sales in thousand dollars and forecast for a period of two years.Want to ace your presentation in front of a live audience Our Expectations After Expanding Into Global Markets Ppt PowerPoint Presentation Diagram Lists PDF can help you do that by engaging all the users towards you.. Slidegeeks experts have put their efforts and expertise into creating these impeccable powerpoint presentations so that you can communicate your ideas clearly. Moreover, all the templates are customizable, and easy-to-edit and downloadable. Use these for both personal and commercial use.
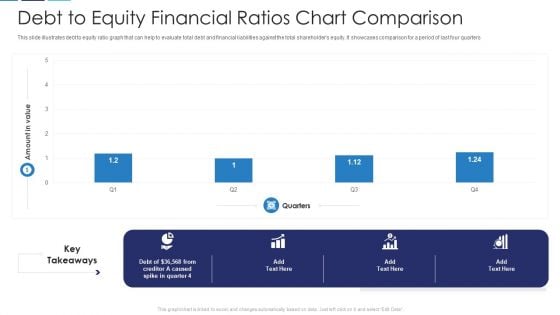
Debt To Equity Financial Ratios Chart Comparison Download PDF
This slide illustrates debt to equity ratio graph that can help to evaluate total debt and financial liabilities against the total shareholders equity. It showcases comparison for a period of last four quarters Pitch your topic with ease and precision using this debt to equity financial ratios chart comparison download pdf. This layout presents information on debt to equity financial ratios chart comparison. It is also available for immediate download and adjustment. So, changes can be made in the color, design, graphics or any other component to create a unique layout.
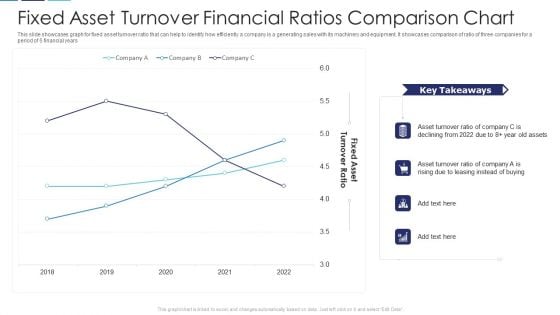
Fixed Asset Turnover Financial Ratios Comparison Chart Structure PDF
This slide showcases graph for fixed asset turnover ratio that can help to identify how efficiently a company is a generating sales with its machinery and equipment. It showcases comparison of ratio of three companies for a period of 5 financial years Showcasing this set of slides titled fixed asset turnover financial ratios comparison chart structure pdf. The topics addressed in these templates are fixed asset turnover financial ratios comparison chart. All the content presented in this PPT design is completely editable. Download it and make adjustments in color, background, font etc. as per your unique business setting.
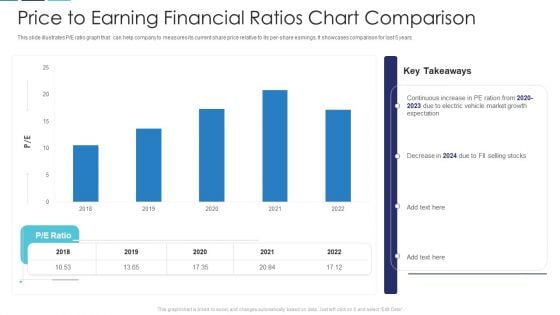
Price To Earning Financial Ratios Chart Comparison Slides PDF
This slide illustrates P or E ratio graph that can help company to measures its current share price relative to its per-share earnings. It showcases comparison for last 5 years Showcasing this set of slides titled price to earning financial ratios chart comparison slides pdf. The topics addressed in these templates are price to earning financial ratios chart comparison. All the content presented in this PPT design is completely editable. Download it and make adjustments in color, background, font etc. as per your unique business setting.
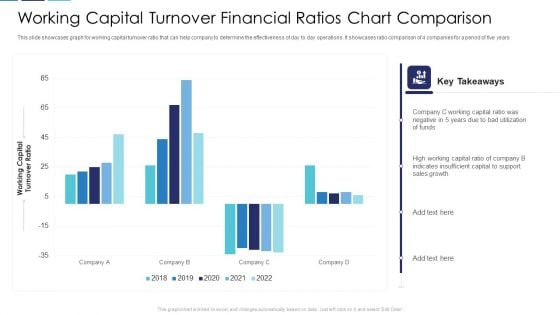
Working Capital Turnover Financial Ratios Chart Comparison Clipart PDF
This slide showcases graph for working capital turnover ratio that can help company to determine the effectiveness of day to day operations. It showcases ratio comparison of 4 companies for a period of five years Pitch your topic with ease and precision using this working capital turnover financial ratios chart comparison clipart pdf. This layout presents information on working capital turnover financial ratios chart comparison. It is also available for immediate download and adjustment. So, changes can be made in the color, design, graphics or any other component to create a unique layout.
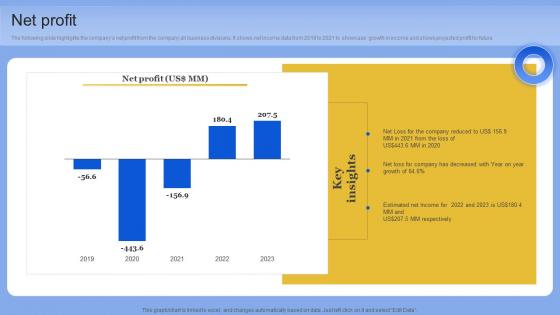
Net Profit Data Analytics Company Outline Diagrams PDF
The following slide highlights the companys net profit from the company all business divisions. It shows net income data from 2019 to 2021 to showcase growth in income and shows projected profit for future. Retrieve professionally designed Net Profit Data Analytics Company Outline Diagrams PDF to effectively convey your message and captivate your listeners. Save time by selecting pre-made slideshows that are appropriate for various topics, from business to educational purposes. These themes come in many different styles, from creative to corporate, and all of them are easily adjustable and can be edited quickly. Access them as PowerPoint templates or as Google Slides themes. You do not have to go on a hunt for the perfect presentation because Slidegeeks got you covered from everywhere. The following slide highlights the companys net profit from the company all business divisions. It shows net income data from 2019 to 2021 to showcase growth in income and shows projected profit for future
Ppt Half Circle PowerPoint 2010 Stage Through Bubbles 4 Steps Templates
PPT half circle powerpoint 2010 stage through bubbles 4 steps Templates-Use this Business based PowerPoint Diagram to represent the Business issues Graphically. It indicates arrange, block out, blueprint, cast, delineate, design, devise, draft, graph , lay out, outline, plot, project, shape, sketch etc.-PPT half circle powerpoint 2010 stage through bubbles 4 steps Templates-Add, Aqua, Arrows, Badges, Bar, Blend, Blue, Bright, Bubbles, Buttons, Caution, Circle, Drop, Elements, Glossy, Glowing, Graphic, Heart, Help, Icons, Idea, Illustration, Navigation, Oblong, Plus, Round, Service, Shadow, Shiny, Sign, Speech, Squares Display your faith in your team with our Ppt Half Circle PowerPoint 2010 Stage Through Bubbles 4 Steps Templates. Demonstrate your strong belief in them.
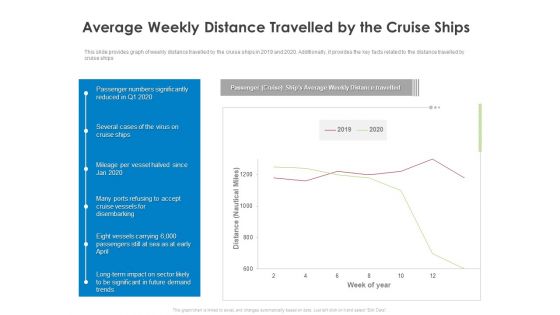
COVID 19 Risk Analysis Mitigation Policies Ocean Liner Sector Average Weekly Distance Travelled By The Cruise Ships Diagrams PDF
This slide provides graph of weekly distance travelled by the cruise ships in 2019 and 2020. Additionally, it provides the key facts related to the distance travelled by cruise ships. Deliver an awe inspiring pitch with this creative covid 19 risk analysis mitigation policies ocean liner sector average weekly distance travelled by the cruise ships diagrams pdf bundle. Topics like average weekly distance travelled by the cruise ships can be discussed with this completely editable template. It is available for immediate download depending on the needs and requirements of the user.
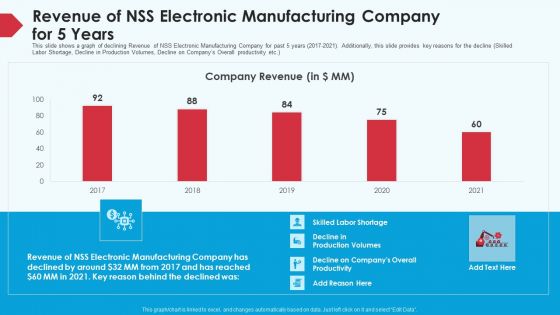
Skill Shortage In A Production Firm Case Study Solution Revenue Of NSS Electronic Manufacturing Company For 5 Years Diagrams PDF
This slide shows a graph of declining Revenue of NSS Electronic Manufacturing Company for past 5 years 2017-2021. Additionally, this slide provides key reasons for the decline Skilled Labor Shortage, Decline in Production Volumes, Decline on Companys Overall productivity etc. Deliver an awe inspiring pitch with this creative skill shortage in a production firm case study solution revenue of NSS electronic manufacturing company for 5 years diagrams pdf bundle. Topics like revenue, manufacturing, companys overall productivity, 2017 to 2021 can be discussed with this completely editable template. It is available for immediate download depending on the needs and requirements of the user.
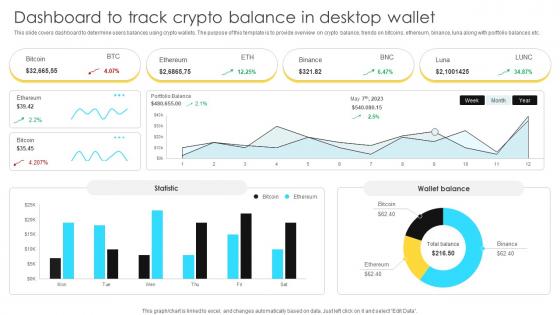
Mastering Blockchain Wallets Dashboard To Track Crypto Balance In Desktop Wallet BCT SS V
This slide covers dashboard to determine users balances using crypto wallets. The purpose of this template is to provide overview on crypto balance, trends on bitcoins, ethereum, binance, luna along with portfolio balances etc. This Mastering Blockchain Wallets Dashboard To Track Crypto Balance In Desktop Wallet BCT SS V is perfect for any presentation, be it in front of clients or colleagues. It is a versatile and stylish solution for organizing your meetings. The Mastering Blockchain Wallets Dashboard To Track Crypto Balance In Desktop Wallet BCT SS V features a modern design for your presentation meetings. The adjustable and customizable slides provide unlimited possibilities for acing up your presentation. Slidegeeks has done all the homework before launching the product for you. So, do not wait, grab the presentation templates today This slide covers dashboard to determine users balances using crypto wallets. The purpose of this template is to provide overview on crypto balance, trends on bitcoins, ethereum, binance, luna along with portfolio balances etc.
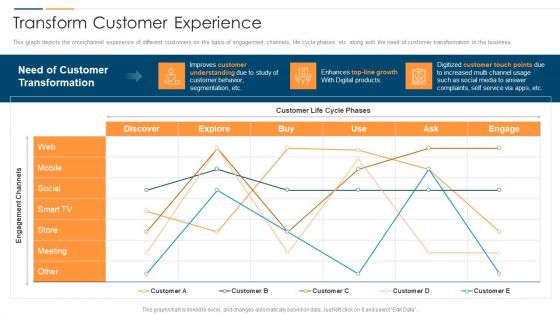
Revolution In Online Business Transform Customer Experience Ppt PowerPoint Presentation Gallery Microsoft PDF
This graph depicts the omnichannel experience of different customer on the basis of engagement channels, life cycle phases, etc. along with the need of customer transformation in the business. Deliver an awe inspiring pitch with this creative Revolution In Online Business Transform Customer Experience Ppt PowerPoint Presentation Gallery Microsoft PDF bundle. Topics like Engagement Channels Customer, Need Customer Transformation, Growth Digital Products can be discussed with this completely editable template. It is available for immediate download depending on the needs and requirements of the user.
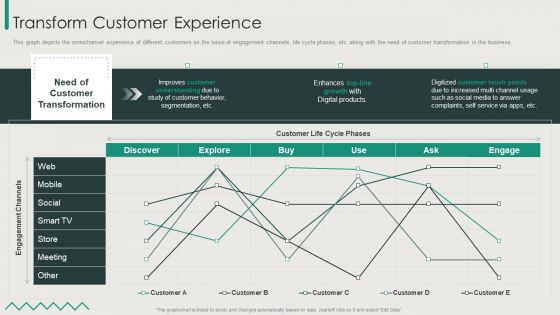
Organization Transition Transform Customer Experience Ppt PowerPoint Presentation File Pictures PDF
This graph depicts the omnichannel experience of different customers on the basis of engagement channels, life cycle phases, etc. along with the need of customer transformation in the business. Deliver and pitch your topic in the best possible manner with this Organization Transition Transform Customer Experience Ppt PowerPoint Presentation File Pictures PDF. Use them to share invaluable insights on Improves Customer, Customer Life, Digital Products and impress your audience. This template can be altered and modified as per your expectations. So, grab it now.
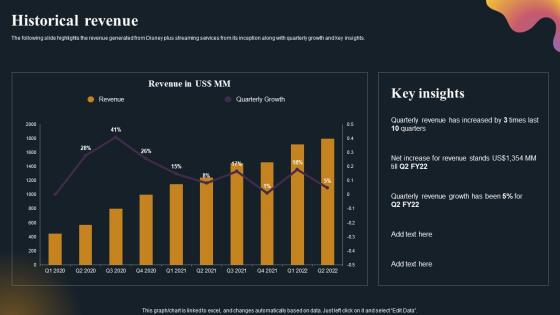
Historical Revenue OTT Platform Company Outline Diagrams Pdf
The following slide highlights the revenue generated from Disney plus streaming services from its inception along with quarterly growth and key insights. If you are looking for a format to display your unique thoughts, then the professionally designed Historical Revenue OTT Platform Company Outline Diagrams Pdf is the one for you. You can use it as a Google Slides template or a PowerPoint template. Incorporate impressive visuals, symbols, images, and other charts. Modify or reorganize the text boxes as you desire. Experiment with shade schemes and font pairings. Alter, share or cooperate with other people on your work. Download Historical Revenue OTT Platform Company Outline Diagrams Pdf and find out how to give a successful presentation. Present a perfect display to your team and make your presentation unforgettable. The following slide highlights the revenue generated from Disney plus streaming services from its inception along with quarterly growth and key insights.
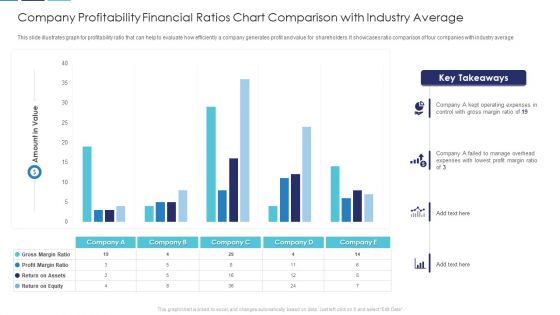
Company Profitability Financial Ratios Chart Comparison With Industry Average Download PDF
This slide illustrates graph for profitability ratio that can help to evaluate how efficiently a company generates profit and value for shareholders. It showcases ratio comparison of four companies with industry average Showcasing this set of slides titled company profitability financial ratios chart comparison with industry average download pdf. The topics addressed in these templates are company profitability financial ratios chart comparison with industry average. All the content presented in this PPT design is completely editable. Download it and make adjustments in color, background, font etc. as per your unique business setting.
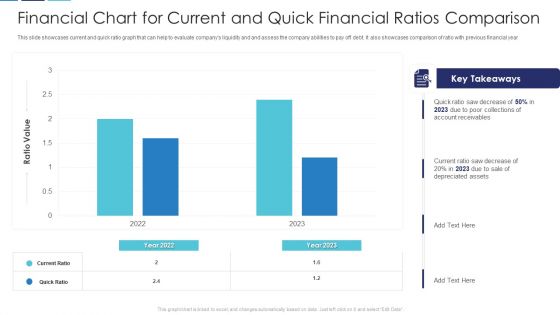
Financial Chart For Current And Quick Financial Ratios Comparison Brochure PDF
This slide showcases current and quick ratio graph that can help to evaluate companys liquidity and and assess the company abilities to pay off debt. It also showcases comparison of ratio with previous financial year Pitch your topic with ease and precision using this financial chart for current and quick financial ratios comparison brochure pdf. This layout presents information on financial chart for current and quick financial ratios comparison. It is also available for immediate download and adjustment. So, changes can be made in the color, design, graphics or any other component to create a unique layout.
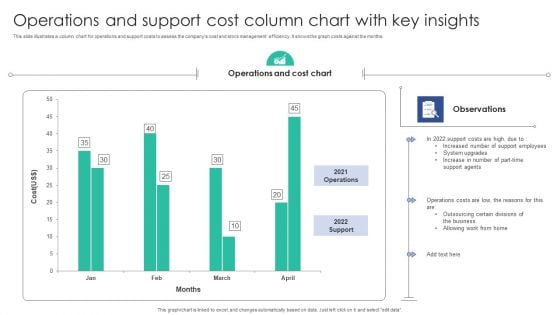
Operations And Support Cost Column Chart With Key Insights Background PDF
This slide illustrates a column chart for operations and support costs to assess the companys cost and stock management efficiency. It shows the graph costs against the months.Showcasing this set of slides titled Operations And Support Cost Column Chart With Key Insights Background PDF. The topics addressed in these templates are Operations Cost, Support Agents, Support Employees. All the content presented in this PPT design is completely editable. Download it and make adjustments in color, background, font etc. as per your unique business setting.
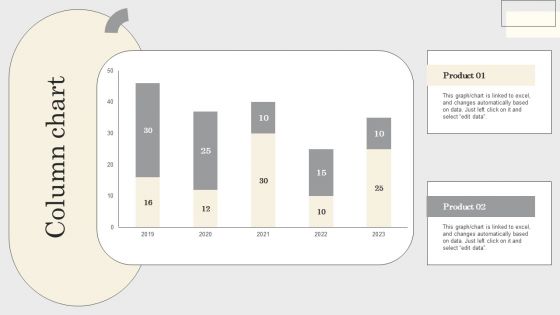
Steps To Conduct Competitor Analysis Column Chart Ppt Model Gridlines PDF
This graph or chart is linked to excel, and changes automatically based on data. Just left click on it and select edit data. If your project calls for a presentation, then Slidegeeks is your go-to partner because we have professionally designed, easy-to-edit templates that are perfect for any presentation. After downloading, you can easily edit Steps To Conduct Competitor Analysis Column Chart Ppt Model Gridlines PDF and make the changes accordingly. You can rearrange slides or fill them with different images. Check out all the handy templates
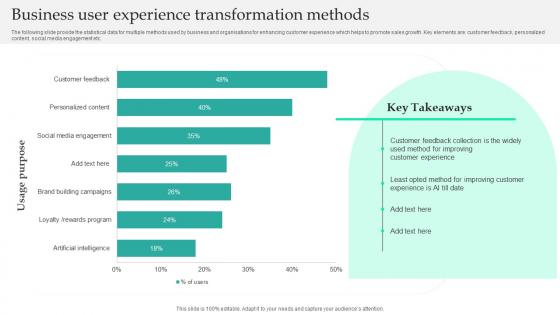
Business User Experience Transformation Methods Diagrams Pdf
The following slide provide the statistical data for multiple methods used by business and organisations for enhancing customer experience which helps to promote sales growth. Key elements are customer feedback, personalized content, social media engagement etc. Showcasing this set of slides titled Business User Experience Transformation Methods Diagrams Pdf. The topics addressed in these templates are Business User Experience, Transformation Methods. All the content presented in this PPT design is completely editable. Download it and make adjustments in color, background, font etc. as per your unique business setting. The following slide provide the statistical data for multiple methods used by business and organisations for enhancing customer experience which helps to promote sales growth. Key elements are customer feedback, personalized content, social media engagement etc.
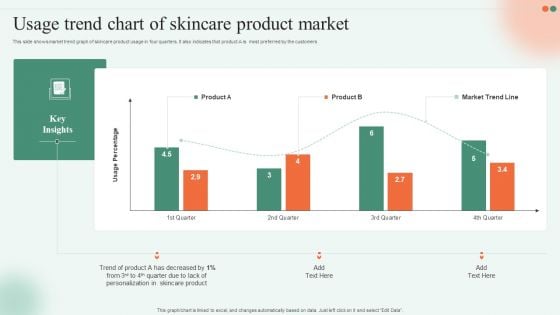
Usage Trend Chart Of Skincare Product Market Ppt Slides Graphics Download PDF
This slide shows market trend graph of skincare product usage in four quarters. It also indicates that product A is most preferred by the customers. Pitch your topic with ease and precision using this Usage Trend Chart Of Skincare Product Market Ppt Slides Graphics Download PDF. This layout presents information on Trend Product, Skincare Product, Quarter Due. It is also available for immediate download and adjustment. So, changes can be made in the color, design, graphics or any other component to create a unique layout.
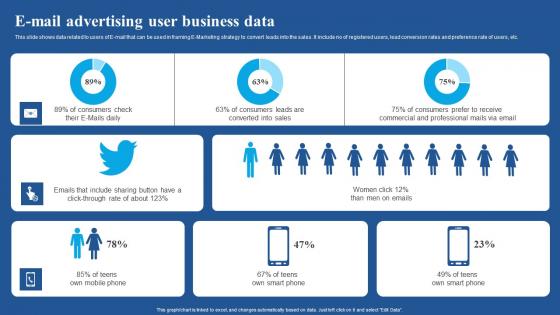
E Mail Advertising User Business Data Diagrams Pdf
This slide shows data related to users of E-mail that can be used in framing E-Marketing strategy to convert leads into the sales. It include no of registered users, lead conversion rates and preference rate of users, etc.Showcasing this set of slides titled E Mail Advertising User Business Data Diagrams Pdf The topics addressed in these templates are E Mail Advertising, User Business Data All the content presented in this PPT design is completely editable. Download it and make adjustments in color, background, font etc. as per your unique business setting. This slide shows data related to users of E mail that can be used in framing E Marketing strategy to convert leads into the sales. It include no of registered users, lead conversion rates and preference rate of users, etc.
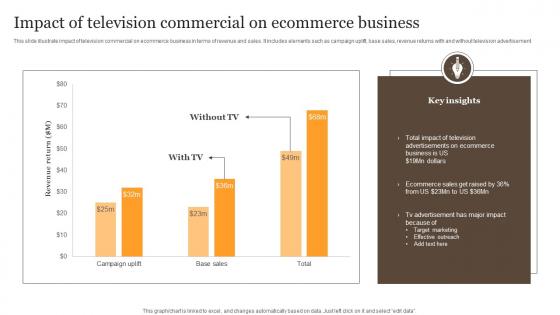
Impact Of Television Commercial On Ecommerce Business Diagrams Pdf
This slide illustrate impact of television commercial on ecommerce business in terms of revenue and sales. It includes elements such as campaign uplift, base sales, revenue returns with and without television advertisement Pitch your topic with ease and precision using this Impact Of Television Commercial On Ecommerce Business Diagrams Pdf. This layout presents information on Insights, Ecommerce, Business. It is also available for immediate download and adjustment. So, changes can be made in the color, design, graphics or any other component to create a unique layout. This slide illustrate impact of television commercial on ecommerce business in terms of revenue and sales. It includes elements such as campaign uplift, base sales, revenue returns with and without television advertisement

Cost Breakdown For Executing Effective Advertising Plan Diagrams Pdf
This slide graphically provides information about the promotional plan budget allocation that outline money business intends to spend on marketing related activities. It includes online marketing, direct marketing, personal selling, etc. Pitch your topic with ease and precision using this Cost Breakdown For Executing Effective Advertising Plan Diagrams Pdf. This layout presents information on Online Marketing, Budget Allocation. It is also available for immediate download and adjustment. So, changes can be made in the color, design, graphics or any other component to create a unique layout. This slide graphically provides information about the promotional plan budget allocation that outline money business intends to spend on marketing related activities. It includes online marketing, direct marketing, personal selling, etc.
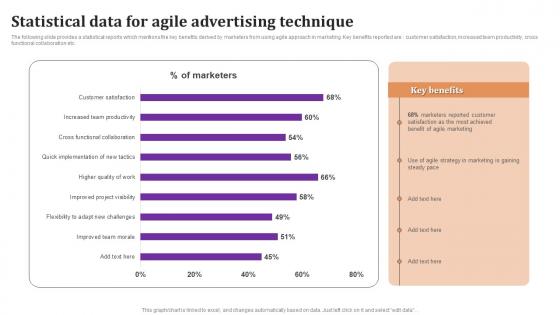
Statistical Data For Agile Advertising Technique Diagrams Pdf
The following slide provides a statistical reports which mentions the key benefits derived by marketers from using agile approach in marketing. Key benefits reported are customer satisfaction, increased team productivity, cross functional collaboration etc. Pitch your topic with ease and precision using this Statistical Data For Agile Advertising Technique Diagrams Pdf This layout presents information on Statistical Data, Agile Advertising, Technique It is also available for immediate download and adjustment. So, changes can be made in the color, design, graphics or any other component to create a unique layout. The following slide provides a statistical reports which mentions the key benefits derived by marketers from using agile approach in marketing. Key benefits reported are customer satisfaction, increased team productivity, cross functional collaboration etc.
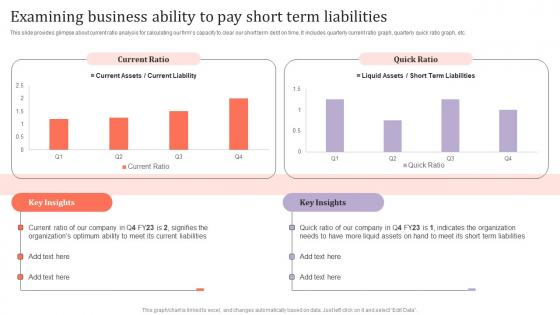
Examining Business Ability Pay Short Assessing Corporate Financial Techniques Diagrams Pdf
This slide provides glimpse about current ratio analysis for calculating our firms capacity to clear our short term debt on time. It includes quarterly current ratio graph, quarterly quick ratio graph, etc. This Examining Business Ability Pay Short Assessing Corporate Financial Techniques Diagrams Pdf is perfect for any presentation, be it in front of clients or colleagues. It is a versatile and stylish solution for organizing your meetings. The Examining Business Ability Pay Short Assessing Corporate Financial Techniques Diagrams Pdf features a modern design for your presentation meetings. The adjustable and customizable slides provide unlimited possibilities for acing up your presentation. Slidegeeks has done all the homework before launching the product for you. So, do not wait, grab the presentation templates today This slide provides glimpse about current ratio analysis for calculating our firms capacity to clear our short term debt on time. It includes quarterly current ratio graph, quarterly quick ratio graph, etc.
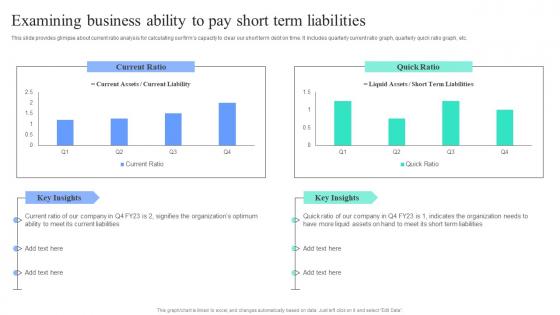
Strategic Financial Planning And Administration Examining Business Ability Pay Short Term Diagrams PDF
This slide provides glimpse about current ratio analysis for calculating our firms capacity to clear our short term debt on time. It includes quarterly current ratio graph, quarterly quick ratio graph, etc. Welcome to our selection of the Strategic Financial Planning And Administration Examining Business Ability Pay Short Term Diagrams PDF. These are designed to help you showcase your creativity and bring your sphere to life. Planning and Innovation are essential for any business that is just starting out. This collection contains the designs that you need for your everyday presentations. All of our PowerPoints are 100 percent editable, so you can customize them to suit your needs. This multi-purpose template can be used in various situations. Grab these presentation templates today This slide provides glimpse about current ratio analysis for calculating our firms capacity to clear our short term debt on time. It includes quarterly current ratio graph, quarterly quick ratio graph, etc.
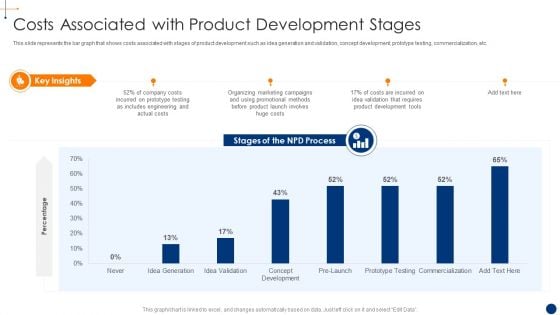
New Product Development Process Optimization Costs Associated With Product Pictures PDF
This slide represents the bar graph that shows costs associated with stages of product development such as idea generation and validation, concept development, prototype testing, commercialization, etc. Deliver and pitch your topic in the best possible manner with this new product development process optimization automating sales related activities diagrams pdf . Use them to share invaluable insights on automating sales related activities to accelerate product delivery and impress your audience. This template can be altered and modified as per your expectations. So, grab it now.
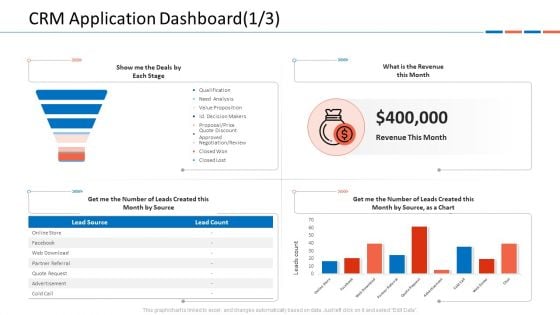
Customer Relationship Management Dashboard CRM Application Dashboard Month Microsoft PDF
This graph or chart is linked to excel, and changes automatically based on data. Just left click on it and select Edit Data.Deliver an awe-inspiring pitch with this creative customer relationship management dashboard crm application dashboard month microsoft pdf bundle. Topics like show me the deals by each stage, what is the revenue this month, get me the number of leads created this month by source as a chart can be discussed with this completely editable template. It is available for immediate download depending on the needs and requirements of the user.

Talent Acquisition And Recruitment Methods Used By Hiring Department Ppt PowerPoint Presentation Layouts Templates PDF
This graph or chart is linked to excel, and changes automatically based on data. Just left click on it and select Edit Data. Showcasing this set of slides titled talent acquisition and recruitment methods used by hiring department ppt powerpoint presentation layouts templates pdf. The topics addressed in these templates are other methods, paid software, job fairs, employee referrals, jobs boards, social networks. All the content presented in this PPT design is completely editable. Download it and make adjustments in color, background, font etc. as per your unique business setting.
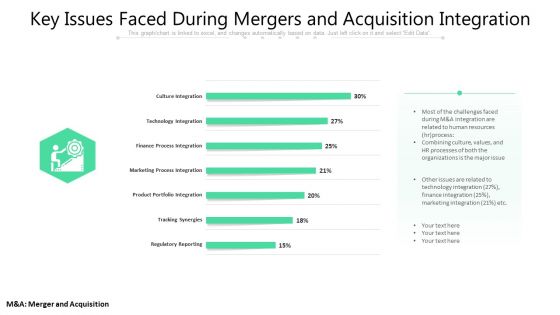
Key Issues Faced During Mergers And Acquisition Integration Ppt PowerPoint Presentation Summary Graphics PDF
This graph or chart is linked to excel, and changes automatically based on data. Just left click on it and select Edit Data. Showcasing this set of slides titled key issues faced during mergers and acquisition integration ppt powerpoint presentation summary graphics pdf. The topics addressed in these templates are culture integration, technology integration, finance process integration, marketing process integration, product portfolio integration, tracking synergies, regulatory reporting. All the content presented in this PPT design is completely editable. Download it and make adjustments in color, background, font etc. as per your unique business setting.
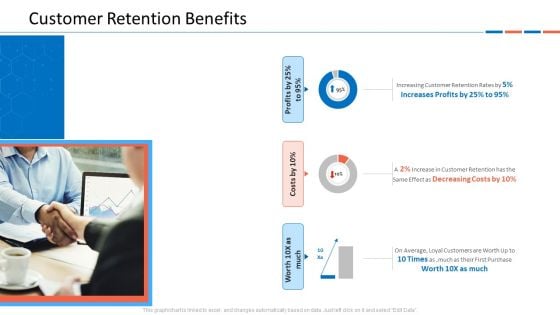
Customer Relationship Management Dashboard Customer Retention Benefits Inspiration PDF
This graph or chart is linked to excel, and changes automatically based on data. Just left click on it and select Edit Data.Deliver an awe inspiring pitch with this creative customer relationship management dashboard customer retention benefits inspiration pdf bundle. Topics like increasing customer retention rates, on average, loyal customers are worth up to 10 times as ,much as their first purchase, profits by 25percent to 95percent can be discussed with this completely editable template. It is available for immediate download depending on the needs and requirements of the user.
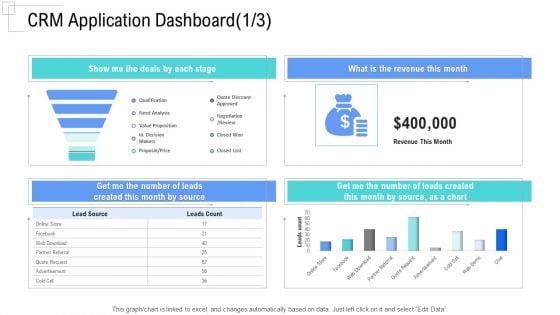
Managing Customer Experience CRM Application Dashboard Month Mockup PDF
This graph or chart is linked to excel, and changes automatically based on data. Just left click on it and select Edit Data.Deliver an awe-inspiring pitch with this creative managing customer experience crm application dashboard month mockup pdf bundle. Topics like show me the deals by each stage, what is the revenue this month, get me the number of leads created this month by source can be discussed with this completely editable template. It is available for immediate download depending on the needs and requirements of the user.

Managing Customer Experience CRM Data Analysis Sales Pictures PDF
This graph or chart is linked to excel, and changes automatically based on data. Just left click on it and select Edit Data.Deliver and pitch your topic in the best possible manner with this managing customer experience crm data analysis sales pictures pdf. Use them to share invaluable insights on entities by rep, completed activities l, biz notes this month, phone calls last 3 months, activity last 3 months and impress your audience. This template can be altered and modified as per your expectations. So, grab it now.
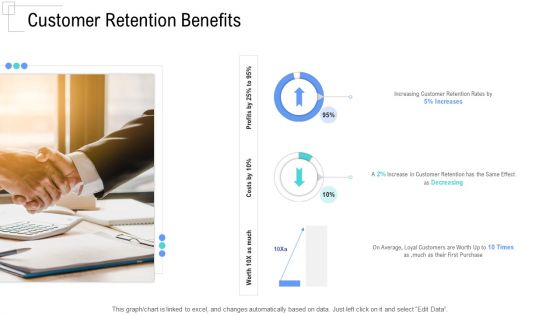
Managing Customer Experience Customer Retention Benefits Template PDF
This graph or chart is linked to excel, and changes automatically based on data. Just left click on it and select Edit Data.Deliver and pitch your topic in the best possible manner with this managing customer experience customer retention benefits template pdf. Use them to share invaluable insights on increasing customer retention rates by, average, loyal customers are worth up to 10 times as much as their first purchase, worth 10x as much and impress your audience. This template can be altered and modified as per your expectations. So, grab it now.
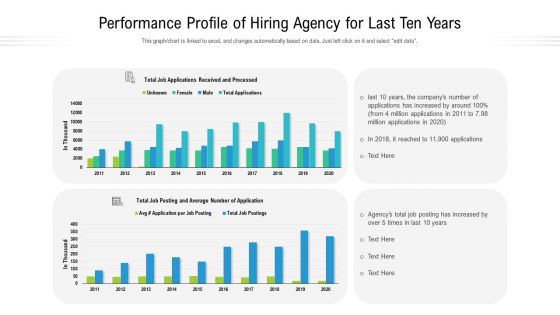
Performance Profile Of Hiring Agency For Last Ten Years Ppt Show Styles PDF
This graph to chart is linked to excel, and changes automatically based on data. Just left click on it and select edit data. Showcasing this set of slides titled performance profile of hiring agency for last ten years ppt show styles pdf. The topics addressed in these templates are performance profile of hiring agency for last ten years. All the content presented in this PPT design is completely editable. Download it and make adjustments in color, background, font etc. as per your unique business setting.
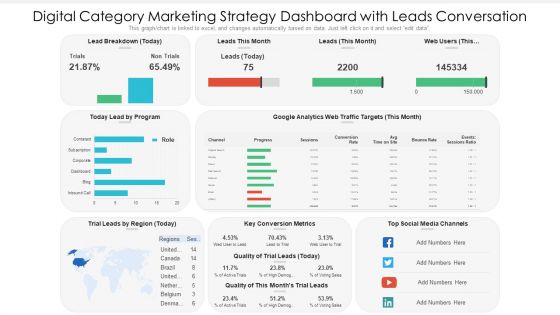
Digital Category Marketing Strategy Dashboard With Leads Conversation Ppt PowerPoint Presentation Slides Information PDF
This graph chart is linked to excel, and changes automatically based on data. Just left click on it and select edit data. Pitch your topic with ease and precision using this digital category marketing strategy dashboard with leads conversation ppt powerpoint presentation slides information pdf. This layout presents information on key conversion metrics, social media channels, lead by program. It is also available for immediate download and adjustment. So, changes can be made in the color, design, graphics or any other component to create a unique layout.
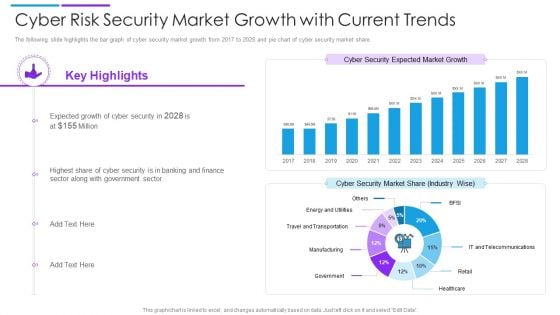
Cyber Risk Security Market Growth With Current Trends Summary PDF
The following slide highlights the bar graph of cyber security market growth from 2017 to 2028 and pie chart of cyber security market share. Showcasing this set of slides titled cyber risk security market growth with current trends summary pdf. The topics addressed in these templates are cyber security market share, cyber security expected market growth, banking and finance. All the content presented in this PPT design is completely editable. Download it and make adjustments in color, background, font etc. as per your unique business setting.
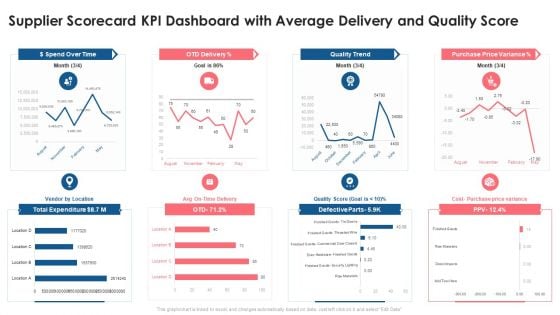
Supplier Scorecard Supplier Scorecard KPI Dashboard With Average Delivery And Quality Score Introduction PDF
This graph or chart is linked to excel, and changes automatically based on data. Just left click on it and select Edit Data. Deliver an awe inspiring pitch with this creative supplier scorecard supplier scorecard kpi dashboard with average delivery and quality score introduction pdf bundle. Topics like dollar spend over time, otd delivery, quality trend, purchase price variance, total expenditure can be discussed with this completely editable template. It is available for immediate download depending on the needs and requirements of the user.
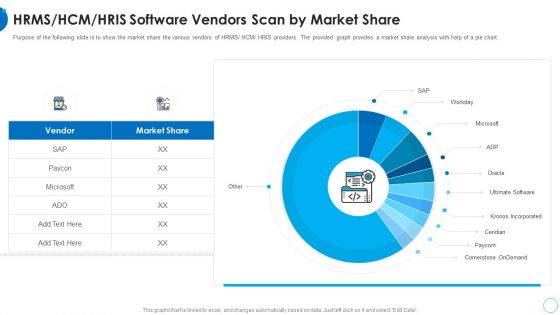
RMS HCM HRIS Software Vendors Scan By Market Share HR Change Management Tools Introduction PDF
Purpose of the following slide is to show the market share the various vendors of HRMS or HCM or HRIS providers. The provided graph provides a market share analysis with help of a pie chart. Deliver and pitch your topic in the best possible manner with this rms hcm hris software vendors scan by market share hr change management tools introduction pdf. Use them to share invaluable insights on hrms or hcm or hris software vendors scan by market share and impress your audience. This template can be altered and modified as per your expectations. So, grab it now.
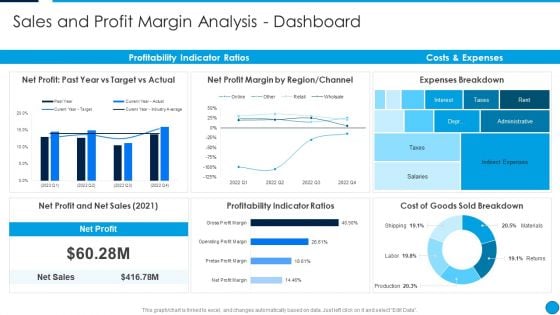
Summary Financial Sales And Profit Margin Analysis Dashboard Pictures PDF
This graph or chart is linked to excel, and changes automatically based on data. Just left click on it and select Edit Data. Deliver an awe inspiring pitch with this creative Summary Financial Sales And Profit Margin Analysis Dashboard Pictures PDF bundle. Topics like Net Profit, Past Year Vs Target Vs Actual, Net Profit Margin By Region, Channel, Expenses Breakdown, Costs And Expenses, Profitability Indicator Ratios can be discussed with this completely editable template. It is available for immediate download depending on the needs and requirements of the user.
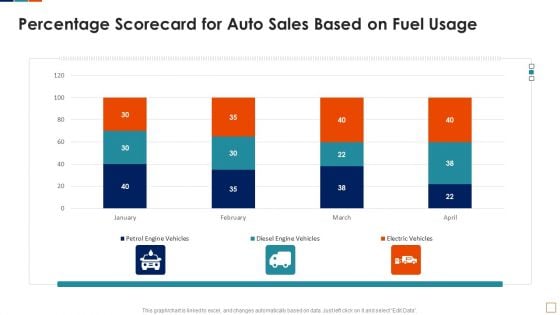
Automobile Sales Scorecard Percentage Scorecard For Auto Sales Based On Fuel Usage Graphics PDF
This graph or chart is linked to excel, and changes automatically based on data. Just left click on it and select Edit Data. Deliver and pitch your topic in the best possible manner with this Automobile Sales Scorecard Percentage Scorecard For Auto Sales Based On Fuel Usage Graphics PDF. Use them to share invaluable insights on Petrol Engine Vehicles, Diesel Engine Vehicles, Electric Vehicles Sales and impress your audience. This template can be altered and modified as per your expectations. So, grab it now.
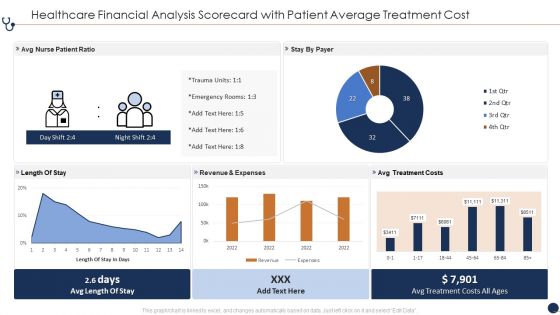
Healthcare Financial Analysis Scorecard With Patient Average Treatment Cost Ppt Infographic Template Slide Portrait PDF
This graph or chart is linked to excel, and changes automatically based on data. Just left click on it and select Edit Data. Deliver and pitch your topic in the best possible manner with this Healthcare Financial Analysis Scorecard With Patient Average Treatment Cost Ppt Infographic Template Slide Portrait PDF. Use them to share invaluable insights on Avg Nurse Patient, Revenue And Expenses, Avg Treatment Costs and impress your audience. This template can be altered and modified as per your expectations. So, grab it now.
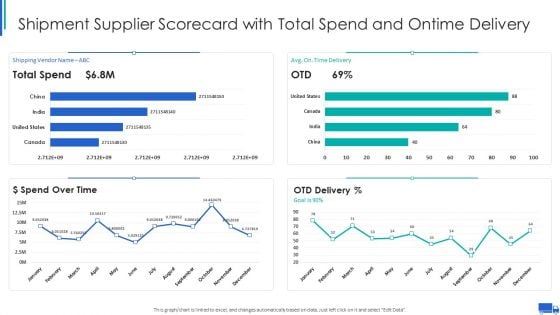
Shipment Supplier Scorecard With Total Spend And Ontime Delivery Ppt Slides Templates PDF
This graph or chart is linked to excel, and changes automatically based on data. Just left click on it and select Edit Data. Deliver and pitch your topic in the best possible manner with this Shipment Supplier Scorecard With Total Spend And Ontime Delivery Ppt Slides Templates PDF. Use them to share invaluable insights on Shipping Vendor Avg, Time Delivery Goal, Spend Over Time, OTD Delivery Percent and impress your audience. This template can be altered and modified as per your expectations. So, grab it now.
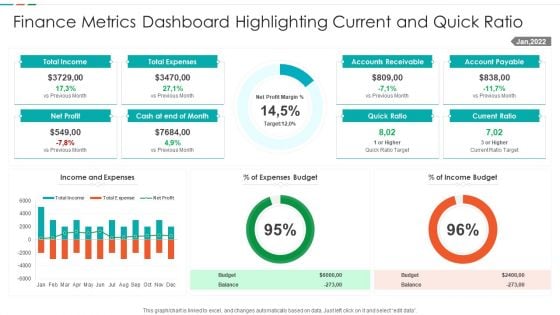
Finance Metrics Dashboard Highlighting Current And Quick Ratio Template PDF
This graph or chart is linked to excel, and changes automatically based on data. Just left click on it and select edit data. Showcasing this set of slides titled Finance Metrics Dashboard Highlighting Current And Quick Ratio Template PDF. The topics addressed in these templates are Total Income Budget, Total Expenses Balance, Net Profit Quick, Ratio Current Ratio. All the content presented in this PPT design is completely editable. Download it and make adjustments in color, background, font etc. as per your unique business setting.
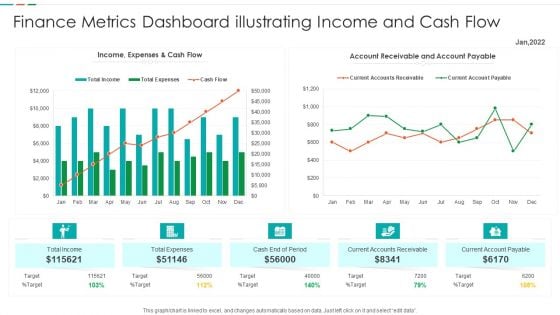
Finance Metrics Dashboard Illustrating Income And Cash Flow Template PDF
This graph or chart is linked to excel, and changes automatically based on data. Just left click on it and select edit data. Pitch your topic with ease and precision using this Finance Metrics Dashboard Illustrating Income And Cash Flow Template PDF. This layout presents information on Current Accounts Receivable, Current Account Payable, Cash End Period, Account Receivable Account. It is also available for immediate download and adjustment. So, changes can be made in the color, design, graphics or any other component to create a unique layout.
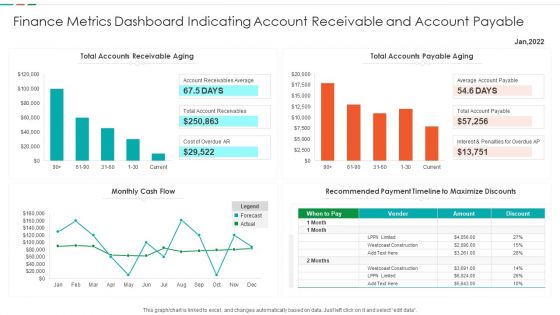
Finance Metrics Dashboard Indicating Account Receivable And Account Payable Demonstration PDF
This graph or chart is linked to excel, and changes automatically based on data. Just left click on it and select edit data. Showcasing this set of slides titled Finance Metrics Dashboard Indicating Account Receivable And Account Payable Demonstration PDF. The topics addressed in these templates are Total Accounts Receivable, Total Accounts Payable, Recommended Payment Timeline, Monthly Cash Flow. All the content presented in this PPT design is completely editable. Download it and make adjustments in color, background, font etc. as per your unique business setting.
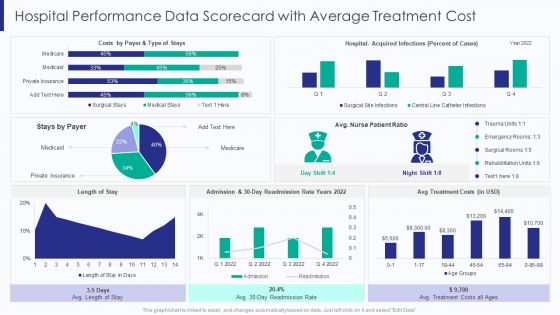
Healthcare Hospital Performance Data Scorecard With Average Treatment Cost Ppt Ideas Guide PDF
This graph or chart is linked to excel, and changes automatically based on data. Just left click on it and select Edit Data. Deliver and pitch your topic in the best possible manner with this Healthcare Hospital Performance Data Scorecard With Average Treatment Cost Ppt Ideas Guide PDF. Use them to share invaluable insights on Type Of Stays, Stays By Payer, Avg Treatment Costs, 30 Day Readmission and impress your audience. This template can be altered and modified as per your expectations. So, grab it now.
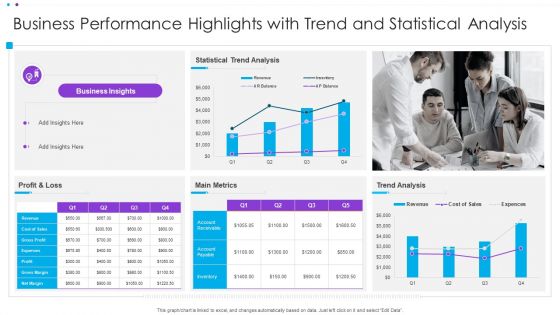
Business Performance Highlights With Trend And Statistical Analysis Ppt Infographic Template Display PDF
This graph or chart is linked to excel, and changes automatically based on data. Just left click on it and select Edit Data. Pitch your topic with ease and precision using this Business Performance Highlights With Trend And Statistical Analysis Ppt Infographic Template Display PDF. This layout presents information on Statistical Trend Analysis, Main Metrics, Profit And Loss. It is also available for immediate download and adjustment. So, changes can be made in the color, design, graphics or any other component to create a unique layout.
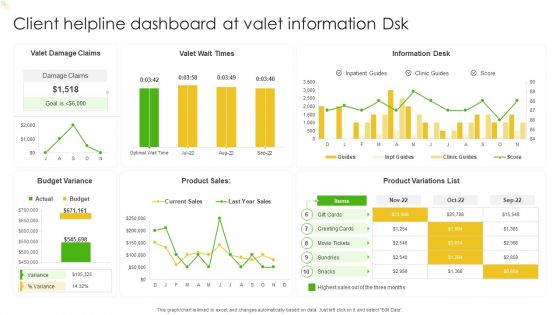
Client Helpline Dashboard At Valet Information Dsk Ppt Gallery Slide Portrait PDF
This graph or chart is linked to excel, and changes automatically based on data. Just left click on it and select Edit Data. Pitch your topic with ease and precision using this Client Helpline Dashboard At Valet Information Dsk Ppt Gallery Slide Portrait PDF. This layout presents information on Valet Damage Claims, Valet Wait Times, Information Desk. It is also available for immediate download and adjustment. So, changes can be made in the color, design, graphics or any other component to create a unique layout.
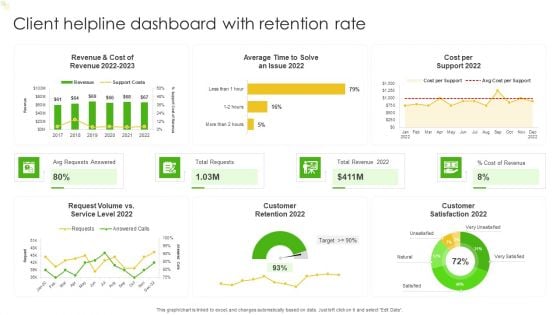
Client Helpline Dashboard With Retention Rate Ppt Gallery Ideas PDF
This graph or chart is linked to excel, and changes automatically based on data. Just left click on it and select Edit Data. Pitch your topic with ease and precision using this Client Helpline Dashboard With Retention Rate Ppt Gallery Ideas PDF. This layout presents information on Cost per Support 2022, Total Requests, Total Revenue 2022, Avg Requests Answered. It is also available for immediate download and adjustment. So, changes can be made in the color, design, graphics or any other component to create a unique layout.

 Home
Home