Graph Icon
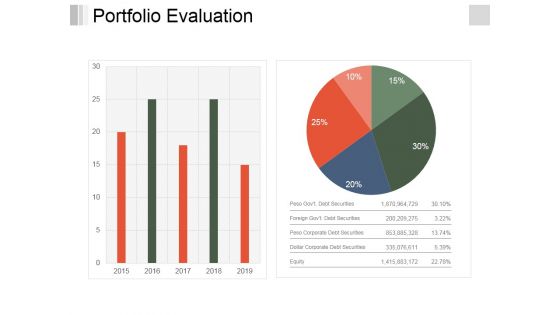
Portfolio Evaluation Ppt PowerPoint Presentation Infographics Objects
This is a portfolio evaluation ppt powerpoint presentation infographics objects. This is a two stage process. The stages in this process are business, finance, bar graph, pie chart, marketing, analysis, investment.
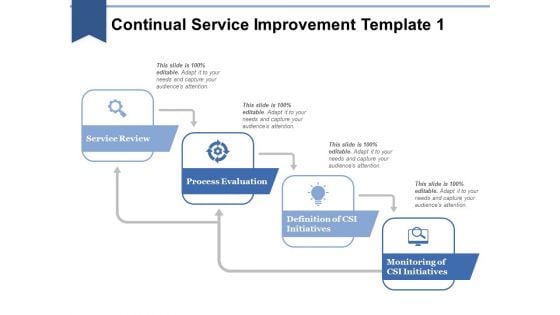
Continual Service Improvement Template 1 Ppt PowerPoint Presentation Ideas Example Topics
This is a continual service improvement template 1 ppt powerpoint presentation ideas example topics. This is a four stage process. The stages in this process are business, marketing, combo chart, finance, graph.
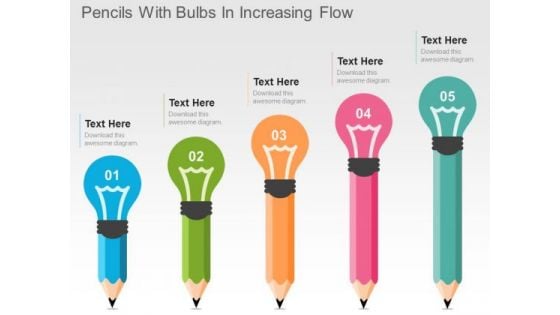
Pencils With Bulbs In Increasing Flow PowerPoint Templates
This slide has been designed with pencil bulb graph. This diagram is suitable to display creative ideas and strategy. This professional slide helps in making an instant impact on viewers.
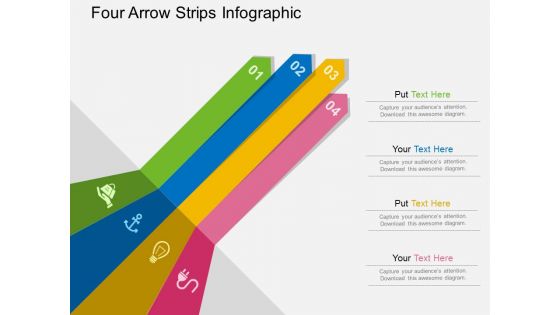
Four Arrow Strips Infographic Powerpoint Templates
Our above slide contains graphics of bulb with success graph. It helps to exhibit planning for growth. Use this diagram to impart more clarity to data and to create more sound impact on viewers.
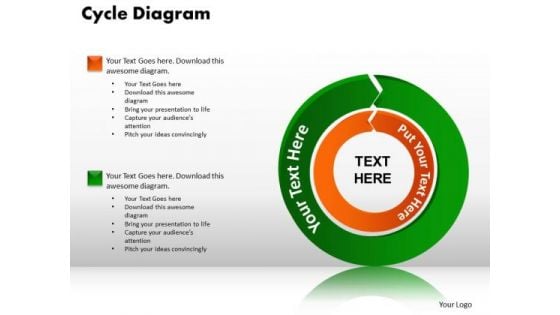
PowerPoint Designs Cycle Diagram Ppt Template
PowerPoint Designs Cycle Diagram PPT Template-In this cycle diagram, you can explain the main events in the cycle, how they interact, and how the cycle repeats. This Diagram can be used to interact visually and logically with audiences. -PowerPoint Designs Cycle Diagram PPT Template-Cycle, Design, Diagram, Element, Graph, Business, Chart, Circular, Connect, Connection, Puzzle, Round, Solving, Step, Together, Putting, Mystery, Linking, Infographic, Icon, Deserve the best with our PowerPoint Designs Cycle Diagram Ppt Template. You will come out on top.
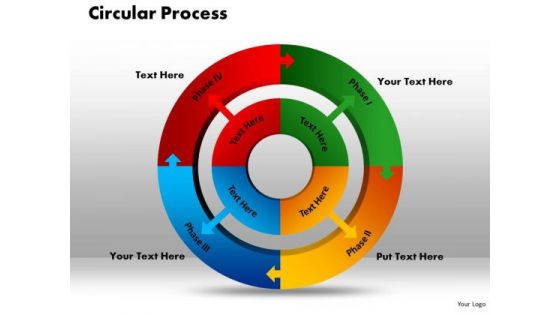
PowerPoint Designs Circular Process Ppt Presentation
PowerPoint Designs Circular Process PPT Presentation-This Diagram shows interrelated concepts in a circular flow . An excellent graphic to attract the attention of and understanding by your audience -PowerPoint Designs Circular Process PPT Presentation-Cycle, Design, Diagram, Element, Graph, Business, Chart, Circular, Connect, Connection, Puzzle, Round, Solving, Step, Together, Putting, Mystery, Linking, Infographic, Icon, Have some fun with our PowerPoint Designs Circular Process Ppt Presentation. They make creating ideas enjoyable.
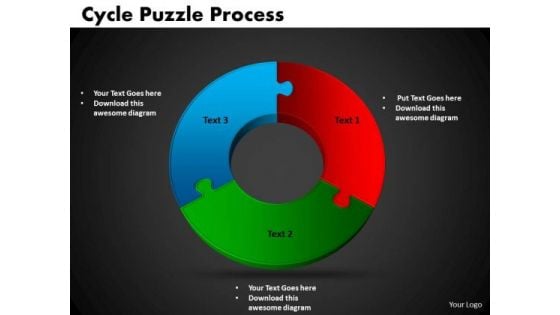
PowerPoint Designs Cycle Puzzle Process Ppt Presentation
PowerPoint Designs Cycle Puzzle Process PPT Presentation-Use this graphic to represent a continuing sequence of stages, tasks, or events in a circular flow and emphasize the connection between all components. -PowerPoint Designs Cycle Puzzle Process PPT Presentation-Cycle, Design, Diagram, Element, Graph, Business, Chart, Circular, Connect, Connection, Puzzle, Round, Solving, Step, Together, Putting, Mystery, Linking, Infographic, Icon, Give your thoughts a credible lead-in. Our PowerPoint Designs Cycle Puzzle Process Ppt Presentation will get them believing in you.
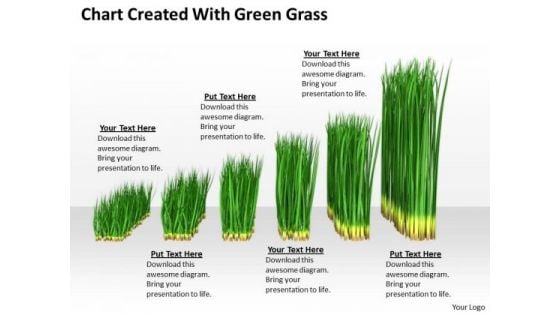
Stock Photo Green Grass Business Growth Chart PowerPoint Slide
This PowerPoint slide display chart created with green grass. This image slide has been crafted with graphic of green grass bar graph. This image depicts business. Use this image slide to express views on targets, goals, growth and management in your presentations. This image slide exhibits various information which requires visual aid. Enhance the quality of your presentations using this image.

Business Diagram Lock With Missing Puzzle Piece Presentation Template
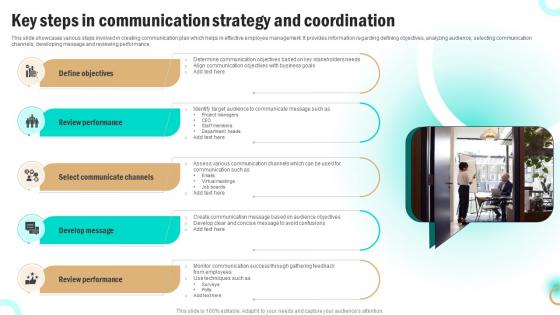
Key Steps In Communication Strategy And Coordination Diagrams Pdf
This slide showcases various steps involved in creating communication plan which helps in effective employee management. It provides information regarding defining objectives, analyzing audience, selecting communication channels, developing message and reviewing performance. Showcasing this set of slides titled Key Steps In Communication Strategy And Coordination Diagrams Pdf. The topics addressed in these templates are Objectives, Analyzing Audience, Selecting Communication Channels, Developing Message. All the content presented in this PPT design is completely editable. Download it and make adjustments in color, background, font etc. as per your unique business setting. This slide showcases various steps involved in creating communication plan which helps in effective employee management. It provides information regarding defining objectives, analyzing audience, selecting communication channels, developing message and reviewing performance.

Coins Investment PowerPoint Templates And PowerPoint Themes 1012
Coins Investment PowerPoint Templates And PowerPoint Themes 1012-Use this PowerPoint Template to signify the concept of Bar graph. It consists of the coins forming the Bar graph. This image has been conceived to enable you to emphatically communicate your ideas in your Business PPT presentation. Original thinking is the need of the hour. We provide the means to project your views.-Coins Investment PowerPoint Templates And PowerPoint Themes 1012-This PowerPoint template can be used for presentations relating to-Gold coins, business, money, finance, success, signs Decrease conflict with your thoughts.Enable communication with our Coins Investment PowerPoint Templates And PowerPoint Themes 1012.
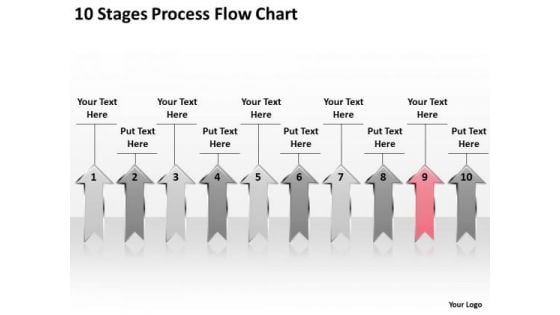
PowerPoint Arrows 10 Stages Process Flow Chart Ppt 9 Slides
arrow, art, background, blank, blue, business, chart, clip, diagram, drop, eps10, flow, four, graph, graphic, gray, green, heat, illustration, map, process, red, shadow, shape, step, symbol, transparency, vector, white, yellow Fetch up with our PowerPoint Arrows 10 Stages Process Flow Chart Ppt 9 Slides. You will be applauded wherever you go.
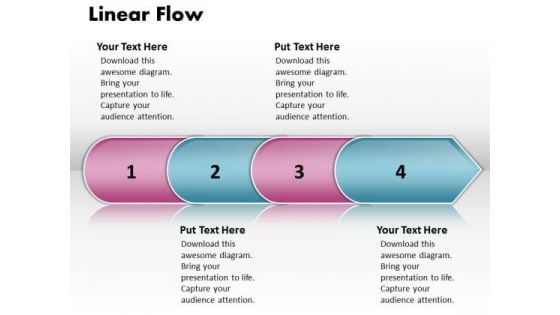
Ppt Linear Arrow 4 Phase Diagram PowerPoint Templates
PPT linear arrow 4 phase diagram PowerPoint Templates-This Four Phase PowerPoint graphic is designed specifically for corporate and academic use. Diagram is fully editable customizable-PPT linear arrow 4 phase diagram PowerPoint Templates-Arrow, Background, Collection, Completed, Concept, Confirmation, Design, Flow, Graph, Graphic, Illustration, Indication, Indicator, Information, Instruction, Interface, Internet, Layout, Measurement, Order, Phase, Pointer, Process, Progress, Reflection, Scale, Shape, Sign Be explicit with our Ppt Linear Arrow 4 Phase Diagram PowerPoint Templates. Express your views clearly and fully.
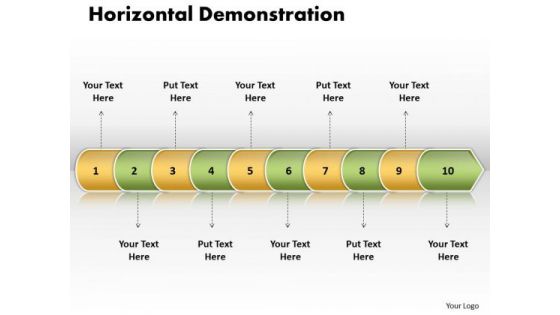
Ppt Linear Arrow 10 Phase Diagram PowerPoint Templates
PPT linear arrow 10 phase diagram PowerPoint Templates-Use this PowerPoint diagram to define basic work and data flow and quality management processes to increase efficiency of your business.-PPT linear arrow 10 phase diagram PowerPoint Templates-Arrow, Background, Collection, Completed, Concept, Confirmation, Design, Flow, Graph, Graphic, Illustration, Indication, Indicator, Information, Instruction, Interface, Internet, Layout, Measurement, Order, Phase, Pointer, Process, Progress, Reflection, Scale, Shape, Sign Start a company with our Ppt Linear Arrow 10 Phase Diagram PowerPoint Templates. Just download, type and present.
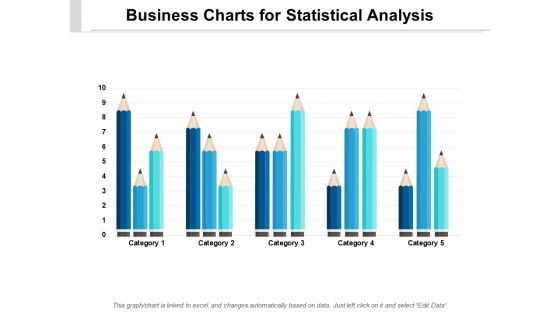
Business Charts For Statistical Analysis Ppt PowerPoint Presentation Pictures Gridlines
Presenting this set of slides with name business charts for statistical analysis ppt powerpoint presentation pictures gridlines. The topics discussed in these slides are education, growth, pencil bar graph. This is a completely editable PowerPoint presentation and is available for immediate download. Download now and impress your audience.
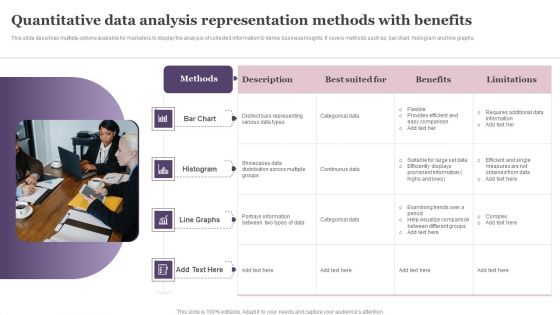
Quantitative Data Analysis Representation Methods With Benefits Template PDF
This slide describes multiple options available for marketers to display the analysis of collected information to derive business insights. It covers methods such as, bar chart, histogram and line graphs. Persuade your audience using this Quantitative Data Analysis Representation Methods With Benefits Template PDF. This PPT design covers four stages, thus making it a great tool to use. It also caters to a variety of topics including Bar Chart, Histogram, Line Graphs. Download this PPT design now to present a convincing pitch that not only emphasizes the topic but also showcases your presentation skills.
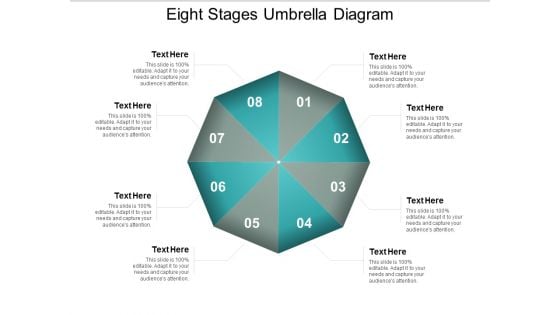
Eight Stages Umbrella Diagram Ppt PowerPoint Presentation Styles Slides
Presenting this set of slides with name eight stages umbrella diagram ppt powerpoint presentation styles slides. The topics discussed in these slides are umbrella chart, umbrella graph, umbrella statistics. This is a completely editable PowerPoint presentation and is available for immediate download. Download now and impress your audience.
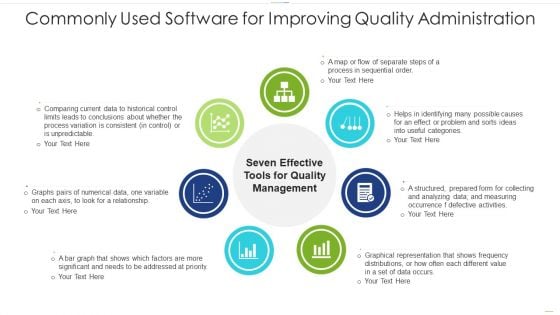
Commonly Used Software For Improving Quality Administration Diagrams PDF
Presenting commonly used software for improving quality administration diagrams pdf to dispense important information. This template comprises seven stages. It also presents valuable insights into the topics including graphs, value, measuring. This is a completely customizable PowerPoint theme that can be put to use immediately. So, download it and address the topic impactfully.
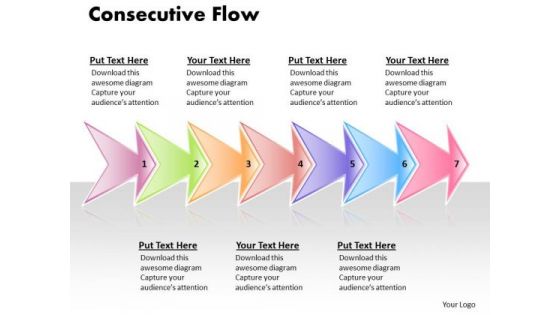
Ppt Linear Flow 7 Phase Diagram Picture Style PowerPoint 2010 Templates
PPT linear flow 7 phase diagram picture style powerpoint 2010 Templates-Use this Seven stage improvement process diagram to discuss process measurement and process improvement.-PPT linear flow 7 phase diagram picture style powerpoint 2010 Templates-Arrow, Art, Background, Blank, Business, Chart, Clip, Diagram, Drop, Flow, Graph, Graphic, Gray, Illustration, Process, Shadow, Shape, Step, Symbol, Three, Transparency Educate your team on avoiding accidents. Make out a checklist with the help of our Ppt Linear Flow 7 Phase Diagram Picture Style PowerPoint 2010 Templates.

Dollar Profits Growth PowerPoint Templates And PowerPoint Themes 1012
Deliver amazing Presentations with our above template showing profit and growth bar graph. Adjust the above image in your PPT presentations to visually support your content in your Business PPT slideshows marketing, finance, success and strategy. Deliver amazing presentations to mesmerize your audience. Get ahead despite fierce competition. Accelerate away from the pack with our Dollar Profits Growth PowerPoint Templates And PowerPoint Themes 1012.
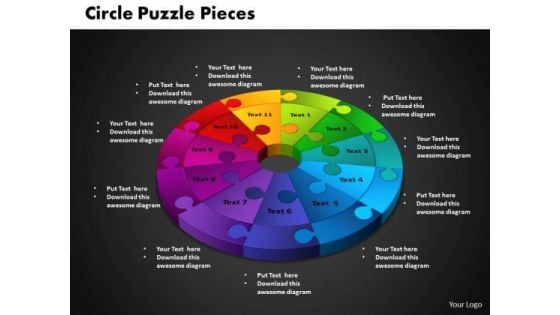
PowerPoint Designs Circle Puzzle Editable Ppt Template
PowerPoint Designs Circle Puzzle Editable PPT Template-It is all there in bits and pieces. Individual components well researched and understood in their place.Use this template to illustrate your method, piece by piece, and interlock the whole process in the minds of your audience.-PowerPoint Designs Circle Puzzle Editable PPT Template-Cycle, Design, Diagram, Element, Graph, Business, Chart, Circular, Connect, Connection, Puzzle, Round, Solving, Step, Together, Putting, Mystery, Linking, Infographic, Icon, You intend to deliver. Make it happen with our PowerPoint Designs Circle Puzzle Editable Ppt Template. Make sure your presentation gets the attention it deserves.
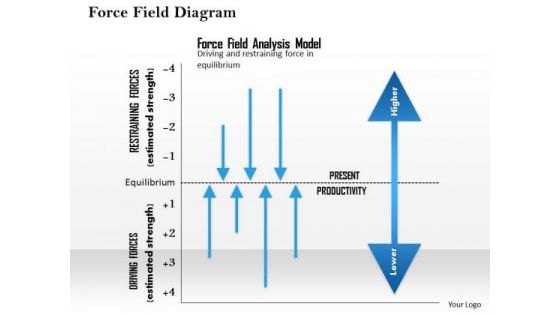
Business Framework Force Field Diagram PowerPoint Presentation
This image slide displays force field diagram business framework. This image has been designed with graphic of driving forces and restraining forces attributes graph. This image slide may be used in business and social presentations. Use this image to depict what's needed for change in both corporate and personal environments in your presentations. This image slide will enhance the quality of your presentations.
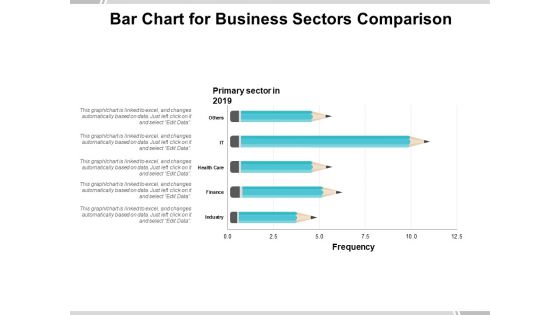
Bar Chart For Business Sectors Comparison Ppt PowerPoint Presentation Professional Guide
Presenting this set of slides with name bar chart for business sectors comparison ppt powerpoint presentation professional guide. The topics discussed in these slides are education, growth, pencil bar graph. This is a completely editable PowerPoint presentation and is available for immediate download. Download now and impress your audience.

Bar Chart For Facts Stats Growth And Percentage Analysis Ppt PowerPoint Presentation Styles Infographic Template
Presenting this set of slides with name bar chart for facts stats growth and percentage analysis ppt powerpoint presentation styles infographic template. This is a six stage process. The stages in this process are education, growth, pencil bar graph. This is a completely editable PowerPoint presentation and is available for immediate download. Download now and impress your audience.
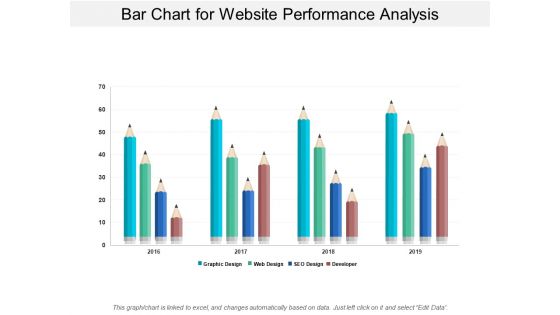
Bar Chart For Website Performance Analysis Ppt PowerPoint Presentation Layouts Influencers
Presenting this set of slides with name bar chart for website performance analysis ppt powerpoint presentation layouts influencers. The topics discussed in these slides are education, growth, pencil bar graph. This is a completely editable PowerPoint presentation and is available for immediate download. Download now and impress your audience.
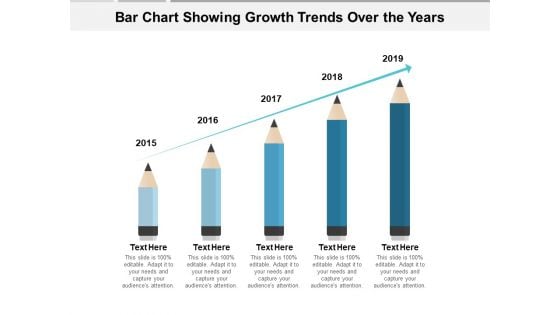
Bar Chart Showing Growth Trends Over The Years Ppt PowerPoint Presentation Slides Layout
Presenting this set of slides with name bar chart showing growth trends over the years ppt powerpoint presentation slides layout. This is a five stage process. The stages in this process are education, growth, pencil bar graph. This is a completely editable PowerPoint presentation and is available for immediate download. Download now and impress your audience.
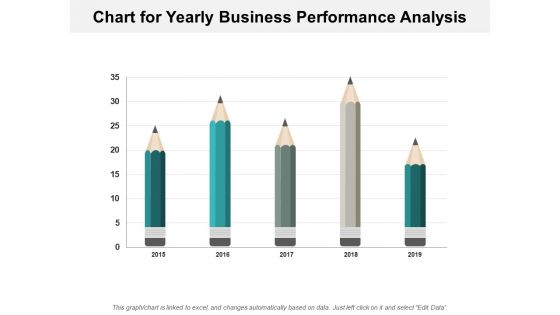
Chart For Yearly Business Performance Analysis Ppt PowerPoint Presentation Slide Download
Presenting this set of slides with name chart for yearly business performance analysis ppt powerpoint presentation slide download. The topics discussed in these slides are education, growth, pencil bar graph. This is a completely editable PowerPoint presentation and is available for immediate download. Download now and impress your audience.

Pencil Bar Chart Showing Marketing Fluctuation Ppt PowerPoint Presentation Outline Show
Presenting this set of slides with name pencil bar chart showing marketing fluctuation ppt powerpoint presentation outline show. The topics discussed in these slides are education, growth, pencil bar graph. This is a completely editable PowerPoint presentation and is available for immediate download. Download now and impress your audience.
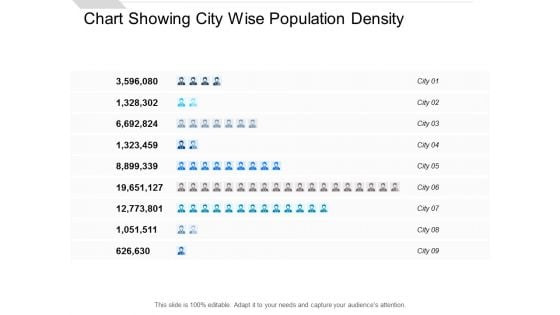
Chart Showing City Wise Population Density Ppt PowerPoint Presentation Infographic Template Slides
Presenting this set of slides with name chart showing city wise population density ppt powerpoint presentation infographic template slides. This is a nine stage process. The stages in this process are people graph, sales performance, population data demographics. This is a completely editable PowerPoint presentation and is available for immediate download. Download now and impress your audience.
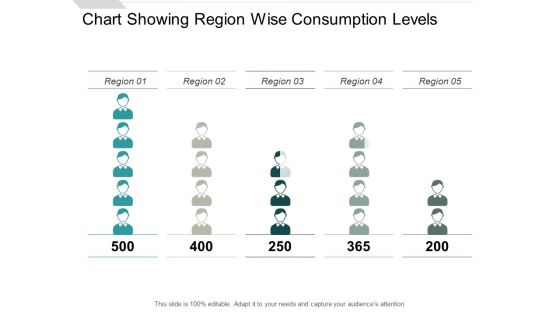
Chart Showing Region Wise Consumption Levels Ppt PowerPoint Presentation Layouts Design Ideas
Presenting this set of slides with name chart showing region wise consumption levels ppt powerpoint presentation layouts design ideas. This is a five stage process. The stages in this process are people graph, sales performance, population data demographics. This is a completely editable PowerPoint presentation and is available for immediate download. Download now and impress your audience.
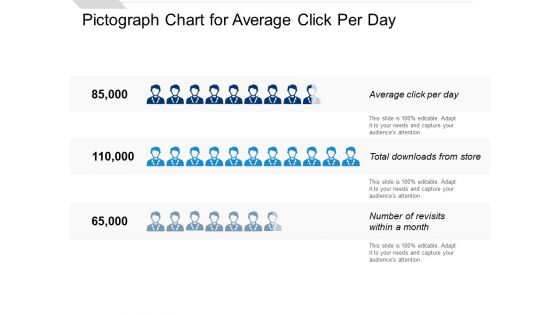
Pictograph Chart For Average Click Per Day Ppt PowerPoint Presentation Slides Format
Presenting this set of slides with name pictograph chart for average click per day ppt powerpoint presentation slides format. This is a three stage process. The stages in this process are people graph, sales performance, population data demographics. This is a completely editable PowerPoint presentation and is available for immediate download. Download now and impress your audience.
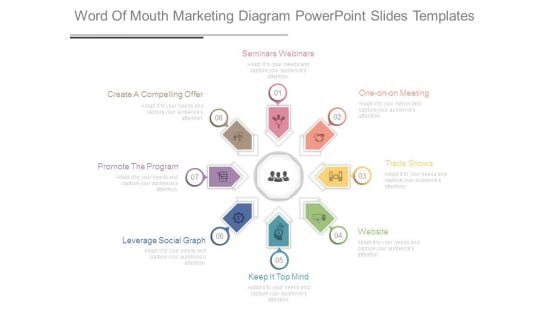
Word Of Mouth Marketing Diagram Powerpoint Slides Templates
This is a word of mouth marketing diagram powerpoint slides templates. This is a eight stage process. The stages in this process are create a compelling offer, promote the program, leverage social graph, keep it top mind, website, trade shows, one on one meeting, seminars webinars.
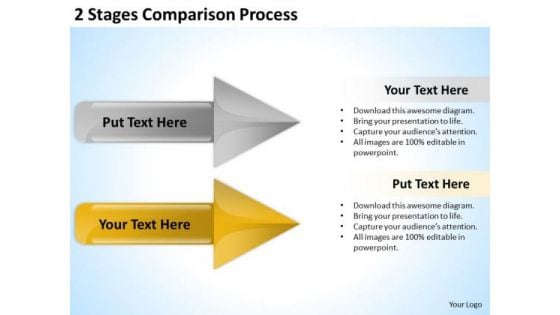
PowerPoint Circular Arrows Comparison Process Templates Backgrounds For Slides
3d, arrow, arrow button, arrow vector, art, background, blank, blue, business, button, chart, clip, decoration, diagram, direction, drop, element, empty, finance, flow, four, graph, graphic, green, illustration, isometric, presentation, process, red, shape, sign, step, symbol, template, text, vector, white, yellow Our PowerPoint Circular Arrows Comparison Process Templates Backgrounds For Slides help the audience catch on fast. They assist them in quick assimilation.
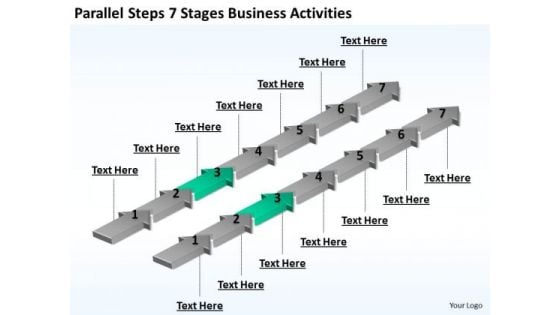
Power Point Arrows New Business PowerPoint Presentation Activities Templates
3d, arrow, background, banner, blank, business, business concept, chart, color, colorful, description, development, diagram, direction, element, empty, financial, flow, flowchart, four, future, gradient, graph, graphic, illustration, isolated, mirrored, object, placeholder, presentation, process, section, segment, set, shape, sign, steps, symbol, template, text, topic, vector Experiment and evaluate with our Power Point Arrows New Business PowerPoint Presentation Activities Templates. Be assured of accurate results.
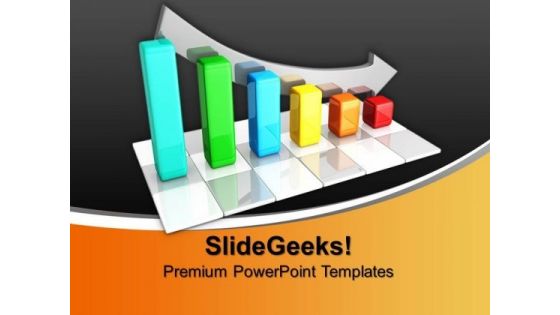
Business Chart Finance PowerPoint Templates And PowerPoint Themes 1012
Visually support your Microsoft office PPT Presentation with our above template illustrating a colored bar graph. This image has been professionally designed to emphasize the concept of statistics. This image has been conceived to enable you to emphatically communicate your ideas in your Business and Financial PPT presentations showing reports, ratings and reviews etc. Deliver amazing presentations to mesmerize your audience. Achieve high-quality presentations with our Business Chart Finance PowerPoint Templates And PowerPoint Themes 1012. They will make you look good.
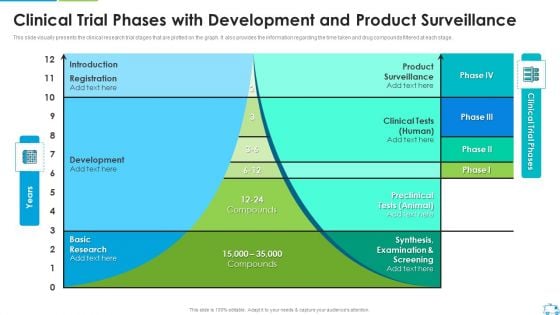
Clinical Trial Phases With Development And Product Surveillance Formats PDF
This slide visually presents the clinical research trial stages that are plotted on the graph. It also provides the information regarding the time taken and drug compounds filtered at each stage.Deliver an awe inspiring pitch with this creative Clinical Trial Phases With Development And Product Surveillance Formats PDF bundle. Topics like Product Surveillance, Preclinical Tests, Synthesis Examination And Screening can be discussed with this completely editable template. It is available for immediate download depending on the needs and requirements of the user.
Ppt Linear Work Flow Chart PowerPoint 2 State Diagram Templates
PPT linear work flow chart powerpoint 2 state diagram Templates-This PPT slide is an effective way of displaying information you can edit text, color, shade and style as per you need.-PPT linear work flow chart powerpoint 2 state diagram Templates-Arrow, Art, Background, Blank, Business, Chart, Clip, Diagram, Drop, Flow, Graph, Graphic, Gray, Illustration, Process, Shadow, Shape, Step, Symbol, Three, Transparency Acquire the aura of a champion. Enhance your charisma with our Ppt Linear Work Flow Chart PowerPoint 2 State Diagram Templates.

Couple Sitting On Beach Chair Under Umbrella Ppt PowerPoint Presentation Pictures Clipart Images
Presenting this set of slides with name couple sitting on beach chair under umbrella ppt powerpoint presentation pictures clipart images. The topics discussed in these slides are umbrella chart, umbrella graph, umbrella statistics. This is a completely editable PowerPoint presentation and is available for immediate download. Download now and impress your audience.

Image Of Colorful Umbrellas Ppt PowerPoint Presentation Show Graphics
Presenting this set of slides with name image of colorful umbrellas ppt powerpoint presentation show graphics. The topics discussed in these slides are umbrella chart, umbrella graph, umbrella statistics. This is a completely editable PowerPoint presentation and is available for immediate download. Download now and impress your audience.

Image Of Yellow Umbrella On Lake Ppt PowerPoint Presentation Model Background
Presenting this set of slides with name image of yellow umbrella on lake ppt powerpoint presentation model background. The topics discussed in these slides are umbrella chart, umbrella graph, umbrella statistics. This is a completely editable PowerPoint presentation and is available for immediate download. Download now and impress your audience.

Red Umbrella On White Background Ppt PowerPoint Presentation Summary Aids
Presenting this set of slides with name red umbrella on white background ppt powerpoint presentation summary aids. The topics discussed in these slides are umbrella chart, umbrella graph, umbrella statistics. This is a completely editable PowerPoint presentation and is available for immediate download. Download now and impress your audience.
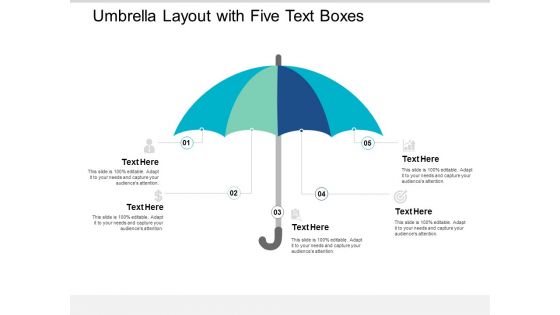
Umbrella Layout With Five Text Boxes Ppt PowerPoint Presentation File Graphics Design
Presenting this set of slides with name umbrella layout with five text boxes ppt powerpoint presentation file graphics design. The topics discussed in these slides are umbrella chart, umbrella graph, umbrella statistics. This is a completely editable PowerPoint presentation and is available for immediate download. Download now and impress your audience.
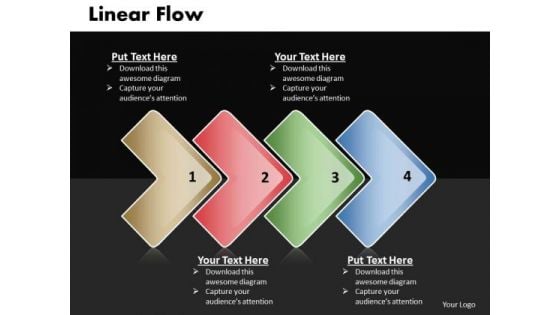
Ppt Linear Process Flow PowerPoint Template 4 Phase Diagram Templates
PPT linear process flow powerpoint template 4 phase diagram Templates-This Chart is a simple template that provides a graphical, time-phased overview of a continuing sequence of stages in a flow-PPT linear process flow powerpoint template 4 phase diagram Templates-Abstract, Arrow, Arrow Chart, Business, Design, Development, Diagram, Direction, Element, Flow, Flow Chart, Flow Diagram, Flowchart, Graph, Linear, Management, Model, Motion, Organization, Plan, Process, Process Arrows, Process Chart, Process Diagram, Process Flow, Program, Section, Segment, Set, Sign, Solution, Strategy, Symbol, Technology Be clear and crisp with our Ppt Linear Process Flow PowerPoint Template 4 Phase Diagram Templates. All dillemas will begin to disappear.
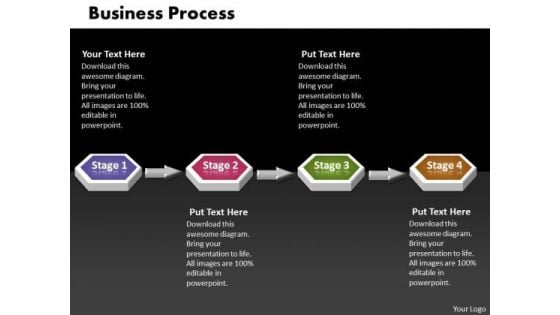
Ppt 4 Phase Diagram 3d Sequential Business PowerPoint Theme Process Templates
PPT 4 phase diagram 3d sequential business powerpoint theme process Templates-Use this 3D PowerPoint Diagram to describe three stages of Continuous Process. It portrays beeline, Sequential, even, horizontal, in bee line, linear , nonstop, not crooked, point-blank, right, straight, straightaway, though, true, unbroken etc.-PPT 4 phase diagram 3d sequential business powerpoint theme process Templates-arrow, art, background, blank, business, chart, clip, diagram, drop, eps10, flow, four, graph, graphic, gray, green, illustration, process, shadow, shape, step, symbol, transparency, vector, white Our Ppt 4 Phase Diagram 3d Sequential Business PowerPoint Theme Process Templates come in all colours, shades and hues. They help highlight the importance of your views.
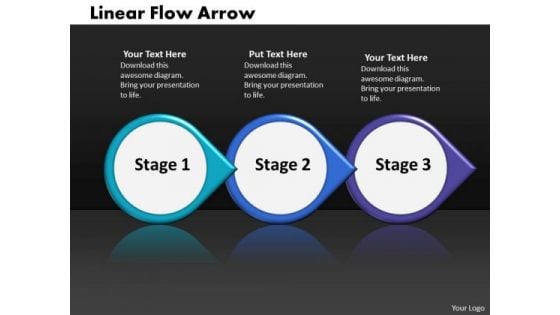
Ppt Linear Demo Create Flow Chart PowerPoint Arrow-3 Phase Diagram Templates
PPT linear demo create flow chart powerpoint arrow-3 phase diagram Templates-Highlight the key point in business process with this circular Arrow of 3 stages diagram-PPT linear demo create flow chart powerpoint arrow-3 phase diagram Templates-Abstract, Arrow, Arrow Chart, Business, Design, Development, Diagram, Direction, Element, Flow, Flow Chart, Flow Diagram, Flowchart, Graph, Linear, Management, Model, Motion, Organization, Plan, Process, Process Arrows, Process Chart, Process Diagram, Process Flow, Program, Section, Segment, Set, Sign, Solution, Strategy, Symbol, Technology Help them discover new faith with our Ppt Linear Demo Create Flow Chart PowerPoint Arrow-3 Phase Diagram Templates. Convert them to your line of thinking.
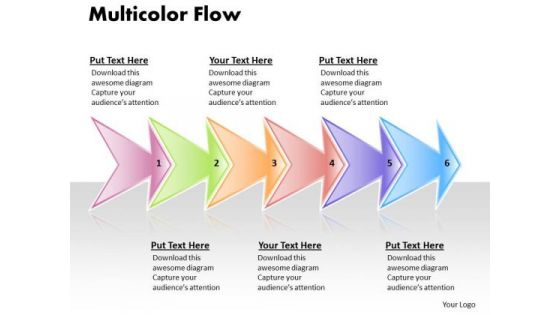
Ppt Linear Demo Create Flow Chart PowerPoint 6 Phase Diagram Style 1 Templates
PPT linear demo create flow chart powerpoint 6 phase diagram style 1 Templates-This 3d linear flow process Diagram is a high quality professional PowerPoint slide. This Diagram with the Linear arrows is amazing tool to present milestones, plans and progresses-PPT linear demo create flow chart powerpoint 6 phase diagram style 1 Templates-Arrow, Art, Background, Blank, Business, Chart, Clip, Diagram, Drop, Flow, Graph, Graphic, Gray, Illustration, Process, Shadow, Shape, Step, Symbol, Three, Transparency Develop their attitude for fairplay. Dwell on the benefits with our Ppt Linear Demo Create Flow Chart PowerPoint 6 Phase Diagram Style 1 Templates.
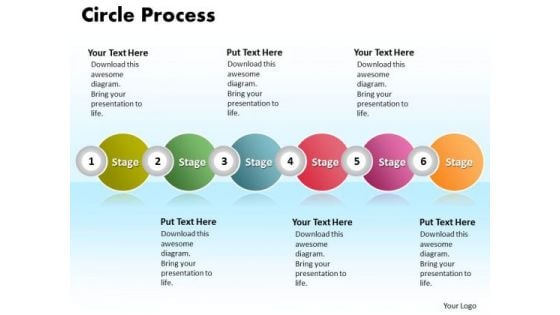
Ppt Circle Procurement Process PowerPoint Presentation 6 Phase Diagram Templates
PPT circle procurement process powerpoint presentation 6 phase diagram Templates-This template offers an excellent background to build up the various stages of your marketing process. Bullet-point your thoughts and ideas to profitably accomplish every step of every stage along the way.-PPT circle procurement process powerpoint presentation 6 phase diagram Templates-Abstract, Business, Chart, Circle, Company, Corporate, Design, Diagram, Different, Graph, Illustration, Information, Item, Junction, Management, Marketing, Menu, Modern, Network, Options, Parts, Pie, Plan, Presentation, Process, Report, Representational, Segments, Sphere, Statistics, Strategy, Structure, Wheel Back up your boast with our Ppt Circle Procurement Process PowerPoint Presentation 6 Phase Diagram Templates. Demonstrate to your audience that you can.
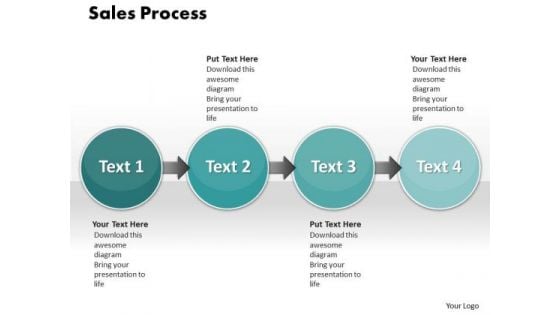
Ppt Sale Forging Process PowerPoint Slides 4 Phase Diagram Templates
PPT sale forging process powerpoint slides 4 phase diagram Templates-This chart is an effective way of displaying information you can edit text, color, shade and style as per you need.-PPT sale forging process powerpoint slides 4 phase diagram Templates-Arrow, Banner, Black, Blank, Blue, Business, Button, Circle, Collection, Color, Decoration, Design, Direction, Elegance, Element, Empty, Financial, Flow, Gradient, Graph, Green, Horizontal, Illustration, Isolated, Label, Menu, Message, Nobody, Orange, Process, Push, Retail, Round, Sale, Set, Shape, Silver, Steps, Symbol, Variation, Vector Consider your promotion a surety with our Ppt Sale Forging Process PowerPoint Slides 4 Phase Diagram Templates. You will come out on top.
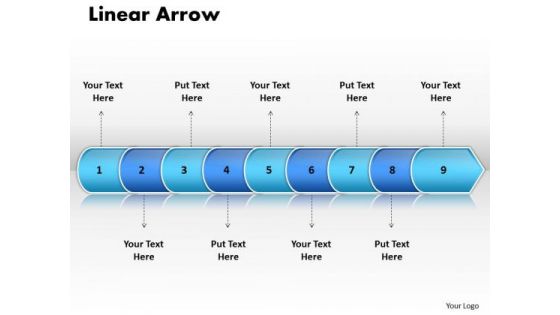
Ppt Linear Arrow 9 State Diagram PowerPoint Templates
PPT linear arrow 9 state diagram PowerPoint Templates-Use this PowerPoint diagram to define basic work and data flow and quality management processes to increase efficiency of your business.-PPT linear arrow 9 state diagram PowerPoint Templates-Arrow, Background, Collection, Completed, Concept, Confirmation, Design, Flow, Graph, Graphic, Illustration, Indication, Indicator, Information, Instruction, Interface, Internet, Layout, Measurement, Order, Phase, Pointer, Process, Progress, Reflection, Scale, Shape, Sign Fill out your thoughts with our Ppt Linear Arrow 9 State Diagram PowerPoint Templates. They will get bigger and better.
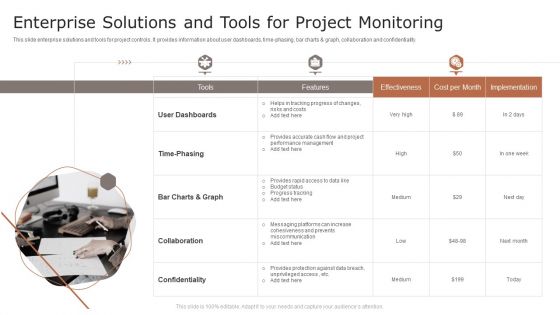
Enterprise Solutions And Tools For Project Monitoring Ppt Model Examples PDF
This slide enterprise solutions and tools for project controls. It provides information about user dashboards, time-phasing, bar charts and graph, collaboration and confidentiality. Presenting Enterprise Solutions And Tools For Project Monitoring Ppt Model Examples PDF to dispense important information. This template comprises three stages. It also presents valuable insights into the topics including User Dashboards, Time Phasing, Collaboration. This is a completely customizable PowerPoint theme that can be put to use immediately. So, download it and address the topic impactfully.
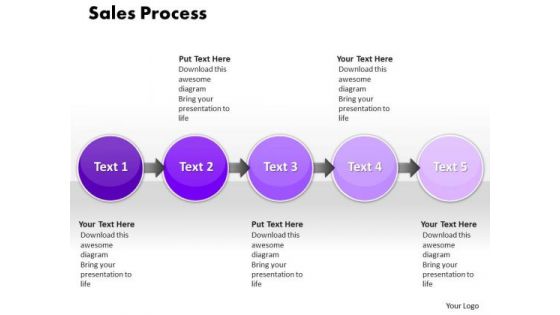
Ppt Sale Writing Process PowerPoint Presentation 5 Phase Diagram Templates
PPT sale writing process powerpoint presentation 5 phase diagram Templates-This Circular text Boxes Diagram is designed to represent different types of actions or steps in a process.-PPT sale writing process powerpoint presentation 5 phase diagram Templates-Arrow, Banner, Black, Blank, Blue, Business, Button, Circle, Collection, Color, Decoration, Design, Direction, Elegance, Element, Empty, Financial, Flow, Gradient, Graph, Green, Horizontal, Illustration, Isolated, Label, Menu, Message, Nobody, Orange, Process, Push, Retail, Round, Sale, Set, Shape, Silver, Steps, Symbol, Variation, Vector Our Ppt Sale Writing Process PowerPoint Presentation 5 Phase Diagram Templates aredelightfully crafted. Designed to charm the biggest disbelievers.
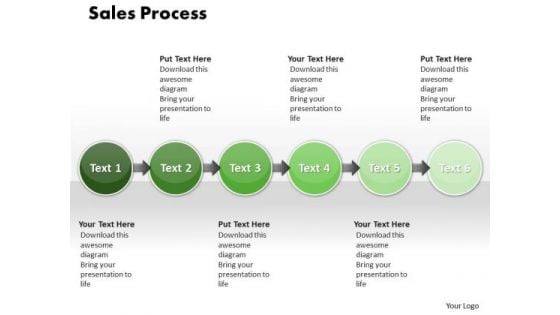
Ppt Sale Writing Process PowerPoint Presentation 6 Phase Diagram Templates
PPT sale writing process powerpoint presentation 6 phase diagram Templates-This diagram provides an overview of the interactions of different factors in a company.-PPT sale writing process powerpoint presentation 6 phase diagram Templates-Arrow, Banner, Black, Blank, Blue, Business, Button, Circle, Collection, Color, Decoration, Design, Direction, Elegance, Element, Empty, Financial, Flow, Gradient, Graph, Green, Horizontal, Illustration, Isolated, Label, Menu, Message, Nobody, Orange, Process, Push, Retail, Round, Sale, Set, Shape, Silver, Steps, Symbol, Variation, Vector Facing upto problems is part of it. Define the answers on our Ppt Sale Writing Process PowerPoint Presentation 6 Phase Diagram Templates.
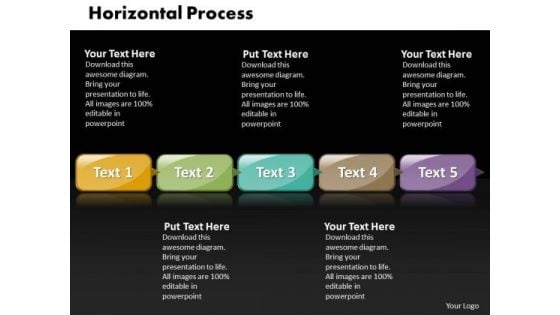
Ppt Horizontal Military Style PowerPoint Templates 5 Phase Diagram
PPT horizontal military style powerpoint templates 5 phase diagram-This is a PowerPoint process diagram. The text boxes have space to insert text of your choice. You can easily edit the text and color. -PPT horizontal military style powerpoint templates 5 phase diagram-Banner, Box, Business, Button, Chrome, Collection, Control, Design, Direction, Element, Empty, Financial, Flow, Graph, Green, Header, Horizontal, Illustration, Image, Information, Process, Red, Retail, Round, Sale, Set, Shapes Our Ppt Horizontal Military Style PowerPoint Templates 5 Phase Diagram are really compliant. They adapt to any conditions you set.
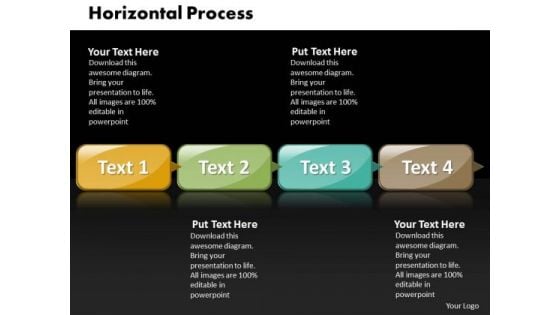
Ppt Horizontal Picture Style PowerPoint 2010 4 Phase Diagram Templates
PPT horizontal picture style powerpoint 2010 4 phase diagram Templates-Display the direction of the specific activities involved and how to put these in a proper manner for achieving the desired goal.-PPT horizontal picture style powerpoint 2010 4 phase diagram Templates-Banner, Box, Business, Button, Chrome, Collection, Control, Design, Direction, Element, Empty, Financial, Flow, Graph, Green, Header, Horizontal, Style, Illustration, Image, Information, Process, Red, Retail, Round, Sale, Set, Shapes Fill in the blanks with our Ppt Horizontal Picture Style PowerPoint 2010 4 Phase Diagram Templates. Your thoughts will have a continuous flow.
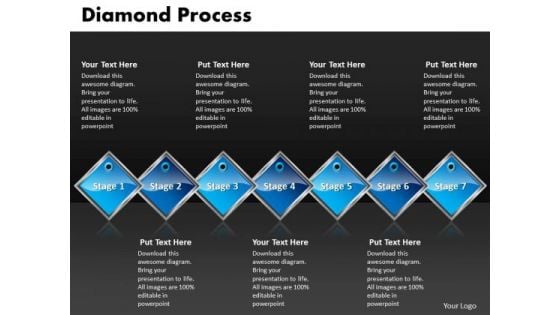
Ppt Diamond Process 7 State PowerPoint Presentation Diagram Templates
PPT diamond process 7 state powerpoint presentation diagram Templates-This chart visualize the of process steps, reoccurrences and components or of your company structure or product features.-PPT diamond process 7 state powerpoint presentation diagram Templates-Business, Button, Card, Chart, Chrome, Diamond, Figure, Graph, Graphic, Green, Label, Man, Medal, Money, Page, Podium, Presentation, Red, Round, Set, Shape, Shield, Sign, Speech, Stick, Success, Suit, Symbol, Tag, Tie, Vector In the market,customer is king. Anoint him with our Ppt Diamond Process 7 State PowerPoint Presentation Diagram Templates.
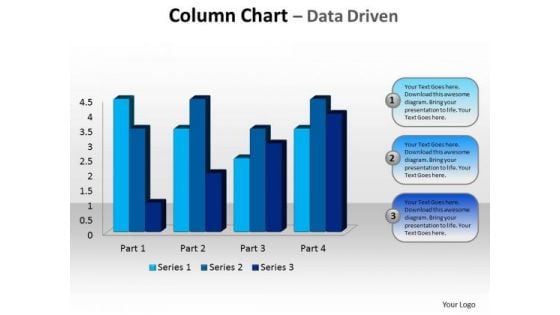
Business Editable PowerPoint Templates Business Beveled Column Chart Ppt Slides
Business Editable PowerPoint Templates Business beveled column chart PPT Slides-This PowerPoint slide is a data driven Columns Chart. The number of columns depend on the data.-Business Editable PowerPoint Templates Business beveled column chart PPT Slides-This ppt can be used for concepts relating to-chart,, graph, growth, investment, , market, percentage, , presentation report, results, statistics, stock, success and business. Experience exponential.growth with our Business Editable PowerPoint Templates Business Beveled Column Chart Ppt Slides. Your earnings will acquire a big boost.
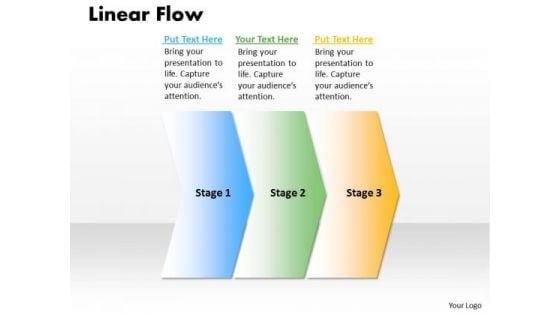
Ppt Linear Process Flow PowerPoint Template 3 State Diagram Templates
PPT linear process flow powerpoint template 3 state diagram Templates-This is a professional-look process steps diagram. This Process steps diagram is widely used to show sequence of actions.-PPT linear process flow powerpoint template 3 state diagram Templates-Arrow, Art, Background, Blank, Business, Chart, Clip, Diagram, Drop, Flow, Graph, Graphic, Gray, Illustration, Process, Shadow, Shape, Step, Symbol, Three, Transparency Our Ppt Linear Process Flow PowerPoint Template 3 State Diagram Templates are beasts of burden. They have the ability to carry alot.
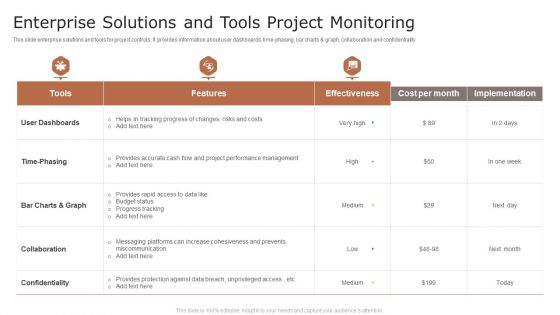
Enterprise Solutions And Tools Project Monitoring Ppt File Visuals PDF
This slide enterprise solutions and tools for project controls. It provides information about user dashboards, time-phasing, bar charts and graph, collaboration and confidentiality. Pitch your topic with ease and precision using this Enterprise Solutions And Tools Project Monitoring Ppt File Visuals PDF. This layout presents information on User Dashboards, Time Phasing, Collaboration. It is also available for immediate download and adjustment. So, changes can be made in the color, design, graphics or any other component to create a unique layout.

Bitcoin Blockchain Technology Mining Hardware Market Report Themes PDF
The slide shows the mining hardware market report of bitcoin blockchain. The report covers top players, market segmentation, CAGR and market impact along with graphs. Presenting Bitcoin Blockchain Technology Mining Hardware Market Report Themes PDF to dispense important information. This template comprises one stages. It also presents valuable insights into the topics including Market Segmentation, Market Impact, Incremental Growth, Geography. This is a completely customizable PowerPoint theme that can be put to use immediately. So, download it and address the topic impactfully.
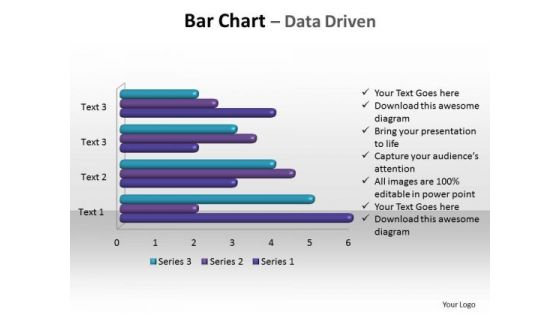
Business Sales PowerPoint Templates Business Bar Chart Data Driven Ppt Slides
Business Sales PowerPoint Templates Business bar chart data driven PPT Slides-This PowerPoint d Editable Data-Driven Chart is for visualizing your figures and data. Business Sales PowerPoint Templates Business bar chart data driven PPT Slides-This ppt can be used for concepts relating to-Chat, Illustration, data driven, figures, charts and Graphs. Set the audience alight with our Business Sales PowerPoint Templates Business Bar Chart Data Driven Ppt Slides. You will come up with a cracker of an idea.


 Continue with Email

 Home
Home


