Graph Icon

Dividend Payout Financial Ratios Chart Comparison Themes PDF
This slide showcases dividend payout ratio graph that can help organization to determine the percentage of the companys earnings that is paid out to shareholders by way of dividend. It showcases comparison for a period of 8 years Showcasing this set of slides titled dividend payout financial ratios chart comparison themes pdf. The topics addressed in these templates are dividend payout financial ratios chart comparison. All the content presented in this PPT design is completely editable. Download it and make adjustments in color, background, font etc. as per your unique business setting.
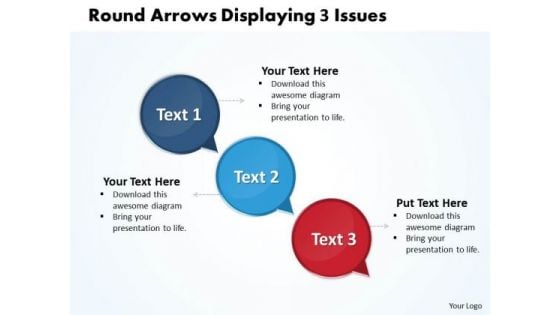
Ppt Circle PowerPoint Presentation 3d Arrows Displaying Issues Templates
PPT circle powerpoint presentation 3d arrows displaying issues Templates-This PowerPoint diagram is particularly useful for displaying how a process currently functions or could ideally function in Circular text boxes. Use this 3D awesome List and Circular text boxes PowerPoint templates to create awesome marketing and sales priority lists or any other types of lists. You can change color, size and orientation of any icon to your liking. -PPT circle powerpoint presentation 3d arrows displaying issues Templates-Add, Aqua, Arrows, Badges, Bar, Blend, Blue, Bright, Bubbles, Buttons, Caution, Circle, Drop, Elements, Glossy, Glowing, Graphic, Heart, Help, Icons, Idea, Illustration, Navigation, Oblong, Plus, Round, Service, Shadow, Shiny, Sign, Speech, Squares Educate your team with a winning presentation with our Ppt Circle PowerPoint Presentation 3d Arrows Displaying Issues Templates. You will come out on top.
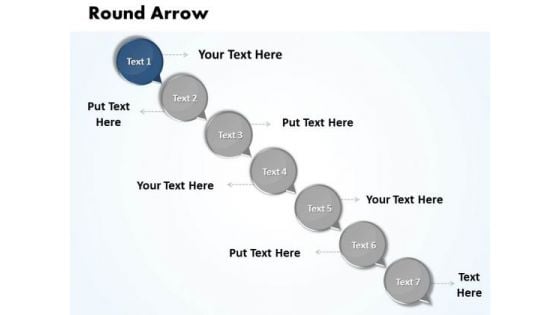
Ppt Bending Arrow 7 Create PowerPoint Macro Business Templates
PPT bending arrow 7 create powerpoint macro Business Templates-This PowerPoint diagram is particularly useful for displaying how a process currently functions or could ideally function in Circular text boxes. Use this 3D awesome List and Circular text boxes PowerPoint templates to create awesome marketing and sales priority lists or any other types of lists. You can change color, size and orientation of any icon to your liking. -PPT bending arrow 7 create powerpoint macro Business Templates-Add, Aqua, Arrows, Badges, Bar, Blend, Blue, Bright, Bubbles, Buttons, Caution, Circle, Drop, Elements, Glossy, Glowing, Graphic, Heart, Help, Icons, Idea, Illustration, Navigation, Oblong, Plus, Round, Service, Shadow, Shiny, Sign, Speech, Squares Guide your team with our Ppt Bending Arrow 7 Create PowerPoint Macro Business Templates. Download without worries with our money back guaranteee.
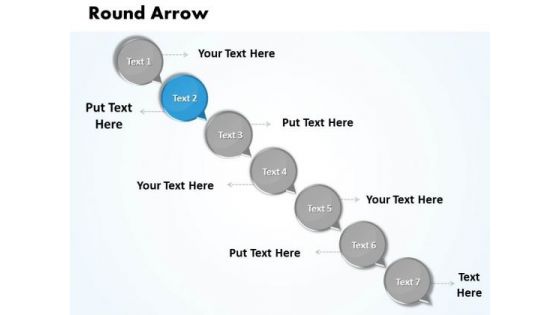
Ppt Text Circles With Circular Arrows PowerPoint 2007 Steps Business Templates
PPT text circles with circular arrows powerpoint 2007 steps Business Templates-Use this layout to define the outcome and the multiple possibilities in a way that is used in calculation of probabilities, genetics and strategic reasoning. This chart visualizes the concept of process steps, reoccurrences and components or of your company structure or product features. You can change color, size and orientation of any icon to your liking. -PPT text circles with circular arrows powerpoint 2007 steps Business Templates-Add, Aqua, Arrows, Badges, Bar, Blend, Blue, Bright, Bubbles, Buttons, Caution, Circle, Drop, Elements, Glossy, Glowing, Graphic, Heart, Help, Icons, Idea, Illustration, Navigation, Oblong, Plus, Round, Service, Shadow, Shiny, Sign, Speech, Squares Make use of the facilities our Ppt Text Circles With Circular Arrows PowerPoint 2007 Steps Business Templates offer. You will be delighted with the choices available.
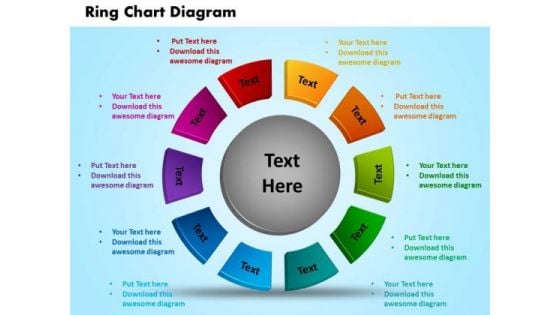
PowerPoint Slide Ring Chart Diagram Business Ppt Themes
PowerPoint Slide Ring Chart Diagram Business PPT Themes-This Multi-colored PowerPoint Diagram showing ten different parts which are forming the Ring, explaining these topics in sequence. Use this PowerPoint Diagram for Business Presentations. You can Edit color, size and orientation of any icon to your liking.-PowerPoint Slide Ring Chart Diagram Business PPT Themes Make your presentations quickly with our PowerPoint Slide Ring Chart Diagram Business Ppt Themes. You'll always stay ahead of the game.
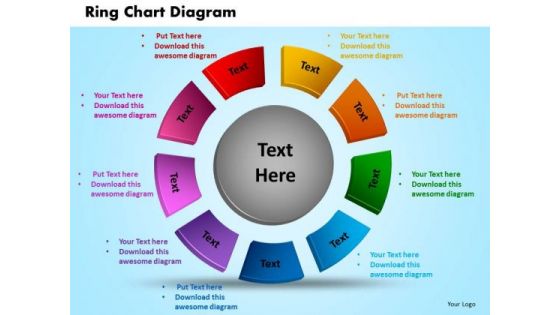
PowerPoint Templates Ring Chart Diagram Business Ppt Theme
PowerPoint Templates Ring Chart Diagram Business PPT Theme-This PowerPoint Diagram shows the ring strategy which signifies adapt, adjust, agree to, concert, construct, contrive, decide, design, determine, devise, direct, draft, establish, frame. You can change color, size and orientation of any icon to your liking. This Diagram will fit for Business related Presentations.-PowerPoint Templates Ring Chart Diagram Business PPT Theme Earn the esteem of your colleagues with our PowerPoint Templates Ring Chart Diagram Business Ppt Theme. Give your thoughts that something special.
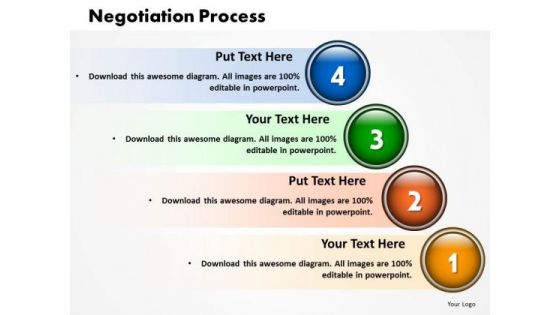
Business Growth PowerPoint Templates Business Four Stages Of Negotiation Process Ppt Slides
Business Growth PowerPoint Templates Business Four Stages Of Negotiation Process PPT Slides-Use this Negotiation Process Diagram which can be used to explain the four steps or actions involved in Process. You can change color, size and orientation of any icon to your liking.-Business Growth PowerPoint Templates Business Four Stages Of Negotiation Process PPT Slides Exhibit your erudition on our Business Growth PowerPoint Templates Business Four Stages Of Negotiation Process Ppt Slides. Give the audience a taste of your profound knowledge.

1 Wireless Computer Networking Wifi Access Point Connected To Globe Computers Ppt Slides
This image slide displays wireless computer networking Wi-Fi access point connected to globe computers. This image slide has been designed with graphic of globe, wireless router and various technology devices. This image slide depicts networking. You may change size, color and orientation of any icon to your liking. Use this PowerPoint template to express views on global, wireless networking in your presentations. This image may also be used in computer education presentations. This image slide will impart professional appearance to your presentations.

Business Charts PowerPoint Templates An Illustration Of Angry Emotion Sales
Business Charts PowerPoint templates an illustration of angry emotion Sales-This PowerPoint Diagram Illustrates all the Angry Emoticons which will help you to express exasperation, irritability, antagonism etc. .You can change color, size and orientation of any icon to your liking. Our Business Charts PowerPoint Templates An Illustration Of Angry Emotion Sales will ensure you get an A. You will be glad you tried us out.
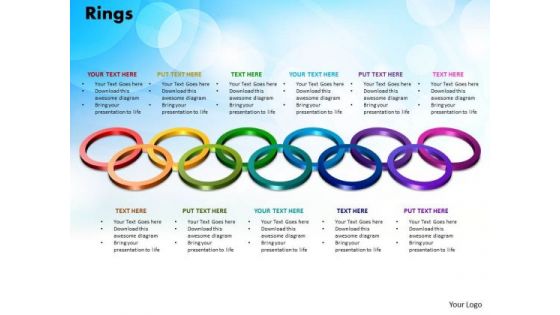
PowerPoint Design Rings Strategy Ppt Template
PowerPoint Design Rings Strategy PPT Template-This PowerPoint Diagram Shows the Colorful rings Connected to each other. This Template can be used as a Background for Business Presentations. This PowerPoint Template Signifies the Strategy, Planning required for Business. You can Edit color, size and orientation of any icon to your liking.-PowerPoint Design Rings Strategy PPT Template Demand it all from our PowerPoint Design Rings Strategy Ppt Template. They will deliver without fail.
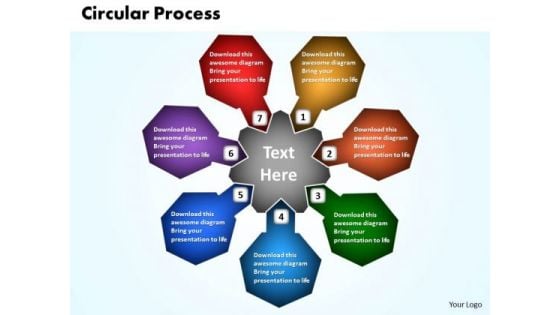
Business Process PowerPoint Templates Business Circular Process Of Decision Making Ppt Slides
Business Process PowerPoint Templates Business Circular Process Of Decision Making PPT Slides-Use this Circular Process to represent a continuing sequence of stages, tasks, or events in a circular flow and emphasize the connection between all components. You can change color, size and orientation of any icon to your liking.-Business Process PowerPoint Templates Business Circular Process Of Decision Making PPT Slides Achieve high-impact with our Business Process PowerPoint Templates Business Circular Process Of Decision Making Ppt Slides. They will make you look good.
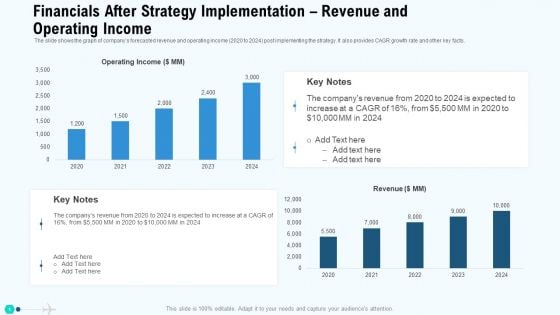
Financials After Strategy Implementation Revenue And Operating Income Themes PDF
The slide shows the graph of companys forecasted revenue and operating income 2020 to 2024 post implementing the strategy. It also provides CAGR growth rate and other key facts. Deliver and pitch your topic in the best possible manner with this financials after strategy implementation revenue and operating income themes pdf. Use them to share invaluable insights on financials after strategy implementation revenue and operating income and impress your audience. This template can be altered and modified as per your expectations. So, grab it now.
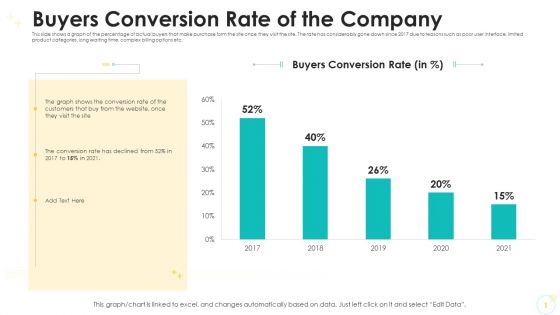
Buyers Conversion Rate Of The Company Themes PDF
This slide shows a graph of the percentage of actual buyers that make purchase form the site once they visit the site. The rate has considerably gone down since 2017 due to reasons such as poor user interface, limited product categories, long waiting time, complex billing options etc. Deliver an awe-inspiring pitch with this creative buyers conversion rate of the company themes pdf. bundle. Topics like buyers conversion rate, 2016 to 2021 can be discussed with this completely editable template. It is available for immediate download depending on the needs and requirements of the user.
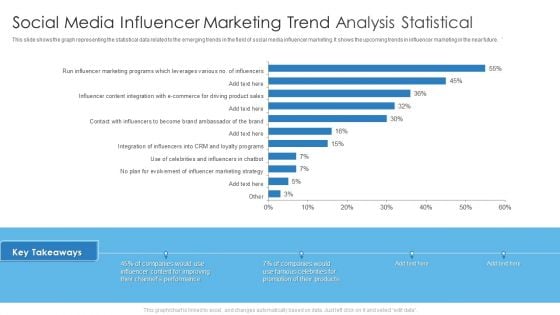
Social Media Influencer Marketing Trend Analysis Statistical Themes PDF
This slide shows the graph representing the statistical data related to the emerging trends in the field of social media influencer marketing. It shows the upcoming trends in influencer marketing in the near future. Deliver an awe inspiring pitch with this creative Social Media Influencer Marketing Trend Analysis Statistical Themes PDF bundle. Topics like Social Media Influencer, Marketing Trend Analysis Statistical can be discussed with this completely editable template. It is available for immediate download depending on the needs and requirements of the user.
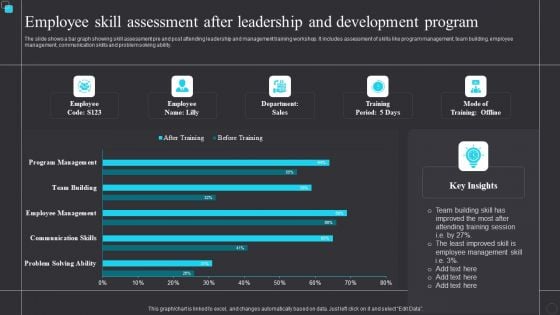
Employee Skill Assessment After Leadership And Development Program Themes PDF
The slide shows a bar graph showing skill assessment pre and post attending leadership and management training workshop. It includes assessment of skills like program management, team building, employee management, communication skills and problem solving ability. Showcasing this set of slides titled Employee Skill Assessment After Leadership And Development Program Themes PDF. The topics addressed in these templates are Team, Employee Management. All the content presented in this PPT design is completely editable. Download it and make adjustments in color, background, font etc. as per your unique business setting.
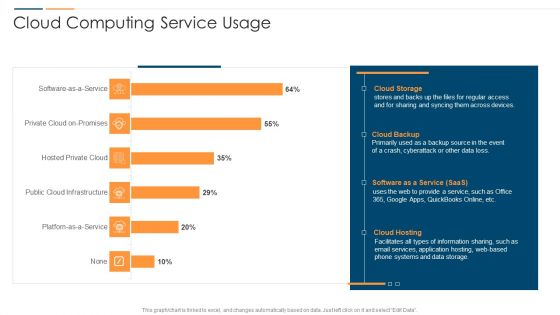
Revolution In Online Business Cloud Computing Service Usage Ppt PowerPoint Presentation File Themes PDF
This graph or chart is linked to excel, and changes automatically based on data. Just left click on it and select Edit Data. Deliver and pitch your topic in the best possible manner with this Revolution In Online Business Cloud Computing Service Usage Ppt PowerPoint Presentation File Themes PDF. Use them to share invaluable insights on Cloud Storage System, Cloud Backup Saas, Cloud Hosting Storage and impress your audience. This template can be altered and modified as per your expectations. So, grab it now.
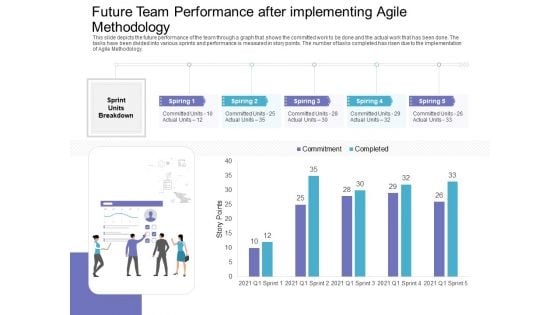
Future Team Performance After Implementing Agile Methodology Diagrams PDF
This slide depicts the future performance of the team through a graph that shows the committed work to be done and the actual work that has been done. The tasks have been divided into various sprints and performance is measured in story points. The number of tasks completed has risen due to the implementation of Agile Methodology. Deliver and pitch your topic in the best possible manner with this future team performance after implementing agile methodology diagrams pdf. Use them to share invaluable insights on future team performance after implementing agile methodology and impress your audience. This template can be altered and modified as per your expectations. So, grab it now.
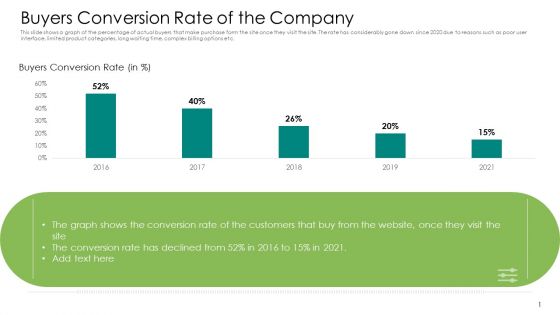
Buyers Conversion Rate Of The Company Diagrams PDF
This slide shows a graph of the percentage of actual buyers that make purchase form the site once they visit the site. The rate has considerably gone down since 2020 due to reasons such as poor user interface, limited product categories, long waiting time, complex billing options etc. Deliver an awe-inspiring pitch with this creative buyers conversion rate of the company diagrams pdf. bundle. Topics like buyers conversion rate, 2016 to 2021 can be discussed with this completely editable template. It is available for immediate download depending on the needs and requirements of the user.
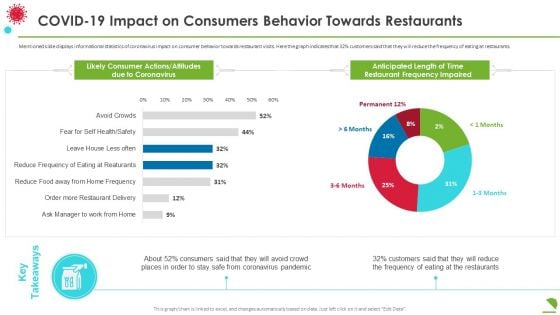
Covid19 Impact On Consumers Behavior Towards Restaurants Diagrams PDF
Mentioned slide displays informational statistics of coronavirus impact on consumer behavior towards restaurant visits. Here the graph indicates that 32 percentage customers said that they will reduce the frequency of eating at restaurants. Deliver an awe inspiring pitch with this creative covid19 impact on consumers behavior towards restaurants diagrams pdf bundle. Topics like covid 19 impact on consumers behavior towards restaurants can be discussed with this completely editable template. It is available for immediate download depending on the needs and requirements of the user.
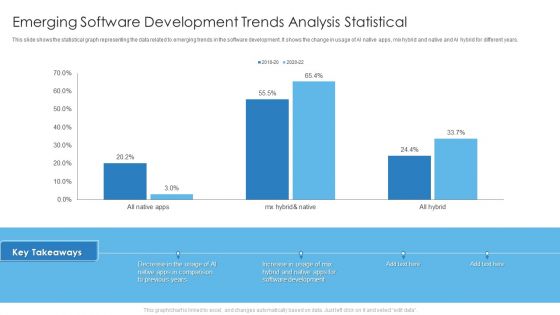
Emerging Software Development Trends Analysis Statistical Diagrams PDF
This slide shows the statistical graph representing the data related to emerging trends in the software development. It shows the change in usage of AI native apps, mix hybrid and native and AI hybrid for different years. Deliver and pitch your topic in the best possible manner with this Emerging Software Development Trends Analysis Statistical Diagrams PDF. Use them to share invaluable insights on Emerging Software Development, Trends Analysis Statistical and impress your audience. This template can be altered and modified as per your expectations. So, grab it now.
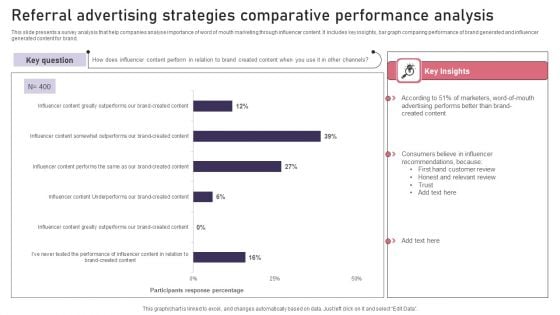
Referral Advertising Strategies Comparative Performance Analysis Diagrams PDF
This slide presents a survey analysis that help companies analyse importance of word of mouth marketing through influencer content. It includes key insights, bar graph comparing performance of brand generated and influencer generated content for brand. Showcasing this set of slides titled Referral Advertising Strategies Comparative Performance Analysis Diagrams PDF. The topics addressed in these templates are Referral Advertising, Strategies Comparative, Performance Analysis. All the content presented in this PPT design is completely editable. Download it and make adjustments in color, background, font etc. as per your unique business setting.
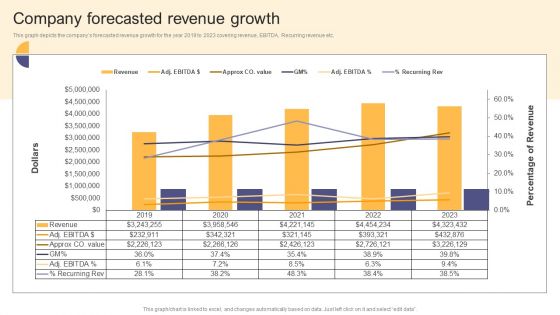
Per Device Pricing Strategy For Managed Solutions Company Forecasted Revenue Growth Themes PDF
This graph depicts the companys forecasted revenue growth for the year 2019 to 2023 covering revenue, EBITDA, Recurring revenue etc. Get a simple yet stunning designed Per Device Pricing Strategy For Managed Solutions Company Forecasted Revenue Growth Themes PDF. It is the best one to establish the tone in your meetings. It is an excellent way to make your presentations highly effective. So, download this PPT today from Slidegeeks and see the positive impacts. Our easy to edit Per Device Pricing Strategy For Managed Solutions Company Forecasted Revenue Growth Themes PDF can be your go to option for all upcoming conferences and meetings. So, what are you waiting for Grab this template today.
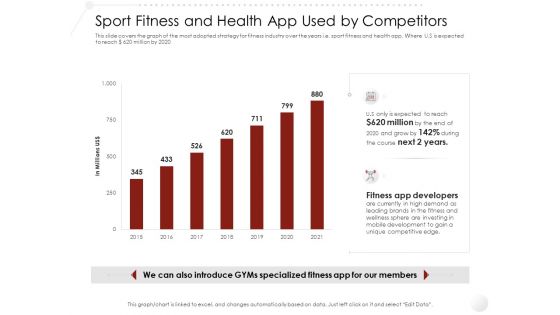
Market Entry Strategy Gym Clubs Industry Sport Fitness And Health App Used By Competitors Themes PDF
This slide covers the graph of the most adopted strategy for fitness industry over the years i.e. sport fitness and health app. Where U.S is expected to reach Dollar 620 million by 2020. Deliver and pitch your topic in the best possible manner with this market entry strategy gym clubs industry sport fitness and health app used by competitors themes pdf. Use them to share invaluable insights on fitness developers, investing, unique competitive, 2015 to 2021 and impress your audience. This template can be altered and modified as per your expectations. So, grab it now.
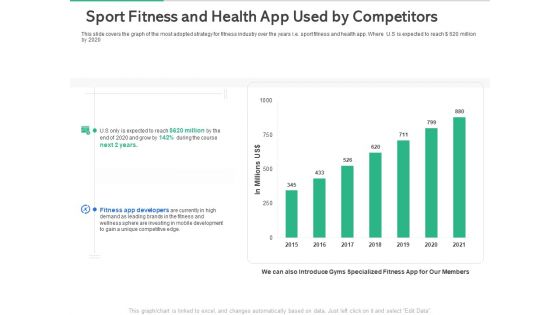
Market Overview Fitness Industry Sport Fitness And Health App Used By Competitors Themes PDF
This slide covers the graph of the most adopted strategy for fitness industry over the years i.e. sport fitness and health app. Where U.S is expected to reach dollar 620 million by 2020. Deliver and pitch your topic in the best possible manner with this market overview fitness industry sport fitness and health app used by competitors themes pdf. Use them to share invaluable insights on sport fitness and health app used by competitors and impress your audience. This template can be altered and modified as per your expectations. So, grab it now.
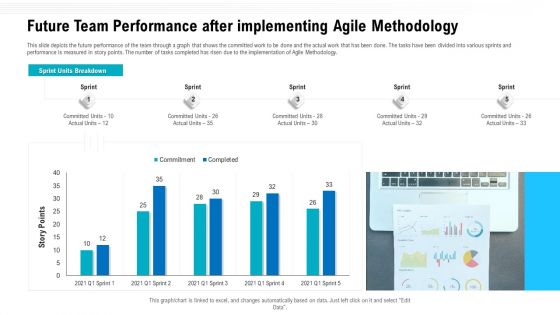
Future Team Performance After Implementing Agile Methodology Ppt Layouts Themes PDF
This slide depicts the future performance of the team through a graph that shows the committed work to be done and the actual work that has been done. The tasks have been divided into various sprints and performance is measured in story points. The number of tasks completed has risen due to the implementation of Agile Methodology. Deliver and pitch your topic in the best possible manner with this future team performance after implementing agile methodology ppt layouts themes pdf. Use them to share invaluable insights on future team performance after implementing agile methodology and impress your audience. This template can be altered and modified as per your expectations. So, grab it now.
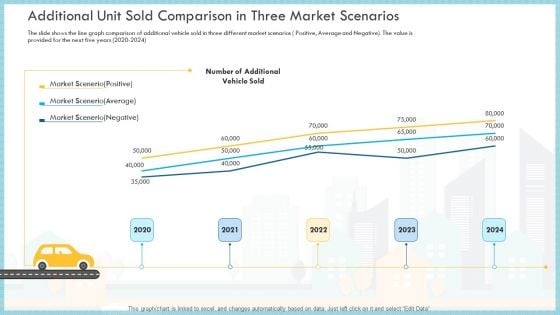
Additional Unit Sold Comparison In Three Market Scenarios Sold Themes PDF
The slide shows the line graph comparison of additional vehicle sold in three different market scenarios Positive, Average and Negative. The value is provided for the next five years 2020 to 2024 Deliver an awe inspiring pitch with this creative additional unit sold comparison in three market scenarios sold themes pdf bundle. Topics like market scenario positive, market scenario average, market scenario negative can be discussed with this completely editable template. It is available for immediate download depending on the needs and requirements of the user.
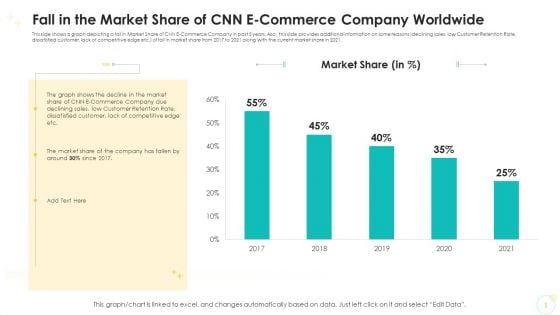
Fall In The Market Share Of CNN E Commerce Company Worldwide Themes PDF
This slide shows a graph depicting a fall in Market Share of CNN E Commerce Company in past 5 years. Also, this slide provides additional information on some reasons declining sales, low Customer Retention Rate, dissatisfied customer, lack of competitive edge etc. of fall in market share from 2017 to 2021 along with the current market share in 2021.Deliver an awe-inspiring pitch with this creative fall in the market share of CNN e commerce company worldwide themes pdf. bundle. Topics like market share, 2017 to 2021 can be discussed with this completely editable template. It is available for immediate download depending on the needs and requirements of the user.
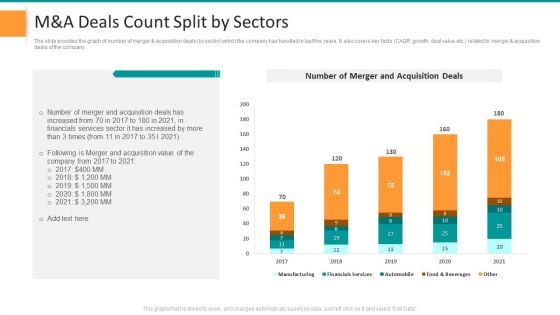
Pitch Deck For General Advisory Deal M And A Deals Count Split By Sectors Themes PDF
The slide provides the graph of number of merger and acquisition deals by sector which the company has handled in last five years. It also covers key facts CAGR growth, deal value etc. related to merger and acquisition deals of the company. Deliver an awe inspiring pitch with this creative pitch deck for general advisory deal m and a deals count split by sectors themes pdf bundle. Topics like m and a deals count split by sectors can be discussed with this completely editable template. It is available for immediate download depending on the needs and requirements of the user.
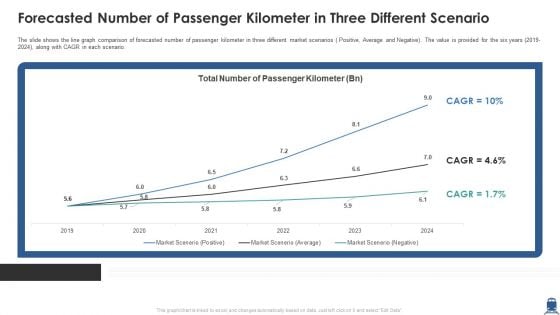
Forecasted Number Of Passenger Kilometer In Three Different Scenario Themes PDF
The slide shows the line graph comparison of forecasted number of passenger kilometer in three different market scenarios Positive, Average and Negative. The value is provided for the six years 2019-2024, along with CAGR in each scenario. Deliver and pitch your topic in the best possible manner with this forecasted number of passenger kilometer in three different scenario themes pdf. Use them to share invaluable insights on forecasted number of passenger kilometer in three different scenario and impress your audience. This template can be altered and modified as per your expectations. So, grab it now.
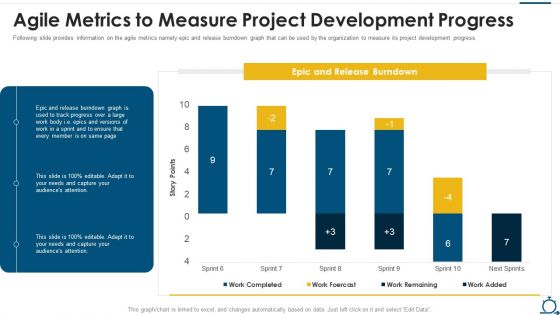
Agile SDLC IT Agile Metrics To Measure Project Development Progress Themes PDF
Following slide provides information on the agile metrics namely epic and release burndown graph that can be used by the organization to measure its project development progress. Deliver and pitch your topic in the best possible manner with this agile sdlc it agile metrics to measure project development progress themes pdf. Use them to share invaluable insights on agile metrics to measure project development progress and impress your audience. This template can be altered and modified as per your expectations. So, grab it now.
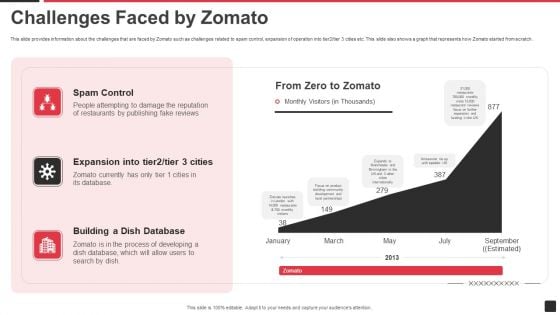
Zomato Venture Capitalist Fundraising Pitch Deck Challenges Faced By Zomato Themes PDF
This slide provides information about the challenges that are faced by Zomato such as challenges related to spam control, expansion of operation into tier2 or tier 3 cities etc. This slide also shows a graph that represents how Zomato started from scratch. Deliver an awe inspiring pitch with this creative zomato venture capitalist fundraising pitch deck challenges faced by zomato themes pdf bundle. Topics like spam control, expansion into tier2 or tier 3 cities, building a dish database can be discussed with this completely editable template. It is available for immediate download depending on the needs and requirements of the user.
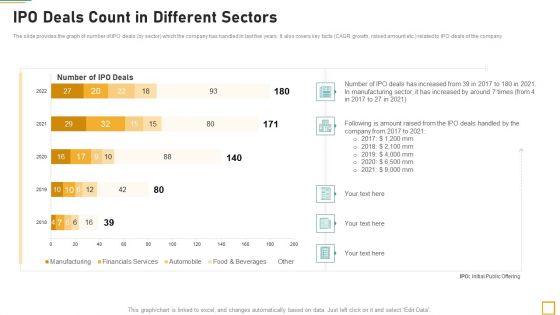
Pitch Book For Investor Funding Contract IPO Deals Count In Different Sectors Themes PDF
The slide provides the graph of number of IPO deals by sector which the company has handled in last five years. It also covers key facts CAGR growth, raised amount etc. related to IPO deals of the company. Deliver an awe inspiring pitch with this creative pitch book for investor funding contract ipo deals count in different sectors themes pdf bundle. Topics like ipo deals count in different sectors can be discussed with this completely editable template. It is available for immediate download depending on the needs and requirements of the user.
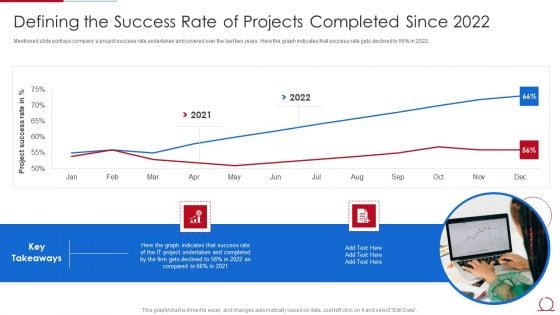
Quality Assurance Model For Agile IT Defining The Success Rate Of Projects Completed Themes PDF
Mentioned slide portrays companys project success rate undertaken and covered over the last two years. Here the graph indicates that success rate gets declined to 56 percent in 2022. Deliver an awe inspiring pitch with this creative quality assurance model for agile it defining the success rate of projects completed themes pdf bundle. Topics like success rate, it project, 2021 to 2022 can be discussed with this completely editable template. It is available for immediate download depending on the needs and requirements of the user.

Quality Assurance Model For Agile IT Forecasted Impact Of Adopting Agile Model Themes PDF
Mentioned slide portrays forecasted companys project success rate after adopting agile mode. Here the graph indicates that success rate will get increased to 73 percent in 2023. Deliver and pitch your topic in the best possible manner with this quality assurance model for agile it forecasted impact of adopting agile model themes pdf. Use them to share invaluable insights on success rate, it project, 2022 to 2023 and impress your audience. This template can be altered and modified as per your expectations. So, grab it now.
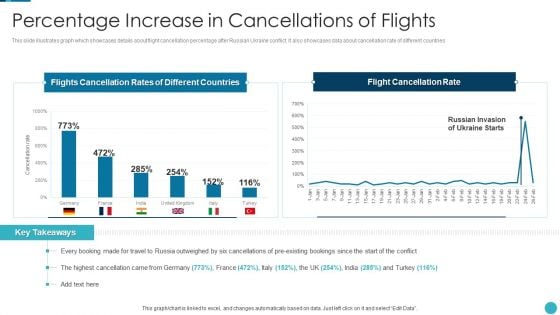
Russia Ukraine War Influence On Airline Sector Percentage Increase In Cancellations Of Flights Themes PDF
This slide illustrates graph which showcases details about flight cancellation percentage after Russian Ukraine conflict. It also showcases data about cancellation rate of different countries Deliver and pitch your topic in the best possible manner with this russia ukraine war influence on airline sector percentage increase in cancellations of flights themes pdf Use them to share invaluable insights on percentage increase in cancellations of flights and impress your audience. This template can be altered and modified as per your expectations. So, grab it now.
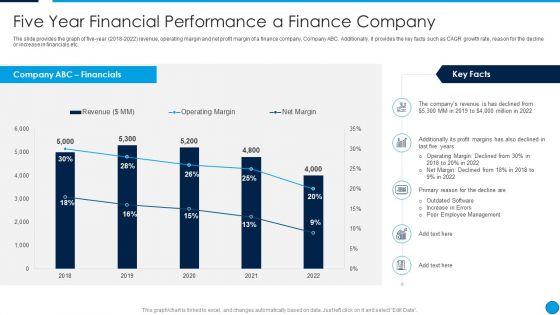
Summary Financial Five Year Financial Performance A Finance Company Themes PDF
The slide provides the graph of five-year 2018 to 2022 revenue, operating margin and net profit margin of a finance company, Company ABC. Additionally, it provides the key facts such as CAGR growth rate, reason for the decline or increase in financials etc. Deliver and pitch your topic in the best possible manner with this Summary Financial Five Year Financial Performance A Finance Company Themes PDF. Use them to share invaluable insights on Revenue, Operating Margin, Net Margin, 2018 To 2022 and impress your audience. This template can be altered and modified as per your expectations. So, grab it now.
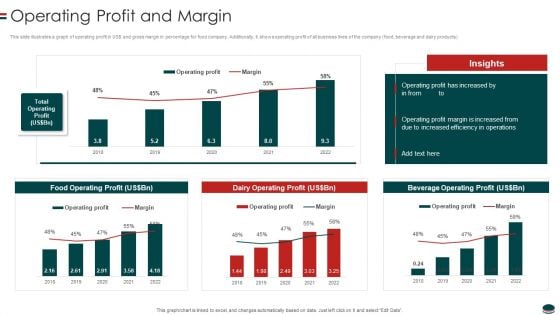
Instant Snacks And Food Firm Details Operating Profit And Margin Themes PDF
This slide illustrates a graph of operating profit in US and gross margin in percentage for food company. Additionally, it shows operating profit of all business lines of the company food, beverage and dairy products.Deliver an awe inspiring pitch with this creative Instant Snacks And Food Firm Details Operating Profit And Margin Themes PDF bundle. Topics like Operating Profit, Increased Efficiency, Beverage Operating can be discussed with this completely editable template. It is available for immediate download depending on the needs and requirements of the user.
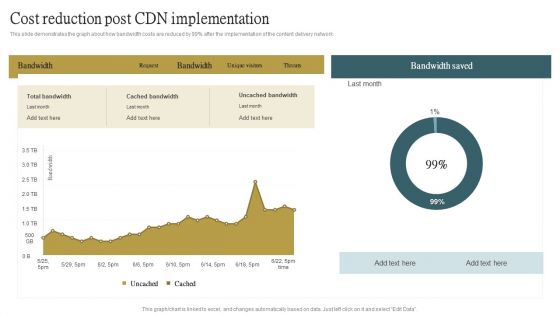
Cloud Content Delivery Network Cost Reduction Post CDN Implementation Themes PDF
This slide demonstrates the graph about how bandwidth costs are reduced by 99 percent after the implementation of the content delivery network. This Cloud Content Delivery Network Cost Reduction Post CDN Implementation Themes PDF from Slidegeeks makes it easy to present information on your topic with precision. It provides customization options, so you can make changes to the colors, design, graphics, or any other component to create a unique layout. It is also available for immediate download, so you can begin using it right away. Slidegeeks has done good research to ensure that you have everything you need to make your presentation stand out. Make a name out there for a brilliant performance.
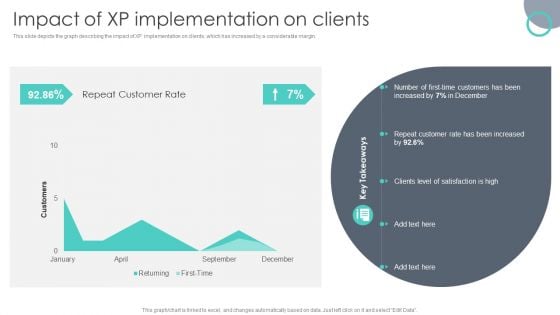
Extreme Programming Methodology Impact Of XP Implementation On Clients Themes PDF
This slide depicts the graph describing the impact of XP implementation on clients, which has increased by a considerable margin. Want to ace your presentation in front of a live audience Our Extreme Programming Methodology Impact Of XP Implementation On Clients Themes PDF can help you do that by engaging all the users towards you. Slidegeeks experts have put their efforts and expertise into creating these impeccable powerpoint presentations so that you can communicate your ideas clearly. Moreover, all the templates are customizable, and easy to edit and downloadable. Use these for both personal and commercial use.
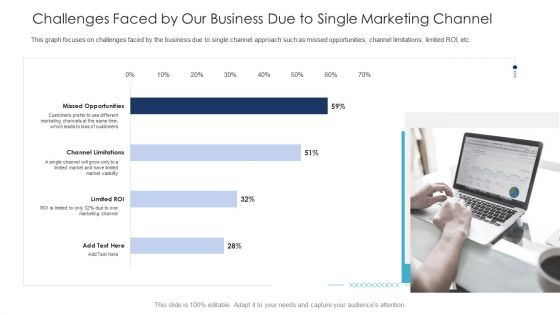
B2C Marketing Initiatives Strategies For Business Challenges Faced By Our Business Due To Single Marketing Channel Themes PDF
This graph focuses on challenges faced by the business due to single channel approach such as missed opportunities, channel limitations, limited ROI, etc. Deliver and pitch your topic in the best possible manner with this B2C marketing initiatives strategies for business challenges faced by our business due to single marketing channel themes pdf. Use them to share invaluable insights on opportunities, marketing channels, market visibility and impress your audience. This template can be altered and modified as per your expectations. So, grab it now.
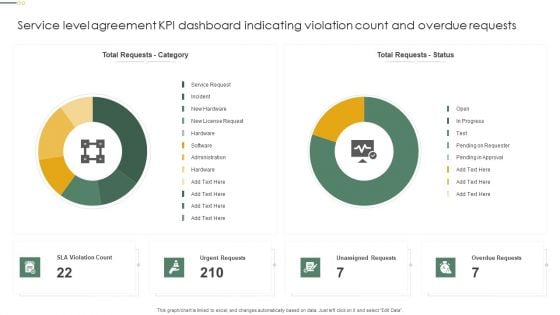
Service Level Agreement KPI Dashboard Indicating Violation Count And Overdue Requests Diagrams PDF
This graph or chart is linked to excel, and changes automatically based on data. Just left click on it and select Edit Data. Showcasing this set of slides titled Service Level Agreement KPI Dashboard Indicating Violation Count And Overdue Requests Diagrams PDF. The topics addressed in these templates are Total Requests Category, Total Requests Status, Urgent Requests. All the content presented in this PPT design is completely editable. Download it and make adjustments in color, background, font etc. as per your unique business setting.
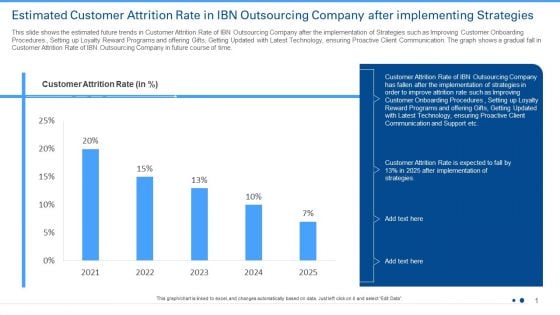
Estimated Customer Attrition Rate In IBN Outsourcing Company After Implementing Strategies Ppt Visual Aids Diagrams PDF
This slide shows a graph of decrease in level of Customer Satisfaction in IBN Outsourcing Company for past 5 years. Additionally, this slide provides information on some reasons High Response Time, Insufficient Knowledge with the Agent, Inability in Prioritizing Customer Requests etc. of fall in customer satisfaction level from 2017 to 2021.Deliver and pitch your topic in the best possible manner with this estimated customer attrition rate in ibn outsourcing company after implementing strategies ppt visual aids diagrams pdf. Use them to share invaluable insights on customer attrition rate, 2021 to 2025 and impress your audience. This template can be altered and modified as per your expectations. So, grab it now.
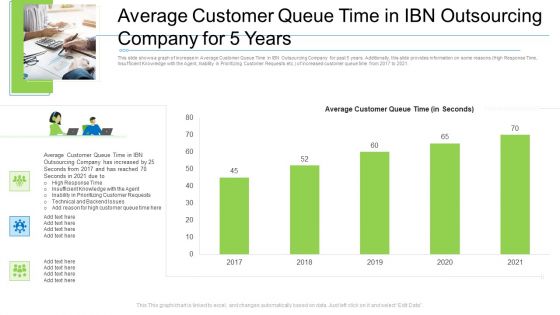
Average Customer Queue Time In Ibn Outsourcing Company For 5 Years Diagrams PDF
This slide shows a graph of increase in Average Customer Queue Time in IBN Outsourcing Company for past 5 years. Additionally, this slide provides information on some reasons High Response Time, Insufficient Knowledge with the Agent, Inability in Prioritizing Customer Requests etc. of increased customer queue time from 2017 to 2021. Deliver an awe-inspiring pitch with this creative average customer queue time in ibn outsourcing company for 5 years diagrams pdf. bundle. Topics like average customer queue time in ibn outsourcing company for 5 years can be discussed with this completely editable template. It is available for immediate download depending on the needs and requirements of the user.
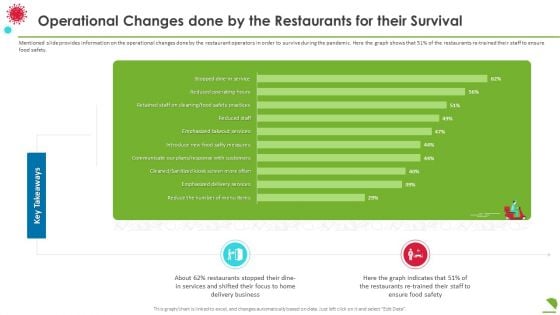
Operational Changes Done By The Restaurants For Their Survival Diagrams PDF
Mentioned slide provides information on the operational changes done by the restaurant operators in order to survive during the pandemic. Here the graph shows that 51 percentage of the restaurants re trained their staff to ensure food safety. Deliver an awe inspiring pitch with this creative operational changes done by the restaurants for their survival diagrams pdf bundle. Topics like business, services, key takeaways can be discussed with this completely editable template. It is available for immediate download depending on the needs and requirements of the user.
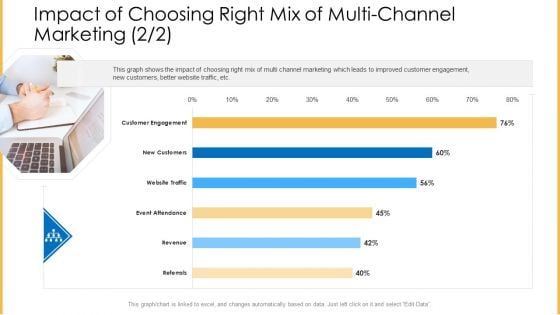
Amalgamation Marketing Pitch Deck Impact Of Choosing Right Mix Of Multi Channel Marketing Customer Diagrams PDF
This graph shows the impact of choosing right mix of multi channel marketing which leads to improved customer engagement, new customers, better website traffic, etc. Deliver and pitch your topic in the best possible manner with this amalgamation marketing pitch deck impact of choosing right mix of multi channel marketing customer diagrams pdf. Use them to share invaluable insights on engagement, website, traffic, revenue, referrals and impress your audience. This template can be altered and modified as per your expectations. So, grab it now.
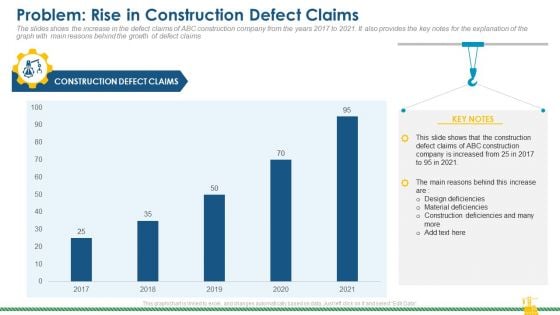
Rising Construction Defect Claims Against The Corporation Problem Rise In Construction Defect Claims Diagrams PDF
The slides shows the increase in the defect claims of ABC construction company from the years 2017 to 2021. It also provides the key notes for the explanation of the graph with main reasons behind the growth of defect claims. Deliver and pitch your topic in the best possible manner with this rising construction defect claims against the corporation problem rise in construction defect claims diagrams pdf. Use them to share invaluable insights on defect, claims, material deficiencies, design deficiencies and impress your audience. This template can be altered and modified as per your expectations. So, grab it now.
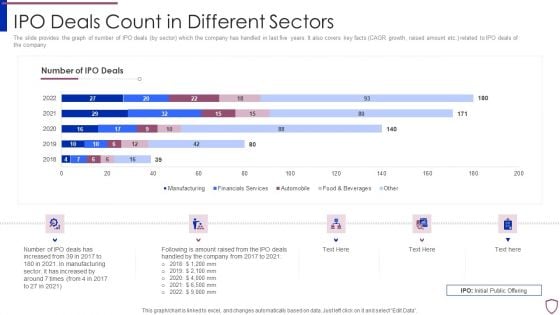
Financing Catalogue For Security Underwriting Agreement IPO Deals Count In Different Sectors Diagrams PDF
The slide provides the graph of number of IPO deals by sector which the company has handled in last five years. It also covers key facts CAGR growth, raised amount etc. related to IPO deals of the company. Deliver an awe inspiring pitch with this creative financing catalogue for security underwriting agreement ipo deals count in different sectors diagrams pdf bundle. Topics like manufacturing, financial services, automobile, food and beverages can be discussed with this completely editable template. It is available for immediate download depending on the needs and requirements of the user.
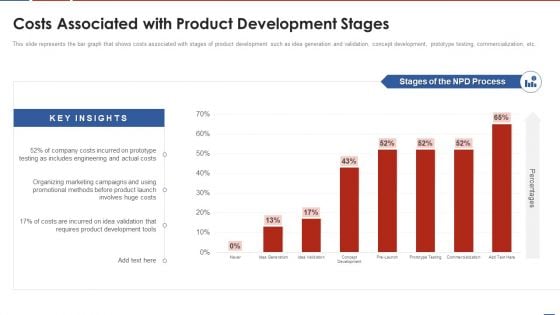
Formulating Product Development Action Plan To Enhance Client Experience Costs Associated With Product Diagrams PDF
This slide represents the bar graph that shows costs associated with stages of product development such as idea generation and validation, concept development, prototype testing, commercialization, etc. Deliver and pitch your topic in the best possible manner with this formulating product development action plan to enhance client experience costs associated with product diagrams pdf. Use them to share invaluable insights on development, costs, organizing, marketing, campaigns and impress your audience. This template can be altered and modified as per your expectations. So, grab it now.
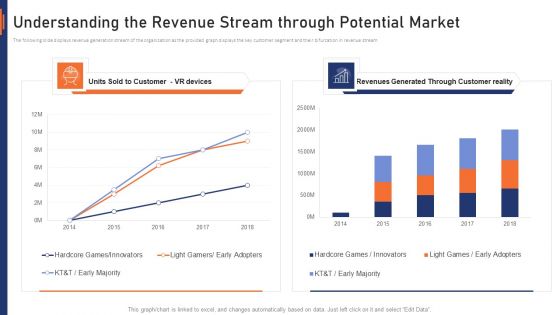
VR Market Capital Raising Elevator Pitch Deck Understanding The Revenue Stream Through Potential Market Diagrams PDF
The following slide displays revenue generation stream of the organization as the provided graph displays the key customer segment and their bifurcation in revenue stream. Deliver and pitch your topic in the best possible manner with this vr market capital raising elevator pitch deck understanding the revenue stream through potential market diagrams pdf. Use them to share invaluable insights on understanding the revenue stream through potential market and impress your audience. This template can be altered and modified as per your expectations. So, grab it now.
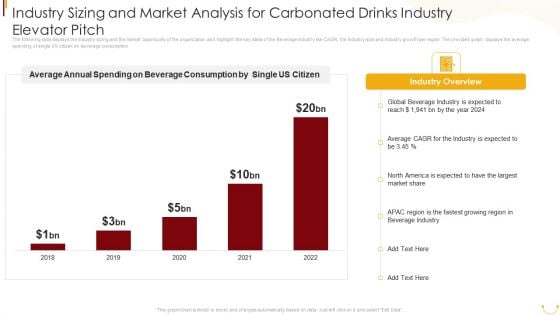
Industry Sizing And Market Analysis For Carbonated Drinks Industry Elevator Pitch Diagrams PDF
The following slide displays the Industry sizing and the market opportunity of the organization as it highlight the key stats of the Beverage industry like CAGR, the Industry size and Industry growth per region. The provided graph displays the average spending of single US citizen on beverage consumption. Deliver and pitch your topic in the best possible manner with this Industry Sizing And Market Analysis For Carbonated Drinks Industry Elevator Pitch Diagrams PDF. Use them to share invaluable insights on Average Annual Spending, Beverage Consumption, Single US Citizen, Global Beverage Industry, 2018 To 2022 and impress your audience. This template can be altered and modified as per your expectations. So, grab it now.
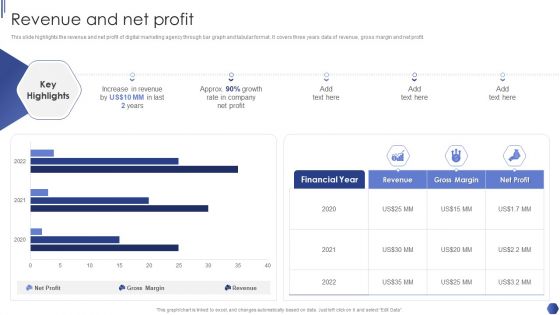
Digital Marketing Agency Business Profile Revenue And Net Profit Diagrams PDF
This slide highlights the revenue and net profit of digital marketing agency through bar graph and tabular format. It covers three years data of revenue, gross margin and net profit. Deliver and pitch your topic in the best possible manner with this Digital Marketing Agency Business Profile Revenue And Net Profit Diagrams PDF. Use them to share invaluable insights on Increase In Revenue, Growth Rate, Net Profit and impress your audience. This template can be altered and modified as per your expectations. So, grab it now.
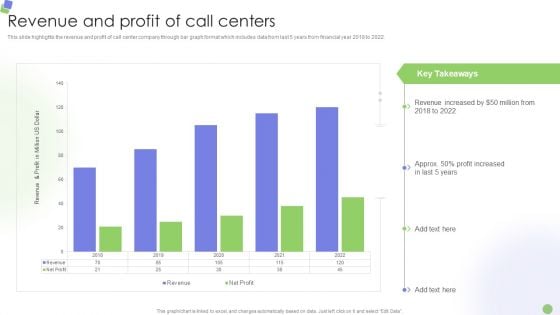
Knowledge Process Outsourcing Company Profile Revenue And Profit Of Call Centers Diagrams PDF
This slide highlights the revenue and profit of call center company through bar graph format which includes data from last 5 years from financial year 2018 to 2022.Deliver and pitch your topic in the best possible manner with this Knowledge Process Outsourcing Company Profile Revenue And Profit Of Call Centers Diagrams PDF. Use them to share invaluable insights on Revenue Increased, Profit Increased, Key Takeaways and impress your audience. This template can be altered and modified as per your expectations. So, grab it now.
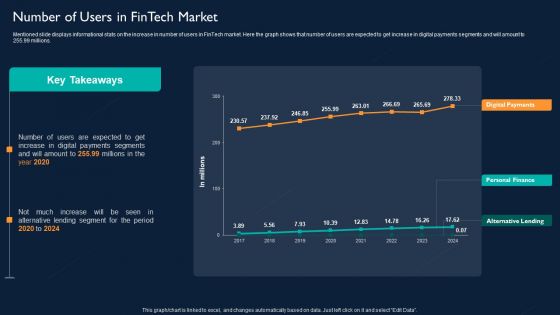
Technology Investment To Enhance Business Growth Number Of Users In Fintech Market Diagrams PDF
Mentioned slide displays informational stats on the increase in number of users in FinTech market. Here the graph shows that number of users are expected to get increase in digital payments segments and will amount to 255.99 millions. Deliver and pitch your topic in the best possible manner with this Technology Investment To Enhance Business Growth Number Of Users In Fintech Market Diagrams PDF. Use them to share invaluable insights on Alternative Lending, Personal Finance, Digital Payments and impress your audience. This template can be altered and modified as per your expectations. So, grab it now.

Expectations After Expanding Into Global Markets Ppt PowerPoint Presentation Diagram Lists PDF
This slide showcase graph that can help organization to estimate the impact on organizational sales after global expansion. It showcases sales in thousand dollars and forecast for a period of two years.Want to ace your presentation in front of a live audience Our Expectations After Expanding Into Global Markets Ppt PowerPoint Presentation Diagram Lists PDF can help you do that by engaging all the users towards you.. Slidegeeks experts have put their efforts and expertise into creating these impeccable powerpoint presentations so that you can communicate your ideas clearly. Moreover, all the templates are customizable, and easy-to-edit and downloadable. Use these for both personal and commercial use.
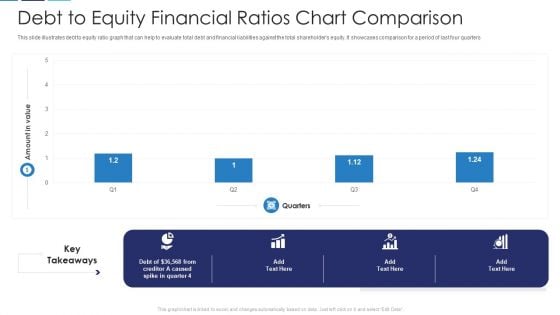
Debt To Equity Financial Ratios Chart Comparison Download PDF
This slide illustrates debt to equity ratio graph that can help to evaluate total debt and financial liabilities against the total shareholders equity. It showcases comparison for a period of last four quarters Pitch your topic with ease and precision using this debt to equity financial ratios chart comparison download pdf. This layout presents information on debt to equity financial ratios chart comparison. It is also available for immediate download and adjustment. So, changes can be made in the color, design, graphics or any other component to create a unique layout.
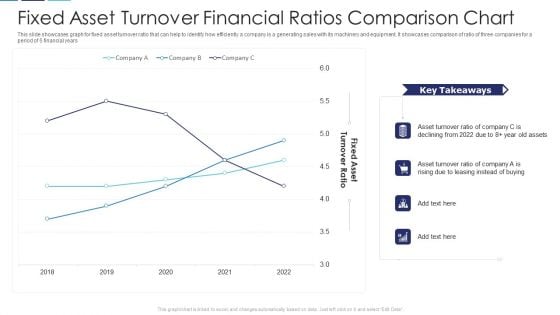
Fixed Asset Turnover Financial Ratios Comparison Chart Structure PDF
This slide showcases graph for fixed asset turnover ratio that can help to identify how efficiently a company is a generating sales with its machinery and equipment. It showcases comparison of ratio of three companies for a period of 5 financial years Showcasing this set of slides titled fixed asset turnover financial ratios comparison chart structure pdf. The topics addressed in these templates are fixed asset turnover financial ratios comparison chart. All the content presented in this PPT design is completely editable. Download it and make adjustments in color, background, font etc. as per your unique business setting.
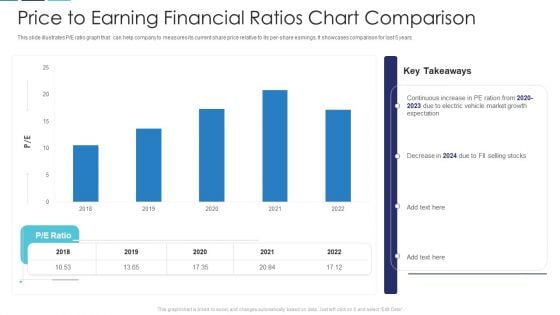
Price To Earning Financial Ratios Chart Comparison Slides PDF
This slide illustrates P or E ratio graph that can help company to measures its current share price relative to its per-share earnings. It showcases comparison for last 5 years Showcasing this set of slides titled price to earning financial ratios chart comparison slides pdf. The topics addressed in these templates are price to earning financial ratios chart comparison. All the content presented in this PPT design is completely editable. Download it and make adjustments in color, background, font etc. as per your unique business setting.
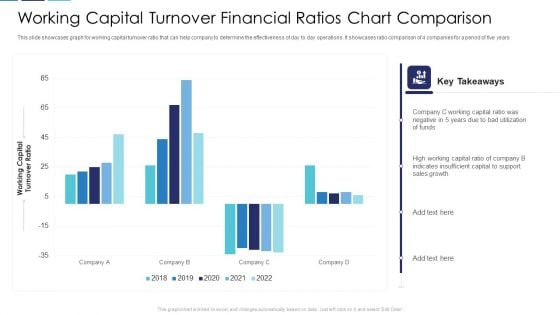
Working Capital Turnover Financial Ratios Chart Comparison Clipart PDF
This slide showcases graph for working capital turnover ratio that can help company to determine the effectiveness of day to day operations. It showcases ratio comparison of 4 companies for a period of five years Pitch your topic with ease and precision using this working capital turnover financial ratios chart comparison clipart pdf. This layout presents information on working capital turnover financial ratios chart comparison. It is also available for immediate download and adjustment. So, changes can be made in the color, design, graphics or any other component to create a unique layout.
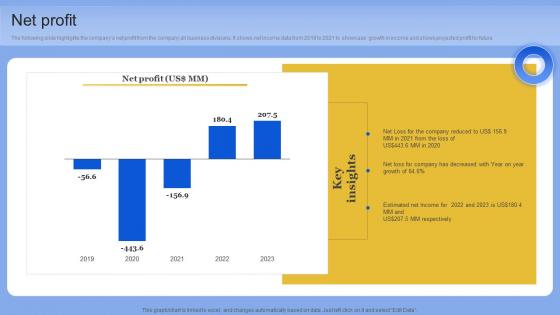
Net Profit Data Analytics Company Outline Diagrams PDF
The following slide highlights the companys net profit from the company all business divisions. It shows net income data from 2019 to 2021 to showcase growth in income and shows projected profit for future. Retrieve professionally designed Net Profit Data Analytics Company Outline Diagrams PDF to effectively convey your message and captivate your listeners. Save time by selecting pre-made slideshows that are appropriate for various topics, from business to educational purposes. These themes come in many different styles, from creative to corporate, and all of them are easily adjustable and can be edited quickly. Access them as PowerPoint templates or as Google Slides themes. You do not have to go on a hunt for the perfect presentation because Slidegeeks got you covered from everywhere. The following slide highlights the companys net profit from the company all business divisions. It shows net income data from 2019 to 2021 to showcase growth in income and shows projected profit for future
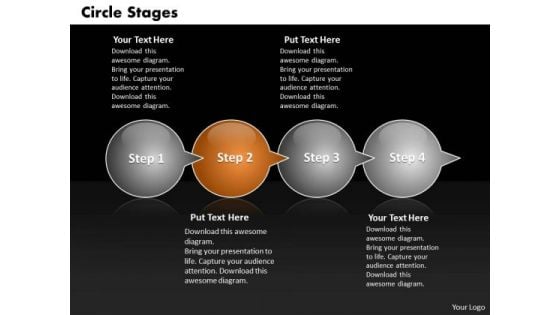
Ppt Half Circle PowerPoint 2010 Stage Through Bubbles 4 Steps Templates
PPT half circle powerpoint 2010 stage through bubbles 4 steps Templates-Use this Business based PowerPoint Diagram to represent the Business issues Graphically. It indicates arrange, block out, blueprint, cast, delineate, design, devise, draft, graph , lay out, outline, plot, project, shape, sketch etc.-PPT half circle powerpoint 2010 stage through bubbles 4 steps Templates-Add, Aqua, Arrows, Badges, Bar, Blend, Blue, Bright, Bubbles, Buttons, Caution, Circle, Drop, Elements, Glossy, Glowing, Graphic, Heart, Help, Icons, Idea, Illustration, Navigation, Oblong, Plus, Round, Service, Shadow, Shiny, Sign, Speech, Squares Display your faith in your team with our Ppt Half Circle PowerPoint 2010 Stage Through Bubbles 4 Steps Templates. Demonstrate your strong belief in them.

 Home
Home