Graph Icon
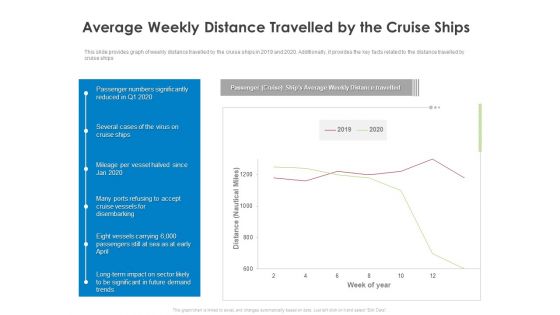
COVID 19 Risk Analysis Mitigation Policies Ocean Liner Sector Average Weekly Distance Travelled By The Cruise Ships Diagrams PDF
This slide provides graph of weekly distance travelled by the cruise ships in 2019 and 2020. Additionally, it provides the key facts related to the distance travelled by cruise ships. Deliver an awe inspiring pitch with this creative covid 19 risk analysis mitigation policies ocean liner sector average weekly distance travelled by the cruise ships diagrams pdf bundle. Topics like average weekly distance travelled by the cruise ships can be discussed with this completely editable template. It is available for immediate download depending on the needs and requirements of the user.
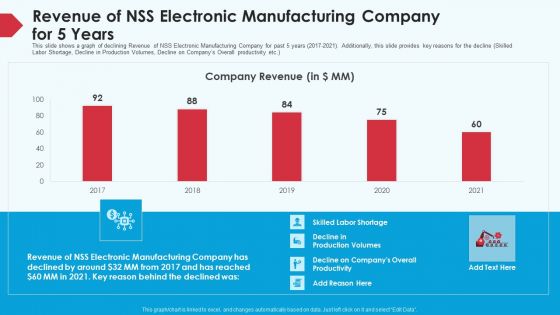
Skill Shortage In A Production Firm Case Study Solution Revenue Of NSS Electronic Manufacturing Company For 5 Years Diagrams PDF
This slide shows a graph of declining Revenue of NSS Electronic Manufacturing Company for past 5 years 2017-2021. Additionally, this slide provides key reasons for the decline Skilled Labor Shortage, Decline in Production Volumes, Decline on Companys Overall productivity etc. Deliver an awe inspiring pitch with this creative skill shortage in a production firm case study solution revenue of NSS electronic manufacturing company for 5 years diagrams pdf bundle. Topics like revenue, manufacturing, companys overall productivity, 2017 to 2021 can be discussed with this completely editable template. It is available for immediate download depending on the needs and requirements of the user.
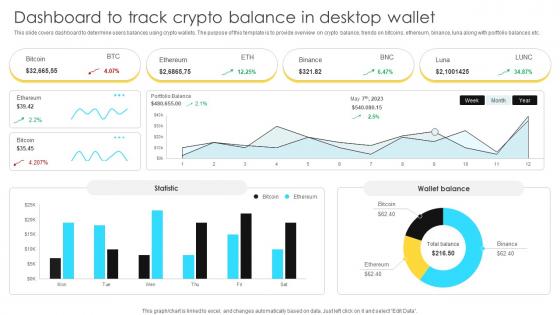
Mastering Blockchain Wallets Dashboard To Track Crypto Balance In Desktop Wallet BCT SS V
This slide covers dashboard to determine users balances using crypto wallets. The purpose of this template is to provide overview on crypto balance, trends on bitcoins, ethereum, binance, luna along with portfolio balances etc. This Mastering Blockchain Wallets Dashboard To Track Crypto Balance In Desktop Wallet BCT SS V is perfect for any presentation, be it in front of clients or colleagues. It is a versatile and stylish solution for organizing your meetings. The Mastering Blockchain Wallets Dashboard To Track Crypto Balance In Desktop Wallet BCT SS V features a modern design for your presentation meetings. The adjustable and customizable slides provide unlimited possibilities for acing up your presentation. Slidegeeks has done all the homework before launching the product for you. So, do not wait, grab the presentation templates today This slide covers dashboard to determine users balances using crypto wallets. The purpose of this template is to provide overview on crypto balance, trends on bitcoins, ethereum, binance, luna along with portfolio balances etc.
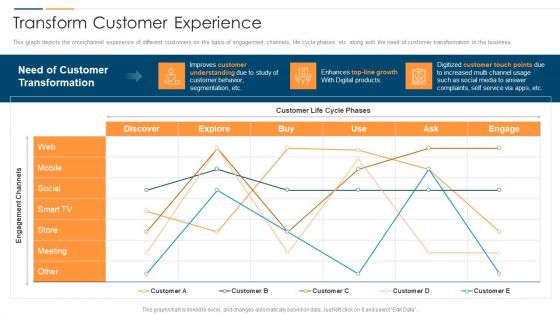
Revolution In Online Business Transform Customer Experience Ppt PowerPoint Presentation Gallery Microsoft PDF
This graph depicts the omnichannel experience of different customer on the basis of engagement channels, life cycle phases, etc. along with the need of customer transformation in the business. Deliver an awe inspiring pitch with this creative Revolution In Online Business Transform Customer Experience Ppt PowerPoint Presentation Gallery Microsoft PDF bundle. Topics like Engagement Channels Customer, Need Customer Transformation, Growth Digital Products can be discussed with this completely editable template. It is available for immediate download depending on the needs and requirements of the user.
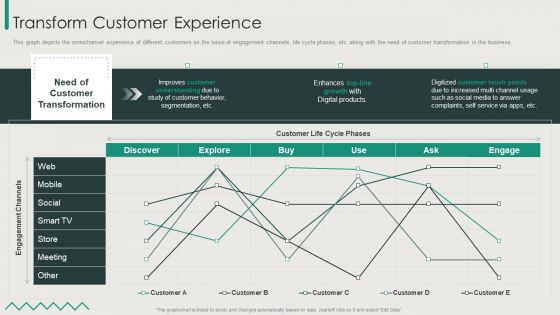
Organization Transition Transform Customer Experience Ppt PowerPoint Presentation File Pictures PDF
This graph depicts the omnichannel experience of different customers on the basis of engagement channels, life cycle phases, etc. along with the need of customer transformation in the business. Deliver and pitch your topic in the best possible manner with this Organization Transition Transform Customer Experience Ppt PowerPoint Presentation File Pictures PDF. Use them to share invaluable insights on Improves Customer, Customer Life, Digital Products and impress your audience. This template can be altered and modified as per your expectations. So, grab it now.
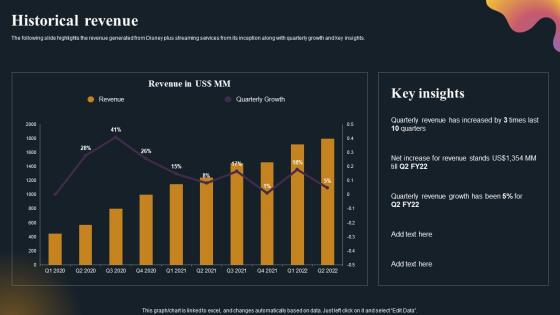
Historical Revenue OTT Platform Company Outline Diagrams Pdf
The following slide highlights the revenue generated from Disney plus streaming services from its inception along with quarterly growth and key insights. If you are looking for a format to display your unique thoughts, then the professionally designed Historical Revenue OTT Platform Company Outline Diagrams Pdf is the one for you. You can use it as a Google Slides template or a PowerPoint template. Incorporate impressive visuals, symbols, images, and other charts. Modify or reorganize the text boxes as you desire. Experiment with shade schemes and font pairings. Alter, share or cooperate with other people on your work. Download Historical Revenue OTT Platform Company Outline Diagrams Pdf and find out how to give a successful presentation. Present a perfect display to your team and make your presentation unforgettable. The following slide highlights the revenue generated from Disney plus streaming services from its inception along with quarterly growth and key insights.
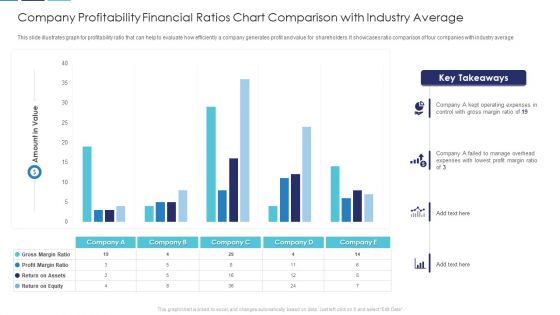
Company Profitability Financial Ratios Chart Comparison With Industry Average Download PDF
This slide illustrates graph for profitability ratio that can help to evaluate how efficiently a company generates profit and value for shareholders. It showcases ratio comparison of four companies with industry average Showcasing this set of slides titled company profitability financial ratios chart comparison with industry average download pdf. The topics addressed in these templates are company profitability financial ratios chart comparison with industry average. All the content presented in this PPT design is completely editable. Download it and make adjustments in color, background, font etc. as per your unique business setting.
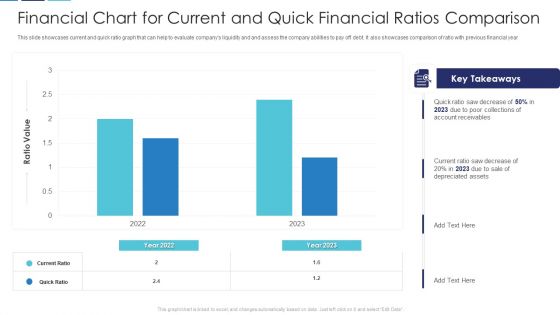
Financial Chart For Current And Quick Financial Ratios Comparison Brochure PDF
This slide showcases current and quick ratio graph that can help to evaluate companys liquidity and and assess the company abilities to pay off debt. It also showcases comparison of ratio with previous financial year Pitch your topic with ease and precision using this financial chart for current and quick financial ratios comparison brochure pdf. This layout presents information on financial chart for current and quick financial ratios comparison. It is also available for immediate download and adjustment. So, changes can be made in the color, design, graphics or any other component to create a unique layout.
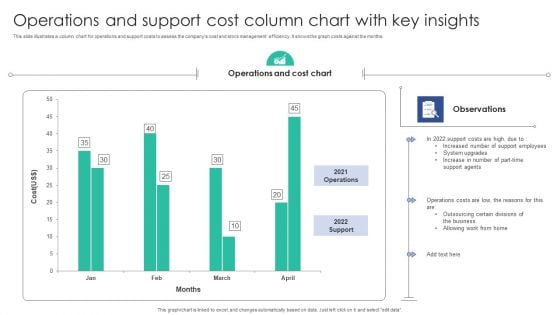
Operations And Support Cost Column Chart With Key Insights Background PDF
This slide illustrates a column chart for operations and support costs to assess the companys cost and stock management efficiency. It shows the graph costs against the months.Showcasing this set of slides titled Operations And Support Cost Column Chart With Key Insights Background PDF. The topics addressed in these templates are Operations Cost, Support Agents, Support Employees. All the content presented in this PPT design is completely editable. Download it and make adjustments in color, background, font etc. as per your unique business setting.
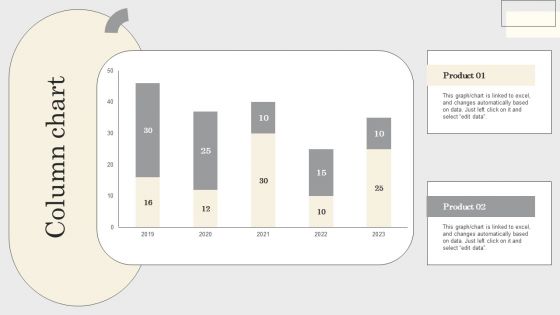
Steps To Conduct Competitor Analysis Column Chart Ppt Model Gridlines PDF
This graph or chart is linked to excel, and changes automatically based on data. Just left click on it and select edit data. If your project calls for a presentation, then Slidegeeks is your go-to partner because we have professionally designed, easy-to-edit templates that are perfect for any presentation. After downloading, you can easily edit Steps To Conduct Competitor Analysis Column Chart Ppt Model Gridlines PDF and make the changes accordingly. You can rearrange slides or fill them with different images. Check out all the handy templates
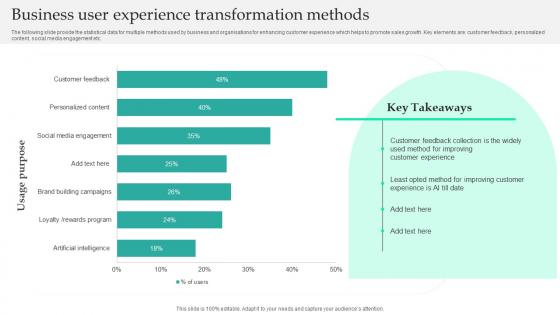
Business User Experience Transformation Methods Diagrams Pdf
The following slide provide the statistical data for multiple methods used by business and organisations for enhancing customer experience which helps to promote sales growth. Key elements are customer feedback, personalized content, social media engagement etc. Showcasing this set of slides titled Business User Experience Transformation Methods Diagrams Pdf. The topics addressed in these templates are Business User Experience, Transformation Methods. All the content presented in this PPT design is completely editable. Download it and make adjustments in color, background, font etc. as per your unique business setting. The following slide provide the statistical data for multiple methods used by business and organisations for enhancing customer experience which helps to promote sales growth. Key elements are customer feedback, personalized content, social media engagement etc.
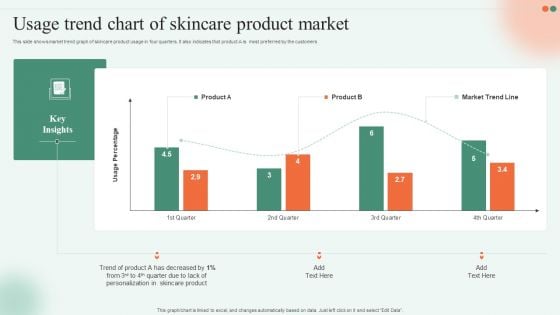
Usage Trend Chart Of Skincare Product Market Ppt Slides Graphics Download PDF
This slide shows market trend graph of skincare product usage in four quarters. It also indicates that product A is most preferred by the customers. Pitch your topic with ease and precision using this Usage Trend Chart Of Skincare Product Market Ppt Slides Graphics Download PDF. This layout presents information on Trend Product, Skincare Product, Quarter Due. It is also available for immediate download and adjustment. So, changes can be made in the color, design, graphics or any other component to create a unique layout.
E Mail Advertising User Business Data Diagrams Pdf
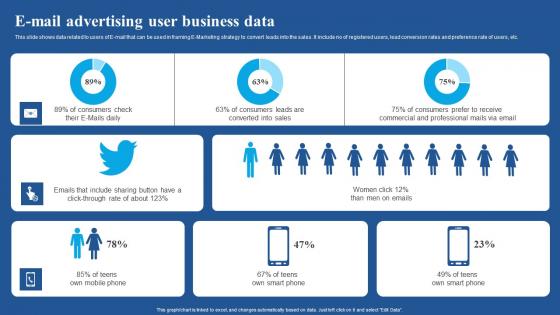
This slide shows data related to users of E-mail that can be used in framing E-Marketing strategy to convert leads into the sales. It include no of registered users, lead conversion rates and preference rate of users, etc.Showcasing this set of slides titled E Mail Advertising User Business Data Diagrams Pdf The topics addressed in these templates are E Mail Advertising, User Business Data All the content presented in this PPT design is completely editable. Download it and make adjustments in color, background, font etc. as per your unique business setting. This slide shows data related to users of E mail that can be used in framing E Marketing strategy to convert leads into the sales. It include no of registered users, lead conversion rates and preference rate of users, etc.
Impact Of Television Commercial On Ecommerce Business Diagrams Pdf
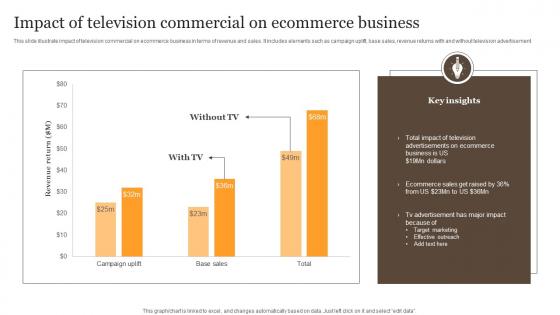
This slide illustrate impact of television commercial on ecommerce business in terms of revenue and sales. It includes elements such as campaign uplift, base sales, revenue returns with and without television advertisement Pitch your topic with ease and precision using this Impact Of Television Commercial On Ecommerce Business Diagrams Pdf. This layout presents information on Insights, Ecommerce, Business. It is also available for immediate download and adjustment. So, changes can be made in the color, design, graphics or any other component to create a unique layout. This slide illustrate impact of television commercial on ecommerce business in terms of revenue and sales. It includes elements such as campaign uplift, base sales, revenue returns with and without television advertisement

Cost Breakdown For Executing Effective Advertising Plan Diagrams Pdf
This slide graphically provides information about the promotional plan budget allocation that outline money business intends to spend on marketing related activities. It includes online marketing, direct marketing, personal selling, etc. Pitch your topic with ease and precision using this Cost Breakdown For Executing Effective Advertising Plan Diagrams Pdf. This layout presents information on Online Marketing, Budget Allocation. It is also available for immediate download and adjustment. So, changes can be made in the color, design, graphics or any other component to create a unique layout. This slide graphically provides information about the promotional plan budget allocation that outline money business intends to spend on marketing related activities. It includes online marketing, direct marketing, personal selling, etc.
Statistical Data For Agile Advertising Technique Diagrams Pdf
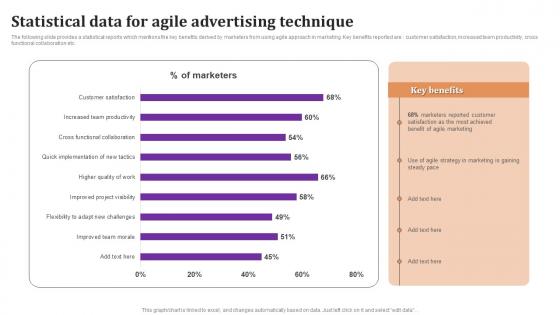
The following slide provides a statistical reports which mentions the key benefits derived by marketers from using agile approach in marketing. Key benefits reported are customer satisfaction, increased team productivity, cross functional collaboration etc. Pitch your topic with ease and precision using this Statistical Data For Agile Advertising Technique Diagrams Pdf This layout presents information on Statistical Data, Agile Advertising, Technique It is also available for immediate download and adjustment. So, changes can be made in the color, design, graphics or any other component to create a unique layout. The following slide provides a statistical reports which mentions the key benefits derived by marketers from using agile approach in marketing. Key benefits reported are customer satisfaction, increased team productivity, cross functional collaboration etc.
Examining Business Ability Pay Short Assessing Corporate Financial Techniques Diagrams Pdf
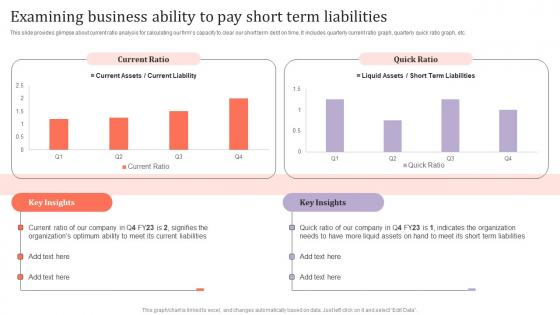
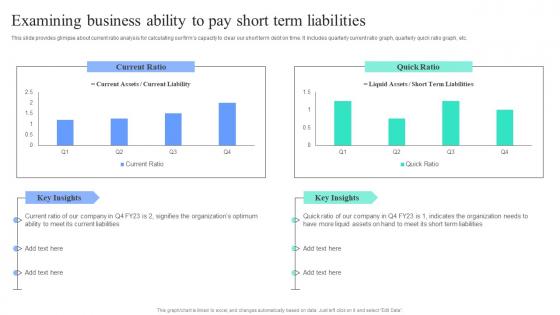
This slide provides glimpse about current ratio analysis for calculating our firms capacity to clear our short term debt on time. It includes quarterly current ratio graph, quarterly quick ratio graph, etc. This Examining Business Ability Pay Short Assessing Corporate Financial Techniques Diagrams Pdf is perfect for any presentation, be it in front of clients or colleagues. It is a versatile and stylish solution for organizing your meetings. The Examining Business Ability Pay Short Assessing Corporate Financial Techniques Diagrams Pdf features a modern design for your presentation meetings. The adjustable and customizable slides provide unlimited possibilities for acing up your presentation. Slidegeeks has done all the homework before launching the product for you. So, do not wait, grab the presentation templates today This slide provides glimpse about current ratio analysis for calculating our firms capacity to clear our short term debt on time. It includes quarterly current ratio graph, quarterly quick ratio graph, etc.
Strategic Financial Planning And Administration Examining Business Ability Pay Short Term Diagrams PDF
This slide provides glimpse about current ratio analysis for calculating our firms capacity to clear our short term debt on time. It includes quarterly current ratio graph, quarterly quick ratio graph, etc. Welcome to our selection of the Strategic Financial Planning And Administration Examining Business Ability Pay Short Term Diagrams PDF. These are designed to help you showcase your creativity and bring your sphere to life. Planning and Innovation are essential for any business that is just starting out. This collection contains the designs that you need for your everyday presentations. All of our PowerPoints are 100 percent editable, so you can customize them to suit your needs. This multi-purpose template can be used in various situations. Grab these presentation templates today This slide provides glimpse about current ratio analysis for calculating our firms capacity to clear our short term debt on time. It includes quarterly current ratio graph, quarterly quick ratio graph, etc.
New Product Development Process Optimization Costs Associated With Product Pictures PDF
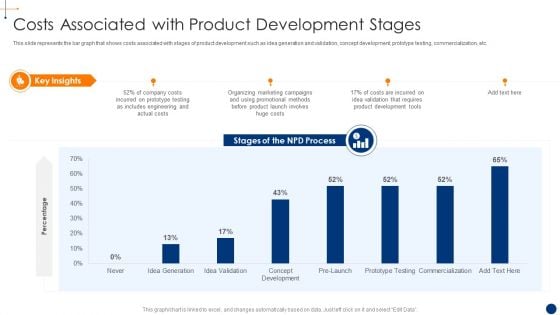
This slide represents the bar graph that shows costs associated with stages of product development such as idea generation and validation, concept development, prototype testing, commercialization, etc. Deliver and pitch your topic in the best possible manner with this new product development process optimization automating sales related activities diagrams pdf . Use them to share invaluable insights on automating sales related activities to accelerate product delivery and impress your audience. This template can be altered and modified as per your expectations. So, grab it now.
Customer Relationship Management Dashboard CRM Application Dashboard Month Microsoft PDF
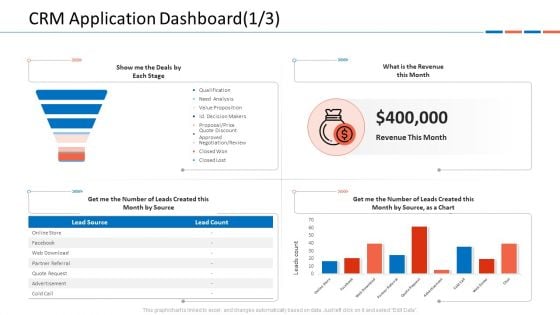
This graph or chart is linked to excel, and changes automatically based on data. Just left click on it and select Edit Data.Deliver an awe-inspiring pitch with this creative customer relationship management dashboard crm application dashboard month microsoft pdf bundle. Topics like show me the deals by each stage, what is the revenue this month, get me the number of leads created this month by source as a chart can be discussed with this completely editable template. It is available for immediate download depending on the needs and requirements of the user.

Talent Acquisition And Recruitment Methods Used By Hiring Department Ppt PowerPoint Presentation Layouts Templates PDF
This graph or chart is linked to excel, and changes automatically based on data. Just left click on it and select Edit Data. Showcasing this set of slides titled talent acquisition and recruitment methods used by hiring department ppt powerpoint presentation layouts templates pdf. The topics addressed in these templates are other methods, paid software, job fairs, employee referrals, jobs boards, social networks. All the content presented in this PPT design is completely editable. Download it and make adjustments in color, background, font etc. as per your unique business setting.
Key Issues Faced During Mergers And Acquisition Integration Ppt PowerPoint Presentation Summary Graphics PDF
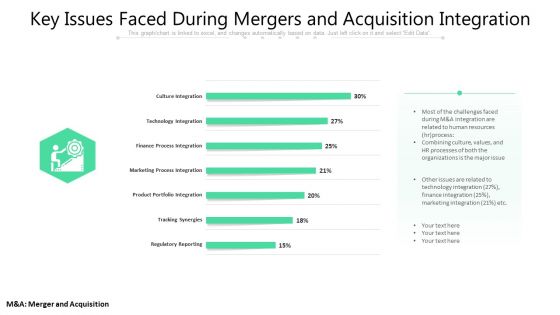
This graph or chart is linked to excel, and changes automatically based on data. Just left click on it and select Edit Data. Showcasing this set of slides titled key issues faced during mergers and acquisition integration ppt powerpoint presentation summary graphics pdf. The topics addressed in these templates are culture integration, technology integration, finance process integration, marketing process integration, product portfolio integration, tracking synergies, regulatory reporting. All the content presented in this PPT design is completely editable. Download it and make adjustments in color, background, font etc. as per your unique business setting.
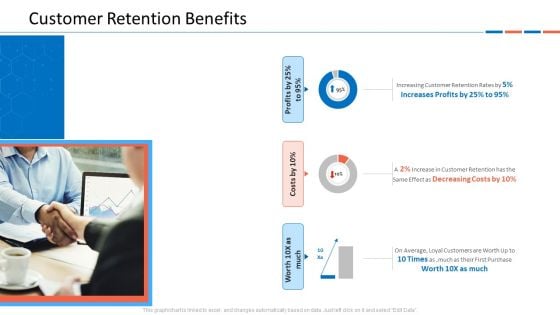
Customer Relationship Management Dashboard Customer Retention Benefits Inspiration PDF
This graph or chart is linked to excel, and changes automatically based on data. Just left click on it and select Edit Data.Deliver an awe inspiring pitch with this creative customer relationship management dashboard customer retention benefits inspiration pdf bundle. Topics like increasing customer retention rates, on average, loyal customers are worth up to 10 times as ,much as their first purchase, profits by 25percent to 95percent can be discussed with this completely editable template. It is available for immediate download depending on the needs and requirements of the user.
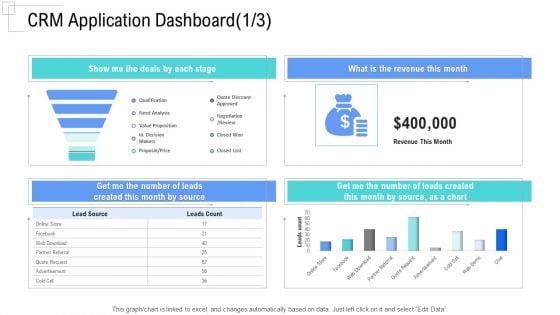
Managing Customer Experience CRM Application Dashboard Month Mockup PDF
This graph or chart is linked to excel, and changes automatically based on data. Just left click on it and select Edit Data.Deliver an awe-inspiring pitch with this creative managing customer experience crm application dashboard month mockup pdf bundle. Topics like show me the deals by each stage, what is the revenue this month, get me the number of leads created this month by source can be discussed with this completely editable template. It is available for immediate download depending on the needs and requirements of the user.

Managing Customer Experience CRM Data Analysis Sales Pictures PDF
This graph or chart is linked to excel, and changes automatically based on data. Just left click on it and select Edit Data.Deliver and pitch your topic in the best possible manner with this managing customer experience crm data analysis sales pictures pdf. Use them to share invaluable insights on entities by rep, completed activities l, biz notes this month, phone calls last 3 months, activity last 3 months and impress your audience. This template can be altered and modified as per your expectations. So, grab it now.
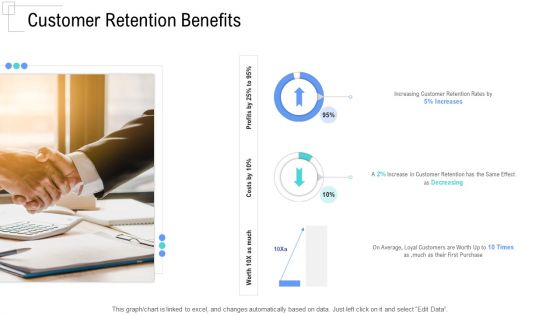
Managing Customer Experience Customer Retention Benefits Template PDF
This graph or chart is linked to excel, and changes automatically based on data. Just left click on it and select Edit Data.Deliver and pitch your topic in the best possible manner with this managing customer experience customer retention benefits template pdf. Use them to share invaluable insights on increasing customer retention rates by, average, loyal customers are worth up to 10 times as much as their first purchase, worth 10x as much and impress your audience. This template can be altered and modified as per your expectations. So, grab it now.
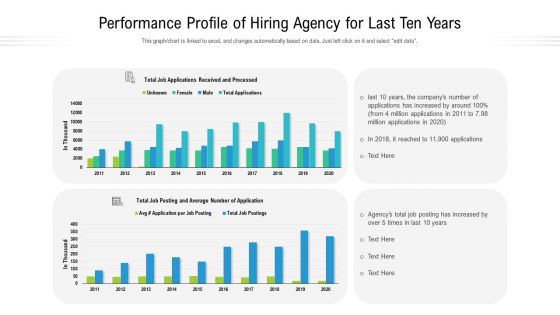
Performance Profile Of Hiring Agency For Last Ten Years Ppt Show Styles PDF
This graph to chart is linked to excel, and changes automatically based on data. Just left click on it and select edit data. Showcasing this set of slides titled performance profile of hiring agency for last ten years ppt show styles pdf. The topics addressed in these templates are performance profile of hiring agency for last ten years. All the content presented in this PPT design is completely editable. Download it and make adjustments in color, background, font etc. as per your unique business setting.
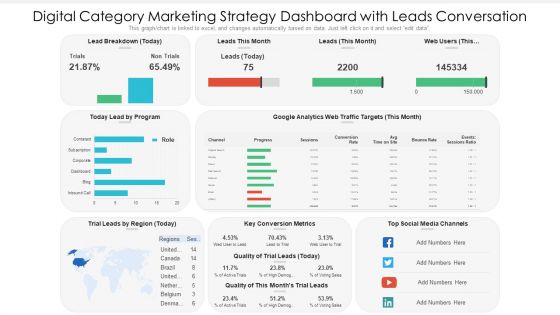
Digital Category Marketing Strategy Dashboard With Leads Conversation Ppt PowerPoint Presentation Slides Information PDF
This graph chart is linked to excel, and changes automatically based on data. Just left click on it and select edit data. Pitch your topic with ease and precision using this digital category marketing strategy dashboard with leads conversation ppt powerpoint presentation slides information pdf. This layout presents information on key conversion metrics, social media channels, lead by program. It is also available for immediate download and adjustment. So, changes can be made in the color, design, graphics or any other component to create a unique layout.
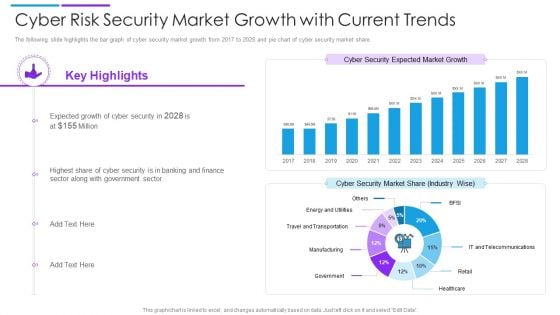
Cyber Risk Security Market Growth With Current Trends Summary PDF
The following slide highlights the bar graph of cyber security market growth from 2017 to 2028 and pie chart of cyber security market share. Showcasing this set of slides titled cyber risk security market growth with current trends summary pdf. The topics addressed in these templates are cyber security market share, cyber security expected market growth, banking and finance. All the content presented in this PPT design is completely editable. Download it and make adjustments in color, background, font etc. as per your unique business setting.
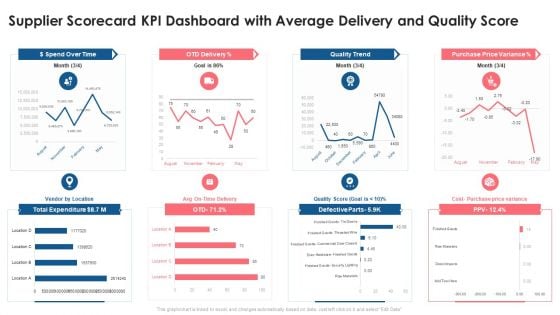
Supplier Scorecard Supplier Scorecard KPI Dashboard With Average Delivery And Quality Score Introduction PDF
This graph or chart is linked to excel, and changes automatically based on data. Just left click on it and select Edit Data. Deliver an awe inspiring pitch with this creative supplier scorecard supplier scorecard kpi dashboard with average delivery and quality score introduction pdf bundle. Topics like dollar spend over time, otd delivery, quality trend, purchase price variance, total expenditure can be discussed with this completely editable template. It is available for immediate download depending on the needs and requirements of the user.
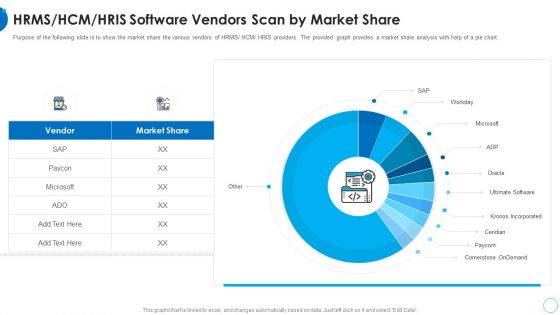
RMS HCM HRIS Software Vendors Scan By Market Share HR Change Management Tools Introduction PDF
Purpose of the following slide is to show the market share the various vendors of HRMS or HCM or HRIS providers. The provided graph provides a market share analysis with help of a pie chart. Deliver and pitch your topic in the best possible manner with this rms hcm hris software vendors scan by market share hr change management tools introduction pdf. Use them to share invaluable insights on hrms or hcm or hris software vendors scan by market share and impress your audience. This template can be altered and modified as per your expectations. So, grab it now.
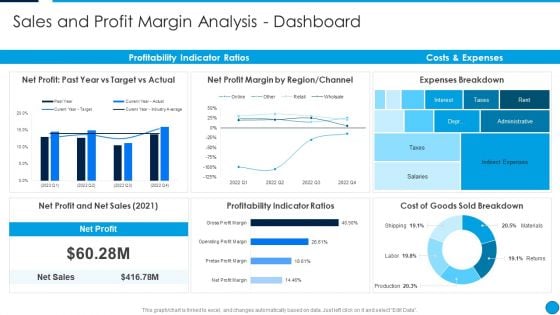
Summary Financial Sales And Profit Margin Analysis Dashboard Pictures PDF
This graph or chart is linked to excel, and changes automatically based on data. Just left click on it and select Edit Data. Deliver an awe inspiring pitch with this creative Summary Financial Sales And Profit Margin Analysis Dashboard Pictures PDF bundle. Topics like Net Profit, Past Year Vs Target Vs Actual, Net Profit Margin By Region, Channel, Expenses Breakdown, Costs And Expenses, Profitability Indicator Ratios can be discussed with this completely editable template. It is available for immediate download depending on the needs and requirements of the user.
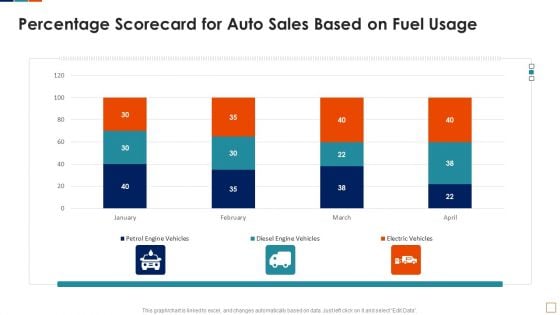
Automobile Sales Scorecard Percentage Scorecard For Auto Sales Based On Fuel Usage Graphics PDF
This graph or chart is linked to excel, and changes automatically based on data. Just left click on it and select Edit Data. Deliver and pitch your topic in the best possible manner with this Automobile Sales Scorecard Percentage Scorecard For Auto Sales Based On Fuel Usage Graphics PDF. Use them to share invaluable insights on Petrol Engine Vehicles, Diesel Engine Vehicles, Electric Vehicles Sales and impress your audience. This template can be altered and modified as per your expectations. So, grab it now.
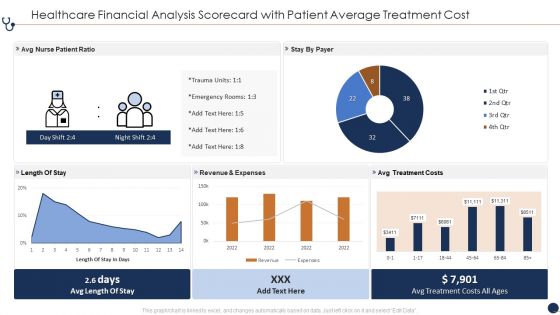
Healthcare Financial Analysis Scorecard With Patient Average Treatment Cost Ppt Infographic Template Slide Portrait PDF
This graph or chart is linked to excel, and changes automatically based on data. Just left click on it and select Edit Data. Deliver and pitch your topic in the best possible manner with this Healthcare Financial Analysis Scorecard With Patient Average Treatment Cost Ppt Infographic Template Slide Portrait PDF. Use them to share invaluable insights on Avg Nurse Patient, Revenue And Expenses, Avg Treatment Costs and impress your audience. This template can be altered and modified as per your expectations. So, grab it now.
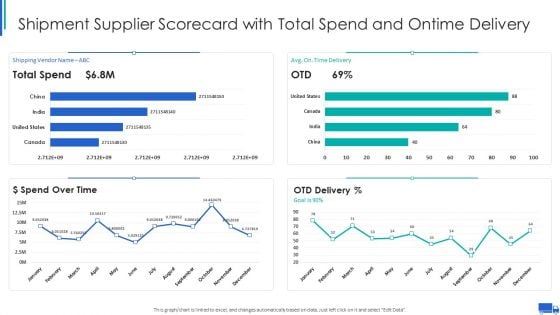
Shipment Supplier Scorecard With Total Spend And Ontime Delivery Ppt Slides Templates PDF
This graph or chart is linked to excel, and changes automatically based on data. Just left click on it and select Edit Data. Deliver and pitch your topic in the best possible manner with this Shipment Supplier Scorecard With Total Spend And Ontime Delivery Ppt Slides Templates PDF. Use them to share invaluable insights on Shipping Vendor Avg, Time Delivery Goal, Spend Over Time, OTD Delivery Percent and impress your audience. This template can be altered and modified as per your expectations. So, grab it now.
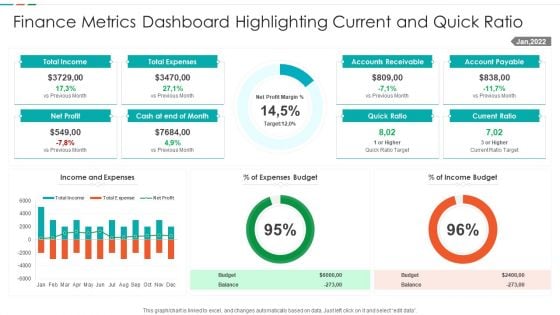
Finance Metrics Dashboard Highlighting Current And Quick Ratio Template PDF
This graph or chart is linked to excel, and changes automatically based on data. Just left click on it and select edit data. Showcasing this set of slides titled Finance Metrics Dashboard Highlighting Current And Quick Ratio Template PDF. The topics addressed in these templates are Total Income Budget, Total Expenses Balance, Net Profit Quick, Ratio Current Ratio. All the content presented in this PPT design is completely editable. Download it and make adjustments in color, background, font etc. as per your unique business setting.
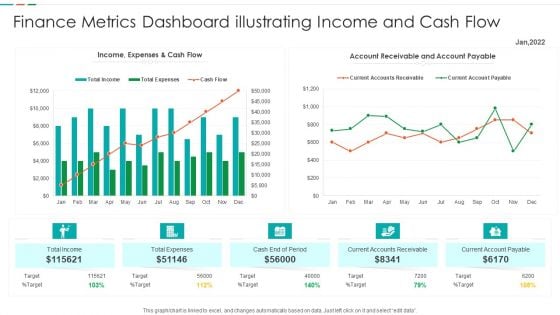
Finance Metrics Dashboard Illustrating Income And Cash Flow Template PDF
This graph or chart is linked to excel, and changes automatically based on data. Just left click on it and select edit data. Pitch your topic with ease and precision using this Finance Metrics Dashboard Illustrating Income And Cash Flow Template PDF. This layout presents information on Current Accounts Receivable, Current Account Payable, Cash End Period, Account Receivable Account. It is also available for immediate download and adjustment. So, changes can be made in the color, design, graphics or any other component to create a unique layout.
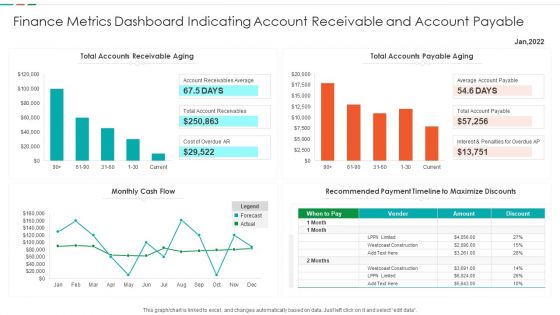
Finance Metrics Dashboard Indicating Account Receivable And Account Payable Demonstration PDF
This graph or chart is linked to excel, and changes automatically based on data. Just left click on it and select edit data. Showcasing this set of slides titled Finance Metrics Dashboard Indicating Account Receivable And Account Payable Demonstration PDF. The topics addressed in these templates are Total Accounts Receivable, Total Accounts Payable, Recommended Payment Timeline, Monthly Cash Flow. All the content presented in this PPT design is completely editable. Download it and make adjustments in color, background, font etc. as per your unique business setting.
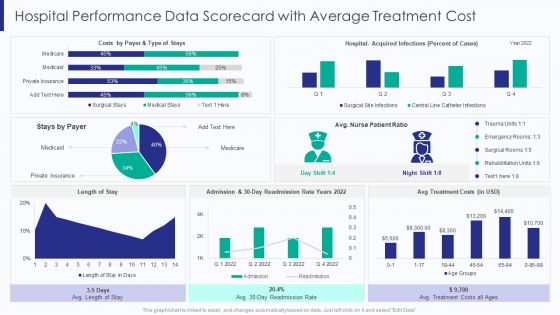
Healthcare Hospital Performance Data Scorecard With Average Treatment Cost Ppt Ideas Guide PDF
This graph or chart is linked to excel, and changes automatically based on data. Just left click on it and select Edit Data. Deliver and pitch your topic in the best possible manner with this Healthcare Hospital Performance Data Scorecard With Average Treatment Cost Ppt Ideas Guide PDF. Use them to share invaluable insights on Type Of Stays, Stays By Payer, Avg Treatment Costs, 30 Day Readmission and impress your audience. This template can be altered and modified as per your expectations. So, grab it now.
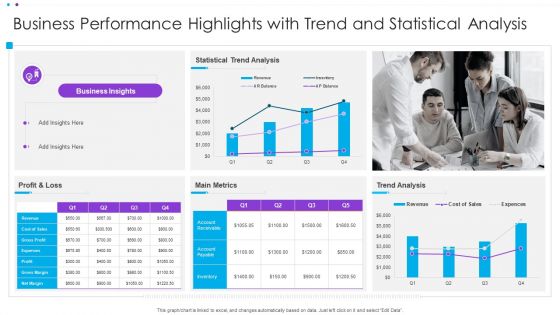
Business Performance Highlights With Trend And Statistical Analysis Ppt Infographic Template Display PDF
This graph or chart is linked to excel, and changes automatically based on data. Just left click on it and select Edit Data. Pitch your topic with ease and precision using this Business Performance Highlights With Trend And Statistical Analysis Ppt Infographic Template Display PDF. This layout presents information on Statistical Trend Analysis, Main Metrics, Profit And Loss. It is also available for immediate download and adjustment. So, changes can be made in the color, design, graphics or any other component to create a unique layout.
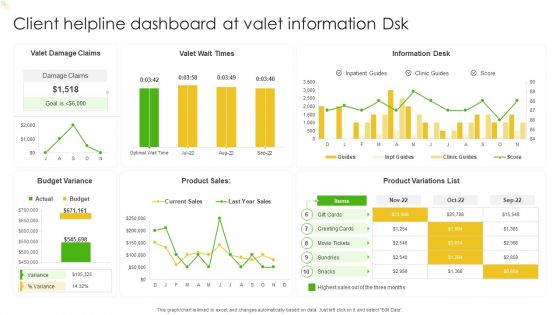
Client Helpline Dashboard At Valet Information Dsk Ppt Gallery Slide Portrait PDF
This graph or chart is linked to excel, and changes automatically based on data. Just left click on it and select Edit Data. Pitch your topic with ease and precision using this Client Helpline Dashboard At Valet Information Dsk Ppt Gallery Slide Portrait PDF. This layout presents information on Valet Damage Claims, Valet Wait Times, Information Desk. It is also available for immediate download and adjustment. So, changes can be made in the color, design, graphics or any other component to create a unique layout.
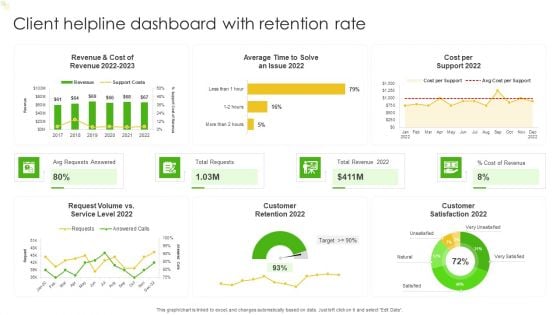
Client Helpline Dashboard With Retention Rate Ppt Gallery Ideas PDF
This graph or chart is linked to excel, and changes automatically based on data. Just left click on it and select Edit Data. Pitch your topic with ease and precision using this Client Helpline Dashboard With Retention Rate Ppt Gallery Ideas PDF. This layout presents information on Cost per Support 2022, Total Requests, Total Revenue 2022, Avg Requests Answered. It is also available for immediate download and adjustment. So, changes can be made in the color, design, graphics or any other component to create a unique layout.
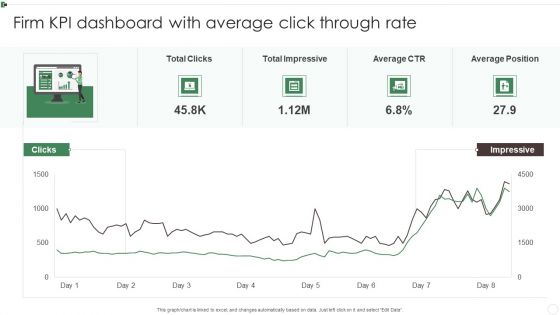
Firm KPI Dashboard With Average Click Through Rate Ppt Inspiration Sample PDF
This graph or chart is linked to excel, and changes automatically based on data. Just left click on it and select Edit Data. Pitch your topic with ease and precision using this Firm KPI Dashboard With Average Click Through Rate Ppt Inspiration Sample PDF. This layout presents information on Total Clicks, Total Impressive, Average CTR, Average Position. It is also available for immediate download and adjustment. So, changes can be made in the color, design, graphics or any other component to create a unique layout.

Firm KPI Dashboard With Schedule Performance Index Ppt Visual Aids PDF
This graph or chart is linked to excel, and changes automatically based on data. Just left click on it and select Edit Data. Pitch your topic with ease and precision using this Firm KPI Dashboard With Schedule Performance Index Ppt Visual Aids PDF. This layout presents information on Project Cost Performance, Project Planning Stage, Monitor And Control. It is also available for immediate download and adjustment. So, changes can be made in the color, design, graphics or any other component to create a unique layout.
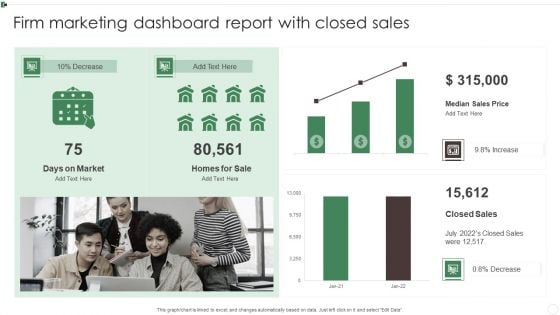
Firm Marketing Dashboard Report With Closed Sales Ppt Slides Graphics Example PDF
This graph or chart is linked to excel, and changes automatically based on data. Just left click on it and select Edit Data. Showcasing this set of slides titled Firm Marketing Dashboard Report With Closed Sales Ppt Slides Graphics Example PDF. The topics addressed in these templates are Days On Market, Homes For Sale, Median Sales Price, Closed Sales. All the content presented in this PPT design is completely editable. Download it and make adjustments in color, background, font etc. as per your unique business setting.
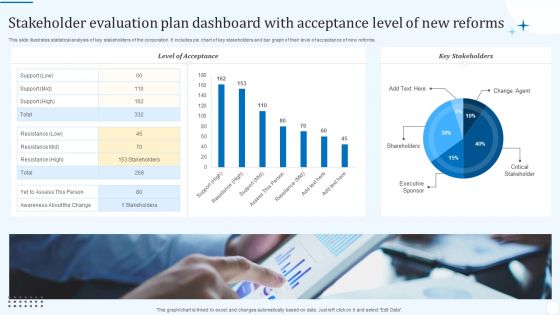
Stakeholder Evaluation Plan Dashboard With Acceptance Level Of New Reforms Background PDF
This slide illustrates statistical analysis of key stakeholders of the corporation. It includes pie chart of key stakeholders and bar graph of their level of acceptance of new reforms. Showcasing this set of slides titled Stakeholder Evaluation Plan Dashboard With Acceptance Level Of New Reforms Background PDF. The topics addressed in these templates are Level Acceptance, Key Stakeholders, Critical Stakeholder. All the content presented in this PPT design is completely editable. Download it and make adjustments in color, background, font etc. as per your unique business setting.
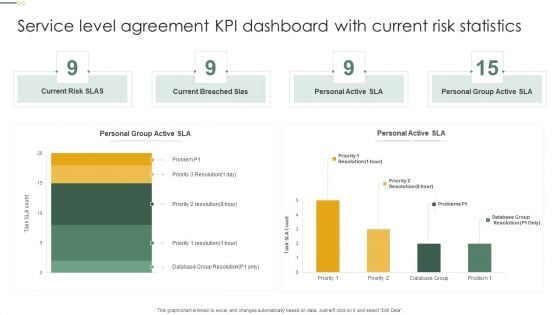
Service Level Agreement KPI Dashboard With Current Risk Statistics Topics PDF
This graph or chart is linked to excel, and changes automatically based on data. Just left click on it and select Edit Data. Pitch your topic with ease and precision using this Service Level Agreement KPI Dashboard With Current Risk Statistics Topics PDF. This layout presents information on Current Risk SLAS, Current Breached Slas, Personal Active SLA It is also available for immediate download and adjustment. So, changes can be made in the color, design, graphics or any other component to create a unique layout.
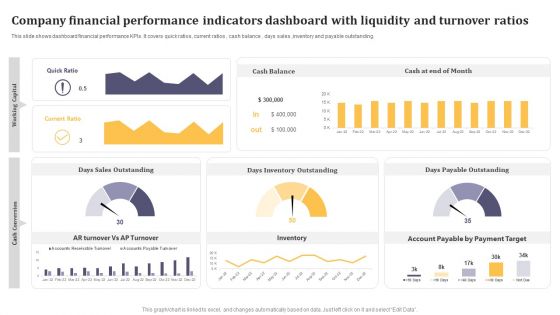
Company Financial Performance Indicators Dashboard With Liquidity And Turnover Ratios Formats PDF
This graph or chart is linked to excel, and changes automatically based on data. Just left click on it and select Edit Data. Pitch your topic with ease and precision using this Company Financial Performance Indicators Dashboard With Liquidity And Turnover Ratios Formats PDF. This layout presents information on Cash Balance, Days Inventory Outstanding, Days Payable Outstanding. It is also available for immediate download and adjustment. So, changes can be made in the color, design, graphics or any other component to create a unique layout.
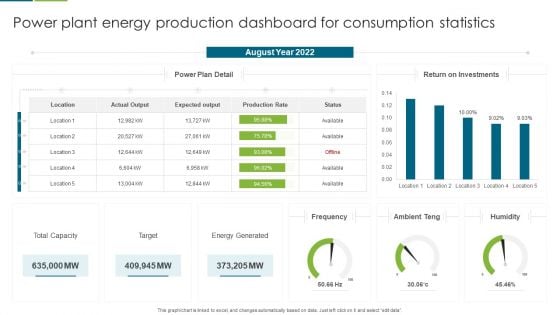
Power Plant Energy Production Dashboard For Consumption Statistics Download PDF
This graph or chart is linked to excel, and changes automatically based on data. Just left click on it and select edit data. Pitch your topic with ease and precision using this Multiple Country Energy Consumption Statistics Comparison Dashboard Formats PDF. This layout presents information on August Year 2022, Return on Investments, Power Plan Detail . It is also available for immediate download and adjustment. So, changes can be made in the color, design, graphics or any other component to create a unique layout.
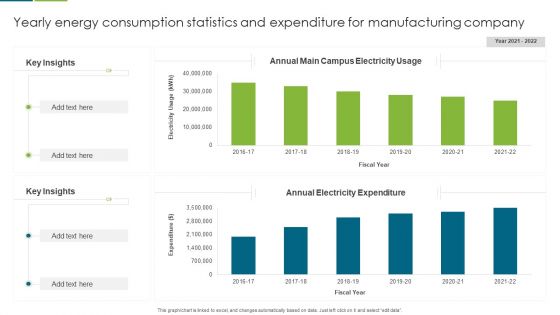
Yearly Energy Consumption Statistics And Expenditure For Manufacturing Company Guidelines PDF
This graph or chart is linked to excel, and changes automatically based on data. Just left click on it and select edit data. Pitch your topic with ease and precision using this Yearly Energy Consumption Statistics And Expenditure For Manufacturing Company Guidelines PDF. This layout presents information on Key Insights, Annual Electricity Expenditure, Annual Main Campus, Electricity Usage. It is also available for immediate download and adjustment. So, changes can be made in the color, design, graphics or any other component to create a unique layout.
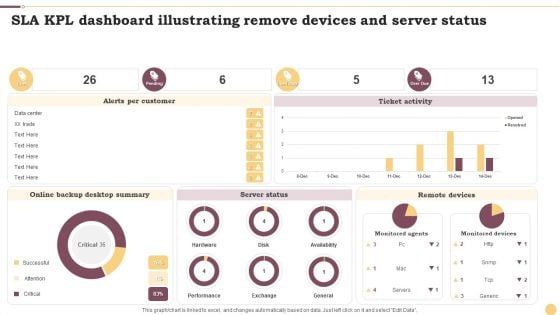
SLA KPL Dashboard Illustrating Remove Devices And Server Status Ppt Inspiration Layout Ideas PDF
This graph or chart is linked to excel, and changes automatically based on data. Just left click on it and select Edit Data. Showcasing this set of slides titled SLA KPL Dashboard Illustrating Remove Devices And Server Status Ppt Inspiration Layout Ideas PDF. The topics addressed in these templates are Alerts Per Customer, Ticket Activity, Server Status. All the content presented in this PPT design is completely editable. Download it and make adjustments in color, background, font etc. as per your unique business setting.
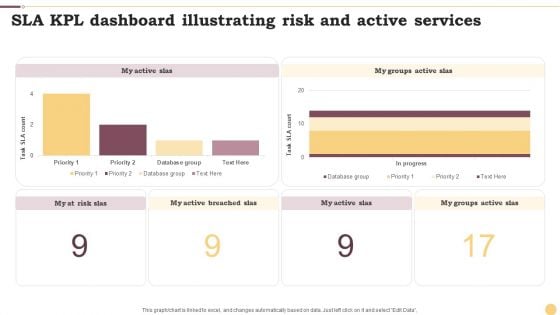
SLA KPL Dashboard Illustrating Risk And Active Services Ppt Portfolio Design Inspiration PDF
This graph or chart is linked to excel, and changes automatically based on data. Just left click on it and select Edit Data. Pitch your topic with ease and precision using this SLA KPL Dashboard Illustrating Risk And Active Services Ppt Portfolio Design Inspiration PDF. This layout presents information on My Active SLAs, Database Group, Priority. It is also available for immediate download and adjustment. So, changes can be made in the color, design, graphics or any other component to create a unique layout.
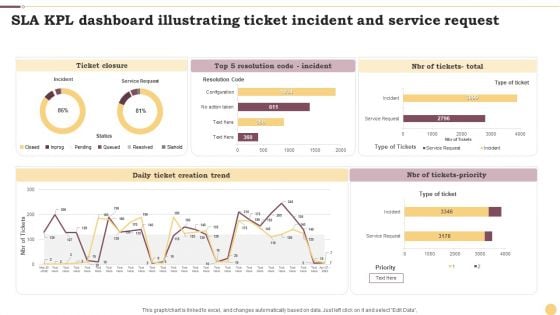
SLA KPL Dashboard Illustrating Ticket Incident And Service Request Ppt File Portrait PDF
This graph or chart is linked to excel, and changes automatically based on data. Just left click on it and select Edit Data. Showcasing this set of slides titled SLA KPL Dashboard Illustrating Ticket Incident And Service Request Ppt File Portrait PDF. The topics addressed in these templates are Ticket Closure, Daily Ticket, Creation Trend, NBR Tickets Priority. All the content presented in this PPT design is completely editable. Download it and make adjustments in color, background, font etc. as per your unique business setting.
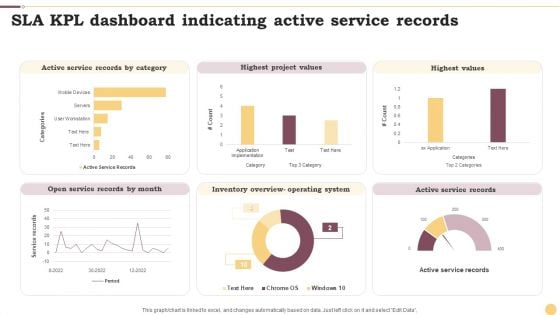
SLA KPL Dashboard Indicating Active Service Records Ppt Professional Graphics Example PDF
This graph or chart is linked to excel, and changes automatically based on data. Just left click on it and select Edit Data. Pitch your topic with ease and precision using this SLA KPL Dashboard Indicating Active Service Records Ppt Professional Graphics Example PDF. This layout presents information on Active Service Records, Highest Project Values, Highest Values. It is also available for immediate download and adjustment. So, changes can be made in the color, design, graphics or any other component to create a unique layout.
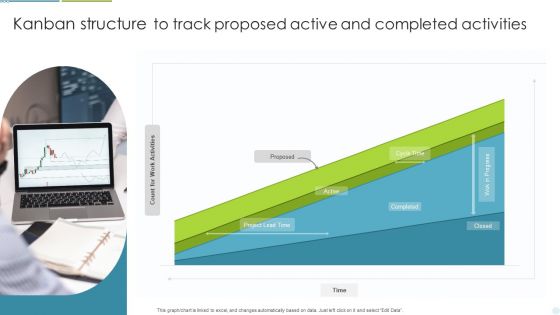
Kanban Structure To Track Proposed Active And Completed Activities Ppt Outline Slide Portrait PDF
This graph or chart is linked to excel, and changes automatically based on data. Just left click on it and select Edit Data. Pitch your topic with ease and precision using this Kanban Structure To Track Proposed Active And Completed Activities Ppt Outline Slide Portrait PDF. This layout presents information on Project Lead Time, Cycle Time, Completed. It is also available for immediate download and adjustment. So, changes can be made in the color, design, graphics or any other component to create a unique layout.
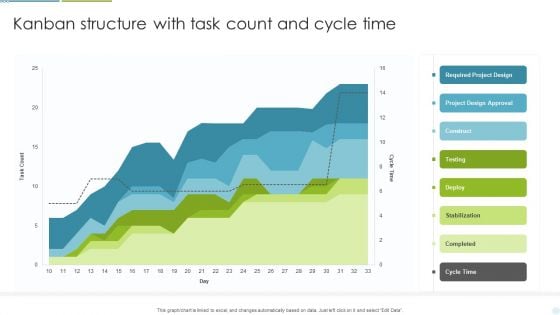
Kanban Structure With Task Count And Cycle Time Ppt Layouts Background Designs PDF
This graph or chart is linked to excel, and changes automatically based on data. Just left click on it and select Edit Data. Pitch your topic with ease and precision using this Kanban Structure With Task Count And Cycle Time Ppt Layouts Background Designs PDF. This layout presents information on Required Project Design, Project Design Approval, Construct. It is also available for immediate download and adjustment. So, changes can be made in the color, design, graphics or any other component to create a unique layout.

HR KPI Dashboard With Staff Payroll Details Ppt PowerPoint Presentation File Layout Ideas PDF
This slide represents the key performance indicator dashboard with salary details of employee working in an organisation. It includes turnover rate, pie chart of employment contract and status, bar graph based on employee gender. Showcasing this set of slides titled HR KPI Dashboard With Staff Payroll Details Ppt PowerPoint Presentation File Layout Ideas PDF. The topics addressed in these templates are Turnover Rate, Absenteeism Rate, Permanent Rate. All the content presented in this PPT design is completely editable. Download it and make adjustments in color, background, font etc. as per your unique business setting.
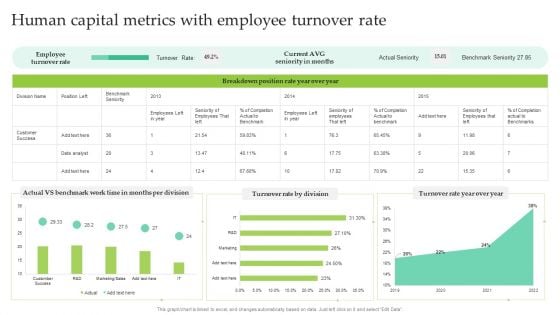
Human Capital Metrics With Employee Turnover Rate Ppt File Mockup PDF
This graph or chart is linked to excel, and changes automatically based on data. Just left click on it and select Edit Data. Showcasing this set of slides titled Human Capital Metrics With Employee Turnover Rate Ppt File Mockup PDF. The topics addressed in these templates are Employee Turnover Rate, Turnover Rate Division, Turnover Rate Year, Over Year. All the content presented in this PPT design is completely editable. Download it and make adjustments in color, background, font etc. as per your unique business setting.
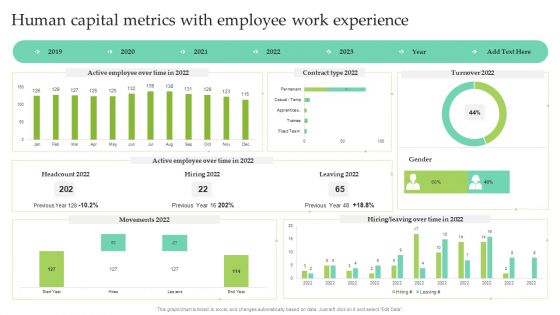
Human Capital Metrics With Employee Work Experience Ppt Show Images PDF
This graph or chart is linked to excel, and changes automatically based on data. Just left click on it and select Edit Data. Pitch your topic with ease and precision using this Human Capital Metrics With Employee Work Experience Ppt Show Images PDF. This layout presents information on Active Employee, Over Time, Contract Type 2022, Leaving 2022. It is also available for immediate download and adjustment. So, changes can be made in the color, design, graphics or any other component to create a unique layout.
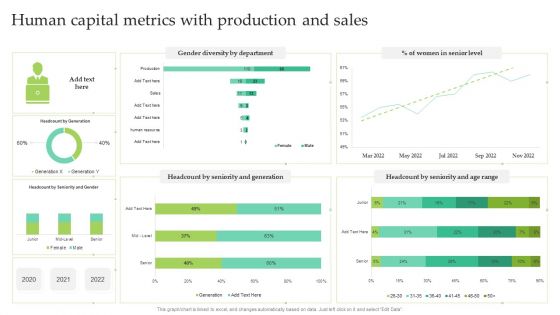
Human Capital Metrics With Production And Sales Ppt Infographic Template Summary PDF
This graph or chart is linked to excel, and changes automatically based on data. Just left click on it and select Edit Data. Showcasing this set of slides titled Human Capital Metrics With Production And Sales Ppt Infographic Template Summary PDF. The topics addressed in these templates are Women Senior Level, Gender Diversity Department, Seniority And Generation. All the content presented in this PPT design is completely editable. Download it and make adjustments in color, background, font etc. as per your unique business setting.

 Home
Home