Graph
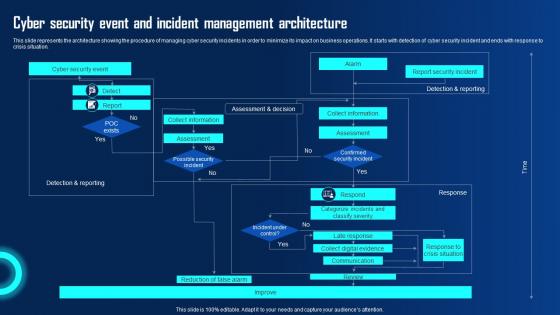
Cyber Security Event And Incident Management Ppt Powerpoint Presentation Diagram Graph Charts Pdf
This slide represents the architecture showing the procedure of managing cyber security incidents in order to minimize its impact on business operations. It starts with detection of cyber security incident and ends with response to crisis situation. Are you in need of a template that can accommodate all of your creative concepts This one is crafted professionally and can be altered to fit any style. Use it with Google Slides or PowerPoint. Include striking photographs, symbols, depictions, and other visuals. Fill, move around, or remove text boxes as desired. Test out color palettes and font mixtures. Edit and save your work, or work with colleagues. Download Cyber Security Event And Incident Management Ppt Powerpoint Presentation Diagram Graph Charts Pdf and observe how to make your presentation outstanding. Give an impeccable presentation to your group and make your presentation unforgettable. This slide represents the architecture showing the procedure of managing cyber security incidents in order to minimize its impact on business operations. It starts with detection of cyber security incident and ends with response to crisis situation.
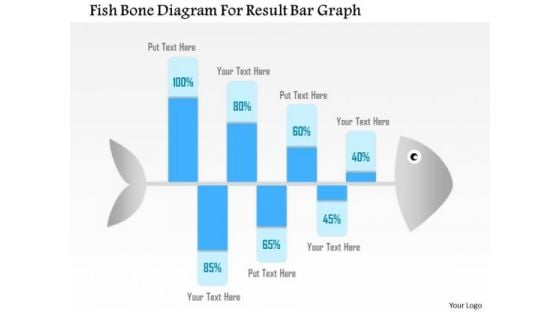
Business Diagram Fish Bone Diagram For Result Bar Graph Presentation Template
Graphic of fish bone has been used to design this Power Point template slide. This PPT slide contains the concept of problem analysis and root cause analysis. Use this PPT slide and display process of root cause analysis for any field. This PPT slide is very well designed for business and production related problem analysis.
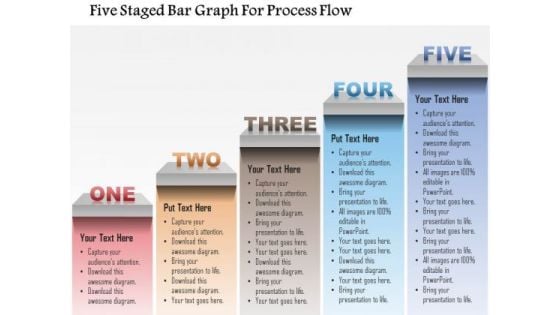
Busines Diagram Five Staged Bar Graph For Process Flow Presentation Template
This business diagram displays graphic of five staged business info graphics. This diagram is useful to display business growth steps. Add this image in your presentations to visually support your content and express your thoughts.

Business Diagram 3d Lock With Pie Graph For Result Representation PowerPoint Slide
This Power Point diagram has been crafted with pie chart in shape of lock. It contains diagram of lock pie chart to compare and present data in an effective manner. Use this diagram to build professional presentations for your viewers.
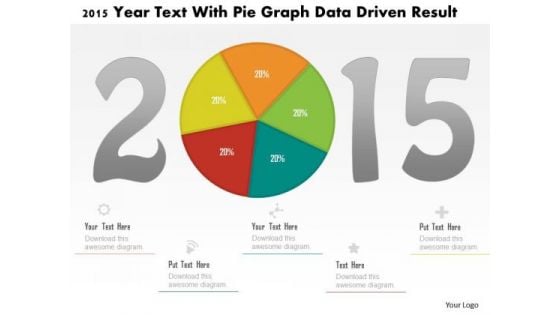
Business Diagram 2015 Year Text With Pie Graph Data Driven Result PowerPoint Slide
This business diagram displays 2015 year numbers with pie chart. This diagram is suitable to display business strategy for year 2015. Download this professional slide to present information in an attractive manner

Business Diagram Data Driven Bar Graph And Pie Chart For Analysis PowerPoint Slide
This PowerPoint template displays technology gadgets with various business charts. Use this diagram slide, in your presentations to make business reports for statistical analysis. You may use this diagram to impart professional appearance to your presentations.
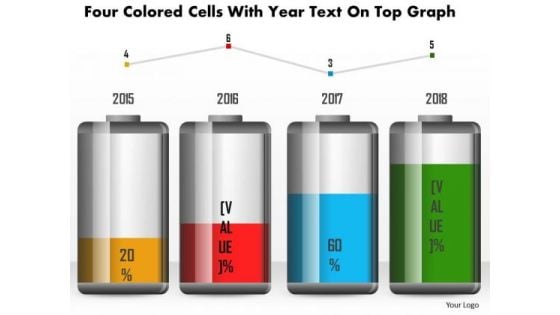
Business Diagram Four Colored Cells With Year Text On Top Graph PowerPoint Slide
This business diagram has been designed with battery cell graphic for business timeline. This slide can be used for business planning and management. Use this diagram for your business and success milestones related presentations.
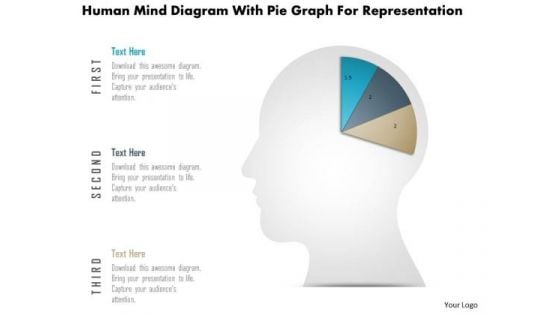
Business Diagram Human Mind Diagram With Pie Graph For Representation PowerPoint Slide
This diagram displays human face graphic divided into sections. This section can be used for data display. Use this diagram to build professional presentations for your viewers.
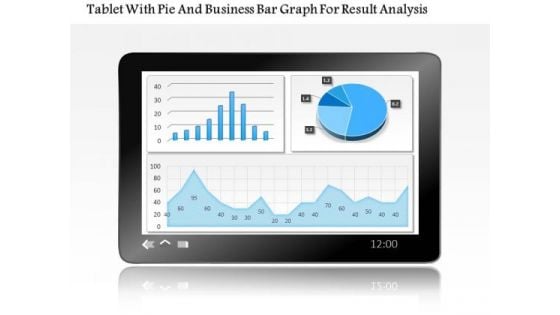
Business Diagram Tablet With Pie And Business Bar Graph For Result Analysis PowerPoint Slide
This PowerPoint template displays technology gadgets with various business charts. Use this diagram slide, in your presentations to make business reports for statistical analysis. You may use this diagram to impart professional appearance to your presentations.

Business Diagram Three Staged Pencil Diagram For Graph Formation PowerPoint Slide
This business diagram displays set of pencils. This Power Point template has been designed to compare and present business data. Download this diagram to represent stages of business growth.
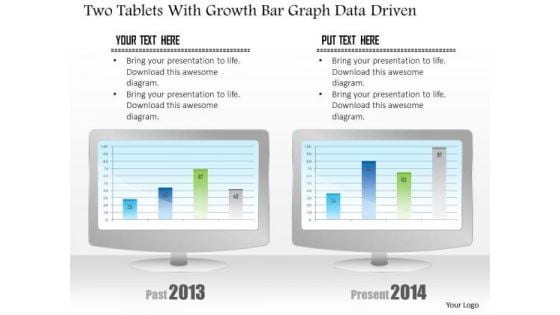
Business Diagram Two Tablets With Growth Bar Graph Data Driven PowerPoint Slide
This business diagram has been designed with comparative charts on tablets. This slide suitable for data representation. You can also use this slide to present business reports and information. Use this diagram to present your views in a wonderful manner.

Stock Photo Ecg Graph On Background For-mdical Use Image Graphics For PowerPoint Slide
This image has graphics of ecg graph. This contains conceptual image of heart beat. Use this image slide for medical and health related topics. Build an innovative presentations using this professional image slide.

Stock Photo Red Heart Ecg Graph On Red Background Image Graphics For PowerPoint Slide
This image has graphics of ecg graph. This contains conceptual image of heart beat. Use this image slide for medical and health related topics. Build an innovative presentations using this professional image slide.
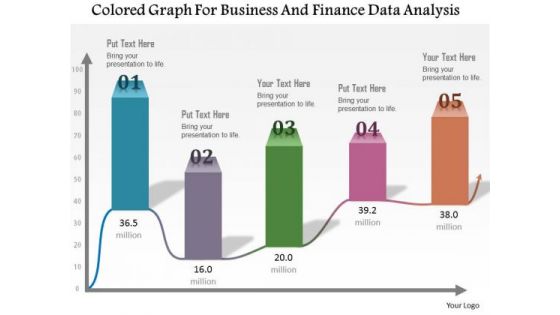
Business Diagram Colored Graph For Business And Finance Data Analysis Presentation Template
This Power Point template has been designed with graphic of colored bar graph. Use this slide to represent five steps of any business process. Use this diagram for your business presentations and get exclusive comments on your efforts.
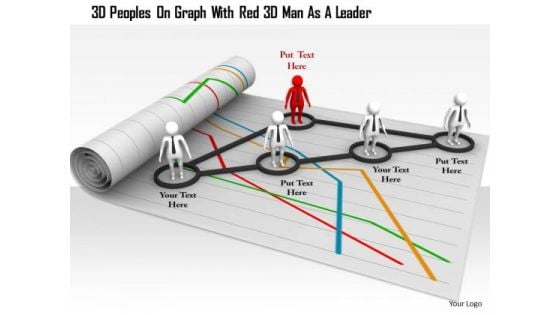
3d Peoples On Graph With Red 3d Man As A Leader
This image slide has been designed with graphic of 3d peoples and graph. In this slide red 3d man is acting as a leader. Display leadership with this exclusive diagram and build creative presentation for your viewers.
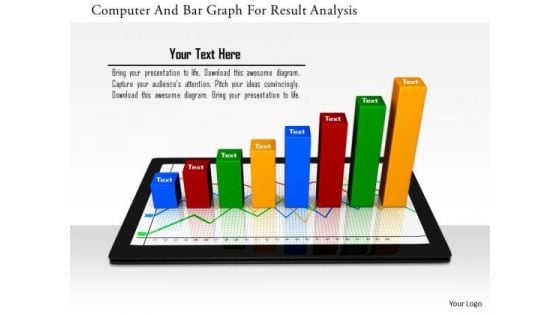
Stock Photo Computer And Bar Graph For Result Analysis PowerPoint Slide
This Power point template has been crafted with graphic of computer and bar graph. This PPT contains the concept of technology and result analysis. Use this PPT for your business and technology related presentations.
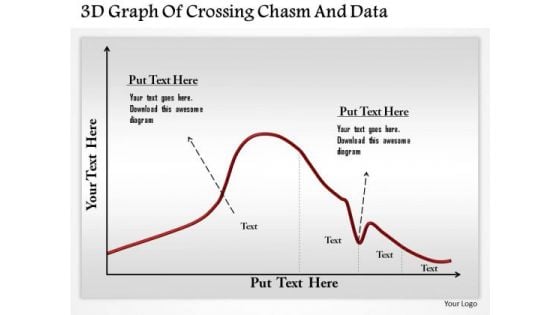
Business Diagram 3d Graph Of Crossing Chasm And Data Presentation Template
This business diagram has been designed with graphic of 3d graph. This slide contains the concept of chasm and data calculation. Use this slide to display chasm crossing condition. This business diagram adds value to your ideas.
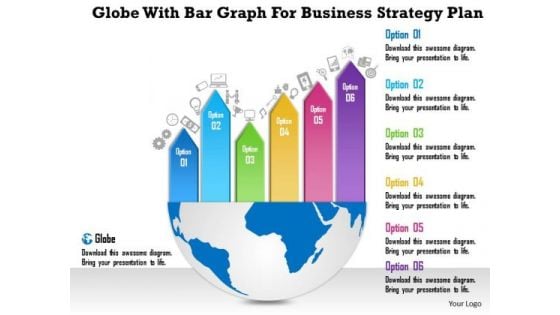
Business Diagram Globe With Bar Graph For Business Strategy Plan Presentation Template
This power point template diagram has been crafted with graphic of globe and bar graph. This PPT diagram contains the concept of business strategy and business plans for global market. Use this PPT for business and marketing related presentations.
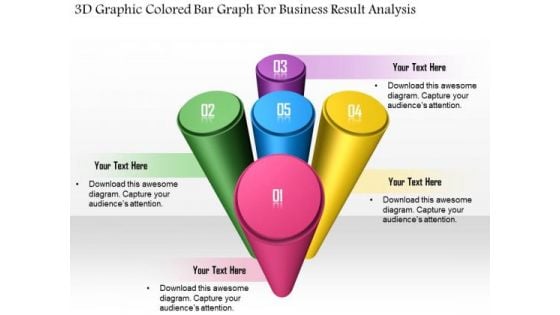
Business Diagram 3d Graphic Colored Bar Graph For Business Result Analysis Presentation Template
This Power Point template has been designed with graphic of 3d graphic and colored bar graph. Use this slide to represent six steps of any business process. Use this diagram for your business presentations and get exclusive comments on your efforts.

Business Graph With Arrow Globe PowerPoint Templates And PowerPoint Backgrounds 0511
Microsoft PowerPoint Template and Background with business growth with arrows and globe Encourage your community to take action. Get them to back the cause you champion.
Business Plan And Strategy 3d Man With Line Graph Adaptable Concepts
Our Businessplanandstrategy3dmanwithlinegraphadaptableconcepts Powerpoint Templates Deliver At Your Doorstep. Let Them In For A Wonderful Experience.
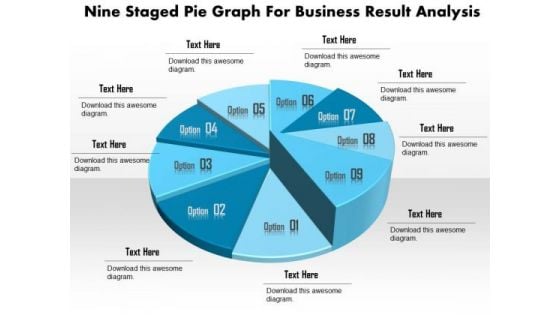
Business Diagram Nine Staged Pie Graph For Business Result Analysis Presentation Template
This business slide displays nine staged pie chart. This diagram is a data visualization tool that gives you a simple way to present statistical information. This slide helps your audience examine and interpret the data you present.
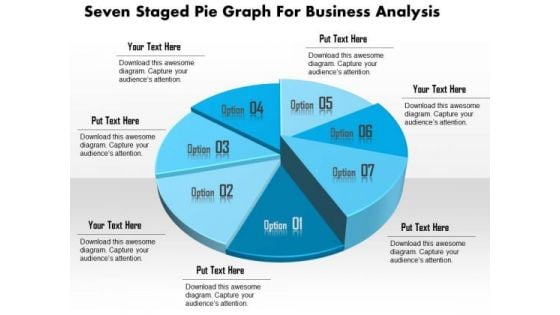
Business Diagram Seven Staged Pie Graph For Business Analysis Presentation Template
This business slide displays seven staged pie chart. This diagram is a data visualization tool that gives you a simple way to present statistical information. This slide helps your audience examine and interpret the data you present.
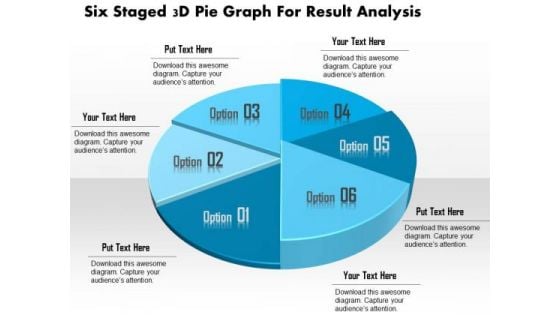
Business Diagram Six Staged 3d Pie Graph For Result Analysis Presentation Template
This business slide displays six staged pie chart. This diagram is a data visualization tool that gives you a simple way to present statistical information. This slide helps your audience examine and interpret the data you present.
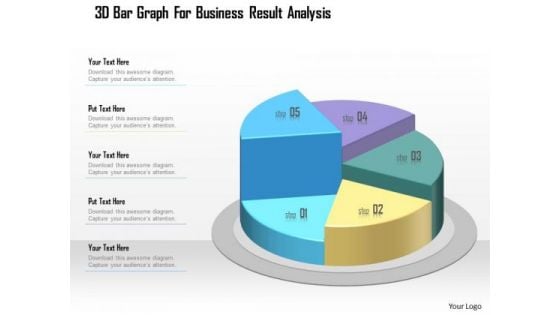
Business Diagram 3d Bar Graph For Business Result Analysis Presentation Template
This business slide displays five staged pie chart. This diagram is a data visualization tool that gives you a simple way to present statistical information. This slide helps your audience examine and interpret the data you present.
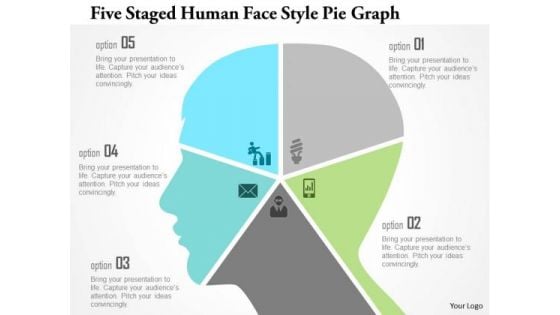
Business Diagram Five Staged Human Face Style Pie Graph Presentation Template
This diagram displays human face graphic divided into five sections. These sections contains communication icons. Display business options in your presentation by using this creative diagram.
Business Diagram Four Staged Pie Graph For Multiple Icons Presentation Template
This diagram displays human face graphic divided into four sections. These sections contain communication icons. Display business options in your presentation by using this creative diagram.
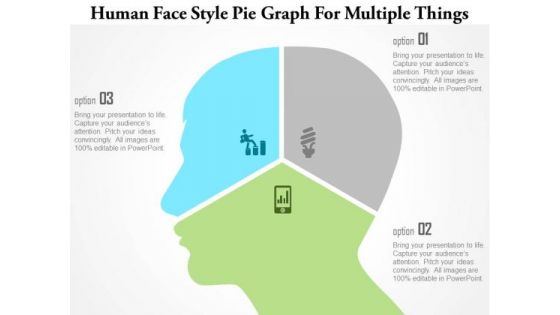
Business Diagram Human Face Style Pie Graph For Multiple Things Presentation Template
This diagram displays human face graphic divided into three sections. This section contains communication icons. Display business options in your presentation by using this creative diagram.
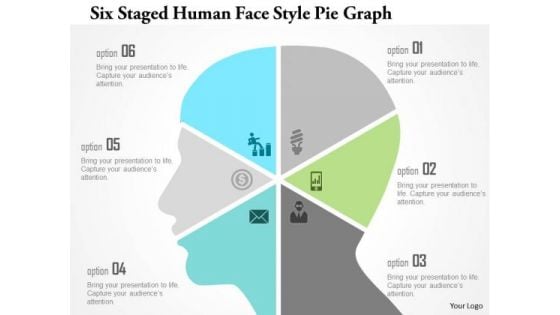
Business Diagram Six Staged Human Face Style Pie Graph Presentation Template
This diagram displays human face graphic divided into six sections. These sections contain communication icons. Display business options in your presentation by using this creative diagram.
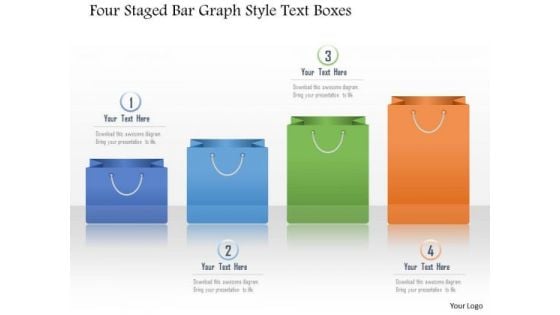
Business Diagram Four Staged Bar Graph Style Text Boxes Presentation Template
This Power Point diagram has been crafted with graphic of four shopping bags. It contains diagram of colorful shopping bag graphics depicting progress steps. Use this diagram to build professional presentation for your viewers.
Four Banners With Idea Generation Bar Graph Gears Icons Powerpoint Templates
This PPT slide has been designed with four banners. This professional template contains concept of idea generation and analysis. Blend your views with this professional slide.
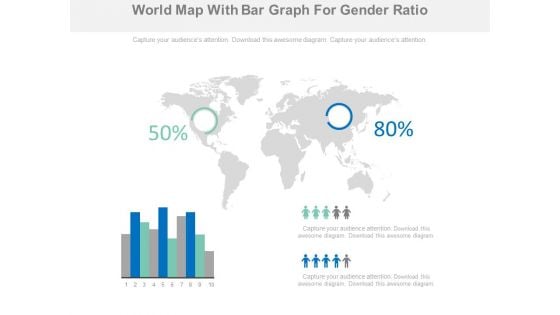
World Map With Bar Graph And Higher Population Areas Powerpoint Slides
This professionally designed PowerPoint template is as an effective tool to display high population areas on world. You can download this diagram to visually support your content. Above PPT slide is suitable for business presentation.
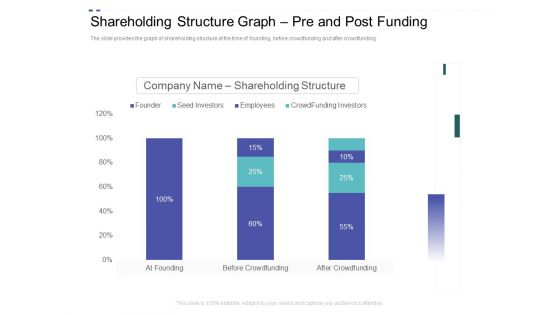
Crowd Sourced Equity Funding Pitch Deck Shareholding Structure Graph Pre And Post Funding Ppt Model Tips PDF
The slide provides the graph of shareholding structure at the time of founding, before crowdfunding and after crowdfunding. Deliver an awe inspiring pitch with this creative crowd sourced equity funding pitch deck shareholding structure graph pre and post funding ppt model tips pdf bundle. Topics like founder, seed investors, employees, crowd funding investors can be discussed with this completely editable template. It is available for immediate download depending on the needs and requirements of the user.
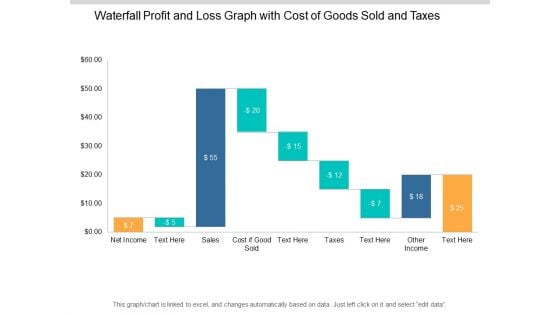
Waterfall Profit And Loss Graph With Cost Of Goods Sold And Taxes Ppt PowerPoint Presentation Show Slideshow
This is a waterfall profit and loss graph with cost of goods sold and taxes ppt powerpoint presentation show slideshow. This is a nine stage process. The stages in this process are sales waterfall, waterfall chart, business.

COVID 19 Pandemic Disease Graph Showing Number Of Days Coronavirus Can Last On Multiple Surface Infographics PDF
Presenting this set of slides with name covid 19 pandemic disease graph showing number of days coronavirus can last on multiple surface infographics pdf. The topics discussed in these slides are copper, cardboard, plastic, stainless steel. This is a completely editable PowerPoint presentation and is available for immediate download. Download now and impress your audience.
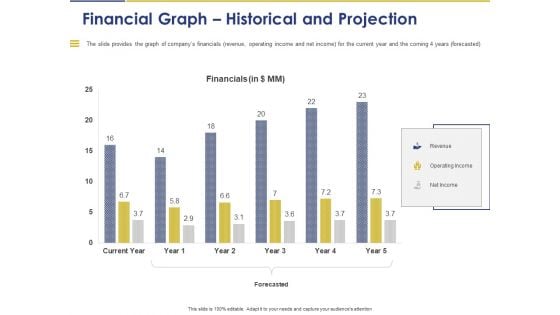
Convertible Note Pitch Deck Funding Strategy Financial Graph Historical And Projection Ppt PowerPoint Presentation Infographics Layouts PDF
Presenting this set of slides with name convertible note pitch deck funding strategy financial graph historical and projection ppt powerpoint presentation infographics layouts pdf. The topics discussed in these slides are financials, revenue, operating income, net income, forecasted. This is a completely editable PowerPoint presentation and is available for immediate download. Download now and impress your audience.
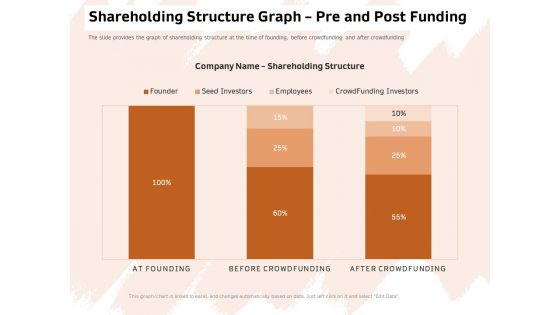
Investor Deck For Capital Generation From Substitute Funding Options Shareholding Structure Graph Pre And Post Funding Template PDF
Presenting this set of slides with name investor deck for capital generation from substitute funding options shareholding structure graph pre and post funding template pdf. The topics discussed in these slides are founder, seed investors, employees, crowdfunding investors. This is a completely editable PowerPoint presentation and is available for immediate download. Download now and impress your audience.
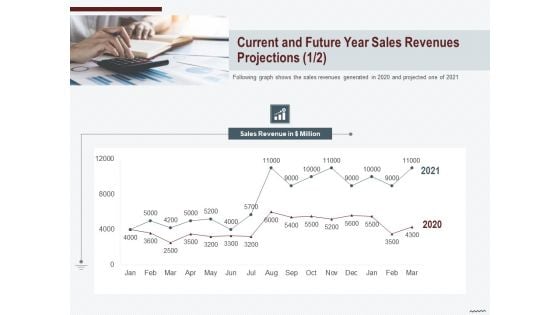
Cross Sell In Banking Industry Current And Future Year Sales Revenues Projections Graph Ppt Portfolio Design Ideas PDF
Deliver an awe inspiring pitch with this creative cross sell in banking industry current and future year sales revenues projections graph ppt portfolio design ideas pdf bundle. Topics like current and future year sales revenues projections can be discussed with this completely editable template. It is available for immediate download depending on the needs and requirements of the user.
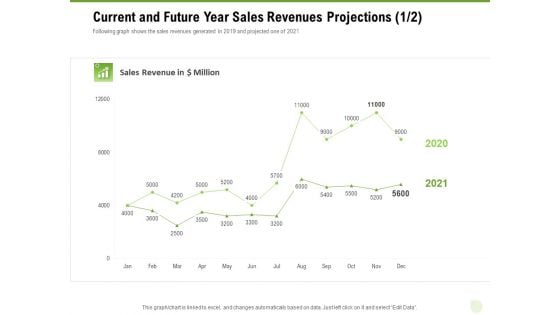
Cross Selling Of Retail Banking Products Current And Future Year Sales Revenues Projections Graph Ppt Visual Aids Backgrounds PDF
Deliver an awe inspiring pitch with this creative cross selling of retail banking products current and future year sales revenues projections graph ppt visual aids backgrounds pdf bundle. Topics like current and future year sales revenues projections can be discussed with this completely editable template. It is available for immediate download depending on the needs and requirements of the user.
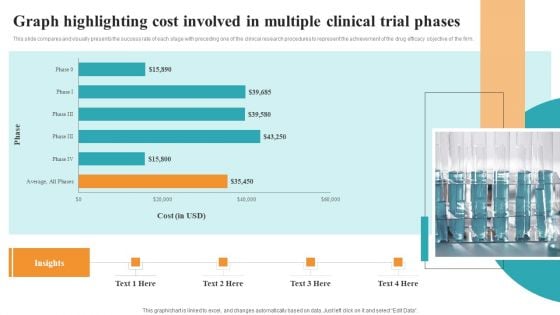
Graph Highlighting Cost Involved In Multiple Clinical Trial Phases Medical Research Phases For Clinical Tests Elements PDF
This slide compares and visually presents the success rate of each stage with preceding one of the clinical research procedures to represent the achievement of the drug efficacy objective of the firm. Want to ace your presentation in front of a live audience Our Graph Highlighting Cost Involved In Multiple Clinical Trial Phases Medical Research Phases For Clinical Tests Elements PDF can help you do that by engaging all the users towards you. Slidegeeks experts have put their efforts and expertise into creating these impeccable powerpoint presentations so that you can communicate your ideas clearly. Moreover, all the templates are customizable, and easy to edit and downloadable. Use these for both personal and commercial use.
Stock Market Analysis Magnifying Glass Over Bar Graph And Dollar Sign Ppt PowerPoint Presentation Icon Visual Aids
This is a stock market analysis magnifying glass over bar graph and dollar sign ppt powerpoint presentation icon visual aids. This is a four stage process. The stages in this process are stock market, financial markets, bull market.
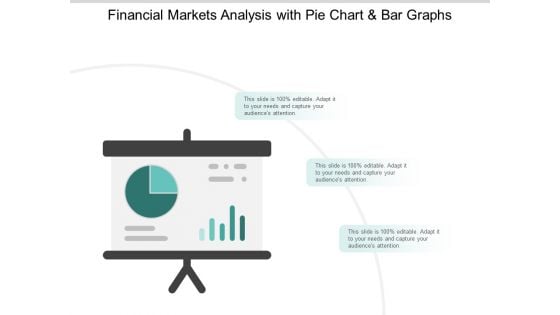
Stock Market Survey Reporting With Pie Chat And Bar Graph Ppt PowerPoint Presentation Infographic Template Example 2015
This is a stock market survey reporting with pie chat and bar graph ppt powerpoint presentation infographic template example 2015. This is a three stage process. The stages in this process are stock market, financial markets, bull market.
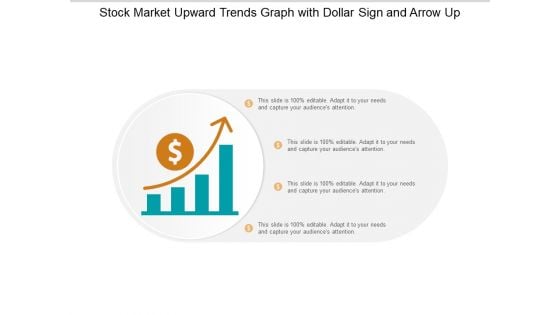
Stock Market Upward Trends Graph With Dollar Sign And Arrow Up Ppt PowerPoint Presentation Professional Graphics Download
This is a stock market upward trends graph with dollar sign and arrow up ppt powerpoint presentation professional graphics download. This is a four stage process. The stages in this process are stock market, financial markets, bull market.
Consulting Services With Bar Graph And Chat Bo Vector Icon Ppt PowerPoint Presentation File Background Designs PDF
Persuade your audience using this consulting services with bar graph and chat bo vector icon ppt powerpoint presentation file background designs pdf. This PPT design covers three stages, thus making it a great tool to use. It also caters to a variety of topics including consulting services with bar graph and chat bo vector icon. Download this PPT design now to present a convincing pitch that not only emphasizes the topic but also showcases your presentation skills.
Key Drivers Of Sales And Marketing Growth With Bar Graph Vector Icon Ppt PowerPoint Presentation File Inspiration PDF
Presenting key drivers of sales and marketing growth with bar graph vector icon ppt powerpoint presentation file inspiration pdf to dispense important information. This template comprises one stages. It also presents valuable insights into the topics including key drivers of sales and marketing growth with bar graph vector icon. This is a completely customizable PowerPoint theme that can be put to use immediately. So, download it and address the topic impactfully.
Bar Graph And Pie Charts For Business Reports Vector Icon Ppt PowerPoint Presentation Show Graphics Tutorials PDF
Pitch your topic with ease and precision using this bar graph and pie charts for business reports vector icon ppt powerpoint presentation show graphics tutorials pdf. This layout presents information on bar graph and pie charts for business reports vector icon. It is also available for immediate download and adjustment. So, changes can be made in the color, design, graphics or any other component to create a unique layout.
ROI On Capital Icon With Dollar Symbol And Graph Ppt PowerPoint Presentation Infographic Template Example Introduction PDF
Presenting roi on capital icon with dollar symbol and graph ppt powerpoint presentation infographic template example introduction pdf to dispense important information. This template comprises three stages. It also presents valuable insights into the topics including roi on capital icon with dollar symbol and graph. This is a completely customizable PowerPoint theme that can be put to use immediately. So, download it and address the topic impactfully.
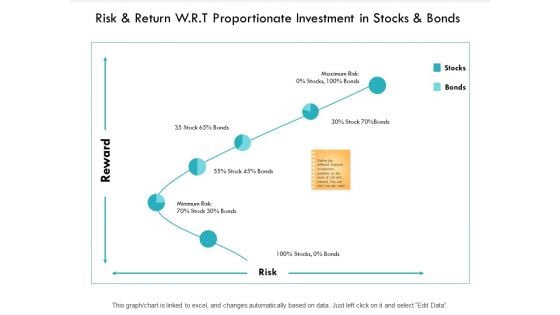
Risk Return W R T Proportionate Investment In Stocks And Bonds Graph Ppt PowerPoint Presentation Model Guidelines
Presenting this set of slides with name risk return w r t proportionate investment in stocks and bonds graph ppt powerpoint presentation model guidelines. The topics discussed in these slides are business, planning, strategy, marketing, management. This is a completely editable PowerPoint presentation and is available for immediate download. Download now and impress your audience.
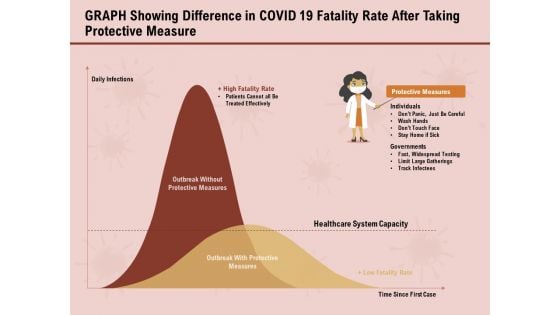
COVID 19 Pandemic Disease Graph Showing Difference In Covid 19 Fatality Rate After Taking Protective Measure Topics PDF
Presenting this set of slides with name covid 19 pandemic disease graph showing difference in covid 19 fatality rate after taking protective measure topics pdf. The topics discussed in these slides are outbreak without protective measures, outbreak with protective measures. This is a completely editable PowerPoint presentation and is available for immediate download. Download now and impress your audience.
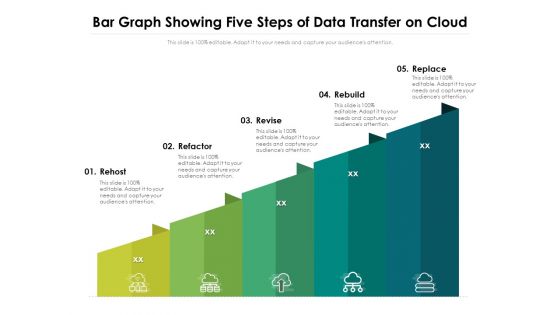
Bar Graph Showing Five Steps Of Data Transfer On Cloud Ppt PowerPoint Presentation Ideas Slide Download PDF
Presenting this set of slides with name bar graph showing five steps of data transfer on cloud ppt powerpoint presentation ideas slide download pdf. This is a five stage process. The stages in this process are rehost, refactor, revise, rebuild, replace. This is a completely editable PowerPoint presentation and is available for immediate download. Download now and impress your audience.
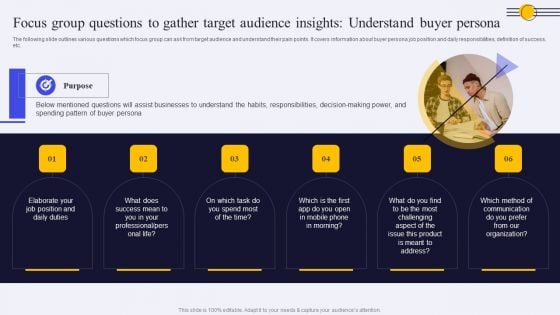
Focus Group Questions To Gather Target Audience Insights Understand Buyer Persona Ppt PowerPoint Presentation Diagram Graph Charts PDF
The following slide outlines various questions which focus group can ask from target audience and understand their pain points. It covers information about buyer persona job position and daily responsibilities, definition of success, etc. Do you have to make sure that everyone on your team knows about any specific topic I yes, then you should give Focus Group Questions To Gather Target Audience Insights Understand Buyer Persona Ppt PowerPoint Presentation Diagram Graph Charts PDF a try. Our experts have put a lot of knowledge and effort into creating this impeccable Focus Group Questions To Gather Target Audience Insights Understand Buyer Persona Ppt PowerPoint Presentation Diagram Graph Charts PDF. You can use this template for your upcoming presentations, as the slides are perfect to represent even the tiniest detail. You can download these templates from the Slidegeeks website and these are easy to edit. So grab these today.
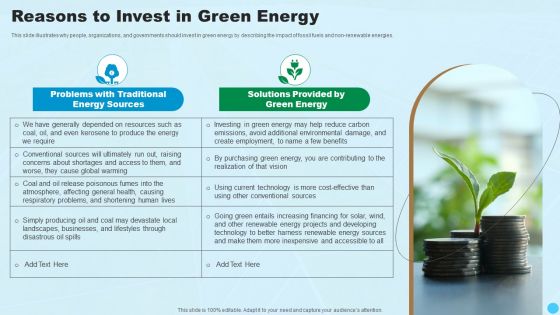
Reasons To Invest In Green Energy Clean And Renewable Energy Ppt PowerPoint Presentation Diagram Graph Charts PDF
This slide illustrates why people, organizations, and governments should invest in green energy by describing the impact of fossil fuels and non-renewable energies.Presenting Reasons To Invest In Green Energy Clean And Renewable Energy Ppt PowerPoint Presentation Diagram Graph Charts PDF to provide visual cues and insights. Share and navigate important information on two stages that need your due attention. This template can be used to pitch topics like Problems Traditional, Energy Sources, Solutions Provided. In addtion, this PPT design contains high resolution images, graphics, etc, that are easily editable and available for immediate download.
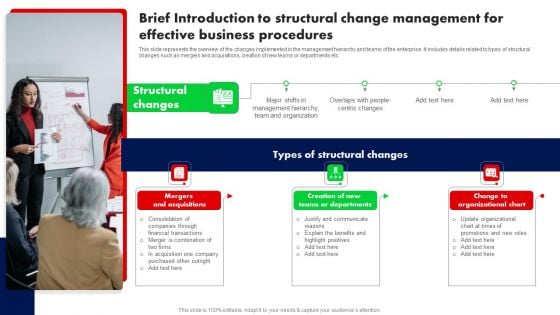
Brief Introduction To Structural Change Management For Effective Business Procedures Ppt PowerPoint Presentation Diagram Graph Charts PDF
This slide represents the overview of the changes implemented in the management hierarchy and teams of the enterprise. It includes details related to types of structural changes such as mergers and acquisitions, creation of new teams or departments etc. Want to ace your presentation in front of a live audience Our Brief Introduction To Structural Change Management For Effective Business Procedures Ppt PowerPoint Presentation Diagram Graph Charts PDF can help you do that by engaging all the users towards you. Slidegeeks experts have put their efforts and expertise into creating these impeccable powerpoint presentations so that you can communicate your ideas clearly. Moreover, all the templates are customizable, and easy to edit and downloadable. Use these for both personal and commercial use.
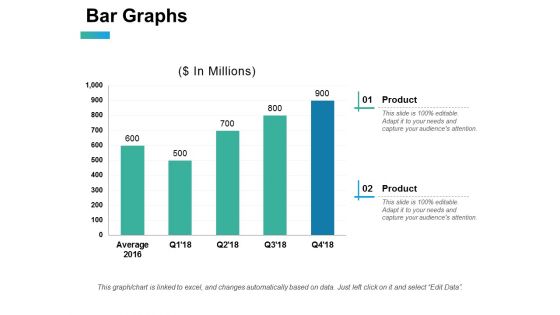
Bar Graphs Ppt PowerPoint Presentation Gallery Elements
This is a bar graphs ppt powerpoint presentation gallery elements. This is a two stage process. The stages in this process are Bar Graphs, Business, Strategy, Marketing, Analysis.
Graphs Going Up Or Down PowerPoint Icons
Graphs Going Up or Down PowerPoint Icons-These high quality powerpoint pre-designed slides and powerpoint templates have been carefully created by our professional team to help you impress your audience. All slides have been created and are 100% editable in powerpoint. Each and every property of any graphic - color, size, orientation, shading, outline etc. can be modified to help you build an effective powerpoint presentation. Any text can be entered at any point in the powerpoint template or slide. Simply DOWNLOAD, TYPE and PRESENT! Arrive at conclusions with our Graphs Going Up Or Down PowerPoint Icons. You will come out on top.
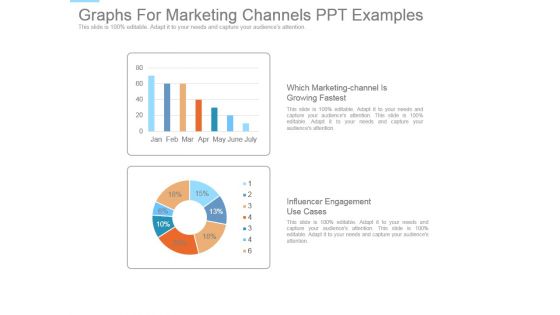
Graphs For Marketing Channels Ppt Examples
This is a graphs for marketing channels ppt examples. This is a seven stage process. The stages in this process are which marketing channel is growing fastest, influencer engagement use cases.
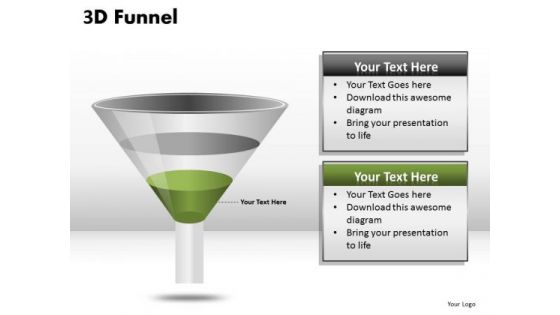
Ppt Templates Funnel Graphs PowerPoint Slides
PPT templates Funnel Graphs PowerPoint Slides-These high quality powerpoint pre-designed slides and powerpoint templates have been carefully created by our professional team to help you impress your audience. All slides have been created and are 100% editable in powerpoint. Each and every property of any graphic - color, size, orientation, shading, outline etc. can be modified to help you build an effective powerpoint presentation. Any text can be entered at any point in the powerpoint template or slide. Simply DOWNLOAD, TYPE and PRESENT! These PowerPoint presentation slides can be used to represent themes relating to - Meet your targets with our Ppt Templates Funnel Graphs PowerPoint Slides. You will come out on top.
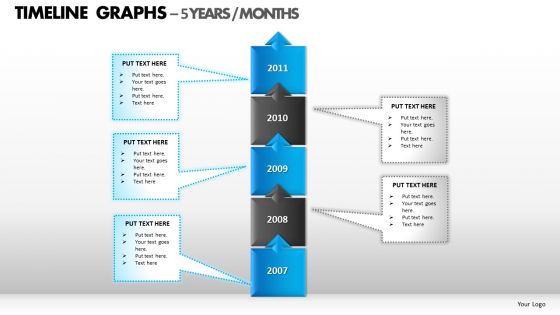
PowerPoint Backgrounds Graphic Timeline Graphs Ppt Slidelayout
PowerPoint Backgrounds Graphic TimeLine Graphs PPT Slidelayout-These high quality powerpoint pre-designed slides and powerpoint templates have been carefully created by our professional team to help you impress your audience. All slides have been created and are 100% editable in powerpoint. Each and every property of any graphic - color, size, orientation, shading, outline etc. can be modified to help you build an effective powerpoint presentation. Any text can be entered at any point in the powerpoint template or slide. Simply DOWNLOAD, TYPE and PRESENT! Enter the circuit with our PowerPoint Backgrounds Graphic Timeline Graphs Ppt Slidelayout. Your thoughts will certainly set the pace.
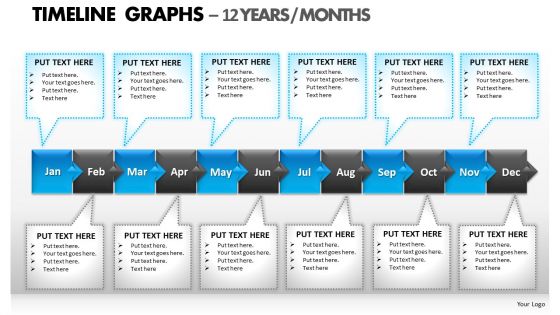
PowerPoint Backgrounds Leadership Timeline Graphs Ppt Designs
PowerPoint Backgrounds Leadership TimeLine Graphs PPT Designs-These high quality powerpoint pre-designed slides and powerpoint templates have been carefully created by our professional team to help you impress your audience. All slides have been created and are 100% editable in powerpoint. Each and every property of any graphic - color, size, orientation, shading, outline etc. can be modified to help you build an effective powerpoint presentation. Any text can be entered at any point in the powerpoint template or slide. Simply DOWNLOAD, TYPE and PRESENT! Show off your chops in all areas. Brandish them on our PowerPoint Backgrounds Leadership Timeline Graphs Ppt Designs.
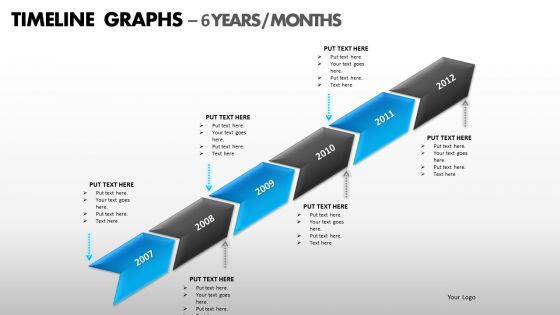
PowerPoint Designs Chart Timeline Graphs Ppt Backgrounds
PowerPoint Designs Chart TimeLine Graphs PPT Backgrounds-These high quality powerpoint pre-designed slides and powerpoint templates have been carefully created by our professional team to help you impress your audience. All slides have been created and are 100% editable in powerpoint. Each and every property of any graphic - color, size, orientation, shading, outline etc. can be modified to help you build an effective powerpoint presentation. Any text can be entered at any point in the powerpoint template or slide. Simply DOWNLOAD, TYPE and PRESENT! Enter any arena with our PowerPoint Designs Chart Timeline Graphs Ppt Backgrounds. You will certainly emerge the champion.


 Continue with Email

 Home
Home


