Graph
Down Arrow PowerPoint Icon
3d decay graph bar Our Down Arrow Icon F will exhort you on. Establish new boundaries with your ideas.
Sales & Marketing PowerPoint Icon with Down Arrow
3d decay graph bar Our Down Arrow Icon S amplify your erudition. You will be earmarked for your brilliance.

Financial Performance Team Collaboration Platform Pitch Deck PPT Template
This slide presents the financial performance of the company. It presents a line graph showcasing increase in revenue, bar graph highlighting increase in daily active users and monthly actives. There are so many reasons you need a Financial Performance Team Collaboration Platform Pitch Deck PPT Template. The first reason is you can not spend time making everything from scratch, Thus, Slidegeeks has made presentation templates for you too. You can easily download these templates from our website easily. This slide presents the financial performance of the company. It presents a line graph showcasing increase in revenue, bar graph highlighting increase in daily active users and monthly actives.
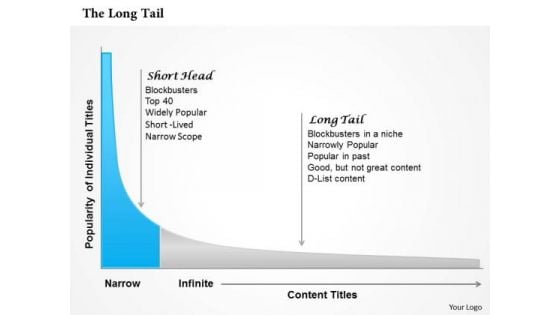
Business Framework The Long Tail PowerPoint Presentation
Our above diagram illustrates framework for long trail. It contains x-y graph of individual titles and content titles. Download this long tail diagram for business and marketing presentations.
Ecg Runner Sports PowerPoint Template 0610
Illustration of a graph heart monitor and a person running Raise the level of enthusiasm. Our Ecg Runner Sports PowerPoint Template 0610 will give it a raise.

Growth Business PowerPoint Template 0510
3d green graph showing rise in business benefits or earnings Attract your colleagues with your ideas. Capture their attention with our eye-catching Growth Business PowerPoint Template 0510.

Increase Profits Business PowerPoint Template 0610
Increase burning gold graph bar on white background Develop a fearless attitude with our Increase Profits Business PowerPoint Template 0610. They assist in breaking through.
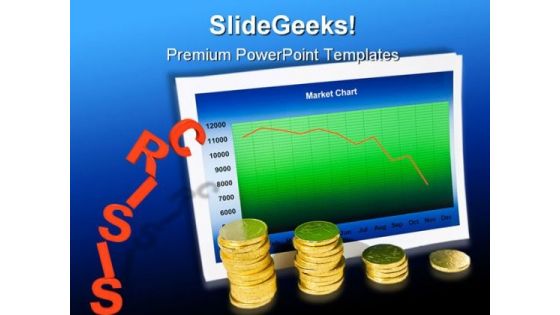
Market Crisis Finance PowerPoint Template 0610
Market chart with graph and stack of money Raise the bar with our Market Crisis Finance PowerPoint Template 0610. You will come out on top.

Profit Business PowerPoint Template 0510
colorful upward profit graph with blue background With our Profit Business PowerPoint Template 0510 there is no end. They will take you even further.
Business Navigation PowerPoint Icon C
compass over a business graph Achieve that festive atmosphere you desire. Festoon your address with our Business Navigation PowerPoint Icon C.
Business Navigation PowerPoint Icon S
compass over a business graph Fight your battles with our Business Navigation PowerPoint Icon S. You will come out on top.
Decrease PowerPoint Icon C
Decrease burning graph bar on white background Complete your projects on time with our Decrease PowerPoint Icon C. Dont pass up this opportunity to shine.
Decrease PowerPoint Icon S
Decrease burning graph bar on white background Exercise your mind with our Decrease PowerPoint Icon S. Pump the cells and generate ideas.
Increasing Costs Of Education PowerPoint Icon C
Cost of Education Increasing in 3d With Bar Graph Realise fantasies with our Increasing Costs Of Education PowerPoint Icon C. Actualise your dreams with their help.
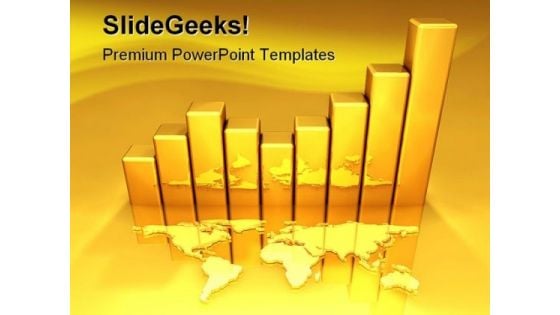
Gold Chart Business PowerPoint Template 0810
3D gold growth graph with world map. All in gold. Take control with our Gold Chart Business PowerPoint Template 0810. Do not be fatalistic in your approach.
Economy Rising Business PowerPoint Template 0910
Arrow graph going up on a blue background Hunt down problems with our Economy Rising Business PowerPoint Template 0910. Make sure your presentation gets the attention it deserves.
Loss Crisis Business PowerPoint Template 0910
3d render of a graph using dollar signs showing falling profits Arm yourself with our Loss Crisis Business PowerPoint Template 0910. Carry your thoughts safely across.

Problem Business PowerPoint Template 1010
Problem solving aid - mind map with graph Achieve the fame you aspire to. Our Problem Business PowerPoint Template 1010 will make it a certainty.

Heart Beat Medical PowerPoint Template 1110
Illustration depicting a graph from a heart beat and a heart Our Heart Beat Medical PowerPoint Template 1110 need no exaggeration. They are an advertisement for themselves.

Science Background Medical PowerPoint Templates And PowerPoint Backgrounds 0211
Microsoft PowerPoint Template and Background with DNA graph Get executive with our Science Background Medical PowerPoint Templates And PowerPoint Backgrounds 0211. Manage assets to achieve the desired end.
Business Growth Success PowerPoint Icon S
Microsoft PowerPoint Template and Background with business graph with arrow showing profits and gains Look back with Business Growth Success PowerPoint Icon S. Analyse events and move ahead.
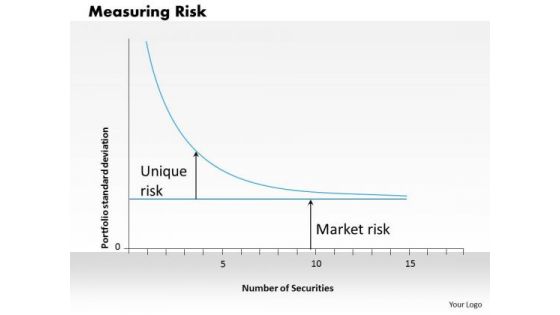
Business Framework Measuring Risk PowerPoint Presentation
This business framework has been crafted with graphic of graph with concept of measuring risk. Use this template for marketing and business related risk calculation.
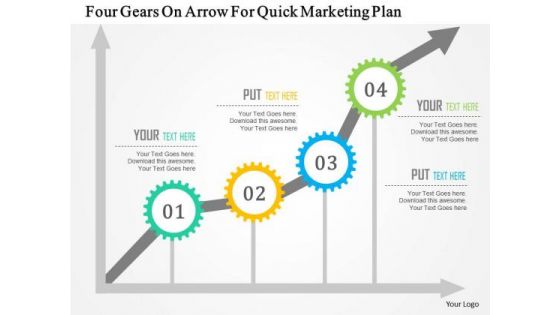
Business Diagram Four Gears On Arrow For Quick Marketing Plan Presentation Template
Our above business diagram displays graph for quick marketing plan. This slide contains four gears on an arrow. Download this diagram to build exclusive presentations for your viewers.
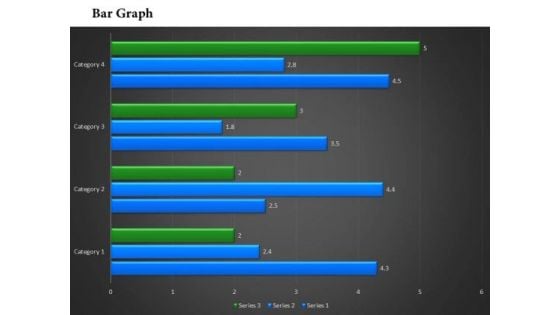
Business Framework Bar Chart In PowerPoint Presentation
This power point diagram slide has been designed with graphic of bar chart. In this diagram slide we have used green and blue colored vertical bar graph. Display result analysis with this bar graph diagram and use it in your result verification and analysis related presentations.
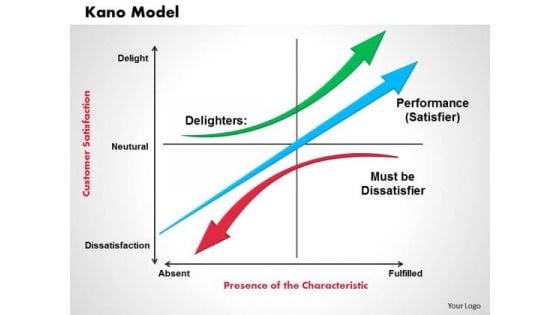
Business Framework Kano Model PowerPoint Presentation
This business diagram displays framework for Kano model. This slide contains x y graph. The X-axis represents customer satisfaction. The y-axis represents presence of characteristics. It also contains three arrows in center of graph representing delighters, satisfier and dissatisfier. Use this business diagram to earn good remarks from the target audience.

Business Growth Success PowerPoint Themes And PowerPoint Slides 0611
Microsoft PowerPoint Theme and Slide with business growth and success graph with a businessman walking up the graph The audience will be hard put to find fault. Our Business Growth Success PowerPoint Themes And PowerPoint Slides 0611 ensure accuracy of thought.
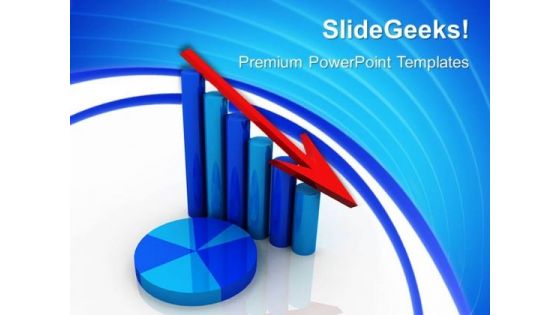
Down Arrow Showing Loss Business PowerPoint Templates And PowerPoint Themes 0512
Microsoft Powerpoint Templates and Background with Bar graph down-These templates can be used for presentations relating to-Bar graph down, business, sales, finance, arrows, cylinders-Down Arrow Showing Loss Business PowerPoint Templates And PowerPoint Themes 0512 Represent yourself with our Down Arrow Showing Loss Business PowerPoint Templates And PowerPoint Themes 0512. Download without worries with our money back guaranteee.
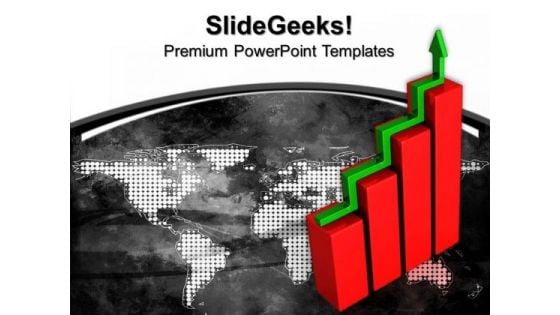
Company Growth Profit Chart Business PowerPoint Templates And PowerPoint Themes 0912
Company Growth Profit Chart Business PowerPoint Templates And PowerPoint Themes 0912-Microsoft Powerpoint Templates and Background with business profit growth graph chart-Business profit growth graph chart, arrows, success, finance, signs, business Our Company Growth Profit Chart Business PowerPoint Templates And PowerPoint Themes 0912 conspire to make it possible. They make the difficult easy to achieve.
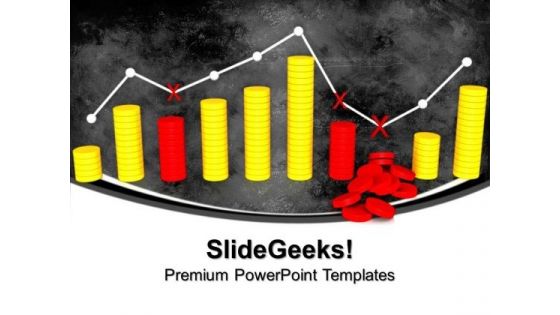
Ups And Downs Of Business PowerPoint Templates And PowerPoint Themes 0912
Ups And Downs Of Business PowerPoint Templates And PowerPoint Themes 0912-Microsoft Powerpoint Templates and Background with failure graph-Business graph with failure, finance, marketing, shapes, business, metaphor Entertain the audience in your adorable way. Our Ups And Downs Of Business PowerPoint Templates And PowerPoint Themes 0912 will make them your fans.

American Dollar Growth PowerPoint Templates And PowerPoint Themes 0912
American Dollar Growth PowerPoint Templates And PowerPoint Themes 0912-Microsoft Powerpoint Templates and Background with graph with american flag-Graph with american flag, business, money, finance, signs, symbol Do away with artificial boundaries. Change assumptions with our American Dollar Growth PowerPoint Templates And PowerPoint Themes 0912.

Parallel Bar Chart PowerPoint Templates And PowerPoint Themes 0912
Parallel Bar Chart PowerPoint Templates And PowerPoint Themes 0912-Microsoft Powerpoint Templates and Background with bar graph chart-Bar graph chart, business, arrows, leadership, success, finance Our Parallel Bar Chart PowerPoint Templates And PowerPoint Themes 0912 are more than just a facelift. They actually add to the depth of your views.
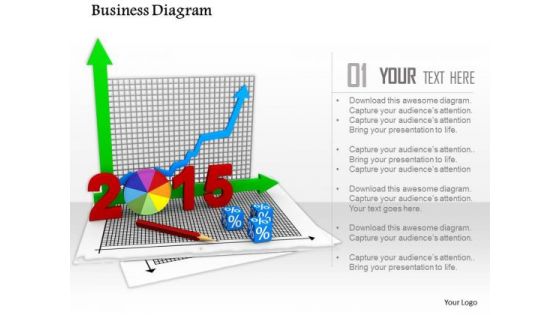
0814 Business Diagram For Planning Image Graphics For PowerPoint
Define the concepts of planning with this unique image. This image of charts and graphs depicts planning for year 2015. In this image pie chart and bar graph is displayed with year 2015. Use this image in business, marketing and sales related presentations.
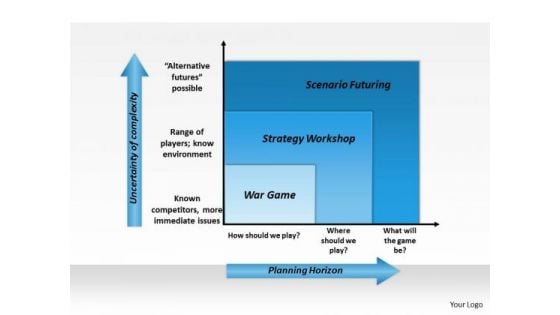
Business Framework Future Strategy Planning PowerPoint Presentation
This image slide displays planning graph. This image slide has been crafted with graph with planning horizon and uncertainty of complexity attributes. Use this image slide in your presentations to express views on future planning, strategy and various business complexities. This image slide will help your express your views in professional manner.
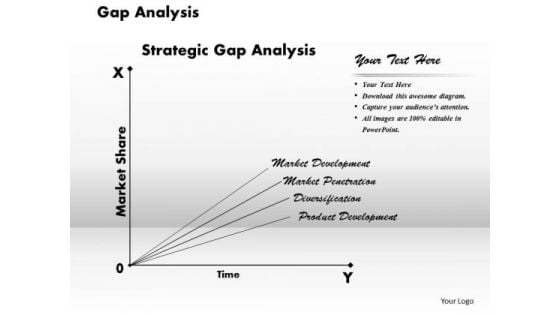
Business Framework Gap Analysis PowerPoint Presentation
This image slide displays gap analysis graph. This image slide has been designed with gap analysis graph with market share and time axis. It is the comparison of actual performance with potential or desired performance. Use this image slide to depict strategic gap analysis in your presentations. Make outstanding presentations in your presentations.
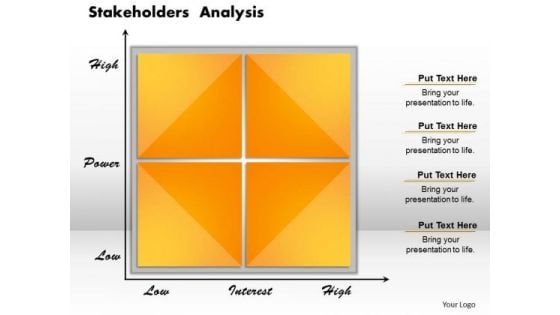
Business Framework Stakeholders Analysis PowerPoint Presentation
This Business framework Power Point template diagram has been crafted with graphic of yellow colored two axis graph. This graph can be used for displaying stakeholder analysis. Use this PPT diagram in your business and finance related presentations. Define marketing management and planning on the basis of this stakeholder analysis.
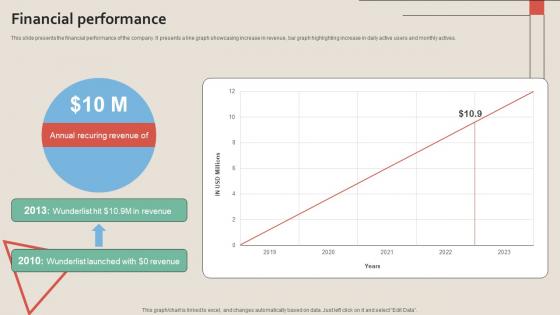
Financial Performance Work Management Tool Pitch Deck
This slide presents the financial performance of the company. It presents a line graph showcasing increase in revenue, bar graph highlighting increase in daily active users and monthly actives.Present like a pro with Financial Performance Work Management Tool Pitch Deck. Create beautiful presentations together with your team, using our easy-to-use presentation slides. Share your ideas in real-time and make changes on the fly by downloading our templates. So whether you are in the office, on the go, or in a remote location, you can stay in sync with your team and present your ideas with confidence. With Slidegeeks presentation got a whole lot easier. Grab these presentations today. This slide presents the financial performance of the company. It presents a line graph showcasing increase in revenue, bar graph highlighting increase in daily active users and monthly actives.
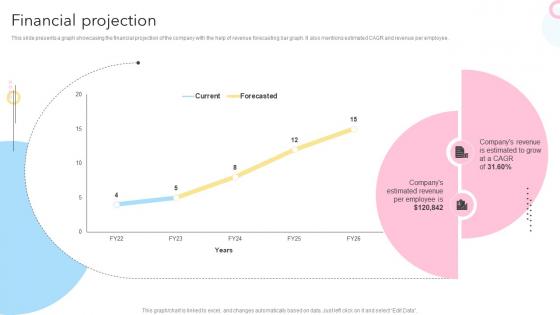
Financial Projection Maternity Support Platform Pitch Deck
This slide presents a graph showcasing the financial projection of the company with the help of revenue forecasting bar graph. It also mentions estimated CAGR and revenue per employee.Slidegeeks is here to make your presentations a breeze with Financial Projection Maternity Support Platform Pitch Deck With our easy-to-use and customizable templates, you can focus on delivering your ideas rather than worrying about formatting. With a variety of designs to choose from, you are sure to find one that suits your needs. And with animations and unique photos, illustrations, and fonts, you can make your presentation pop. So whether you are giving a sales pitch or presenting to the board, make sure to check out Slidegeeks first This slide presents a graph showcasing the financial projection of the company with the help of revenue forecasting bar graph. It also mentions estimated CAGR and revenue per employee.
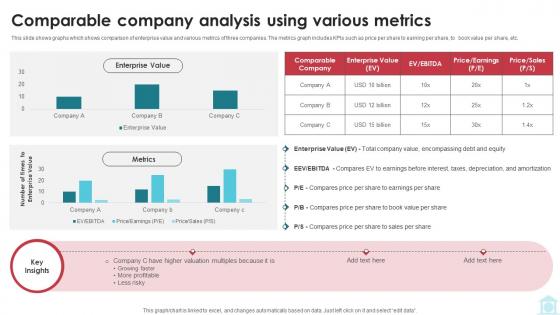
Comparable Company Analysis Using Various Metrics Mastering Investment Banking Fin SS V
This slide shows graphs which shows comparison of enterprise value and various metrics of three companies. The metrics graph includes KPIs such as price per share to earning per share, to book value per share, etc. Get a simple yet stunning designed Comparable Company Analysis Using Various Metrics Mastering Investment Banking Fin SS V It is the best one to establish the tone in your meetings. It is an excellent way to make your presentations highly effective. So, download this PPT today from Slidegeeks and see the positive impacts. Our easy-to-edit Comparable Company Analysis Using Various Metrics Mastering Investment Banking Fin SS V can be your go-to option for all upcoming conferences and meetings. So, what are you waiting for Grab this template today. This slide shows graphs which shows comparison of enterprise value and various metrics of three companies. The metrics graph includes KPIs such as price per share to earning per share, to book value per share, etc.
Comparable Company Analysis Using Investment Banking Simplified Functions Fin SS V
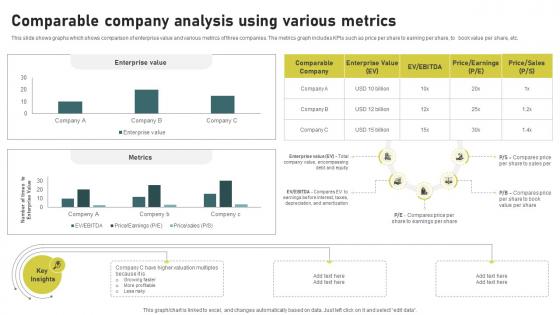
This slide shows graphs which shows comparison of enterprise value and various metrics of three companies. The metrics graph includes KPIs such as price per share to earning per share, to book value per share, etc. Get a simple yet stunning designed Comparable Company Analysis Using Investment Banking Simplified Functions Fin SS V. It is the best one to establish the tone in your meetings. It is an excellent way to make your presentations highly effective. So, download this PPT today from Slidegeeks and see the positive impacts. Our easy-to-edit Comparable Company Analysis Using Investment Banking Simplified Functions Fin SS V can be your go-to option for all upcoming conferences and meetings. So, what are you waiting for Grab this template today. This slide shows graphs which shows comparison of enterprise value and various metrics of three companies. The metrics graph includes KPIs such as price per share to earning per share, to book value per share, etc.
Comparable Company Analysis Using Various Understanding Investment Banking Framework Fin SS V
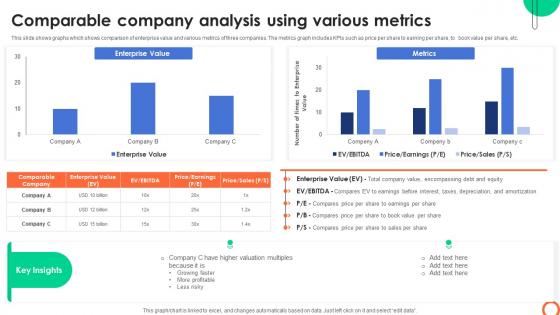
This slide shows graphs which shows comparison of enterprise value and various metrics of three companies. The metrics graph includes KPIs such as price per share to earning per share, to book value per share, etc. Get a simple yet stunning designed Comparable Company Analysis Using Various Understanding Investment Banking Framework Fin SS V. It is the best one to establish the tone in your meetings. It is an excellent way to make your presentations highly effective. So, download this PPT today from Slidegeeks and see the positive impacts. Our easy-to-edit Comparable Company Analysis Using Various Understanding Investment Banking Framework Fin SS V can be your go-to option for all upcoming conferences and meetings. So, what are you waiting for Grab this template today. This slide shows graphs which shows comparison of enterprise value and various metrics of three companies. The metrics graph includes KPIs such as price per share to earning per share, to book value per share, etc.
Support Center Agent Activity Report Guidelines PDF
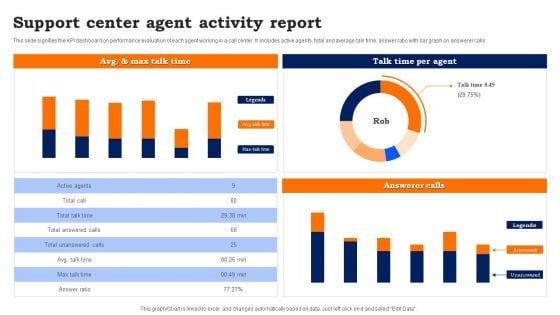
This slide signifies the KPI dashboard on performance evaluation of each agent working in a call center. It includes active agents, total and average talk time, answer ratio with bar graph on answerer calls.
Business Framework The Kubler Ross Change Curve PowerPoint Presentation
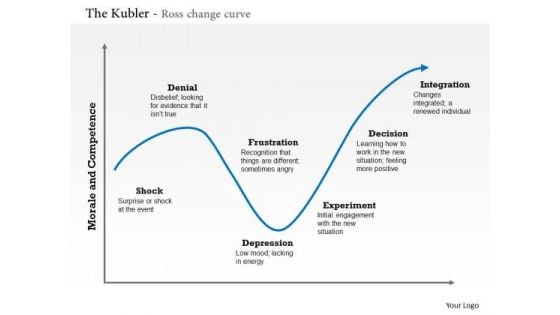
Our above diagram displays framework for Kubler-Ross change curve. It contains curved arrow graph of morale and competence. Use this Kubler-Ross model to identify reactions to change like shock frustration and depression.
Green Arrows On Bars Vector Icon Ppt PowerPoint Presentation Infographic Template Templates Cpb
This is a green arrows on bars vector icon ppt powerpoint presentation infographic template templates cpb. This is a three stage process. The stages in this process are bar chart icon, bar graph icon, data chart icon.
Histogram Column Chart With Red Arrow Vector Icon Ppt PowerPoint Presentation Outline Ideas Cpb
This is a histogram column chart with red arrow vector icon ppt powerpoint presentation outline ideas cpb. This is a three stage process. The stages in this process are bar chart icon, bar graph icon, data chart icon.
Histogram Financial Analysis Vector Icon Ppt PowerPoint Presentation Layouts File Formats Cpb
This is a histogram financial analysis vector icon ppt powerpoint presentation layouts file formats cpb. This is a three stage process. The stages in this process are bar chart icon, bar graph icon, data chart icon.
Histogram Icon Showing Economic Fluctuations Ppt PowerPoint Presentation Slides Samples Cpb
This is a histogram icon showing economic fluctuations ppt powerpoint presentation slides samples cpb. This is a three stage process. The stages in this process are bar chart icon, bar graph icon, data chart icon.
Histogram Showing Business Trends Vector Icon Ppt PowerPoint Presentation Styles Portrait Cpb
This is a histogram showing business trends vector icon ppt powerpoint presentation styles portrait cpb. This is a three stage process. The stages in this process are bar chart icon, bar graph icon, data chart icon.
Histogram With Dollar For Financial Success Vector Icon Ppt PowerPoint Presentation Portfolio Example File Cpb
This is a histogram with dollar for financial success vector icon ppt powerpoint presentation portfolio example file cpb. This is a three stage process. The stages in this process are bar chart icon, bar graph icon, data chart icon.
Histogram With Gear Vector Icon Ppt PowerPoint Presentation Professional Slides Cpb
This is a histogram with gear vector icon ppt powerpoint presentation professional slides cpb. This is a three stage process. The stages in this process are bar chart icon, bar graph icon, data chart icon.
Three Bars For Financial Analysis Vector Icon Ppt PowerPoint Presentation Pictures Background Cpb
This is a three bars for financial analysis vector icon ppt powerpoint presentation pictures background cpb. This is a three stage process. The stages in this process are bar chart icon, bar graph icon, data chart icon.
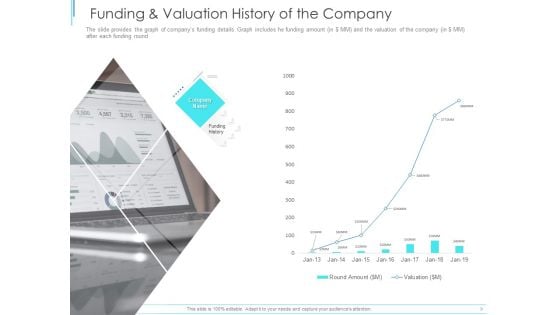
Subordinate Debt Pitch Deck For Fund Raising Funding And Valuation History Of The Company Topics PDF
The slide provides the graph of companys funding details. Graph includes he funding amount in dollar MM and the valuation of the company in dollar MM after each funding round. Deliver an awe-inspiring pitch with this creative subordinate debt pitch deck for fund raising funding and valuation history of the company topics pdf bundle. Topics like round amount, valuation can be discussed with this completely editable template. It is available for immediate download depending on the needs and requirements of the user.
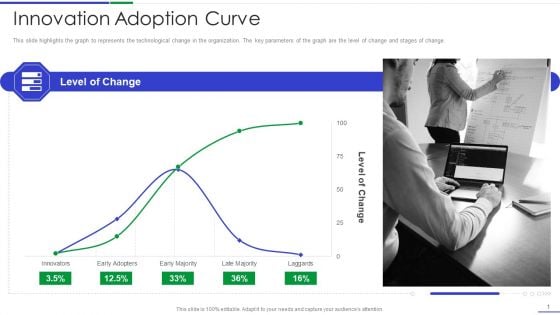
Ultimate Guide To Effective Change Management Process Innovation Adoption Curve Template PDF
This slide highlights the graph to represents the technological change in the organization. The key parameters of the graph are the level of change and stages of change. Deliver an awe inspiring pitch with this creative ultimate guide to effective change management process innovation adoption curve template pdf bundle. Topics like innovators, early adopters, early majority, late majority, laggards can be discussed with this completely editable template. It is available for immediate download depending on the needs and requirements of the user.

Machine Learning Development And Operations Cycle IT Impact Of Mlops On Product Sample PDF
Following slide illustrates information about the impact of introducing MLOps on product improvement. Here the graph shows that organization will observe rapid iteration in its product improvement.Deliver an awe inspiring pitch with this creative machine learning development and operations cycle it impact of mlops on product sample pdf bundle. Topics like graph indicates, iteration in product, product improvement can be discussed with this completely editable template. It is available for immediate download depending on the needs and requirements of the user.

Financial Dashboard For Month Closing Income And Expenses Ideas PDF
This slide illustrates facts and figures related to month end financials of a corporation. It includes income statement graph, profit margin, income and expenditure graph etc.Showcasing this set of slides titled Financial Dashboard For Month Closing Income And Expenses Ideas PDF The topics addressed in these templates are Accounts Receivable, Income Statement, Expenditure All the content presented in this PPT design is completely editable. Download it and make adjustments in color, background, font etc. as per your unique business setting.
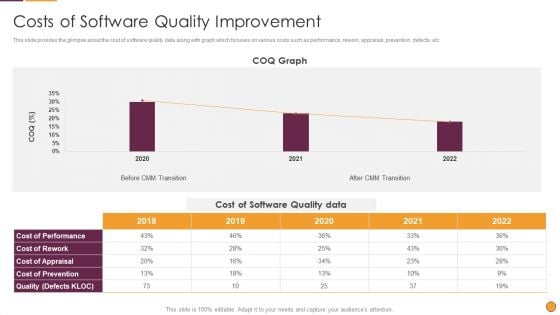
Process Enhancement Program Success Costs Of Software Quality Improvement Graphics PDF
This slide provides the glimpse about the cost of software quality data along with graph which focuses on various costs such as performance, rework, appraisal, prevention, defects, etc. Deliver an awe inspiring pitch with this creative Process Enhancement Program Success Costs Of Software Quality Improvement Graphics PDF bundle. Topics like Cost Software, Quality Data, COQ Graph can be discussed with this completely editable template. It is available for immediate download depending on the needs and requirements of the user.
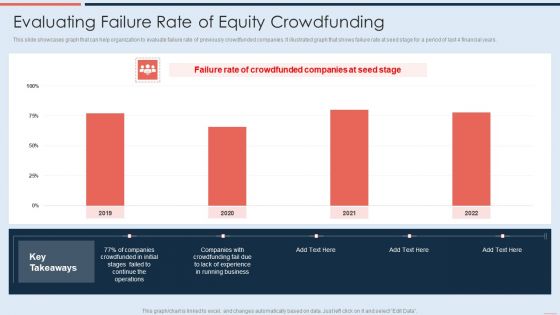
Evaluating Failure Rate Of Equity Crowdfunding Template PDF
This slide showcases graph that can help organization to evaluate failure rate of previously crowdfunded companies. It illustrated graph that shows failure rate at seed stage for a period of last 4 financial years. Deliver an awe inspiring pitch with this creative Evaluating Failure Rate Of Equity Crowdfunding Template PDF bundle. Topics like Evaluating Failure Rate, Equity Crowdfunding can be discussed with this completely editable template. It is available for immediate download depending on the needs and requirements of the user.

Adult Population That Are Actively Paying Customers Of Dating Service Formats PDF
Mentioned slide portrays worldwide informational stats of adult population that are actively paying customers of dating service. Here the graph indicates that country with the largest share is the United States.Deliver an awe inspiring pitch with this creative Adult Population That Are Actively Paying Customers Of Dating Service Formats PDF bundle. Topics like Graph Indicates, Dating Service, United States can be discussed with this completely editable template. It is available for immediate download depending on the needs and requirements of the user.
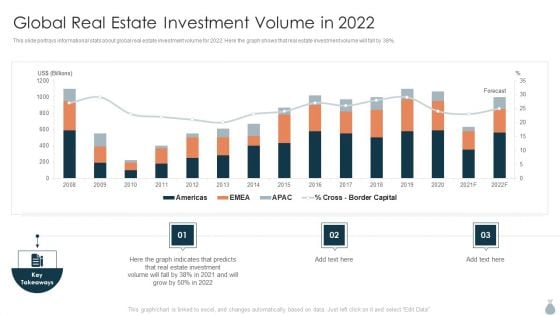
Real Estate Development Project Financing Global Real Estate Investment Volume In 2022 Sample PDF
This slide portrays informational stats about global real estate investment volume for 2022. Here the graph shows that real estate investment volume will fall by 38percent. Deliver an awe inspiring pitch with this creative Real Estate Development Project Financing Global Real Estate Investment Volume In 2022 Sample PDF bundle. Topics like Graph Indicates, Estate Investment, Key Takeaways can be discussed with this completely editable template. It is available for immediate download depending on the needs and requirements of the user.
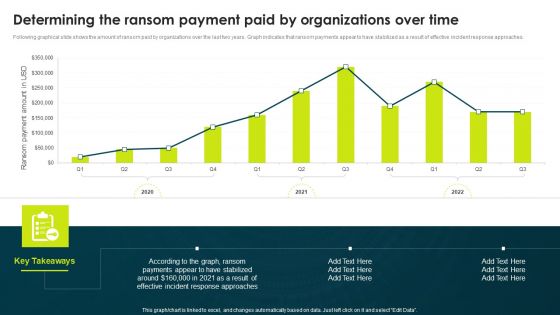
Determining The Ransom Payment Paid By Organizations Over Time Professional PDF
Following graphical slide shows the amount of ransom paid by organizations over the last two years. Graph indicates that ransom payments appear to have stabilized as a result of effective incident response approaches.Deliver an awe inspiring pitch with this creative Determining The Ransom Payment Paid By Organizations Over Time Professional PDF bundle. Topics like According Graph, Payments Appear, Response Approaches can be discussed with this completely editable template. It is available for immediate download depending on the needs and requirements of the user.
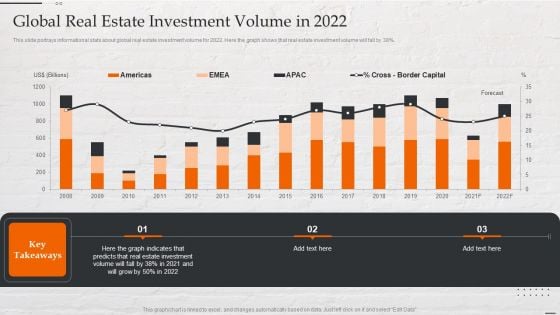
Capital Investment Options Global Real Estate Investment Volume In 2022 Slides PDF
This slide portrays informational stats about global real estate investment volume for 2022. Here the graph shows that real estate investment volume will fall by 38 percent. Deliver an awe inspiring pitch with this creative Capital Investment Options Global Real Estate Investment Volume In 2022 Slides PDF bundle. Topics like Graph Indicates, Real Estate Investment, 2008 To 2023 can be discussed with this completely editable template. It is available for immediate download depending on the needs and requirements of the user.


 Continue with Email

 Home
Home


