Graph
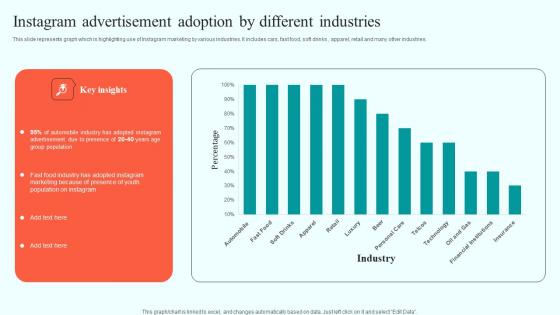
Instagram Advertisement Adoption By Different Online Advertising Solutions Infographics Pdf
This slide represents graph which is highlighting use of Instagram marketing by various industries. It includes cars, fast food, soft drinks , apparel, retail and many other industries. Whether you have daily or monthly meetings, a brilliant presentation is necessary. Instagram Advertisement Adoption By Different Online Advertising Solutions Infographics Pdf can be your best option for delivering a presentation. Represent everything in detail using Instagram Advertisement Adoption By Different Online Advertising Solutions Infographics Pdf and make yourself stand out in meetings. The template is versatile and follows a structure that will cater to your requirements. All the templates prepared by Slidegeeks are easy to download and edit. Our research experts have taken care of the corporate themes as well. So, give it a try and see the results. This slide represents graph which is highlighting use of Instagram marketing by various industries. It includes cars, fast food, soft drinks , apparel, retail and many other industries.

Ebitda Data Analytics Company Outline Topics PDF
This slide illustrates a graph of EBITDA for Kantar company showing growth trend in from 2021. It also showcases key insights for EBITDA highlighting estimated EBITDA for 2022 and 2023. Present like a pro with Ebitda Data Analytics Company Outline Topics PDF Create beautiful presentations together with your team, using our easy-to-use presentation slides. Share your ideas in real-time and make changes on the fly by downloading our templates. So whether you are in the office, on the go, or in a remote location, you can stay in sync with your team and present your ideas with confidence. With Slidegeeks presentation got a whole lot easier. Grab these presentations today. This slide illustrates a graph of EBITDA for Kantar company showing growth trend in from 2021. It also showcases key insights for EBITDA highlighting estimated EBITDA for 2022 and 2023
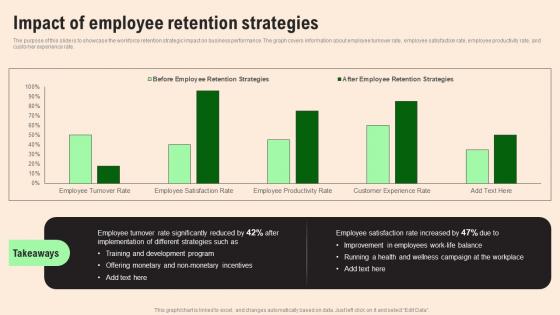
Impact Of Employee Retention HR Retention Techniques For Business Owners Structure Pdf
The purpose of this slide is to showcase the workforce retention strategic impact on business performance. The graph covers information about employee turnover rate, employee satisfaction rate, employee productivity rate, and customer experience rate. Take your projects to the next level with our ultimate collection of Impact Of Employee Retention HR Retention Techniques For Business Owners Structure Pdf. Slidegeeks has designed a range of layouts that are perfect for representing task or activity duration, keeping track of all your deadlines at a glance. Tailor these designs to your exact needs and give them a truly corporate look with your own brand colors they will make your projects stand out from the rest The purpose of this slide is to showcase the workforce retention strategic impact on business performance. The graph covers information about employee turnover rate, employee satisfaction rate, employee productivity rate, and customer experience rate.
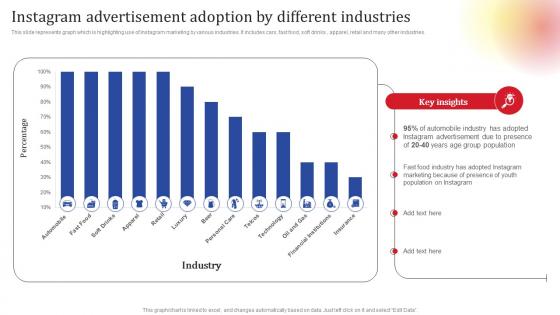
Instagram Advertisement Social Media Platform Advertising To Enhance Brand Awareness Infographics Pdf
This slide represents graph which is highlighting use of Instagram marketing by various industries. It includes cars, fast food, soft drinks , apparel, retail and many other industries. Do you have an important presentation coming up Are you looking for something that will make your presentation stand out from the rest Look no further than Instagram Advertisement Social Media Platform Advertising To Enhance Brand Awareness Infographics Pdf. With our professional designs, you can trust that your presentation will pop and make delivering it a smooth process. And with Slidegeeks, you can trust that your presentation will be unique and memorable. So why wait Grab Instagram Advertisement Social Media Platform Advertising To Enhance Brand Awareness Infographics Pdf today and make your presentation stand out from the rest This slide represents graph which is highlighting use of Instagram marketing by various industries. It includes cars, fast food, soft drinks , apparel, retail and many other industries.
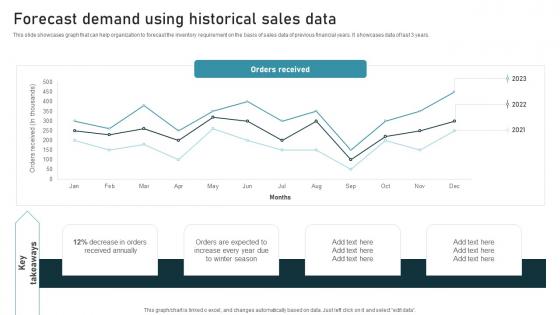
Forecast Demand Using Inventory Administration Techniques For Enhanced Stock Accuracy Template Pdf
This slide showcases graph that can help organization to forecast the inventory requirement on the basis of sales data of previous financial years. It showcases data of last 3 years. Are you in need of a template that can accommodate all of your creative concepts This one is crafted professionally and can be altered to fit any style. Use it with Google Slides or PowerPoint. Include striking photographs, symbols, depictions, and other visuals. Fill, move around, or remove text boxes as desired. Test out color palettes and font mixtures. Edit and save your work, or work with colleagues. Download Forecast Demand Using Inventory Administration Techniques For Enhanced Stock Accuracy Template Pdf and observe how to make your presentation outstanding. Give an impeccable presentation to your group and make your presentation unforgettable. This slide showcases graph that can help organization to forecast the inventory requirement on the basis of sales data of previous financial years. It showcases data of last 3 years.
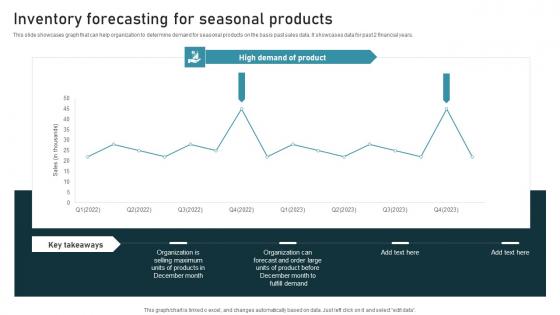
Inventory Forecasting Inventory Administration Techniques For Enhanced Stock Accuracy Designs Pdf
This slide showcases graph that can help organization to determine demand for seasonal products on the basis past sales data. It showcases data for past 2 financial years. This modern and well arranged Inventory Forecasting Inventory Administration Techniques For Enhanced Stock Accuracy Designs Pdf provides lots of creative possibilities. It is very simple to customize and edit with the Powerpoint Software. Just drag and drop your pictures into the shapes. All facets of this template can be edited with Powerpoint, no extra software is necessary. Add your own material, put your images in the places assigned for them, adjust the colors, and then you can show your slides to the world, with an animated slide included. This slide showcases graph that can help organization to determine demand for seasonal products on the basis past sales data. It showcases data for past 2 financial years.
Analysing Impact Implementing Minimizing Inventory Wastage Through Warehouse Icons Pdf
This slide showcases graph that analyze the impact on warehouse costs after implementation of various strategies. It showcases decline in indirect and direct warehouse costs. Create an editable Analysing Impact Implementing Minimizing Inventory Wastage Through Warehouse Icons Pdf that communicates your idea and engages your audience. Whether you are presenting a business or an educational presentation, pre designed presentation templates help save time. Analysing Impact Implementing Minimizing Inventory Wastage Through Warehouse Icons Pdf is highly customizable and very easy to edit, covering many different styles from creative to business presentations. Slidegeeks has creative team members who have crafted amazing templates. So, go and get them without any delay. This slide showcases graph that analyze the impact on warehouse costs after implementation of various strategies. It showcases decline in indirect and direct warehouse costs.
Evaluating Increase Warehouse Minimizing Inventory Wastage Through Warehouse Icons Pdf
This slide showcases graph that can help organization in analyzing the rise of warehouse costs. It also shows reasons for increase in warehouse costs that are rise in inventory wastage and delay in order fulfillment. From laying roadmaps to briefing everything in detail, our templates are perfect for you. You can set the stage with your presentation slides. All you have to do is download these easy to edit and customizable templates. Evaluating Increase Warehouse Minimizing Inventory Wastage Through Warehouse Icons Pdf will help you deliver an outstanding performance that everyone would remember and praise you for. Do download this presentation today. This slide showcases graph that can help organization in analyzing the rise of warehouse costs. It also shows reasons for increase in warehouse costs that are rise in inventory wastage and delay in order fulfillment.
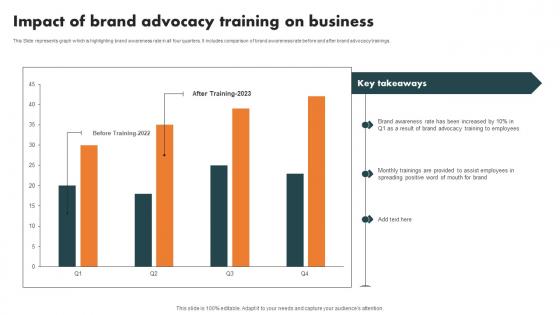
Impact Of Brand Advocacy Training Internal Branding Strategy For Enhanced Advocacy Rules Pdf
This Slide represents graph which is highlighting brand awareness rate in all four quarters. It includes comparison of brand awareness rate before and after brand advocacy trainings. Present like a pro with Impact Of Brand Advocacy Training Internal Branding Strategy For Enhanced Advocacy Rules Pdf Create beautiful presentations together with your team, using our easy to use presentation slides. Share your ideas in real time and make changes on the fly by downloading our templates. So whether you are in the office, on the go, or in a remote location, you can stay in sync with your team and present your ideas with confidence. With Slidegeeks presentation got a whole lot easier. Grab these presentations today. This Slide represents graph which is highlighting brand awareness rate in all four quarters. It includes comparison of brand awareness rate before and after brand advocacy trainings.
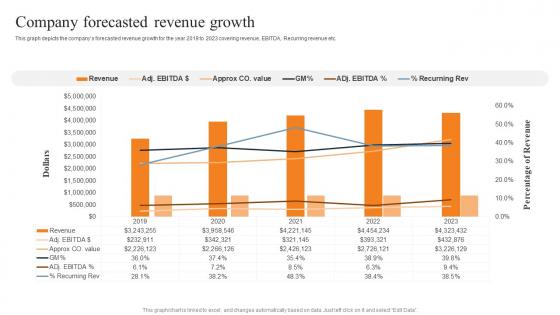
Company Forecasted Revenue Growth Layered Pricing Strategy For Managed Services Diagrams Pdf
This graph depicts the companys forecasted revenue growth for the year 2019 to 2023 covering revenue, EBITDA, Recurring revenue etc. This modern and well arranged Company Forecasted Revenue Growth Layered Pricing Strategy For Managed Services Diagrams Pdf provides lots of creative possibilities. It is very simple to customize and edit with the Powerpoint Software. Just drag and drop your pictures into the shapes. All facets of this template can be edited with Powerpoint, no extra software is necessary. Add your own material, put your images in the places assigned for them, adjust the colors, and then you can show your slides to the world, with an animated slide included. This graph depicts the companys forecasted revenue growth for the year 2019 to 2023 covering revenue, EBITDA, Recurring revenue etc.
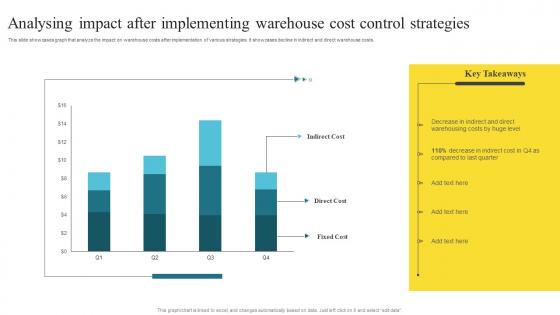
Analysing Impact After Implementing Methods To Enhance Warehouse Space Utilization Summary Pdf
This slide showcases graph that analyze the impact on warehouse costs after implementation of various strategies. It showcases decline in indirect and direct warehouse costs. Create an editable Analysing Impact After Implementing Methods To Enhance Warehouse Space Utilization Summary Pdf that communicates your idea and engages your audience. Whether you are presenting a business or an educational presentation, pre designed presentation templates help save time. Analysing Impact After Implementing Methods To Enhance Warehouse Space Utilization Summary Pdf is highly customizable and very easy to edit, covering many different styles from creative to business presentations. Slidegeeks has creative team members who have crafted amazing templates. So, go and get them without any delay. This slide showcases graph that analyze the impact on warehouse costs after implementation of various strategies. It showcases decline in indirect and direct warehouse costs.
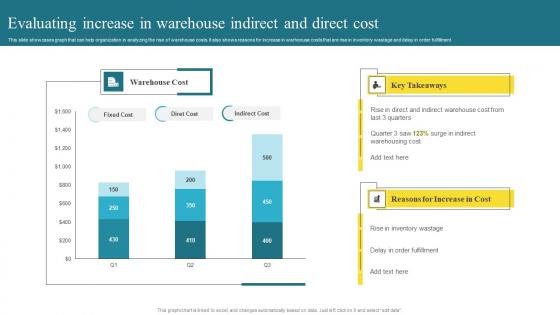
Evaluating Increase In Warehouse Methods To Enhance Warehouse Space Utilization Rules Pdf
This slide showcases graph that can help organization in analyzing the rise of warehouse costs. It also shows reasons for increase in warheouse costs that are rise in inventory wastage and delay in order fulfillment. From laying roadmaps to briefing everything in detail, our templates are perfect for you. You can set the stage with your presentation slides. All you have to do is download these easy to edit and customizable templates. Evaluating Increase In Warehouse Methods To Enhance Warehouse Space Utilization Rules Pdf will help you deliver an outstanding performance that everyone would remember and praise you for. Do download this presentation today. This slide showcases graph that can help organization in analyzing the rise of warehouse costs. It also shows reasons for increase in warheouse costs that are rise in inventory wastage and delay in order fulfillment.
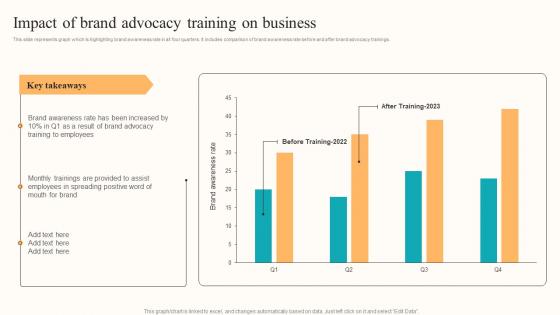
Impact Of Brand Advocacy Developing Employee Centric Marketing Program Background Pdf
This slide represents graph which is highlighting brand awareness rate in all four quarters. It includes comparison of brand awareness rate before and after brand advocacy trainings. Do you have an important presentation coming up Are you looking for something that will make your presentation stand out from the rest Look no further than Impact Of Brand Advocacy Developing Employee Centric Marketing Program Background Pdf. With our professional designs, you can trust that your presentation will pop and make delivering it a smooth process. And with Slidegeeks, you can trust that your presentation will be unique and memorable. So why wait Grab Impact Of Brand Advocacy Developing Employee Centric Marketing Program Background Pdf today and make your presentation stand out from the rest This slide represents graph which is highlighting brand awareness rate in all four quarters. It includes comparison of brand awareness rate before and after brand advocacy trainings.
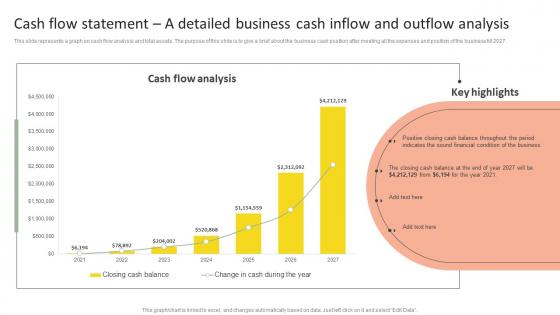
Cash Flow Statement A Detailed Insurance Agency Startup Business Plan Go To Market Strategy Rules Pdf
This slide represents a graph on cash flow analysis and total assets. The purpose of this slide is to give a brief about the business cash position after meeting all the expenses and position of the business till 2027. Boost your pitch with our creative Cash Flow Statement A Detailed Insurance Agency Startup Business Plan Go To Market Strategy Rules Pdf. Deliver an awe-inspiring pitch that will mesmerize everyone. Using these presentation templates you will surely catch everyones attention. You can browse the ppts collection on our website. We have researchers who are experts at creating the right content for the templates. So you do not have to invest time in any additional work. Just grab the template now and use them. This slide represents a graph on cash flow analysis and total assets. The purpose of this slide is to give a brief about the business cash position after meeting all the expenses and position of the business till 2027.
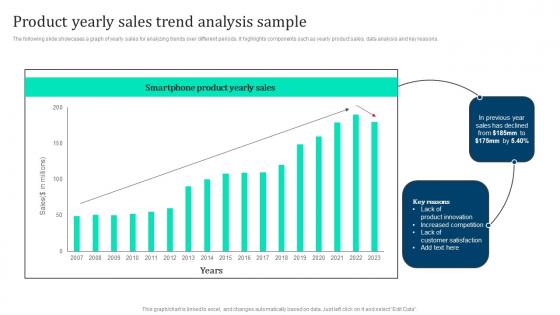
Product Yearly Sales Trend Analysis Marketing Intelligence Guide Data Gathering Introduction Pdf
The following slide showcases a graph of yearly sales for analyzing trends over different periods. It highlights components such as yearly product sales, data analysis and key reasons. Create an editable Product Yearly Sales Trend Analysis Marketing Intelligence Guide Data Gathering Introduction Pdf that communicates your idea and engages your audience. Whether you are presenting a business or an educational presentation, pre designed presentation templates help save time. Product Yearly Sales Trend Analysis Marketing Intelligence Guide Data Gathering Introduction Pdf is highly customizable and very easy to edit, covering many different styles from creative to business presentations. Slidegeeks has creative team members who have crafted amazing templates. So, go and get them without any delay. The following slide showcases a graph of yearly sales for analyzing trends over different periods. It highlights components such as yearly product sales, data analysis and key reasons.
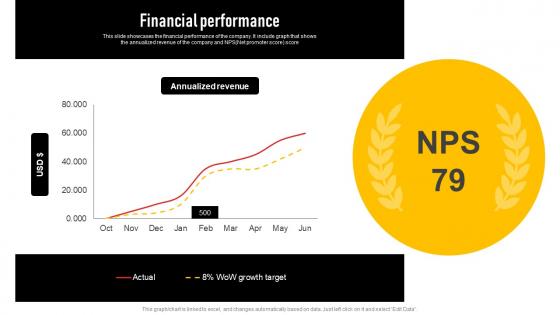
Financial Performance Insurance Investor Funding Elevator Pitch Deck Slides Pdf
This slide showcases the financial performance of the company. It include graph that shows the annualized revenue of the company and NPSNet promoter score score Do you know about Slidesgeeks Financial Performance Insurance Investor Funding Elevator Pitch Deck Slides Pdf These are perfect for delivering any kind od presentation. Using it, create PowerPoint presentations that communicate your ideas and engage audiences. Save time and effort by using our pre designed presentation templates that are perfect for a wide range of topic. Our vast selection of designs covers a range of styles, from creative to business, and are all highly customizable and easy to edit. Download as a PowerPoint template or use them as Google Slides themes. This slide showcases the financial performance of the company. It include graph that shows the annualized revenue of the company and NPSNet promoter score score
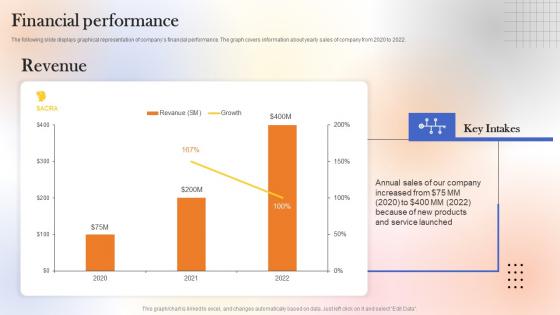
Financial Performance Web Designing Platform Fundraising Pitch Deck Download Pdf
The following slide displays graphical representation of companys financial performance. The graph covers information about yearly sales of company from 2020 to 2022. Do you have an important presentation coming up Are you looking for something that will make your presentation stand out from the rest Look no further than Financial Performance Web Designing Platform Fundraising Pitch Deck Download Pdf. With our professional designs, you can trust that your presentation will pop and make delivering it a smooth process. And with Slidegeeks, you can trust that your presentation will be unique and memorable. So why wait Grab Financial Performance Web Designing Platform Fundraising Pitch Deck Download Pdf today and make your presentation stand out from the rest The following slide displays graphical representation of companys financial performance. The graph covers information about yearly sales of company from 2020 to 2022.

How Physicians Perceive Risks Associated AI Bot Application For Various Industries Information Pdf
This graph highlights various a associated with AI based chatbots implementation in healthcare industry. Risks include Inability to provide detailed diagnosis, low assessment of patient quality, abuse on AI chatbot usage by patient Do you know about Slidesgeeks How Physicians Perceive Risks Associated AI Bot Application For Various Industries Information Pdf These are perfect for delivering any kind od presentation. Using it, create PowerPoint presentations that communicate your ideas and engage audiences. Save time and effort by using our pre designed presentation templates that are perfect for a wide range of topic. Our vast selection of designs covers a range of styles, from creative to business, and are all highly customizable and easy to edit. Download as a PowerPoint template or use them as Google Slides themes. This graph highlights various a associated with AI based chatbots implementation in healthcare industry. Risks include Inability to provide detailed diagnosis, low assessment of patient quality, abuse on AI chatbot usage by patient
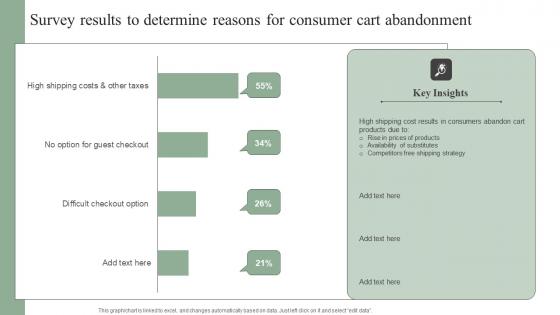
Survey Results To Determine Reasons For Consumer Efficient Marketing Tactics Information Pdf
This graph chart is linked to excel, and changes automatically based on data. Just left click on it and select edit data. Slidegeeks is one of the best resources for PowerPoint templates. You can download easily and regulate Survey Results To Determine Reasons For Consumer Efficient Marketing Tactics Information Pdf for your personal presentations from our wonderful collection. A few clicks is all it takes to discover and get the most relevant and appropriate templates. Use our Templates to add a unique zing and appeal to your presentation and meetings. All the slides are easy to edit and you can use them even for advertisement purposes. This graph chart is linked to excel, and changes automatically based on data. Just left click on it and select edit data.
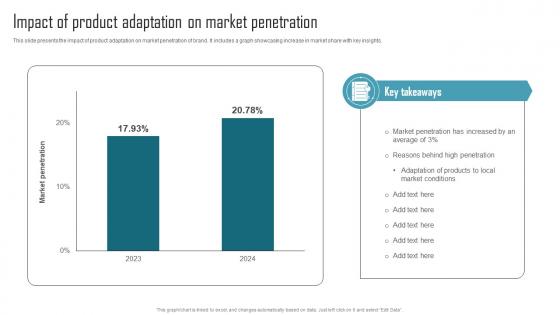
Effective Product Adaptation Impact Of Product Adaptation On Market Penetration Template PDF
This slide presents the impact of product adaptation on market penetration of brand. It includes a graph showcasing increase in market share with key insights. Are you searching for a Effective Product Adaptation Impact Of Product Adaptation On Market Penetration Template PDF that is uncluttered, straightforward, and original Its easy to edit, and you can change the colors to suit your personal or business branding. For a presentation that expresses how much effort you have put in, this template is ideal With all of its features, including tables, diagrams, statistics, and lists, its perfect for a business plan presentation. Make your ideas more appealing with these professional slides. Download Effective Product Adaptation Impact Of Product Adaptation On Market Penetration Template PDF from Slidegeeks today. This slide presents the impact of product adaptation on market penetration of brand. It includes a graph showcasing increase in market share with key insights.

Top Tenets Of Zero Trust Network Access Model Zero Trust Network Security Graphics Pdf
This graph chart is linked to excel, and changes automatically based on data. Just left click on it and select Edit Data. Do you have an important presentation coming up Are you looking for something that will make your presentation stand out from the rest Look no further than Top Tenets Of Zero Trust Network Access Model Zero Trust Network Security Graphics Pdf. With our professional designs, you can trust that your presentation will pop and make delivering it a smooth process. And with Slidegeeks, you can trust that your presentation will be unique and memorable. So why wait Grab Top Tenets Of Zero Trust Network Access Model Zero Trust Network Security Graphics Pdf today and make your presentation stand out from the rest This graph chart is linked to excel, and changes automatically based on data. Just left click on it and select Edit Data.
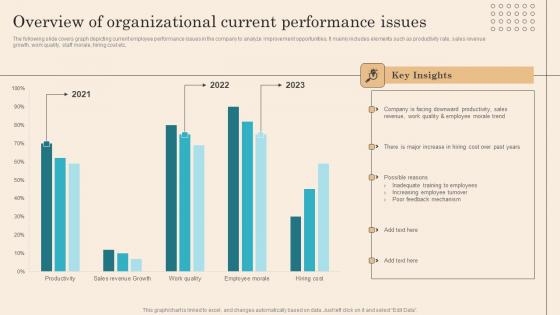
Overview Of Organizational Current Performance Issues Executing Successful Staff Performance Diagrams Pdf
The following slide covers graph depicting current employee performance issues in the company to analyze improvement opportunities. It mainly includes elements such as productivity rate, sales revenue growth, work quality, staff morale, hiring cost etc. Slidegeeks has constructed Overview Of Organizational Current Performance Issues Executing Successful Staff Performance Diagrams Pdf after conducting extensive research and examination. These presentation templates are constantly being generated and modified based on user preferences and critiques from editors. Here, you will find the most attractive templates for a range of purposes while taking into account ratings and remarks from users regarding the content. This is an excellent jumping off point to explore our content and will give new users an insight into our top notch PowerPoint Templates. The following slide covers graph depicting current employee performance issues in the company to analyze improvement opportunities. It mainly includes elements such as productivity rate, sales revenue growth, work quality, staff morale, hiring cost etc.
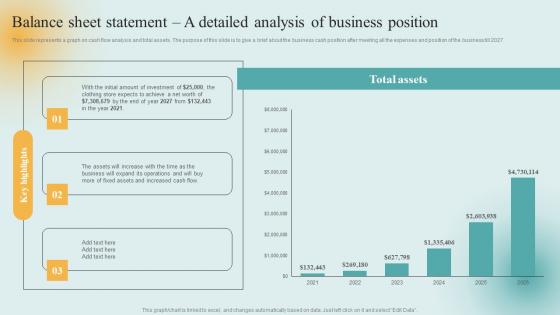
Insurance Firm Start Up Financial Balance Sheet Statement A Detailed Analysis Of Business Demonstration Pdf
This slide represents a graph on cash flow analysis and total assets. The purpose of this slide is to give a brief about the business cash position after meeting all the expenses and position of the business till 2027. Find a pre-designed and impeccable Insurance Firm Start Up Financial Balance Sheet Statement A Detailed Analysis Of Business Demonstration Pdf. The templates can ace your presentation without additional effort. You can download these easy-to-edit presentation templates to make your presentation stand out from others. So, what are you waiting for Download the template from Slidegeeks today and give a unique touch to your presentation. This slide represents a graph on cash flow analysis and total assets. The purpose of this slide is to give a brief about the business cash position after meeting all the expenses and position of the business till 2027.

Forecast Demand Using Historical Sales Data Tactical Guide Stock Administration Themes Pdf
This slide showcases graph that can help organization to forecast the inventory requirement on the basis of sales data of previous financial years. It showcases data of last 3 years. Find highly impressive Forecast Demand Using Historical Sales Data Tactical Guide Stock Administration Themes Pdf on Slidegeeks to deliver a meaningful presentation. You can save an ample amount of time using these presentation templates. No need to worry to prepare everything from scratch because Slidegeeks experts have already done a huge research and work for you. You need to download Forecast Demand Using Historical Sales Data Tactical Guide Stock Administration Themes Pdf for your upcoming presentation. All the presentation templates are 100 percent editable and you can change the color and personalize the content accordingly. Download now This slide showcases graph that can help organization to forecast the inventory requirement on the basis of sales data of previous financial years. It showcases data of last 3 years.
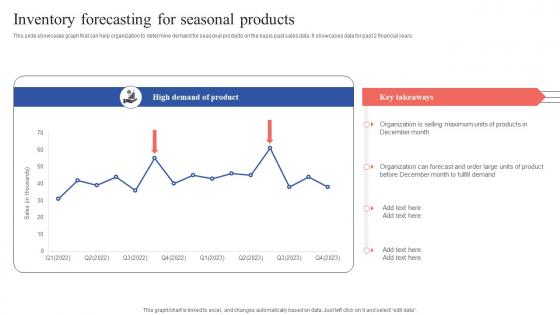
Inventory Forecasting For Seasonal Products Tactical Guide Stock Administration Formats Pdf
This slide showcases graph that can help organization to determine demand for seasonal products on the basis past sales data. It showcases data for past 2 financial years. Make sure to capture your audiences attention in your business displays with our gratis customizable Inventory Forecasting For Seasonal Products Tactical Guide Stock Administration Formats Pdf. These are great for business strategies, office conferences, capital raising or task suggestions. If you desire to acquire more customers for your tech business and ensure they stay satisfied, create your own sales presentation with these plain slides. This slide showcases graph that can help organization to determine demand for seasonal products on the basis past sales data. It showcases data for past 2 financial years.
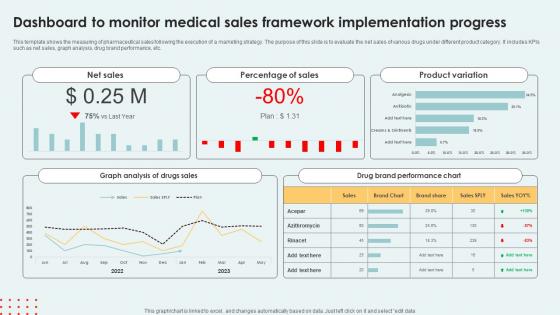
Dashboard To Monitor Medical Sales Framework Implementation Progress Formats Pdf
This template shows the measuring of pharmaceutical sales following the execution of a marketing strategy. The purpose of this slide is to evaluate the net sales of various drugs under different product category. It includes KPIs such as net sales, graph analysis, drug brand performance, etc. Showcasing this set of slides titled Dashboard To Monitor Medical Sales Framework Implementation Progress Formats Pdf The topics addressed in these templates are Percentage Sales, Product Variation, Brand Performance Chart All the content presented in this PPT design is completely editable. Download it and make adjustments in color, background, font etc. as per your unique business setting. This template shows the measuring of pharmaceutical sales following the execution of a marketing strategy. The purpose of this slide is to evaluate the net sales of various drugs under different product category. It includes KPIs such as net sales, graph analysis, drug brand performance, etc.
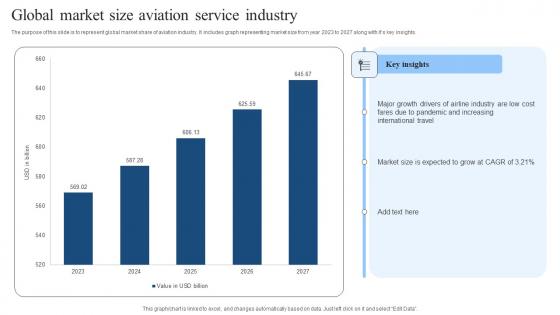
Global Market Size Aviation Service Industry Background Pdf
The purpose of this slide is to represent global market share of aviation industry. It includes graph representing market size from year 2023 to 2027 along with its key insights. Pitch your topic with ease and precision using this Global Market Size Aviation Service Industry Background Pdf. This layout presents information on Global Market Size, Aviation Service Industry. It is also available for immediate download and adjustment. So, changes can be made in the color, design, graphics or any other component to create a unique layout. The purpose of this slide is to represent global market share of aviation industry. It includes graph representing market size from year 2023 to 2027 along with its key insights.
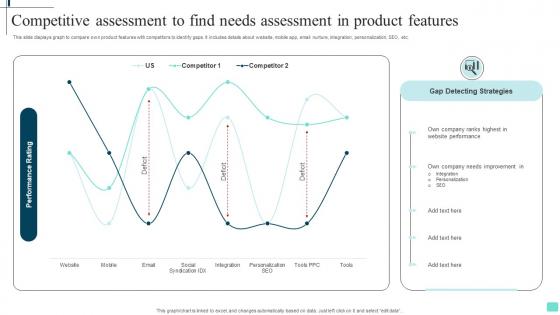
Competitive Assessment To Find Needs Assessment In Product Features Guidelines Pdf
This slide displays graph to compare own product features with competitors to identify gaps. It includes details about website, mobile app, email nurture, integration, personalization, SEO, etc. Showcasing this set of slides titled Competitive Assessment To Find Needs Assessment In Product Features Guidelines Pdf. The topics addressed in these templates are Competitive Assessment, Competitors To Identify Gaps, Mobile App, Email Nurture. All the content presented in this PPT design is completely editable. Download it and make adjustments in color, background, font etc. as per your unique business setting. This slide displays graph to compare own product features with competitors to identify gaps. It includes details about website, mobile app, email nurture, integration, personalization, SEO, etc.
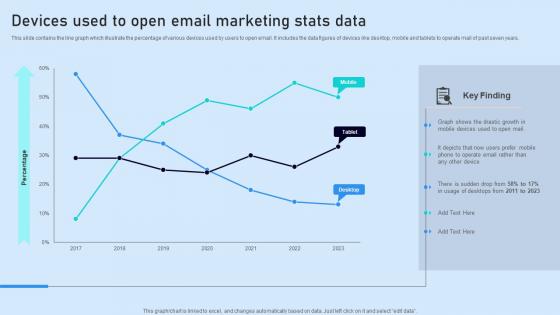
Devices Used To Open Email Marketing Stats Data Brochure Pdf
This slide contains the line graph which illustrate the percentage of various devices used by users to open email. It includes the data figures of devices like desktop, mobile and tablets to operate mail of past seven years. Pitch your topic with ease and precision using this Devices Used To Open Email Marketing Stats Data Brochure Pdf. This layout presents information on Key Finding, Stats Data, Devices. It is also available for immediate download and adjustment. So, changes can be made in the color, design, graphics or any other component to create a unique layout. This slide contains the line graph which illustrate the percentage of various devices used by users to open email. It includes the data figures of devices like desktop, mobile and tablets to operate mail of past seven years.
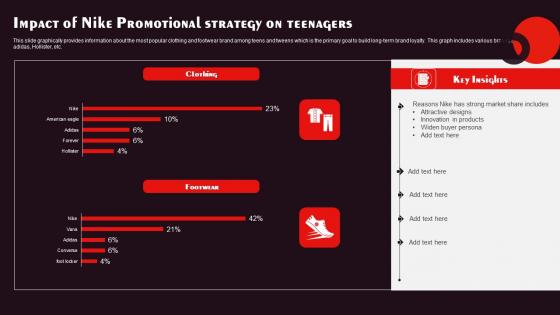
Impact Of Nike Promotional Strategy On Teenagers Rules Pdf
This slide graphically provides information about the most popular clothing and footwear brand among teens and tweens which is the primary goal to build long term brand loyalty. This graph includes various brands such as Nike, adidas, Hollister, etc. Showcasing this set of slides titled Impact Of Nike Promotional Strategy On Teenagers Rules Pdf The topics addressed in these templates are Attractive Designs, Innovation Products, Widen Buyer Persona All the content presented in this PPT design is completely editable. Download it and make adjustments in color, background, font etc. as per your unique business setting. This slide graphically provides information about the most popular clothing and footwear brand among teens and tweens which is the primary goal to build long term brand loyalty. This graph includes various brands such as Nike, adidas, Hollister, etc.
Global Market Size Of Generative AI In Video Games Icons Pdf
The purpose of this slide is to depict global market size of generative AI in video gaming. It covers a graph of market share from year 2022 to 2032 along with its key insights. Showcasing this set of slides titled Global Market Size Of Generative AI In Video Games Icons Pdf The topics addressed in these templates are Market Revenue, Pacific Dominated, Market Expected Grow All the content presented in this PPT design is completely editable. Download it and make adjustments in color, background, font etc. as per your unique business setting. The purpose of this slide is to depict global market size of generative AI in video gaming. It covers a graph of market share from year 2022 to 2032 along with its key insights.
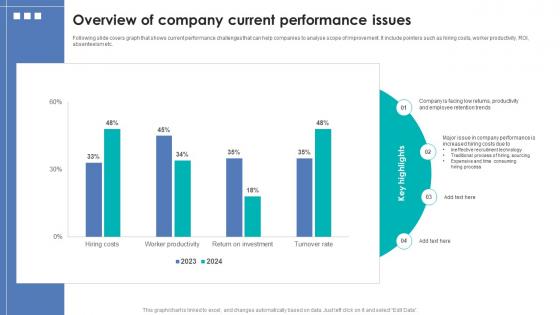
Integrating Automation For Effective Business Overview Of Company Current Performance Issues
Following slide covers graph that shows current performance challenges that can help companies to analyse scope of improvement. It include pointers such as hiring costs, worker productivity, ROI, absenteeism etc. Explore a selection of the finest Integrating Automation For Effective Business Overview Of Company Current Performance Issues here. With a plethora of professionally designed and pre-made slide templates, you can quickly and easily find the right one for your upcoming presentation. You can use our Integrating Automation For Effective Business Overview Of Company Current Performance Issues to effectively convey your message to a wider audience. Slidegeeks has done a lot of research before preparing these presentation templates. The content can be personalized and the slides are highly editable. Grab templates today from Slidegeeks. Following slide covers graph that shows current performance challenges that can help companies to analyse scope of improvement. It include pointers such as hiring costs, worker productivity, ROI, absenteeism etc.
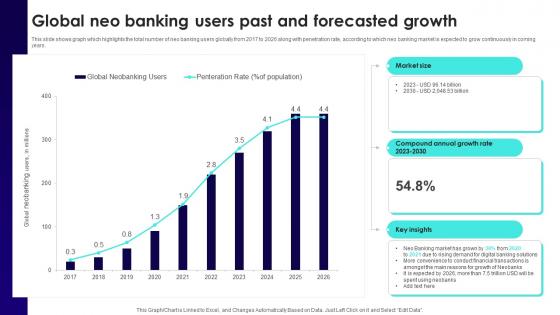
Wireless Banking To Improve Global Neo Banking Users Past And Forecasted Fin SS V
This slide shows graph which highlights the total number of neo banking users globally from 2017 to 2026 along with penetration rate, according to which neo banking market is expected to grow continuously in coming years. Slidegeeks has constructed Wireless Banking To Improve Global Neo Banking Users Past And Forecasted Fin SS V after conducting extensive research and examination. These presentation templates are constantly being generated and modified based on user preferences and critiques from editors. Here, you will find the most attractive templates for a range of purposes while taking into account ratings and remarks from users regarding the content. This is an excellent jumping-off point to explore our content and will give new users an insight into our top-notch PowerPoint Templates. This slide shows graph which highlights the total number of neo banking users globally from 2017 to 2026 along with penetration rate, according to which neo banking market is expected to grow continuously in coming years.
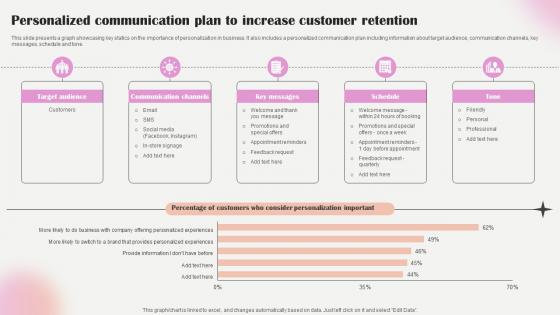
Salon Marketing Plan To Optimize Personalized Communication Plan To Increase Strategy SS V
This slide presents a graph showcasing key statics on the importance of personalization in business. It also includes a personalized communication plan including information about target audience, communication channels, key messages, schedule and tone. Crafting an eye-catching presentation has never been more straightforward. Let your presentation shine with this tasteful yet straightforward Salon Marketing Plan To Optimize Personalized Communication Plan To Increase Strategy SS V template. It offers a minimalistic and classy look that is great for making a statement. The colors have been employed intelligently to add a bit of playfulness while still remaining professional. Construct the ideal Salon Marketing Plan To Optimize Personalized Communication Plan To Increase Strategy SS V that effortlessly grabs the attention of your audience Begin now and be certain to wow your customers This slide presents a graph showcasing key statics on the importance of personalization in business. It also includes a personalized communication plan including information about target audience, communication channels, key messages, schedule and tone.
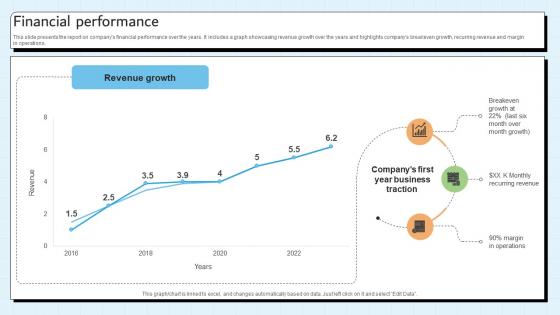
Financial Performance Customer Relationship Management Platform Pitch Deck
This slide presents the report on companys financial performance over the years. It includes a graph showcasing revenue growth over the years and highlights companys breakeven growth, recurring revenue and margin in operations. Present like a pro with Financial Performance Customer Relationship Management Platform Pitch Deck. Create beautiful presentations together with your team, using our easy-to-use presentation slides. Share your ideas in real-time and make changes on the fly by downloading our templates. So whether you are in the office, on the go, or in a remote location, you can stay in sync with your team and present your ideas with confidence. With Slidegeeks presentation got a whole lot easier. Grab these presentations today. This slide presents the report on companys financial performance over the years. It includes a graph showcasing revenue growth over the years and highlights companys breakeven growth, recurring revenue and margin in operations.
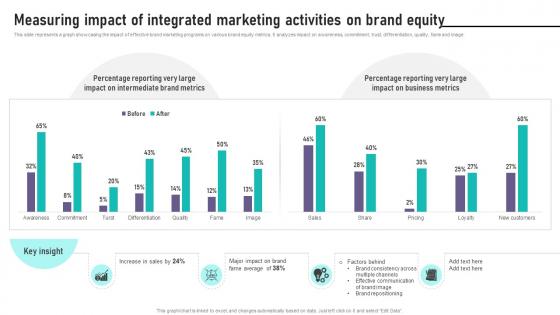
Brand Equity Management To Raise Measuring Impact Of Integrated Marketing Activities
This slide represents a graph showcasing the impact of effective brand marketing programs on various brand equity metrics. It analyzes impact on awareness, commitment, trust, differentiation, quality, fame and image. Boost your pitch with our creative Brand Equity Management To Raise Measuring Impact Of Integrated Marketing Activities. Deliver an awe-inspiring pitch that will mesmerize everyone. Using these presentation templates you will surely catch everyones attention. You can browse the ppts collection on our website. We have researchers who are experts at creating the right content for the templates. So you do not have to invest time in any additional work. Just grab the template now and use them. This slide represents a graph showcasing the impact of effective brand marketing programs on various brand equity metrics. It analyzes impact on awareness, commitment, trust, differentiation, quality, fame and image.

Increasing Business Awareness Introducing Digital Marketing Strategy SS V
This slide presents the importance of digital marketing in insurance promotion. It includes a graph showing the market growth of digital advertising with key insights and key statistics. Are you searching for a Increasing Business Awareness Introducing Digital Marketing Strategy SS V that is uncluttered, straightforward, and original Its easy to edit, and you can change the colors to suit your personal or business branding. For a presentation that expresses how much effort you have put in, this template is ideal With all of its features, including tables, diagrams, statistics, and lists, its perfect for a business plan presentation. Make your ideas more appealing with these professional slides. Download Increasing Business Awareness Introducing Digital Marketing Strategy SS V from Slidegeeks today. This slide presents the importance of digital marketing in insurance promotion. It includes a graph showing the market growth of digital advertising with key insights and key statistics.

Increasing Business Awareness Introducing Social Media Marketing For Creating Strategy SS V
This slide presents an overview of social media marketing. It also include a graph showcasing the associated benefits of social media for insurers such as marketing, customer service, new sales leads, fraud detection and risk selection. Take your projects to the next level with our ultimate collection of Increasing Business Awareness Introducing Social Media Marketing For Creating Strategy SS V. Slidegeeks has designed a range of layouts that are perfect for representing task or activity duration, keeping track of all your deadlines at a glance. Tailor these designs to your exact needs and give them a truly corporate look with your own brand colors they will make your projects stand out from the rest This slide presents an overview of social media marketing. It also include a graph showcasing the associated benefits of social media for insurers such as marketing, customer service, new sales leads, fraud detection and risk selection
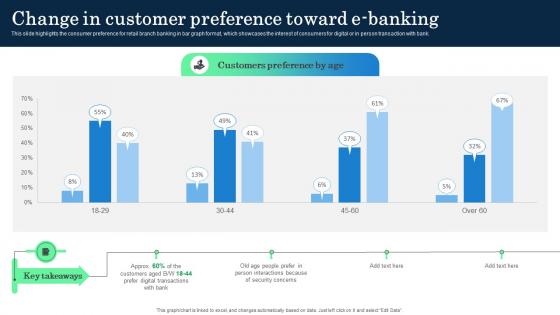
Change In Customer Preference Toward E Banking Incorporating Banking Operational Growth
This slide highlights the consumer preference for retail branch banking in bar graph format, which showcases the interest of consumers for digital or in person transaction with bank. Slidegeeks is here to make your presentations a breeze with Change In Customer Preference Toward E Banking Incorporating Banking Operational Growth With our easy-to-use and customizable templates, you can focus on delivering your ideas rather than worrying about formatting. With a variety of designs to choose from, you are sure to find one that suits your needs. And with animations and unique photos, illustrations, and fonts, you can make your presentation pop. So whether you are giving a sales pitch or presenting to the board, make sure to check out Slidegeeks first This slide highlights the consumer preference for retail branch banking in bar graph format, which showcases the interest of consumers for digital or in person transaction with bank.
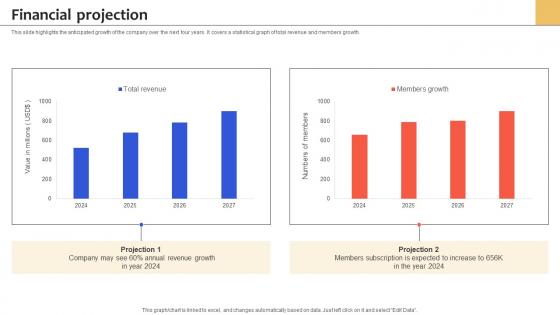
Financial Projection Health Insurance Services Management Platform Pitch Deck
This slide highlights the anticipated growth of the company over the next four years. It covers a statistical graph of total revenue and members growth. Slidegeeks is here to make your presentations a breeze with Financial Projection Health Insurance Services Management Platform Pitch Deck With our easy-to-use and customizable templates, you can focus on delivering your ideas rather than worrying about formatting. With a variety of designs to choose from, you are sure to find one that suits your needs. And with animations and unique photos, illustrations, and fonts, you can make your presentation pop. So whether you are giving a sales pitch or presenting to the board, make sure to check out Slidegeeks first This slide highlights the anticipated growth of the company over the next four years. It covers a statistical graph of total revenue and members growth.
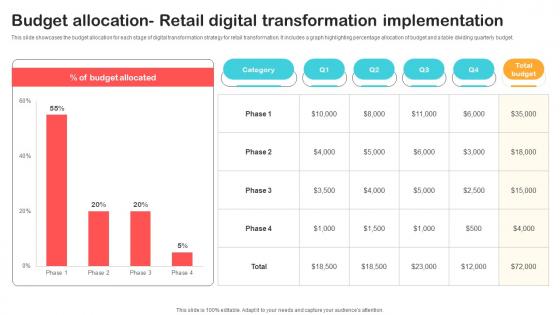
Budget Allocation Retail Digital Transformation Optimizing Retail Operations With Digital DT SS V
This slide showcases the budget allocation for each stage of digital transformation strategy for retail transformation. It includes a graph highlighting percentage allocation of budget and a table dividing quarterly budget.From laying roadmaps to briefing everything in detail, our templates are perfect for you. You can set the stage with your presentation slides. All you have to do is download these easy-to-edit and customizable templates. Budget Allocation Retail Digital Transformation Optimizing Retail Operations With Digital DT SS V will help you deliver an outstanding performance that everyone would remember and praise you for. Do download this presentation today. This slide showcases the budget allocation for each stage of digital transformation strategy for retail transformation. It includes a graph highlighting percentage allocation of budget and a table dividing quarterly budget.

Budget Allocation Retail Digital Transformation Implementation DT SS V
This slide showcases the budget allocation for each stage of digital transformation strategy for retail transformation. It includes a graph highlighting percentage allocation of budget and a table dividing quarterly budget.From laying roadmaps to briefing everything in detail, our templates are perfect for you. You can set the stage with your presentation slides. All you have to do is download these easy-to-edit and customizable templates. Budget Allocation Retail Digital Transformation Implementation DT SS V will help you deliver an outstanding performance that everyone would remember and praise you for. Do download this presentation today. This slide showcases the budget allocation for each stage of digital transformation strategy for retail transformation. It includes a graph highlighting percentage allocation of budget and a table dividing quarterly budget.
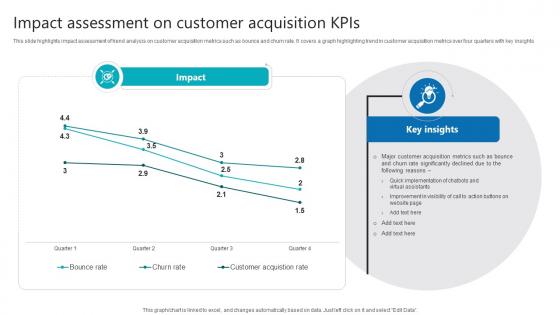
Impact Assessment On Customer Acquisition Kpis Product Analytics Implementation Data Analytics V
This slide highlights impact assessment of trend analysis on customer acquisition metrics such as bounce and churn rate. It covers a graph highlighting trend in customer acquisition metrics over four quarters with key insights The Impact Assessment On Customer Acquisition Kpis Product Analytics Implementation Data Analytics V is a compilation of the most recent design trends as a series of slides. It is suitable for any subject or industry presentation, containing attractive visuals and photo spots for businesses to clearly express their messages. This template contains a variety of slides for the user to input data, such as structures to contrast two elements, bullet points, and slides for written information. Slidegeeks is prepared to create an impression. This slide highlights impact assessment of trend analysis on customer acquisition metrics such as bounce and churn rate. It covers a graph highlighting trend in customer acquisition metrics over four quarters with key insights
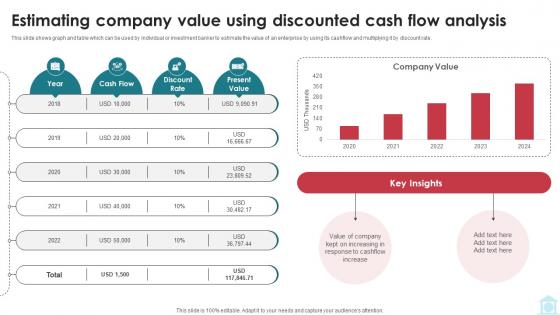
Estimating Company Value Using Discounted Cash Mastering Investment Banking Fin SS V
This slide shows graph and table which can be used by individual or investment banker to estimate the value of an enterprise by using its cashflow and multiplying it by discount rate. Coming up with a presentation necessitates that the majority of the effort goes into the content and the message you intend to convey. The visuals of a PowerPoint presentation can only be effective if it supplements and supports the story that is being told. Keeping this in mind our experts created Estimating Company Value Using Discounted Cash Mastering Investment Banking Fin SS V to reduce the time that goes into designing the presentation. This way, you can concentrate on the message while our designers take care of providing you with the right template for the situation. This slide shows graph and table which can be used by individual or investment banker to estimate the value of an enterprise by using its cashflow and multiplying it by discount rate.
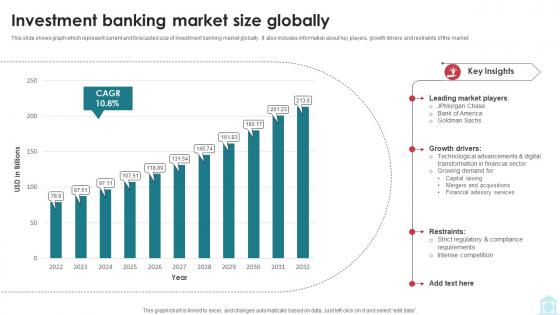
Investment Banking Market Size Globally Mastering Investment Banking Fin SS V
This slide shows graph which represent current and forecasted size of investment banking market globally . It also includes information about key players, growth drivers and restraints of the market. Explore a selection of the finest Investment Banking Market Size Globally Mastering Investment Banking Fin SS V here. With a plethora of professionally designed and pre-made slide templates, you can quickly and easily find the right one for your upcoming presentation. You can use our Investment Banking Market Size Globally Mastering Investment Banking Fin SS V to effectively convey your message to a wider audience. Slidegeeks has done a lot of research before preparing these presentation templates. The content can be personalized and the slides are highly editable. Grab templates today from Slidegeeks. This slide shows graph which represent current and forecasted size of investment banking market globally . It also includes information about key players, growth drivers and restraints of the market.

Estimating Company Value Using Investment Banking Simplified Functions Fin SS V
This slide shows graph and table which can be used by individual or investment banker to estimate the value of an enterprise by using its cashflow and multiplying it by discount rate. Coming up with a presentation necessitates that the majority of the effort goes into the content and the message you intend to convey. The visuals of a PowerPoint presentation can only be effective if it supplements and supports the story that is being told. Keeping this in mind our experts created Estimating Company Value Using Investment Banking Simplified Functions Fin SS V to reduce the time that goes into designing the presentation. This way, you can concentrate on the message while our designers take care of providing you with the right template for the situation. This slide shows graph and table which can be used by individual or investment banker to estimate the value of an enterprise by using its cashflow and multiplying it by discount rate.

Investment Banking Market Size Globally Investment Banking Simplified Functions Fin SS V
This slide shows graph which represent current and forecasted size of investment banking market globally . It also includes information about key players, growth drivers and restraints of the market. Explore a selection of the finest Investment Banking Market Size Globally Investment Banking Simplified Functions Fin SS V here. With a plethora of professionally designed and pre-made slide templates, you can quickly and easily find the right one for your upcoming presentation. You can use our Investment Banking Market Size Globally Investment Banking Simplified Functions Fin SS V to effectively convey your message to a wider audience. Slidegeeks has done a lot of research before preparing these presentation templates. The content can be personalized and the slides are highly editable. Grab templates today from Slidegeeks. This slide shows graph which represent current and forecasted size of investment banking market globally . It also includes information about key players, growth drivers and restraints of the market.
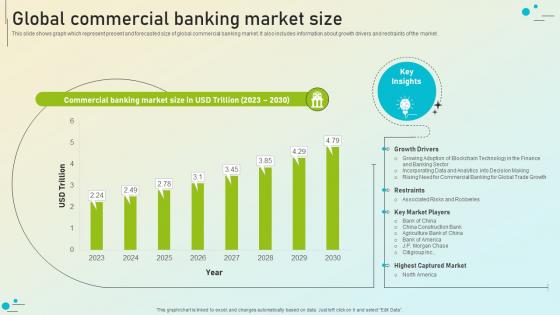
Beginners Guide To Commercial Global Commercial Banking Market Size Fin SS V
This slide shows graph which represent present and forecasted size of global commercial banking market. It also includes information about growth drivers and restraints of the market. The Beginners Guide To Commercial Global Commercial Banking Market Size Fin SS V is a compilation of the most recent design trends as a series of slides. It is suitable for any subject or industry presentation, containing attractive visuals and photo spots for businesses to clearly express their messages. This template contains a variety of slides for the user to input data, such as structures to contrast two elements, bullet points, and slides for written information. Slidegeeks is prepared to create an impression. This slide shows graph which represent present and forecasted size of global commercial banking market. It also includes information about growth drivers and restraints of the market.
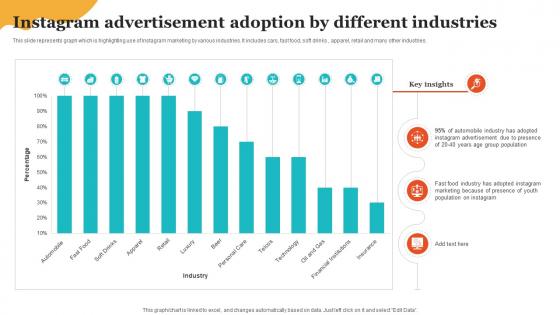
Social Media Marketing To Enhance Instagram Advertisement Adoption By Different Industries MKT SS V
This slide represents graph which is highlighting use of Instagram marketing by various industries. It includes cars, fast food, soft drinks, apparel, retail and many other industries. Whether you have daily or monthly meetings, a brilliant presentation is necessary. Social Media Marketing To Enhance Instagram Advertisement Adoption By Different Industries MKT SS V can be your best option for delivering a presentation. Represent everything in detail using Social Media Marketing To Enhance Instagram Advertisement Adoption By Different Industries MKT SS V and make yourself stand out in meetings. The template is versatile and follows a structure that will cater to your requirements. All the templates prepared by Slidegeeks are easy to download and edit. Our research experts have taken care of the corporate themes as well. So, give it a try and see the results. This slide represents graph which is highlighting use of Instagram marketing by various industries. It includes cars, fast food, soft drinks, apparel, retail and many other industries.
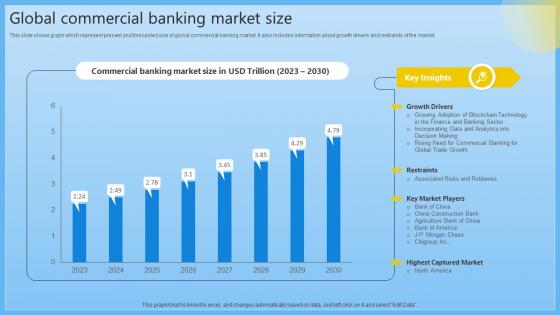
Global Commercial Banking Market Size Complete Guide On Managing Banking Fin SS V
This slide shows graph which represent present and forecasted size of global commercial banking market. It also includes information about growth drivers and restraints of the market. Explore a selection of the finest Global Commercial Banking Market Size Complete Guide On Managing Banking Fin SS V here. With a plethora of professionally designed and pre-made slide templates, you can quickly and easily find the right one for your upcoming presentation. You can use our Global Commercial Banking Market Size Complete Guide On Managing Banking Fin SS V to effectively convey your message to a wider audience. Slidegeeks has done a lot of research before preparing these presentation templates. The content can be personalized and the slides are highly editable. Grab templates today from Slidegeeks. This slide shows graph which represent present and forecasted size of global commercial banking market. It also includes information about growth drivers and restraints of the market.
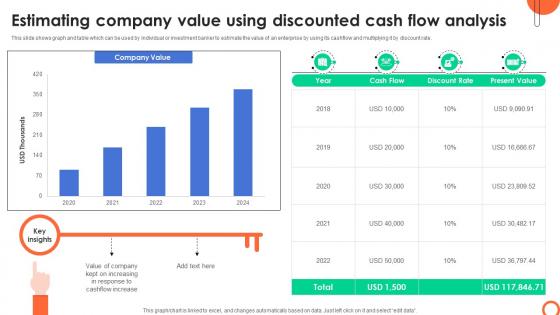
Estimating Company Value Using Discounted Understanding Investment Banking Framework Fin SS V
This slide shows graph and table which can be used by individual or investment banker to estimate the value of an enterprise by using its cashflow and multiplying it by discount rate. Coming up with a presentation necessitates that the majority of the effort goes into the content and the message you intend to convey. The visuals of a PowerPoint presentation can only be effective if it supplements and supports the story that is being told. Keeping this in mind our experts created Estimating Company Value Using Discounted Understanding Investment Banking Framework Fin SS V to reduce the time that goes into designing the presentation. This way, you can concentrate on the message while our designers take care of providing you with the right template for the situation. This slide shows graph and table which can be used by individual or investment banker to estimate the value of an enterprise by using its cashflow and multiplying it by discount rate.
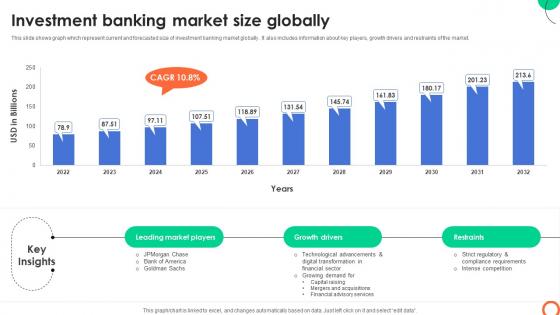
Investment Banking Market Size Globally Understanding Investment Banking Framework Fin SS V
This slide shows graph which represent current and forecasted size of investment banking market globally . It also includes information about key players, growth drivers and restraints of the market. Explore a selection of the finest Investment Banking Market Size Globally Understanding Investment Banking Framework Fin SS V here. With a plethora of professionally designed and pre-made slide templates, you can quickly and easily find the right one for your upcoming presentation. You can use our Investment Banking Market Size Globally Understanding Investment Banking Framework Fin SS V to effectively convey your message to a wider audience. Slidegeeks has done a lot of research before preparing these presentation templates. The content can be personalized and the slides are highly editable. Grab templates today from Slidegeeks. This slide shows graph which represent current and forecasted size of investment banking market globally . It also includes information about key players, growth drivers and restraints of the market.

Client Support Plan To Increase Customer Service Channel Preferences By Generation Strategy SS V
This slide shows graph which can be used by organizations to get understanding regarding the channels preferred by different generations. These generations are baby boomers, gen x and millennials. The best PPT templates are a great way to save time, energy, and resources. Slidegeeks have 100 percent editable powerpoint slides making them incredibly versatile. With these quality presentation templates, you can create a captivating and memorable presentation by combining visually appealing slides and effectively communicating your message. Download Client Support Plan To Increase Customer Service Channel Preferences By Generation Strategy SS V from Slidegeeks and deliver a wonderful presentation. This slide shows graph which can be used by organizations to get understanding regarding the channels preferred by different generations. These generations are baby boomers, gen x and millennials.
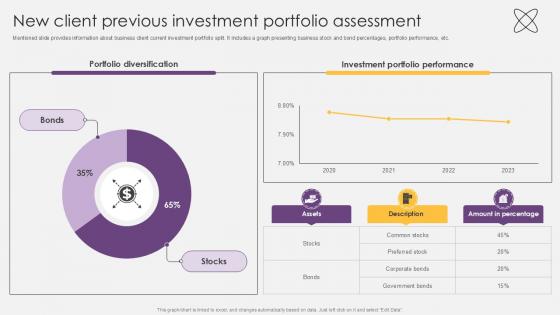
New Client Previous Investment Portfolio Assessment Investment Fund PPT Example
Mentioned slide provides information about business client current investment portfolio split.It includes a graph presenting business stock and bond percentages, portfolio performance, etc. This New Client Previous Investment Portfolio Assessment Investment Fund PPT Example from Slidegeeks makes it easy to present information on your topic with precision. It provides customization options, so you can make changes to the colors, design, graphics, or any other component to create a unique layout. It is also available for immediate download, so you can begin using it right away. Slidegeeks has done good research to ensure that you have everything you need to make your presentation stand out. Make a name out there for a brilliant performance. Mentioned slide provides information about business client current investment portfolio split.It includes a graph presenting business stock and bond percentages, portfolio performance, etc.

Market Potential Property Listings Platform Pitch Deck PPT Sample
This slide presents a line graph showcasing the real estate platform market potential in Latin America. It also highlights market opportunities by highlighting market size forecast, CAGR, active user numbers in Latin America. Are you in need of a template that can accommodate all of your creative concepts This one is crafted professionally and can be altered to fit any style. Use it with Google Slides or PowerPoint. Include striking photographs, symbols, depictions, and other visuals. Fill, move around, or remove text boxes as desired. Test out color palettes and font mixtures. Edit and save your work, or work with colleagues. Download Market Potential Property Listings Platform Pitch Deck PPT Sample and observe how to make your presentation outstanding. Give an impeccable presentation to your group and make your presentation unforgettable. This slide presents a line graph showcasing the real estate platform market potential in Latin America.It also highlights market opportunities by highlighting market size forecast, CAGR, active user numbers in Latin America.
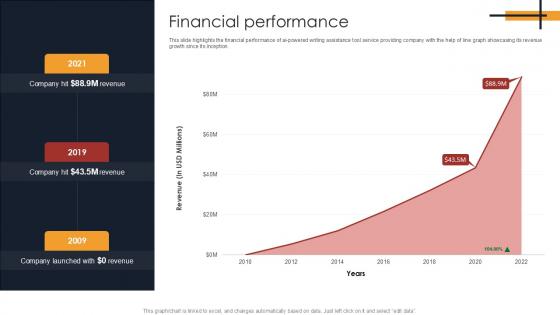
Financial Performance Writing Enhancement Software Pitch Deck PPT Example
This slide highlights the financial performance of ai powered writing assistance tool service providing company with the help of line graph showcasing its revenue growth since its inception. Find a pre designed and impeccable Financial Performance Writing Enhancement Software Pitch Deck PPT Example. The templates can ace your presentation without additional effort. You can download these easy to edit presentation templates to make your presentation stand out from others. So, what are you waiting for Download the template from Slidegeeks today and give a unique touch to your presentation. This slide highlights the financial performance of ai powered writing assistance tool service providing company with the help of line graph showcasing its revenue growth since its inception.
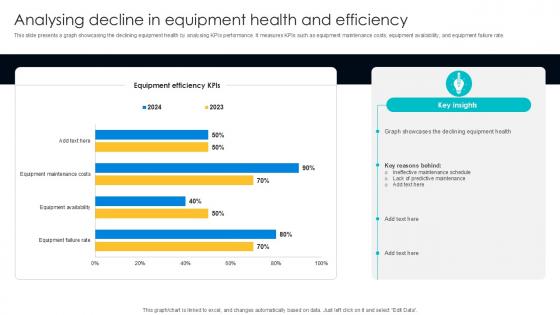
Analysing Decline In Equipment Digital Transformation Journey PPT Sample DT SS V
This slide presents a graph showcasing the declining equipment health by analysing KPIs performance. It measures KPIs such as equipment maintenance costs, equipment availability, and equipment failure rate. Slidegeeks is one of the best resources for PowerPoint templates. You can download easily and regulate Analysing Decline In Equipment Digital Transformation Journey PPT Sample DT SS V for your personal presentations from our wonderful collection. A few clicks is all it takes to discover and get the most relevant and appropriate templates. Use our Templates to add a unique zing and appeal to your presentation and meetings. All the slides are easy to edit and you can use them even for advertisement purposes. This slide presents a graph showcasing the declining equipment health by analysing KPIs performance. It measures KPIs such as equipment maintenance costs, equipment availability, and equipment failure rate.
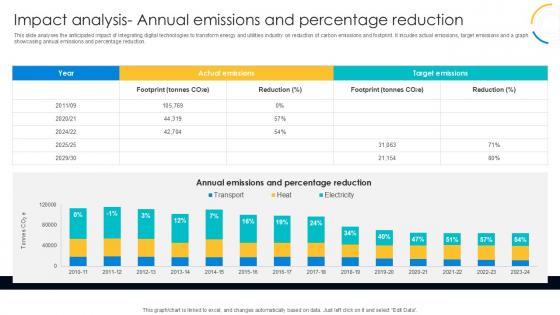
Impact Analysis Annual Emissions Digital Transformation Journey PPT Template DT SS V
This slide analyses the anticipated impact of integrating digital technologies to transform energy and utilities industry on reduction of carbon emissions and footprint. It incudes actual emissions, target emissions and a graph showcasing annual emissions and percentage reduction. The best PPT templates are a great way to save time, energy, and resources. Slidegeeks have 100 percent editable powerpoint slides making them incredibly versatile. With these quality presentation templates, you can create a captivating and memorable presentation by combining visually appealing slides and effectively communicating your message. Download Impact Analysis Annual Emissions Digital Transformation Journey PPT Template DT SS V from Slidegeeks and deliver a wonderful presentation. This slide analyses the anticipated impact of integrating digital technologies to transform energy and utilities industry on reduction of carbon emissions and footprint. It incudes actual emissions, target emissions and a graph showcasing annual emissions and percentage reduction.
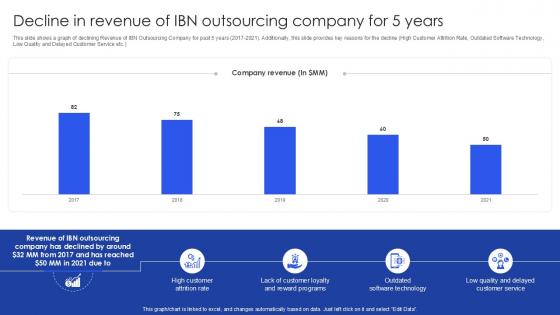
Decline In Revenue Of IBN Outsourcing Company For 5 Years PPT Example SS
This slide shows a graph of declining Revenue of IBN Outsourcing Company for past 5 years 2017-2021. Additionally, this slide provides key reasons for the decline High Customer Attrition Rate, Outdated Software Technology, Low Quality and Delayed Customer Service etc. From laying roadmaps to briefing everything in detail, our templates are perfect for you. You can set the stage with your presentation slides. All you have to do is download these easy-to-edit and customizable templates. Decline In Revenue Of IBN Outsourcing Company For 5 Years PPT Example SS will help you deliver an outstanding performance that everyone would remember and praise you for. Do download this presentation today. This slide shows a graph of declining Revenue of IBN Outsourcing Company for past 5 years 2017-2021. Additionally, this slide provides key reasons for the decline High Customer Attrition Rate, Outdated Software Technology, Low Quality and Delayed Customer Service etc.
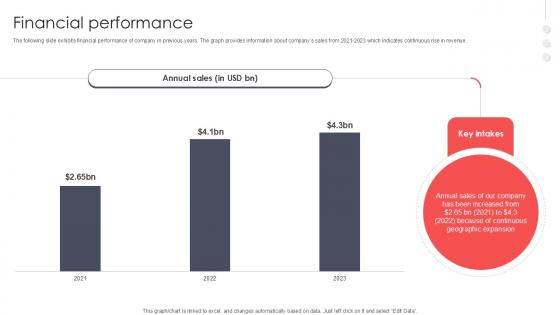
Financial Performance Virtual Meeting Investor Funding Elevator Pitch Deck PPT PowerPoint
The following slide exhibits financial performance of company in previous years. The graph provides information about companys sales from 2021-2023 which indicates continuous rise in revenue. From laying roadmaps to briefing everything in detail, our templates are perfect for you. You can set the stage with your presentation slides. All you have to do is download these easy-to-edit and customizable templates. Financial Performance Virtual Meeting Investor Funding Elevator Pitch Deck PPT PowerPoint will help you deliver an outstanding performance that everyone would remember and praise you for. Do download this presentation today. The following slide exhibits financial performance of company in previous years. The graph provides information about companys sales from 2021-2023 which indicates continuous rise in revenue.


 Continue with Email

 Home
Home


