Graphics
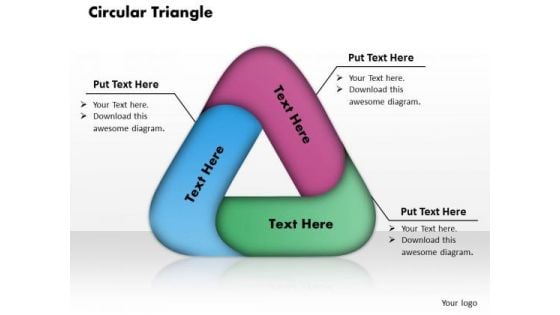
Circular Triangle PowerPoint Presentation Template
Our Circular Triangle PowerPoint Presentation Template Powerpoint Templates Abhor Doodling. They Never Let The Interest Flag. Our Business Strategy Powerpoint Templates Make Good Beasts Of Burden. Place All Your Demands On Them.
Clapboard PowerPoint Presentation Template
Deliver The Right Dose With Our clapboard PowerPoint Presentation Template Powerpoint Templates. Your Ideas Will Get The Correct Illumination. Your Abilities Have Been Lying Dormant. Awaken Them With Our Business Strategy Powerpoint Templates.
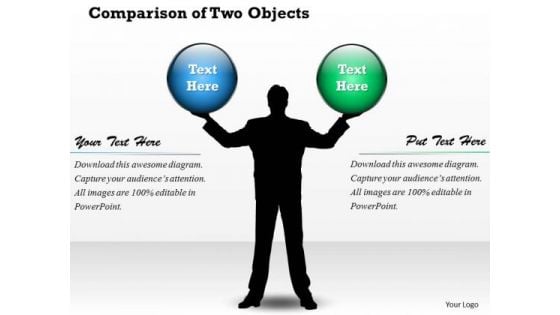
Comparison Of Two Objects PowerPoint Presentation Template
Our Comparison Of Two Objects PowerPoint Presentation Template Powerpoint Templates Deliver At Your Doorstep. Let Them In For A Wonderful Experience. Dig Out The Dope With Our Business Strategy Powerpoint Templates. Your Thoughts Will Expose The Truth.
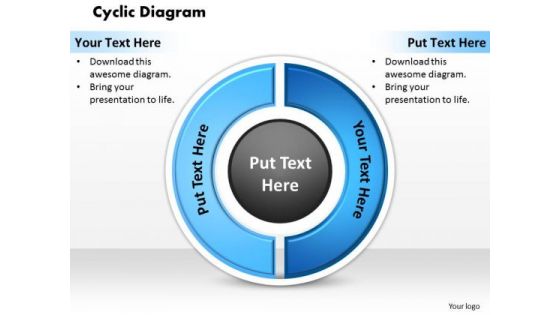
Cyclic Diagram PowerPoint Presentation Template
Connect The Dots With Our Cyclic Diagram PowerPoint Presentation Template Powerpoint Templates. Watch The Whole Picture Clearly Emerge. Dot Your Thoughts With Our Business Process Powerpoint Templates. Give Your Demeanor That Propel Look.
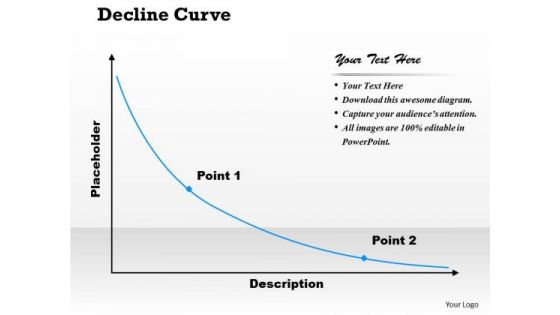
Decline Curve PowerPoint Presentation Template
Double Your Chances With Our Decline Curve PowerPoint Presentation Template Powerpoint Templates. The Value Of Your Thoughts Will Increase Two-Fold. Charm The Audience With Your Thoughts. Add Our Business Process Powerpoint Templates And They Will Be Dotty For You.
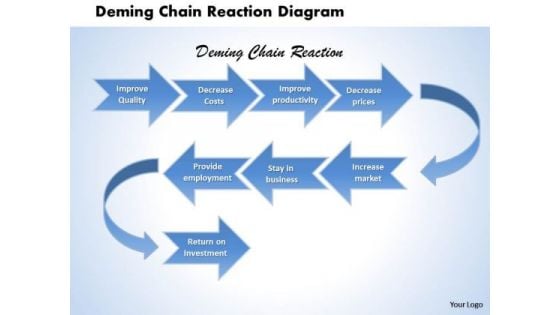
Deming Chain Reaction Diagram PowerPoint Presentation Template
Double Up Our Deming Chain Reaction Diagram PowerPoint Presentation Template Powerpoint Templates With Your Thoughts. They Will Make An Awesome Pair. When In Doubt Use Our Business Process Powerpoint Templates. The Way Ahead Will Become Crystal Clear.
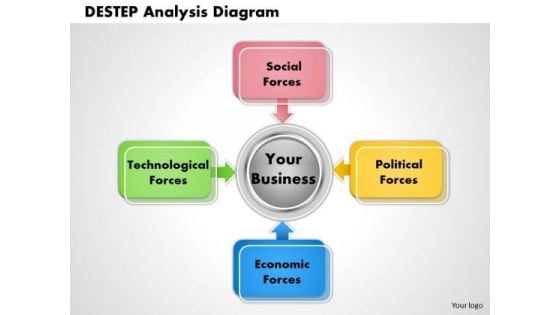
Destep Analysis Diagram PowerPoint Presentation Template
With Our Destep Analysis Diagram PowerPoint Presentation Template Powerpoint Templates You Will Be Doubly Sure. They Possess That Stamp Of Authority. Our Business Process Powerpoint Templates Do It In Double Quick Time. Speed Up The Process In A Tangible Way.
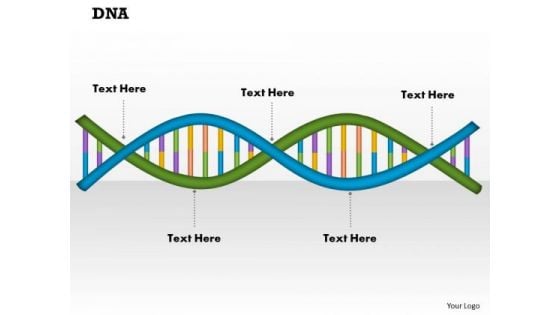
Dna PowerPoint Presentation Template
Our DNA PowerPoint Presentation Template Powerpoint Templates And Your Ideas Make A Great Doubles Pair. Play The Net With Assured Hands. Transfer The Dossier Onto Our Business Models Powerpoint Templates. Share Your Views On An Open Platform.
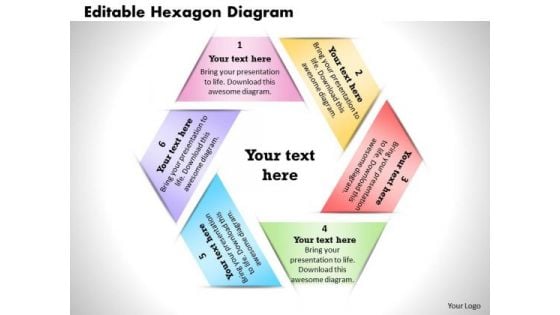
Editable Hexagon Diagram PowerPoint Presentation Template
Double The Impact With Our Editable Hexagon Diagram PowerPoint Presentation Template Powerpoint Templates. Your Thoughts Will Have An Imposing Effect. Knead The Dough With Our Business Models Powerpoint Templates. Your Thoughts Will Come Up Well.
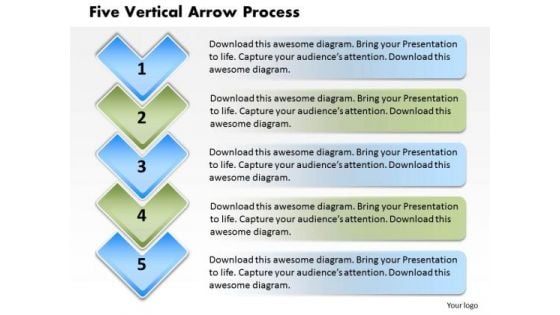
Five Vertical Arrow Process PowerPoint Presentation Template
Rake In The Dough With Your Ideas. Profits Will Rise With Our Five Vertical Arrow Process PowerPoint Presentation Template Powerpoint Templates. Dowse The Flames With Our Business Models Powerpoint Templates. Put Out The Fire Before It Starts.
Flip Clock PowerPoint Presentation Template
Plan For All Contingencies With Our Flip Clock PowerPoint Presentation Template Powerpoint Templates. Douse The Fire Before It Catches. Generate Camaraderie With Our Business Charts Powerpoint Templates. Good Wishes Will Come Raining Down.
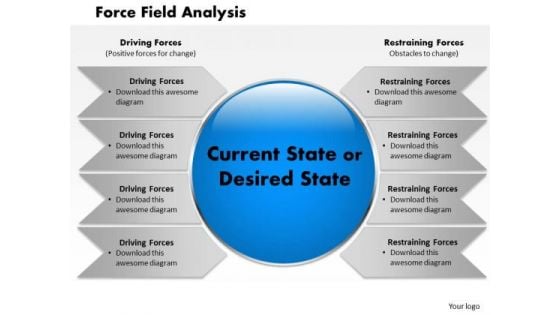
Force Field Anaysis PowerPoint Presentation Template
Good Camaraderie Is A Key To Teamwork. Our Force Field Analysis PowerPoint Presentation Template Powerpoint Templates Can Be A Cementing Force. Our Business Charts Powerpoint Templates Are An Agent Of Change. Let Your Thoughts Go Down Uncharted Courses.
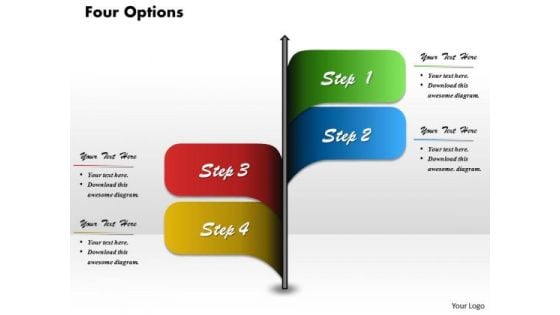
Four Options Diagram For PowerPoint Presentation Template
Brace Yourself, Arm Your Thoughts. Prepare For The Hustle With Our Four Options Diagram For PowerPoint Presentation Template Powerpoint Templates. Generate Ecstasy With Our Business Charts Powerpoint Templates. Your Thoughts Will Delight Your Audience.
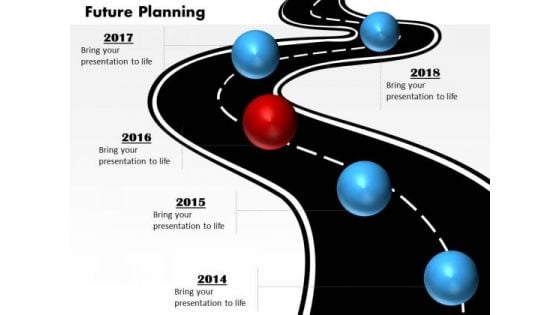
Future Plan PowerPoint Presentation Template
Delight Them With Our Future Plan PowerPoint Presentation Template Powerpoint Templates. Your Audience Will Be Ecstatic. Our Business Charts Powerpoint Templates Are Created Cost Effective. They Understand The Need For Economy.
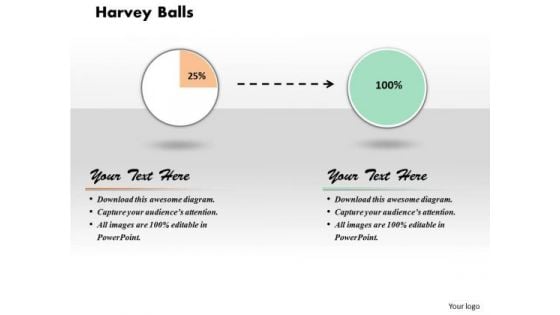
Harvey Balls PowerPoint Presentation Template
Touch Base With Our Harvey Balls PowerPoint Presentation Template Powerpoint Templates. Review Your Growth With Your Audience. Take A Deep Dive With Our Business Strategy Powerpoint Templates. Get Into The Nitti Gritty Of It All.
Heart Cardiogram PowerPoint Presentation Template
Plan Your Storyboard With Our Heart Cardiogram PowerPoint Presentation Template Powerpoint Templates. Give An Outline To The Solutions You Have. Give Power To Your Elbow With Our Business Strategy Powerpoint Templates. Get That Extra Information You Need.
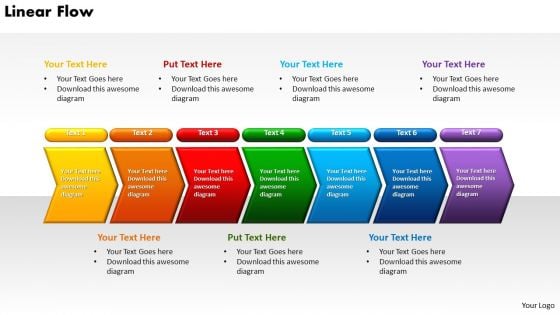
Linear Flow Power Point PowerPoint Presentation Template
Put Them On The Same Page With Our Linear Flow Power Point PowerPoint Presentation Template Powerpoint Templates. Your Team Will Sing From The Same Sheet. Push The Envelope With Our Business Strategy Powerpoint Templates. Let Your Thoughts Rise Above The Norm.

Man And Women Life PowerPoint Presentation Template
Our Man And Women life PowerPoint Presentation Template Powerpoint Templates Allow You To Do It With Ease. Just Like Picking The Low Hanging Fruit. Boil The Ocean With Your Thoughts. Our Business Strategy Powerpoint Templates Will Help Create Waves.
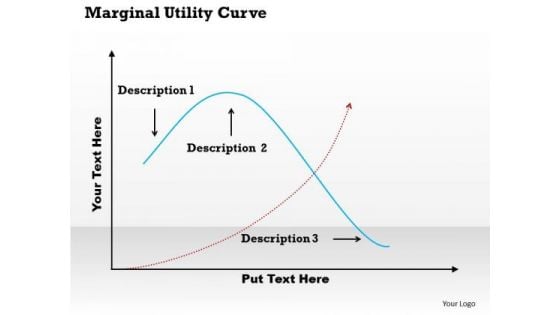
Marginal Utility Curve PowerPoint Presentation Template
Make Some Dough With Our Marginal Utility Curve PowerPoint Presentation Template Powerpoint Templates. Your Assets Will Rise Significantly. Your Approach Is Truly Down To Earth. Our Practical Business Process Powerpoint Templates Are Apt For You.

Music PowerPoint Presentation Template
Draft It Out On Our Music PowerPoint Presentation Template Powerpoint Templates. Give The Final Touches With Your Ideas. Get A Bakers Dozen With Our Business Process Powerpoint Templates. Receive That Little Bit More Than Expected.

Oar Model Organizational Learning PowerPoint Presentation Template
Reduce The Drag With Our OAR Model Organizational Learning PowerPoint Presentation Template Powerpoint Templates. Give More Lift To Your Thoughts. Your Thoughts Will Make A Dramatic Entry. Write The Script On Our Business Process Powerpoint Templates.
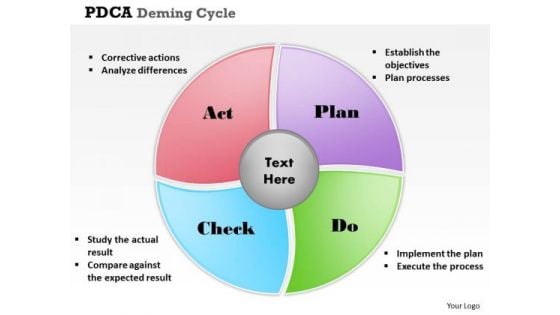
Pdca Deming Cycle PowerPoint Presentation Template
Our PDCA Deming Cycle PowerPoint Presentation Template Powerpoint Templates Enjoy Drama. They Provide Entertaining Backdrops. Our Business Process Powerpoint Templates Help To Make A Draft. They Give You A Good Place To Start.
Pentagon Diagram PowerPoint Presentation Template
Break The Deadlock With Our Pentagon Diagram PowerPoint Presentation Template Powerpoint Templates. Let The Words Start To Flow. Assert Your Capability With Our Business Models Powerpoint Templates. Give Your Thoughts That Decisive Touch.
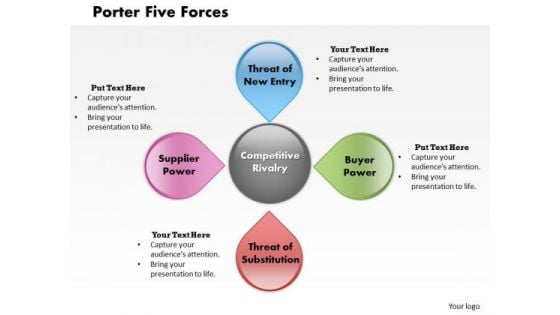
Porter Five Forces PowerPoint Presentation Template
Be The Dramatist With Our Porter Five Forces PowerPoint Presentation Template Powerpoint Templates. Script Out The Play Of Words. Put Our Business Models Powerpoint Templates Into The Draw. Your Thoughts Will Win The Lottery.

Process Flow PowerPoint Presentation Template
Add Some Dramatization To Your Thoughts. Our Process Flow PowerPoint Presentation Template Powerpoint Templates Make Useful Props. Draw Ahead Of Others With Our Business Models Powerpoint Templates. Cross The Line And Win The Race.

Product Adoption Model PowerPoint Presentation Template 1
Draw Out The Best In You With Our product Adoption Model PowerPoint Presentation Template 1 Powerpoint Templates. Let Your Inner Brilliance Come To The Surface. Draw Out The Talents Of Your Team. Use Our Business Models Powerpoint Templates To Give Them An Incentive.
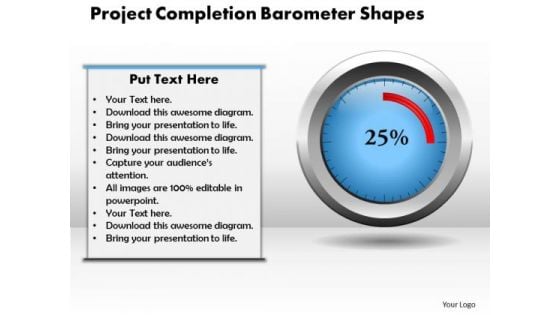
Project Completion Barometer PowerPoint Template
Draw On The Experience Of Our Project Completion Barometer PowerPoint Template Powerpoint Templates. They Imbibe From Past Masters. Drink The Nectar Of Our Business Charts Powerpoint Templates. Give Your Thoughts A Long Life.
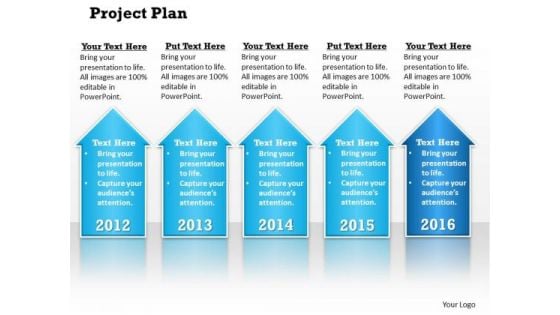
Project Plan PowerPoint Presentation Template
Draw It Out On Our Project Plan PowerPoint Presentation Template Powerpoint Templates. Provide Inspiration To Your Colleagues. Motivate The Disheartened With Our Business Charts Powerpoint Templates. Inspire Them With The Goodness In You.
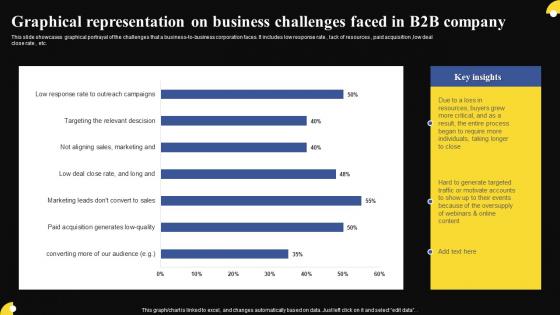
Graphical Representation On Business Challenges Faced In B2b Company Slides Pdf
This slide showcases graphical portrayal of the challenges that a business-to-business corporation faces. It includes low response rate, lack of resources, paid acquisition, low deal close rate, etc. Showcasing this set of slides titled Graphical Representation On Business Challenges Faced In B2b Company Slides Pdf The topics addressed in these templates are Graphical Representation On Business, Challenges Faced In B2B Company All the content presented in this PPT design is completely editable. Download it and make adjustments in color, background, font etc. as per your unique business setting. This slide showcases graphical portrayal of the challenges that a business-to-business corporation faces. It includes low response rate, lack of resources, paid acquisition, low deal close rate, etc.
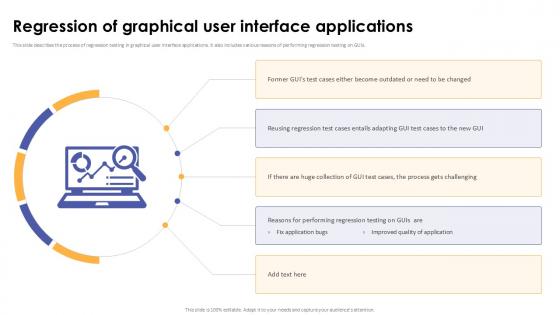
Regression Of Graphical User Interface Applications Corrective Regression Testing Ppt Slide
This slide describes the process of regression testing in graphical user interface applications. It also includes various reasons of performing regression testing on GUIs. Whether you have daily or monthly meetings, a brilliant presentation is necessary. Regression Of Graphical User Interface Applications Corrective Regression Testing Ppt Slide can be your best option for delivering a presentation. Represent everything in detail using Regression Of Graphical User Interface Applications Corrective Regression Testing Ppt Slide and make yourself stand out in meetings. The template is versatile and follows a structure that will cater to your requirements. All the templates prepared by Slidegeeks are easy to download and edit. Our research experts have taken care of the corporate themes as well. So, give it a try and see the results. This slide describes the process of regression testing in graphical user interface applications. It also includes various reasons of performing regression testing on GUIs.
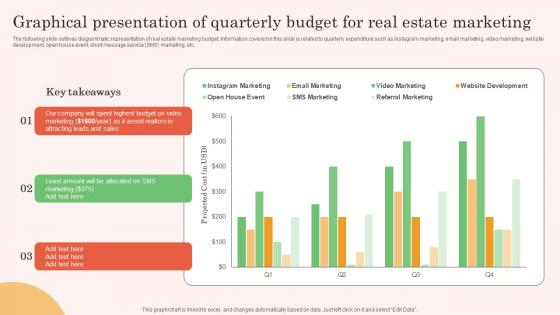
Graphical Presentation Of Quarterly Budget Real Estate Property Marketing Elements Pdf
The following slide outlines diagrammatic representation of real estate marketing budget. Information covered in this slide is related to quarterly expenditure such as Instagram marketing, email marketing, video marketing, website development, open house event, short message service SMS marketing, etc.Crafting an eye-catching presentation has never been more straightforward. Let your presentation shine with this tasteful yet straightforward Graphical Presentation Of Quarterly Budget Real Estate Property Marketing Elements Pdf template. It offers a minimalistic and classy look that is great for making a statement. The colors have been employed intelligently to add a bit of playfulness while still remaining professional. Construct the ideal Graphical Presentation Of Quarterly Budget Real Estate Property Marketing Elements Pdf that effortlessly grabs the attention of your audience. Begin now and be certain to wow your customers. The following slide outlines diagrammatic representation of real estate marketing budget. Information covered in this slide is related to quarterly expenditure such as Instagram marketing, email marketing, video marketing, website development, open house event, short message service SMS marketing, etc.
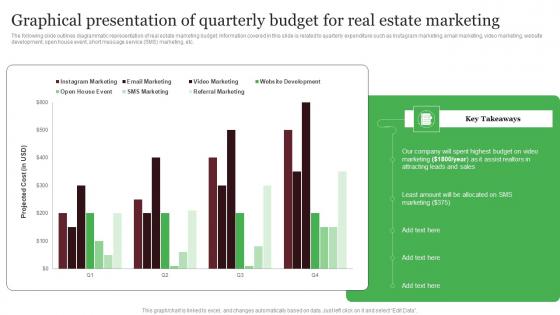
Graphical Presentation Of Quarterly Budget For Real Estate Out Of The Box Real Designs Pdf
The following slide outlines diagrammatic representation of real estate marketing budget. Information covered in this slide is related to quarterly expenditure such as Instagram marketing, email marketing, video marketing, website development, open house event, short message service SMS marketing, etc. Crafting an eye-catching presentation has never been more straightforward. Let your presentation shine with this tasteful yet straightforward Graphical Presentation Of Quarterly Budget For Real Estate Out Of The Box Real Designs Pdf template. It offers a minimalistic and classy look that is great for making a statement. The colors have been employed intelligently to add a bit of playfulness while still remaining professional. Construct the ideal Graphical Presentation Of Quarterly Budget For Real Estate Out Of The Box Real Designs Pdf that effortlessly grabs the attention of your audience Begin now and be certain to wow your customers The following slide outlines diagrammatic representation of real estate marketing budget. Information covered in this slide is related to quarterly expenditure such as Instagram marketing, email marketing, video marketing, website development, open house event, short message service SMS marketing, etc.
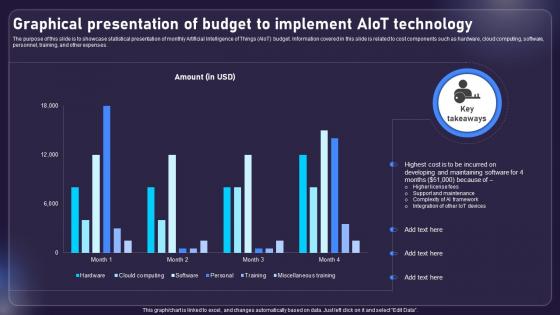
Graphical Presentation Of Budget To Implement AIOT AIOT Applications For Various Industries IoT SS V
The purpose of this slide is to showcase statistical presentation of monthly Artificial Intelligence of Things AIoT budget. Information covered in this slide is related to cost components such as hardware, cloud computing, software, personnel, training, and other expenses. This modern and well-arranged Graphical Presentation Of Budget To Implement AIOT AIOT Applications For Various Industries IoT SS V provides lots of creative possibilities. It is very simple to customize and edit with the Powerpoint Software. Just drag and drop your pictures into the shapes. All facets of this template can be edited with Powerpoint, no extra software is necessary. Add your own material, put your images in the places assigned for them, adjust the colors, and then you can show your slides to the world, with an animated slide included. The purpose of this slide is to showcase statistical presentation of monthly Artificial Intelligence of Things AIoT budget. Information covered in this slide is related to cost components such as hardware, cloud computing, software, personnel, training, and other expenses.
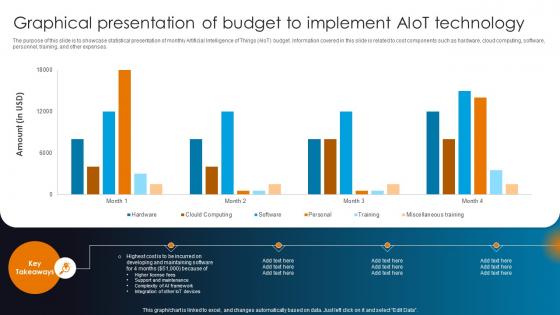
Integrating AI With IoT Graphical Presentation Of Budget To Implement AIoT Technology IoT SS V
The purpose of this slide is to showcase statistical presentation of monthly Artificial Intelligence of Things AIoT budget. Information covered in this slide is related to cost components such as hardware, cloud computing, software, personnel, training, and other expenses. Coming up with a presentation necessitates that the majority of the effort goes into the content and the message you intend to convey. The visuals of a PowerPoint presentation can only be effective if it supplements and supports the story that is being told. Keeping this in mind our experts created Integrating AI With IoT Graphical Presentation Of Budget To Implement AIoT Technology IoT SS V to reduce the time that goes into designing the presentation. This way, you can concentrate on the message while our designers take care of providing you with the right template for the situation. The purpose of this slide is to showcase statistical presentation of monthly Artificial Intelligence of Things AIoT budget. Information covered in this slide is related to cost components such as hardware, cloud computing, software, personnel, training, and other expenses.
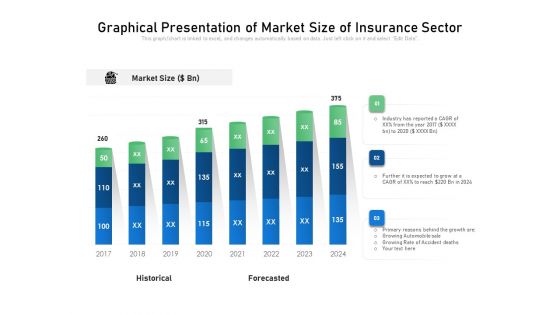
Graphical Presentation Of Market Size Of Insurance Sector Ppt PowerPoint Presentation Portfolio Brochure PDF
Pitch your topic with ease and precision using this graphical presentation of market size of insurance sector ppt powerpoint presentation portfolio brochure pdf. This layout presents information on historical, forecasted, market size. It is also available for immediate download and adjustment. So, changes can be made in the color, design, graphics or any other component to create a unique layout.
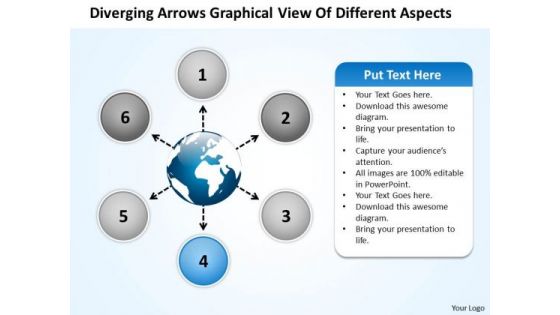
Arrows Graphical View Of Different Aspects Arrow Charts And Diagrams PowerPoint Templates
We present our arrows graphical view of different aspects arrow Charts and Diagrams PowerPoint templates.Download our Business PowerPoint Templates because the great Bald headed Eagle embodies your personality. the eagle eye to seize upon the smallest of opportunities. Download our Arrows PowerPoint Templates because it helps you to get your team in the desired sequence into the bracket. Download our Shapes PowerPoint Templates because the graphic is a symbol of growth and success. Present our Flow Charts PowerPoint Templates because this helps you to comprehend your plan to get the entire act together. Download and present our Process and Flows PowerPoint Templates because it can illustrate your chain of ideas focusing on that aspect or resource in order to enhance the quality of your product.Use these PowerPoint slides for presentations relating to Arrow, Business, Button, Chart, Circle, Company, Cross, Data, Design, Diagram, Direction, Document, Financial, Management, Marketing, Multiple, Plan, Presentation, Process, Results, Sphere, Template, Website, Wheel. The prominent colors used in the PowerPoint template are Blue, White, Gray. Presenters tell us our arrows graphical view of different aspects arrow Charts and Diagrams PowerPoint templates are Exuberant. We assure you our Cross PowerPoint templates and PPT Slides are Amazing. Presenters tell us our arrows graphical view of different aspects arrow Charts and Diagrams PowerPoint templates are the best it can get when it comes to presenting. Use our Circle PowerPoint templates and PPT Slides are Graceful. We assure you our arrows graphical view of different aspects arrow Charts and Diagrams PowerPoint templates are Second to none. You can be sure our Circle PowerPoint templates and PPT Slides are Delightful. Our Arrows Graphical View Of Different Aspects Arrow Charts And Diagrams PowerPoint Templates define the standards. Like you they excel at what they do.
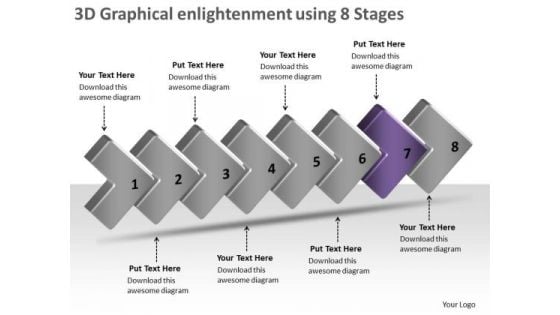
3d Graphical Enlightenment Using 8 Stages Make Flow Charts PowerPoint Slides
We present our 3d graphical enlightenment using 8 stages make flow charts PowerPoint Slides. Use our Marketing PowerPoint Templates because, you have the process in your head, our template design showing will illuminate your thoughts. Use our Shapes PowerPoint Templates because, aesthetically designed to make a great first impression this template highlights. Use our Business PowerPoint Templates because; enlighten others on the process with this innovative graphic to authenticate your plan of achieving the goal of added value/profit. Use our Process and Flows PowerPoint Templates because; Use them to your advantage to priorities your ideas. Use our Arrows PowerPoint Templates because, now spread the fruits of your efforts and elaborate your ideas on the prevention, diagnosis, control and cure of prevalent diseases. Use these PowerPoint slides for presentations relating to 3d, arrow, background, bullet, business, chart, checkmark, chevron, diagram, drop, financial, five, glass, graphic, gray, icon, illustration, management, point, process, project, reflection, set, shadow, stage, text, transparency, vector, white. The prominent colors used in the PowerPoint template are Purple, Black, and Gray Perform admirably with our 3d Graphical Enlightenment Using 8 Stages Make Flow Charts PowerPoint Slides. Download without worries with our money back guaranteee.
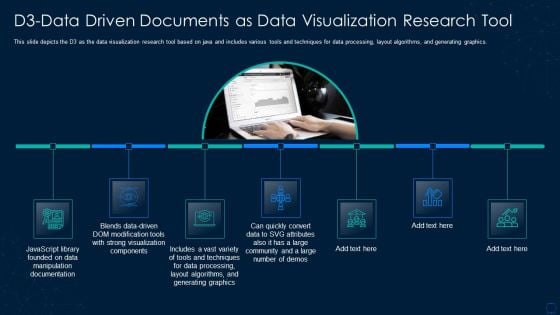
Graphical Representation Of Research IT D3 Data Driven Documents Infographics PDF
This slide depicts the D3 as the data visualization research tool based on java and includes various tools and techniques for data processing, layout algorithms, and generating graphics. Presenting graphical representation of research it d3 data driven documents infographics pdf to provide visual cues and insights. Share and navigate important information on seven stages that need your due attention. This template can be used to pitch topics like documentation, graphics, techniques, community. In addtion, this PPT design contains high resolution images, graphics, etc, that are easily editable and available for immediate download.
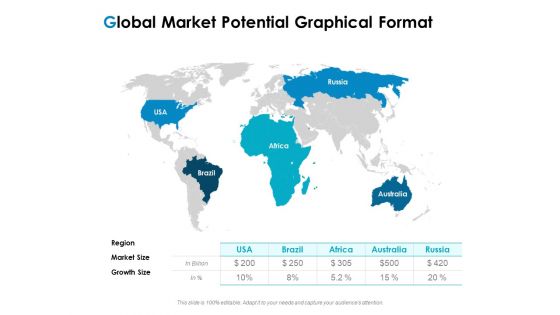
Strategic Marketing Plan Global Market Potential Graphical Format Ppt Inspiration Grid PDF
Presenting strategic marketing plan global market potential graphical format ppt inspiration grid pdf to provide visual cues and insights. Share and navigate important information on five stages that need your due attention. This template can be used to pitch topics like global market potential, graphical, region, market size, growth size. In addition, this PPT design contains high-resolution images, graphics, etc, that are easily editable and available for immediate download.
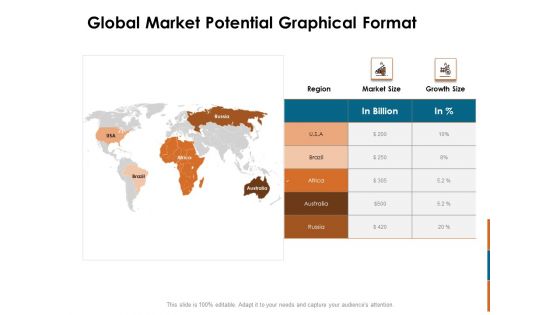
Key Statistics Of Marketing Global Market Potential Graphical Format Ppt PowerPoint Presentation Outline Ideas PDF
Presenting key statistics of marketing global market potential graphical format ppt powerpoint presentation outline ideas pdf to provide visual cues and insights. Share and navigate important information on five stages that need your due attention. This template can be used to pitch topics like global market potential, graphical, region, market size, growth size. In addition, this PPT design contains high-resolution images, graphics, etc, that are easily editable and available for immediate download.
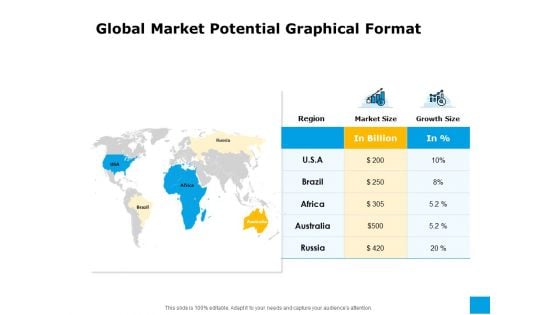
Effective Advertising And Sales Management Global Market Potential Graphical Format Ppt Infographic Template Deck PDF
Presenting effective advertising and sales management global market potential graphical format ppt infographic template deck pdf to provide visual cues and insights. Share and navigate important information on five stages that need your due attention. This template can be used to pitch topics like global market potential, graphical, region, market size, growth size. In addition, this PPT design contains high-resolution images, graphics, etc, that are easily editable and available for immediate download.
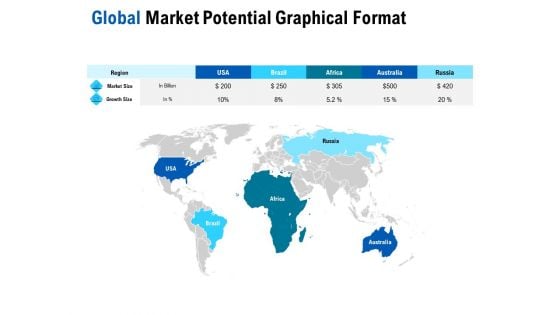
Competition In Market Global Market Potential Graphical Format Ppt Ideas Designs PDF
Presenting competition in market global market potential graphical format ppt ideas designs pdf. to provide visual cues and insights. Share and navigate important information on one stages that need your due attention. This template can be used to pitch topics like market size, growth size. In addtion, this PPT design contains high-resolution images, graphics, etc, that are easily editable and available for immediate download.
Graphical Representation Of Research IT Information Visualization Research Branch Icons PDF
This slide explains information visualization as a branch of visualization research that includes visuals like histograms, trend graphs, flow charts. Presenting graphical representation of research it information visualization research branch icons pdf to provide visual cues and insights. Share and navigate important information on four stages that need your due attention. This template can be used to pitch topics like geographic, information, design. In addtion, this PPT design contains high resolution images, graphics, etc, that are easily editable and available for immediate download.
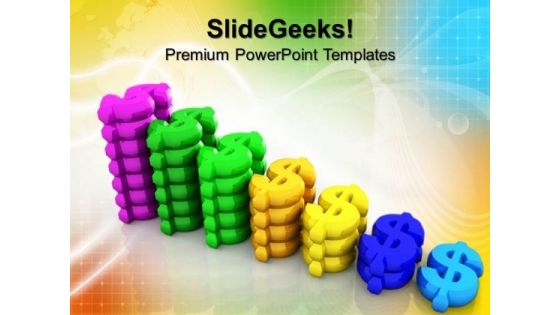
Graphical Illustration Of Dollar Success PowerPoint Templates And PowerPoint Themes 0912
Graphical Illustration Of Dollar Success PowerPoint Templates And PowerPoint Themes 0912-Microsoft Powerpoint Templates and Background with graphical illustration of dollar Our Graphical Illustration Of Dollar Success PowerPoint Templates And PowerPoint Themes 0912 consider you family. They express their affection in a colorful way.
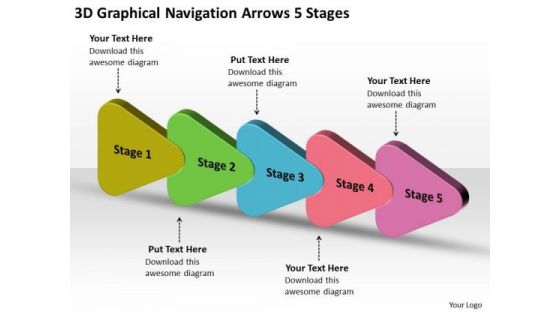
3d Graphical Navigation Arrows 5 Stages Online Flow Chart Creator PowerPoint Templates
We present our 3d graphical navigation arrows 5 stages online flow chart creator PowerPoint templates. Use our Arrows PowerPoint Templates because; you know the path so show the way. Use our Marketing PowerPoint Templates because; transmit your passion via our creative templates. Use our Success PowerPoint Templates because, Inspired by the indelible Olympic logo this graphic exemplifies the benefits of teamwork. Use our Process and Flows PowerPoint Templates because, Will surely see the all making the grade. Use our Business PowerPoint Templates because, creating a winner is your passion and dream. Use these PowerPoint slides for presentations relating to Abstract, Arrow, Arrows, Business, Chart, Design, Development, Diagram, Direction, Element, Flow, Flowchart, Graph, Linear, Management, Model, Motion, Organization, Plan, Process, Program, Section, Segment, Set, Sign, Solution, Strategy, Symbol, Technology. The prominent colors used in the PowerPoint template are Green, Pink, and Blue Success without failure is difficult to achieve. Our 3d Graphical Navigation Arrows 5 Stages Online Flow Chart Creator PowerPoint Templates help add to the chances.
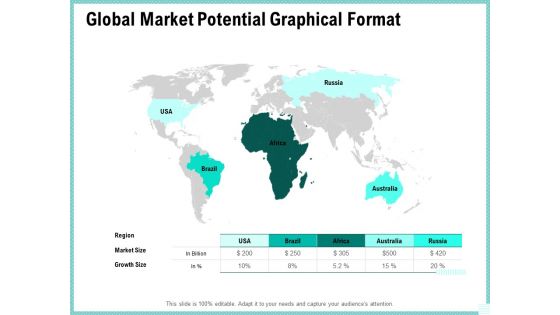
Advertisement Administration Global Market Potential Graphical Format Ppt Summary Pictures PDF
Presenting advertisement administration global market potential graphical format ppt summary pictures pdf to provide visual cues and insights. Share and navigate important information on five stages that need your due attention. This template can be used to pitch topics like market size, growth size, global market. In addition, this PPT design contains high-resolution images, graphics, etc, that are easily editable and available for immediate download.
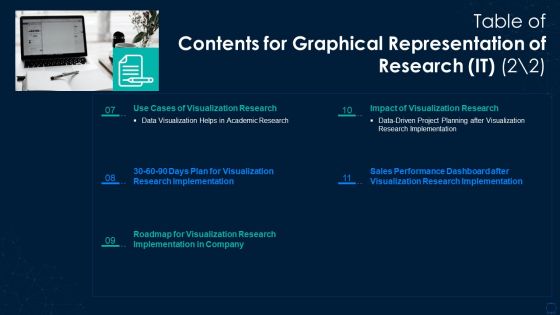
Table Of Contents For Graphical Representation Of Research IT Data Elements PDF
Presenting table of contents for graphical representation of research it data elements pdf to provide visual cues and insights. Share and navigate important information on five stages that need your due attention. This template can be used to pitch topics like implementation, plan, sales performance. In addtion, this PPT design contains high resolution images, graphics, etc, that are easily editable and available for immediate download.
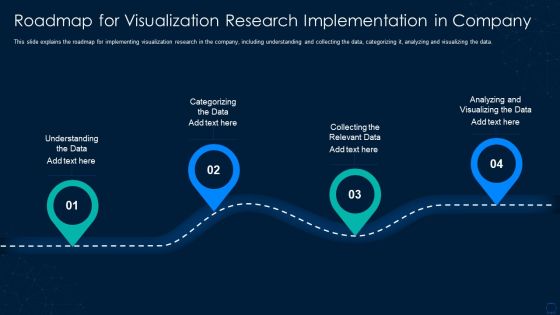
Graphical Representation Of Research IT Roadmap For Visualization Research Summary PDF
This slide explains the roadmap for implementing visualization research in the company, including understanding and collecting the data, categorizing it, analyzing and visualizing the data. Presenting graphical representation of research it roadmap for visualization research summary pdf to provide visual cues and insights. Share and navigate important information on four stages that need your due attention. This template can be used to pitch topics like roadmap for visualization research implementation in company. In addtion, this PPT design contains high resolution images, graphics, etc, that are easily editable and available for immediate download.
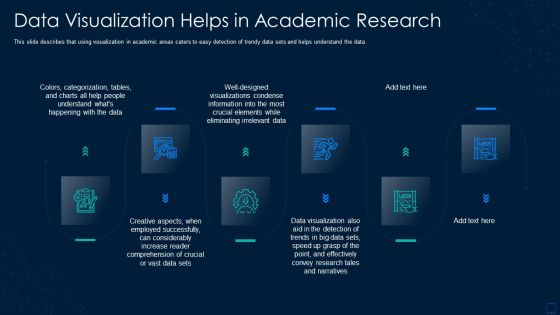
Graphical Representation Of Research IT Data Visualization Helps In Academic Research Microsoft PDF
This slide describes that using visualization in academic areas caters to easy detection of trendy data sets and helps understand the data. Presenting graphical representation of research it data visualization helps in academic research microsoft pdf to provide visual cues and insights. Share and navigate important information on six stages that need your due attention. This template can be used to pitch topics like data visualization helps in academic research. In addtion, this PPT design contains high resolution images, graphics, etc, that are easily editable and available for immediate download.
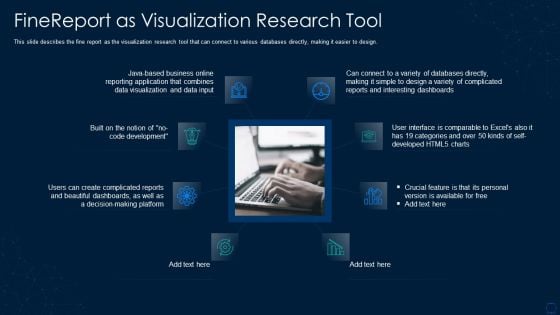
Graphical Representation Of Research IT Finereport As Visualization Research Tool Structure PDF
This slide describes the fine report as the visualization research tool that can connect to various databases directly, making it easier to design. Presenting graphical representation of research it finereport as visualization research tool structure pdf to provide visual cues and insights. Share and navigate important information on eight stages that need your due attention. This template can be used to pitch topics like application, dashboards, databases. In addtion, this PPT design contains high resolution images, graphics, etc, that are easily editable and available for immediate download.
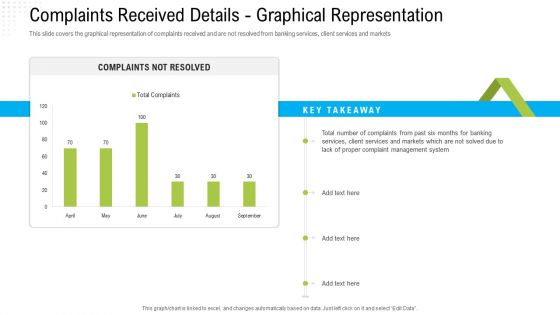
Robotization In Issues Management Complaints Received Details Graphical Representation Microsoft PDF
This slide covers the graphical representation of complaints received and are not resolved from banking services, client services and markets. Deliver and pitch your topic in the best possible manner with this robotization in issues management complaints received details graphical representation microsoft pdf. Use them to share invaluable insights on services and markets, management system, complaints received details - graphical representation and impress your audience. This template can be altered and modified as per your expectations. So, grab it now.
Graphical Representation Of Data Vector Icon Ppt PowerPoint Presentation File Design Templates PDF
Presenting this set of slides with name graphical representation of data vector icon ppt powerpoint presentation file design templates pdf. This is a three stage process. The stages in this process are graphical representation of data vector icon. This is a completely editable PowerPoint presentation and is available for immediate download. Download now and impress your audience.
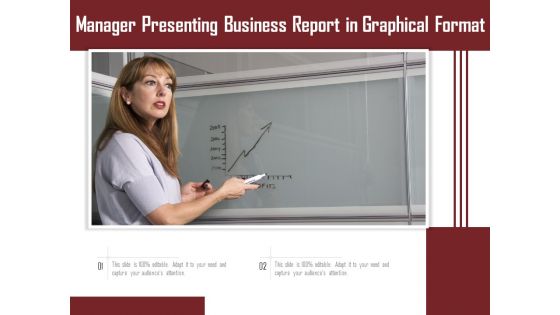
Manager Presenting Business Report In Graphical Format Ppt PowerPoint Presentation Model Slides PDF
Presenting this set of slides with name manager presenting business report in graphical format ppt powerpoint presentation model slides pdf. This is a two stage process. The stages in this process are manager presenting business report in graphical format. This is a completely editable PowerPoint presentation and is available for immediate download. Download now and impress your audience.

Graphical Representation Of Data With Bar Graph Ppt PowerPoint Presentation Outline Format PDF
Presenting graphical representation of data with bar graph ppt powerpoint presentation outline format pdf to dispense important information. This template comprises three stages. It also presents valuable insights into the topics including graphical representation of data with bar graph. This is a completely customizable PowerPoint theme that can be put to use immediately. So, download it and address the topic impactfully.
Graphical Representation Of Corporate Financial Challenges Icon Ppt Model Demonstration PDF
Presenting Graphical Representation Of Corporate Financial Challenges Icon Ppt Model Demonstration PDF to dispense important information. This template comprises four stages. It also presents valuable insights into the topics including Graphical Representation, Corporate Financial, Challenges Icon. This is a completely customizable PowerPoint theme that can be put to use immediately. So, download it and address the topic impactfully.
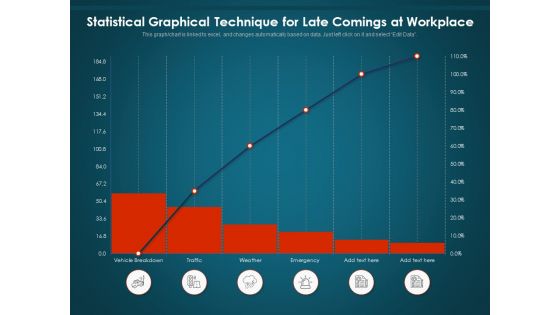
Statistical Graphical Technique For Late Comings At Workplace Ppt PowerPoint Presentation File Outline PDF
Presenting this set of slides with name statistical graphical technique for late comings at workplace ppt powerpoint presentation file outline pdf. The topics discussed in these slide is statistical graphical technique for late comings at workplace. This is a completely editable PowerPoint presentation and is available for immediate download. Download now and impress your audience.
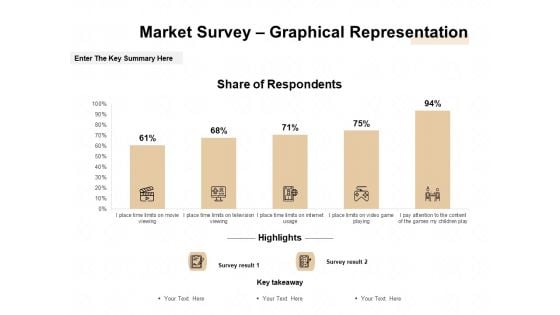
Market Sizing Market Survey Graphical Representation Ppt Infographic Template Examples PDF
Presenting this set of slides with name market sizing market survey graphical representation ppt infographic template examples pdf. The topics discussed in these slides are market survey graphical representation. This is a completely editable PowerPoint presentation and is available for immediate download. Download now and impress your audience.
TAM SAM And SOM Market Survey Graphical Representation Ppt Ideas Icon PDF
Deliver an awe-inspiring pitch with this creative tam sam and som market survey graphical representation ppt ideas icon pdf bundle. Topics like market survey graphical representation can be discussed with this completely editable template. It is available for immediate download depending on the needs and requirements of the user.
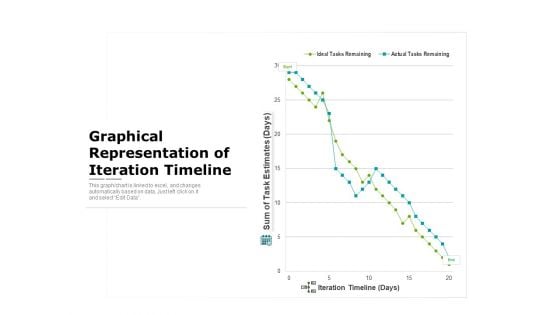
Graphical Representation Of Iteration Timeline Ppt PowerPoint Presentation File Styles PDF
Showcasing this set of slides titled graphical representation of iteration timeline ppt powerpoint presentation file styles pdf. The topics addressed in these templates are graphical representation of iteration timeline. All the content presented in this PPT design is completely editable. Download it and make adjustments in color, background, font etc. as per your unique business setting.
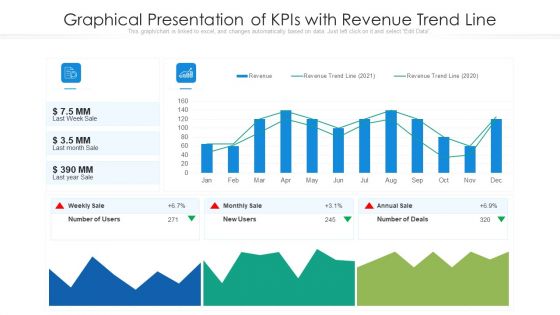
Graphical Presentation Of Kpis With Revenue Trend Line Ppt Inspiration Example Introduction PDF
Deliver and pitch your topic in the best possible manner with this graphical presentation of kpis with revenue trend line ppt inspiration example introduction pdf. Use them to share invaluable insights on graphical presentation of kpis with revenue trend line and impress your audience. This template can be altered and modified as per your expectations. So, grab it now.


 Continue with Email

 Home
Home


