Graphics
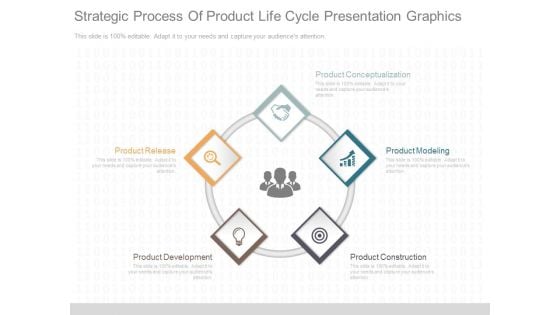
Strategic Process Of Product Life Cycle Presentation Graphics
This is a strategic process of product life cycle presentation graphics. This is a five stage process. The stages in this process are product conceptualization, product modeling, product construction, product development, product release.
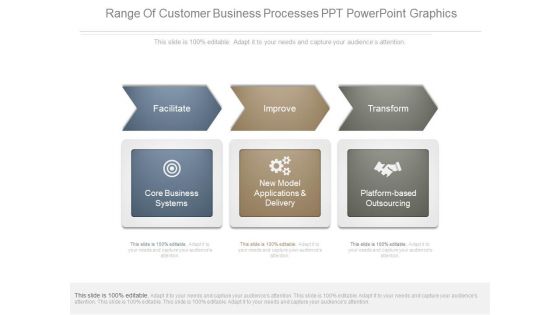
Range Of Customer Business Processes Ppt Powerpoint Graphics
This is a range of customer business processes ppt powerpoint graphics. This is a three stage process. The stages in this process are facilitate, improve, transform, core business systems, new model applications and delivery, platform based outsourcing.
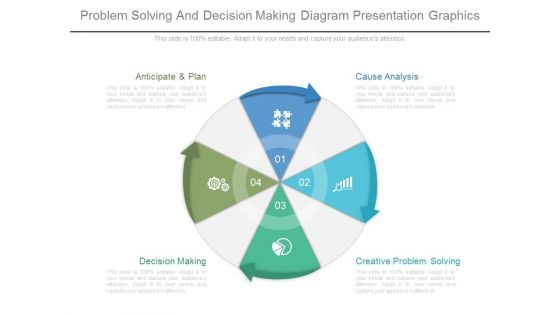
Problem Solving And Decision Making Diagram Presentation Graphics
This is a problem solving and decision making diagram presentation graphics. This is a four stage process. The stages in this process are anticipate and plan, decision making, creative problem solving, cause analysis.
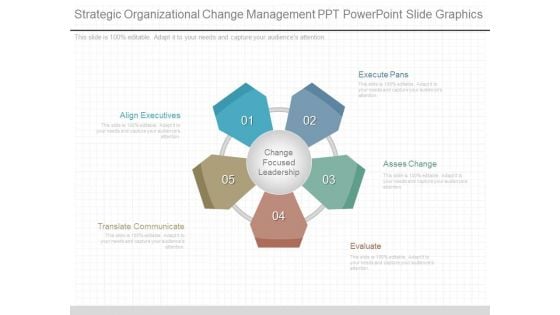
Strategic Organizational Change Management Ppt Powerpoint Slide Graphics
This is a strategic organizational change management ppt powerpoint slide graphics. This is a five stage process. The stages in this process are execute pans, asses change, evaluate, translate communicate, align executives, change focused leadership.
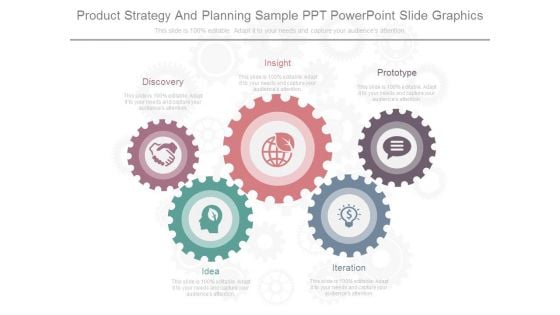
Product Strategy And Planning Sample Ppt Powerpoint Slide Graphics
This is a product strategy and planning sample ppt powerpoint slide graphics. This is a five stage process. The stages in this process are discovery, insight, prototype, idea, iteration.

Levels Of Pricing Management Sample Diagram Powerpoint Slide Graphics
This is a levels of pricing management sample diagram powerpoint slide graphics. This is a five stage process. The stages in this process are customers needs, competition, cost, marketing, distribution channel.
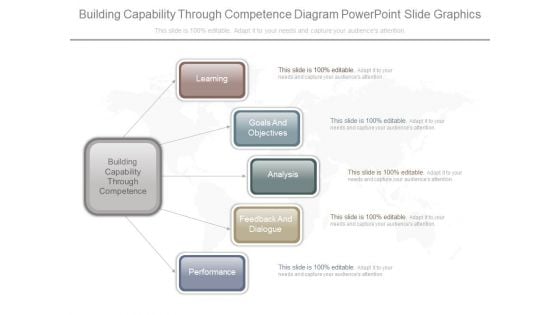
Building Capability Through Competence Diagram Powerpoint Slide Graphics
This is a building capability through competence diagram powerpoint slide graphics. This is a five stage process. The stages in this process are building capability through competence, learning, goals and, objectives, analysis, feedback and, dialogue, performance.
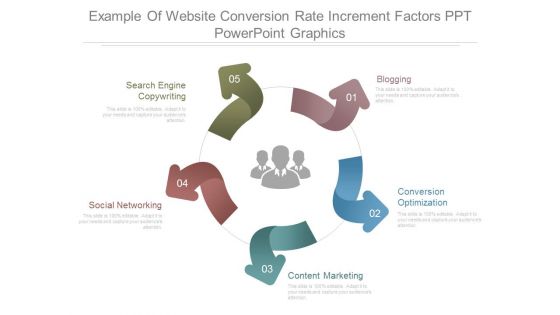
Example Of Website Conversion Rate Increment Factors Ppt Powerpoint Graphics
This is a example of website conversion rate increment factors ppt powerpoint graphics. This is a five stage process. The stages in this process are search engine copywriting, blogging, conversion optimization, content marketing, social networking.
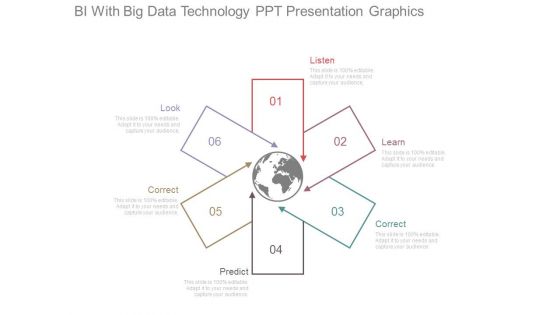
Bi With Big Data Technology Ppt Presentation Graphics
This is a bi with big data technology ppt presentation graphics. This is a six stage process. The stages in this process are listen, learn, correct, look, correct, predict.

Example Of Optimized Investment Sample Diagram Powerpoint Graphics
This is a example of optimized investment sample diagram powerpoint graphics. This is a eight stage process. The stages in this process are customer, performance, profit, capital protection, leverage, yield enhancement, sales, brand growth.
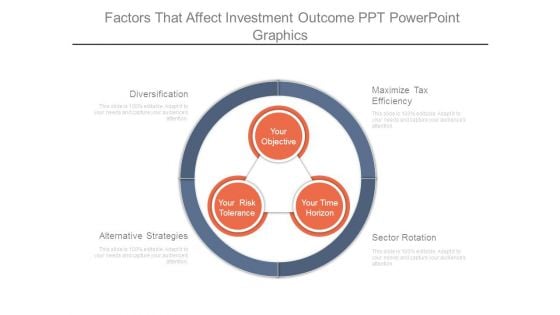
Factors That Affect Investment Outcome Ppt Powerpoint Graphics
This is a factors that affect investment outcome ppt powerpoint graphics. This is a four stage process. The stages in this process are your objective, your risk tolerance, your time horizon, alternative strategies, diversification, maximize tax efficiency, sector rotation.
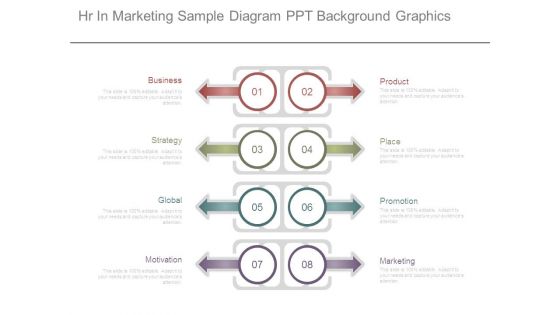
Hr In Marketing Sample Diagram Ppt Background Graphics
This is a hr in marketing sample diagram ppt background graphics. This is a eight stage process. The stages in this process are business, product, strategy, place, global, promotion, motivation, marketing.
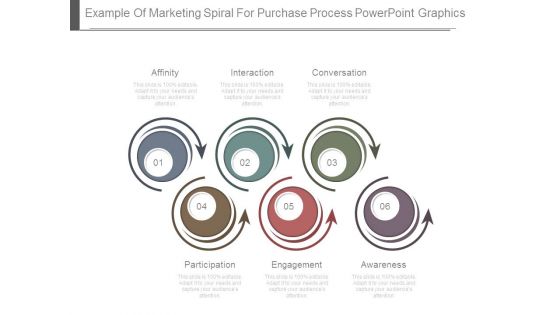
Example Of Marketing Spiral For Purchase Process Powerpoint Graphics
This is a example of marketing spiral for purchase process powerpoint graphics. This is a six stage process. The stages in this process are affinity, interaction, conversation, participation, engagement, awareness.
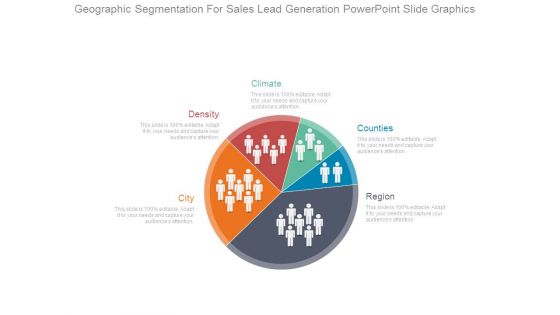
Geographic Segmentation For Sales Lead Generation Powerpoint Slide Graphics
This is a geographic segmentation for sales lead generation powerpoint slide graphics. This is a five stage process. The stages in this process are city, density, climate, counties, region.
Product Demo For Digital Media Powerpoint Slide Graphics
This is a product demo for digital media powerpoint slide graphics. This is a one stage process. The stages in this process are business, process, marketing, strategy, technology, computer.
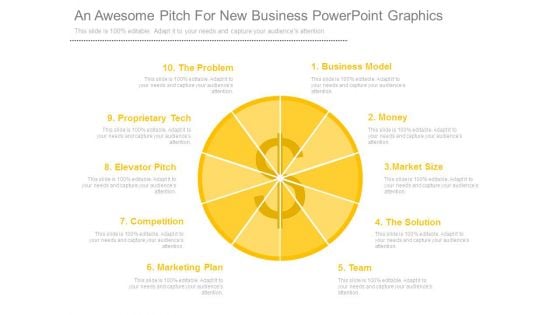
An Awesome Pitch For New Business Powerpoint Graphics
This is a an awesome pitch for new business powerpoint graphics. This is a ten stage process. The stages in this process are the problem, proprietary tech, elevator pitch, competition, marketing plan, business model, money, market size, the solution, team.
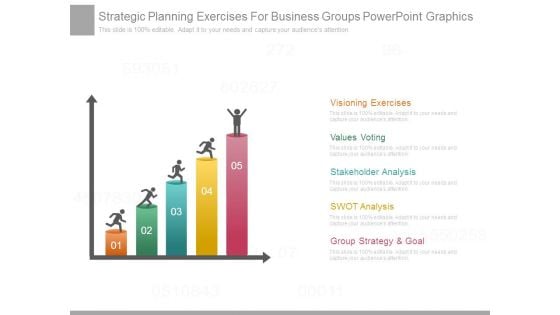
Strategic Planning Exercises For Business Groups Powerpoint Graphics
This is a strategic planning exercises for business groups powerpoint graphics. This is a five stage process. The stages in this process are visioning exercises, values voting, stakeholder analysis, swot analysis, group strategy and goal.
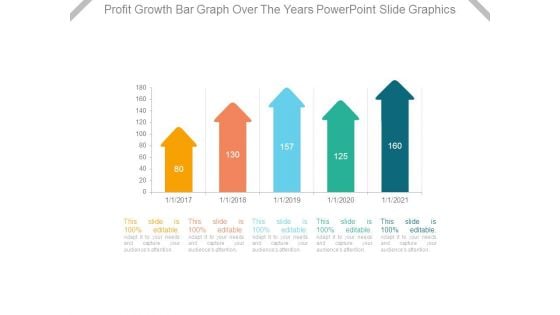
Profit Growth Bar Graph Over The Years Powerpoint Slide Graphics
This is a profit growth bar graph over the years powerpoint slide graphics. This is a four stage process. The stages in this process are bar graph, arrows, years, business, growth, marketing.
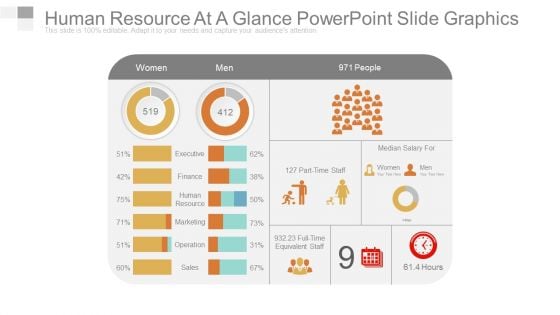
Human Resource At A Glance Powerpoint Slide Graphics
This is a human resource at a glance powerpoint slide graphics. This is a two stage process. The stages in this process are executive, finance, human, human resource, marketing, operation, sales.
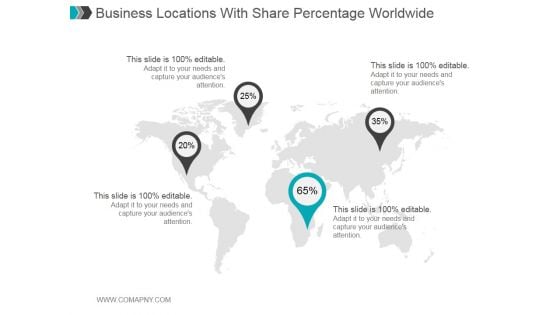
Business Locations With Share Percentage Worldwide Ppt PowerPoint Presentation Graphics
This is a business locations with share percentage worldwide ppt powerpoint presentation graphics. This is a four stage process. The stages in this process are business, location, geography, percentage, strategy, success.
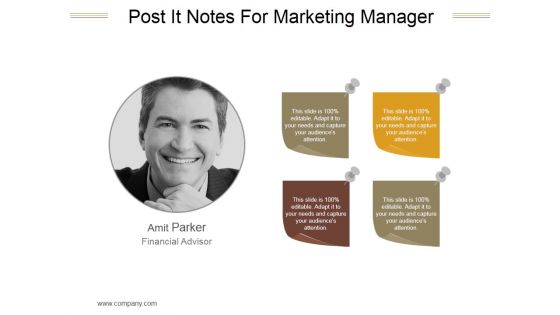
Post It Notes For Marketing Manager Ppt PowerPoint Presentation Graphics
This is a post it notes for marketing manager ppt powerpoint presentation graphics. This is a four stage process. The stages in this process are amit parker, financial advisor.
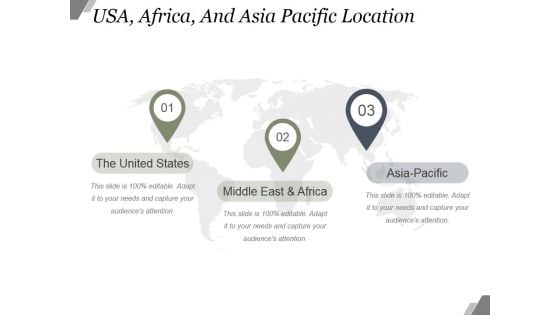
Usa Africa And Asia Pacific Location Ppt PowerPoint Presentation Graphics
This is a usa africa and asia pacific location ppt powerpoint presentation graphics. This is a three stage process. The stages in this process are the united states, middle east and africa, asia pacific.
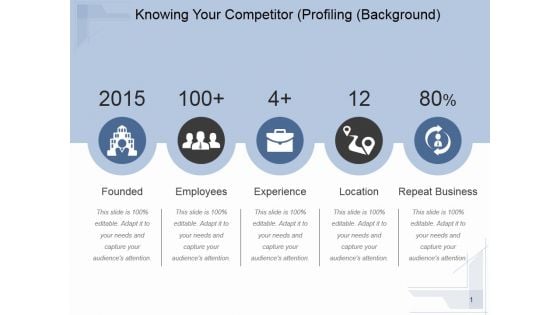
Knowing Your Competitor Profiling Ppt PowerPoint Presentation Graphics
This is a knowing your competitor profiling ppt powerpoint presentation graphics. This is a five stage process. The stages in this process are founded, employees, experience, location, repeat business.
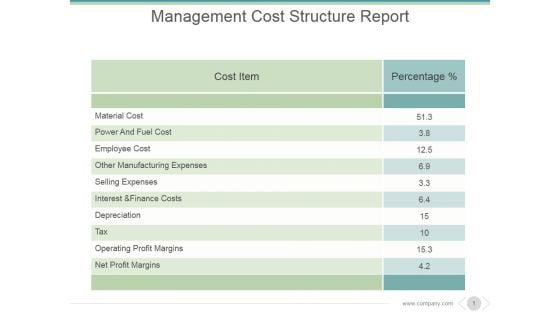
Management Cost Structure Report Ppt PowerPoint Presentation Graphics
This is a management cost structure report ppt powerpoint presentation graphics. This is a two stage process. The stages in this process are cost item, percentage, material cost, power and fuel cost, employee cost, other manufacturing expenses.
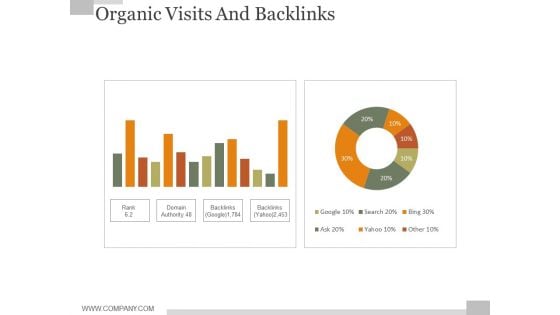
Organic Visits And Backlinks Ppt PowerPoint Presentation Graphics
This is a organic visits and backlinks ppt powerpoint presentation graphics. This is a two stage process. The stages in this process are business, finance, pie chart, marketing, strategy, success.
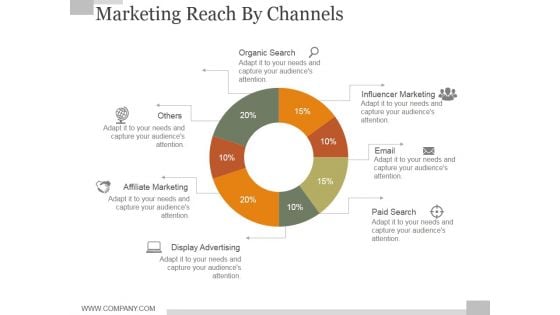
Marketing Reach By Channels Ppt PowerPoint Presentation Graphics
This is a marketing reach by channels ppt powerpoint presentation graphics. This is a seven stage process. The stages in this process are content promotion, product launch, content creation, event management, corporate communications, crisis management, seo.
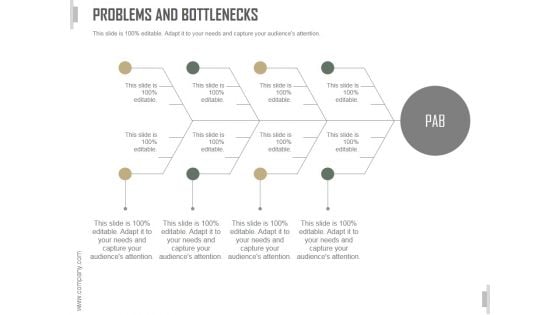
Problems And Bottlenecks Slide Ppt PowerPoint Presentation Graphics
This is a problems and bottlenecks slide ppt powerpoint presentation graphics. This is a four stage process. The stages in this process are business, strategy, marketing, analysis, liner process.
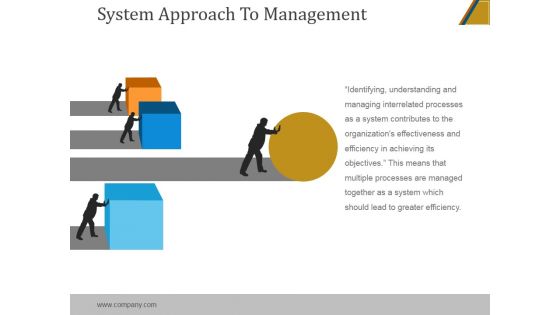
System Approach To Management Ppt PowerPoint Presentation Graphics
This is a system approach to management ppt powerpoint presentation graphics. This is a four stage process. The stages in this process are cubes, strength, management, communication, system approach, business.

Current State Analysis Financial Comparison Ppt PowerPoint Presentation Graphics
This is a current state analysis financial comparison ppt powerpoint presentation graphics. This is a five stage process. The stages in this process are financial, comparison, strategy, management, business.
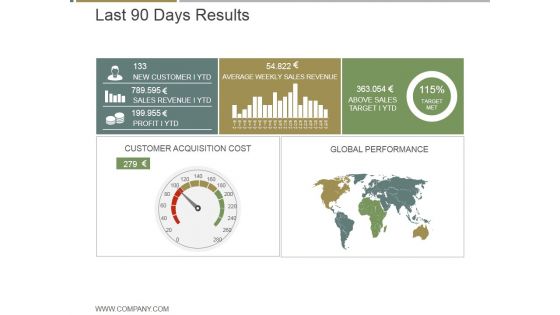
Last 90 Days Results Ppt PowerPoint Presentation Graphics
This is a last 90 days results ppt powerpoint presentation graphics. This is a five stage process. The stages in this process are new customer ytd, average weekly sales revenue, above sales target i ytd, customer acquisition cost, global performance.

Budgeting Planned Actual Comparison Ppt PowerPoint Presentation Graphics
This is a budgeting planned actual comparison ppt powerpoint presentation graphics. This is a two stage process. The stages in this process are value difference, actual cost, planned cost, type of cost.
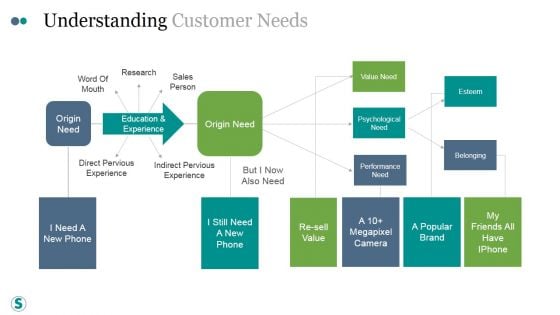
Understanding Customer Needs Template Ppt PowerPoint Presentation Graphics
This is a understanding customer needs template ppt powerpoint presentation graphics. This is a five stage process. The stages in this process are business, strategy, marketing, success, process, analysis, understanding customer needs.
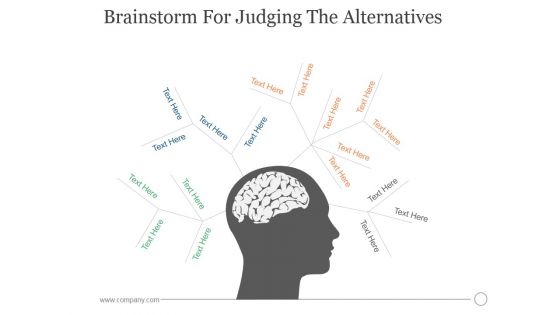
Brainstorm For Judging The Alternatives Ppt PowerPoint Presentation Graphics
This is a brainstorm for judging the alternatives ppt powerpoint presentation graphics. This is a four stage process. The stages in this process are alternatives, judging, brainstorm, planning, management, strategy.

Project Health Card Template 2 Ppt PowerPoint Presentation Graphics
This is a project health card template 2 ppt powerpoint presentation graphics. This is a six stage process. The stages in this process are schedule, resourcing, budged, risks, issues, benefits.
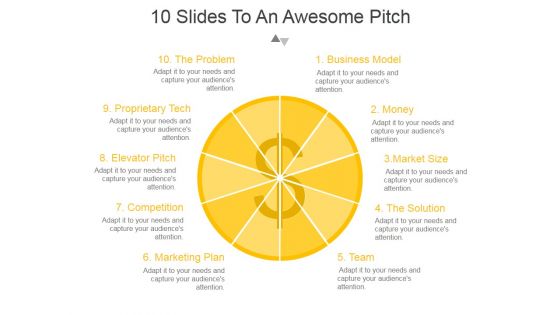
10 Slides To An Awesome Pitch Ppt PowerPoint Presentation Graphics
This is a 10 slides to an awesome pitch ppt powerpoint presentation graphics. This is a ten stage process. The stages in this process are business model, money, market size, the solution, team, marketing plan, competition, elevator pitch.
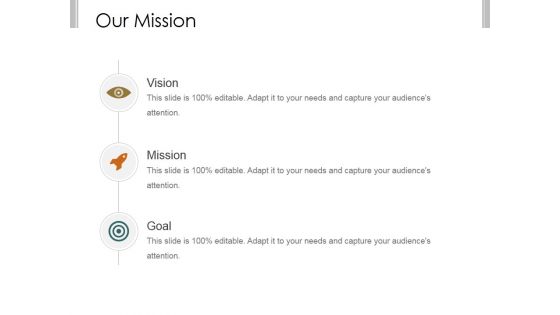
Our Mission Ppt PowerPoint Presentation Guidelines Ppt PowerPoint Presentation Graphics
This is a our mission ppt powerpoint presentation guidelines ppt powerpoint presentation graphics. This is a three stage process. The stages in this process are business, strategy, marketing, success, our mission.
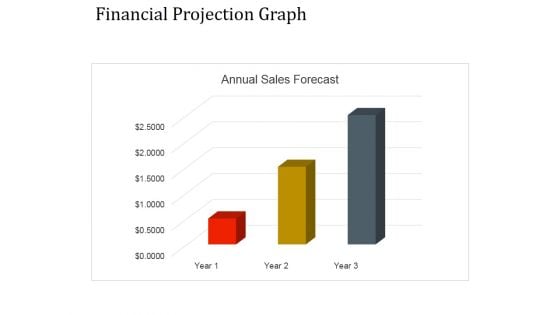
Financial Projection Graph Template 1 Ppt PowerPoint Presentation Graphics
This is a financial projection graph template 1 ppt powerpoint presentation graphics. This is a three stage process. The stages in this process are annual sales, business, management, marketing, strategy.
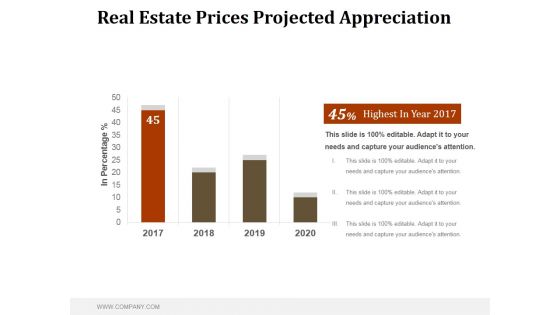
Real Estate Prices Projected Appreciation Ppt PowerPoint Presentation Graphics
This is a real estate prices projected appreciation ppt powerpoint presentation graphics. This is a four stage process. The stages in this process are business, marketing, management, appreciation, projected.
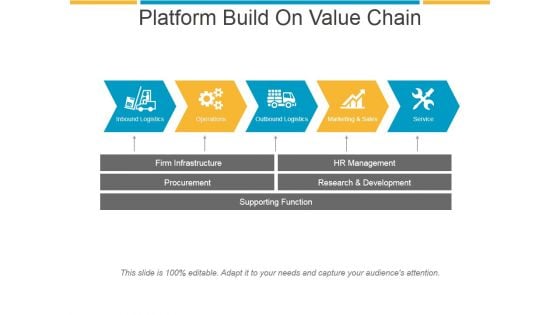
Platform Build On Value Chain Ppt PowerPoint Presentation Graphics
This is a platform build on value chain ppt powerpoint presentation graphics. This is a five stage process. The stages in this process are inbound logistics, operations, outbound logistics, marketing and sales, service, firm infrastructure.
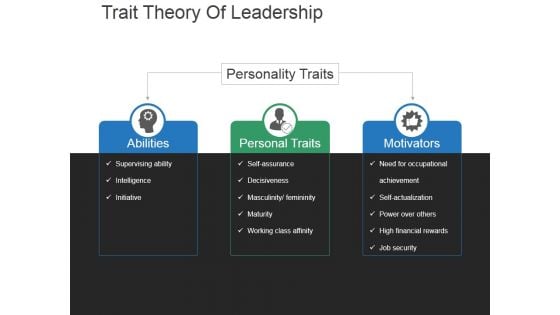
Trait Theory Of Leadership Template 2 Ppt PowerPoint Presentation Graphics
This is a trait theory of leadership template 2 ppt powerpoint presentation graphics. This is a three stage process. The stages in this process are abilities, personal traits, motivators.
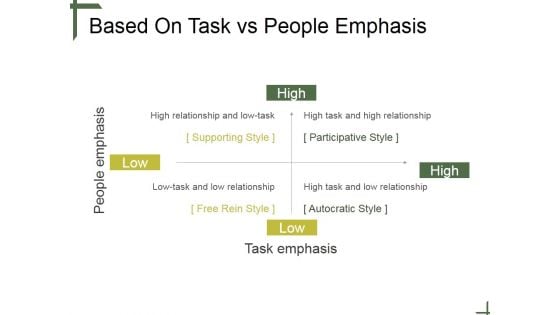
Based On Task Vs People Emphasis Ppt PowerPoint Presentation Graphics
This is a based on task vs people emphasis ppt powerpoint presentation graphics. This is a four stage process. The stages in this process are high, low, people emphasis, task emphasis.
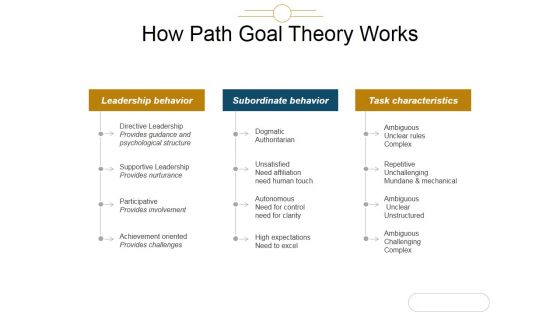
How Path Goal Theory Works Ppt PowerPoint Presentation Graphics
This is a how path goal theory works ppt powerpoint presentation graphics. This is a three stage process. The stages in this process are leadership behavior, subordinate behavior, task characteristics.
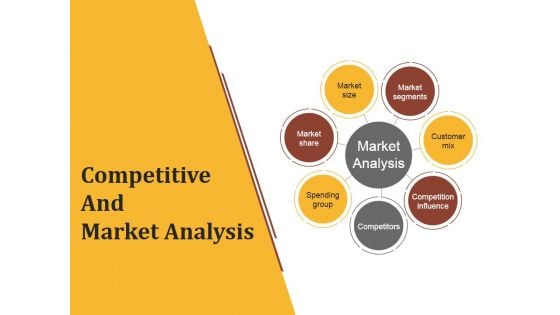
Competitive And Market Analysis Ppt PowerPoint Presentation Graphics
This is a competitive and market analysis ppt powerpoint presentation graphics. This is a seven stage process. The stages in this process are market analysis, market size, market segments, customer mix, market share.
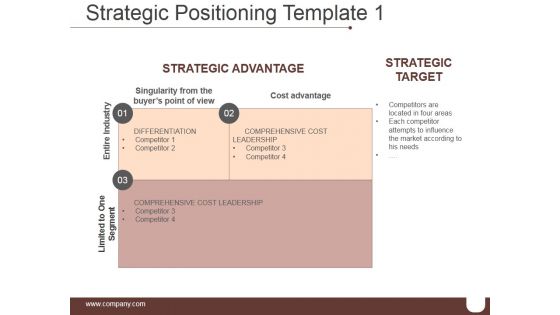
Strategic Positioning Template 1 Ppt PowerPoint Presentation Graphics
This is a strategic positioning template 1 ppt powerpoint presentation graphics. This is a three stage process. The stages in this process are limited to one segment, entire industry, strategic advantage, strategic target, cost advantage.
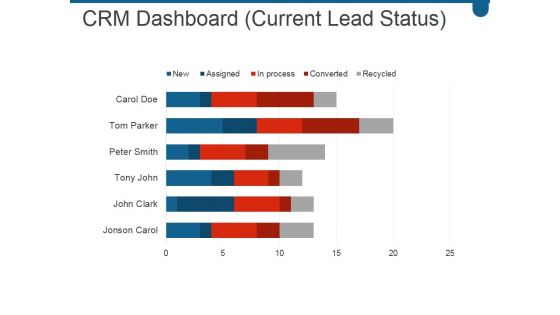
Crm Dashboard Current Lead Status Ppt PowerPoint Presentation Graphics
This is a crm dashboard current lead status ppt powerpoint presentation graphics. This is a six stage process. The stages in this process are carol doe, tom parker, peter smith, tony john, john clark.
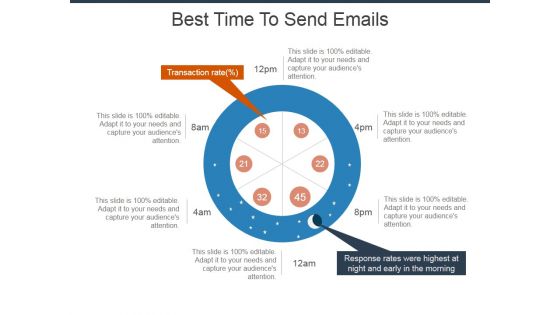
Best Time To Send Emails Ppt Powerpoint Presentation Slides Graphics
This is a best time to send emails ppt powerpoint presentation slides graphics. This is a six stage process. The stages in this process are transaction rate, response rates were highest at night and early in the morning.
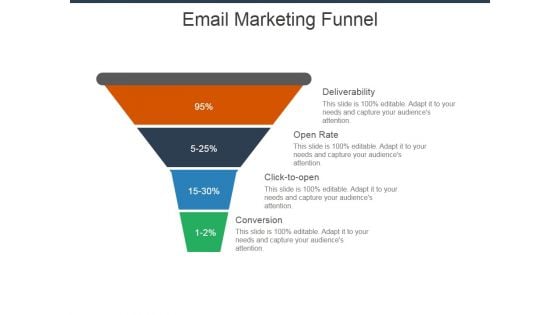
Email Marketing Funnel Ppt Powerpoint Presentation Slides Graphics
This is a email marketing funnel ppt powerpoint presentation slides graphics. This is a four stage process. The stages in this process are deliverability, open rate, click to open, conversion.
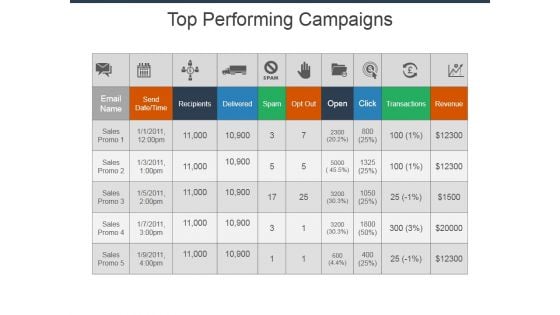
Top Performing Campaigns Ppt PowerPoint Presentation Summary Graphics
This is a top performing campaigns ppt powerpoint presentation summary graphics. This is a ten stage process. The stages in this process are send date time, email name, recipients, delivered, spam, opt out, open, click, transactions.
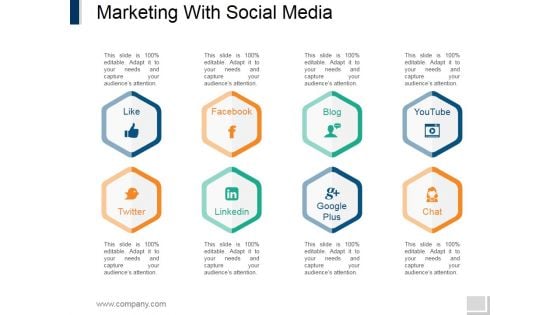
Marketing With Social Media Ppt PowerPoint Presentation Infographic Template Graphics
This is a marketing with social media ppt powerpoint presentation infographic template graphics. This is a eight stage process. The stages in this process are like, facebook, blog, youtub, twitter, linkedin, google, google plus, chat.
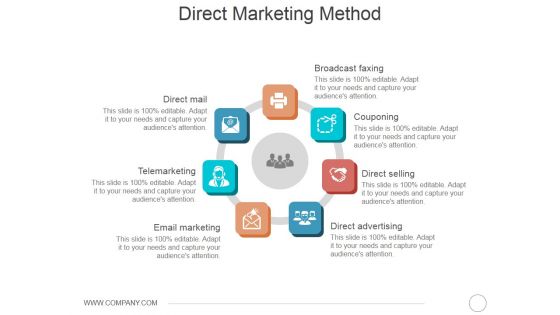
Direct Marketing Method Ppt PowerPoint Presentation Summary Graphics
This is a direct marketing method ppt powerpoint presentation summary graphics. This is a seven stage process. The stages in this process are broadcast faxing, couponing, direct selling, direct advertising, direct mail, telemarketing, email marketing.
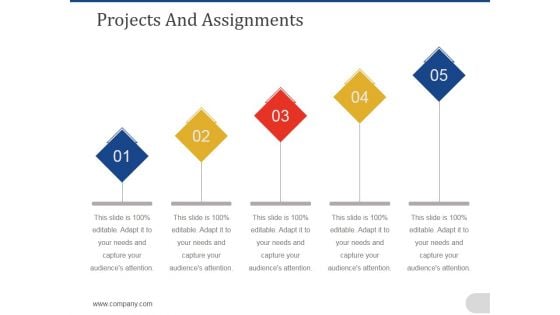
Projects And Assignments Template 2 Ppt PowerPoint Presentation Professional Graphics
This is a projects and assignments template 2 ppt powerpoint presentation professional graphics. This is a five stage process. The stages in this process are business, management, growth, marketing, assignments.
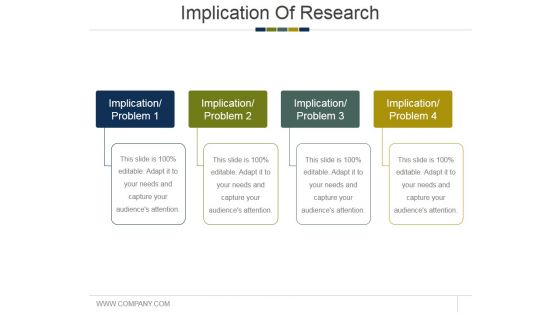
Implication Of Research Ppt PowerPoint Presentation Styles Graphics
This is a implication of research ppt powerpoint presentation styles graphics. This is a four stage process. The stages in this process are implication problem, business, marketing, success, process.
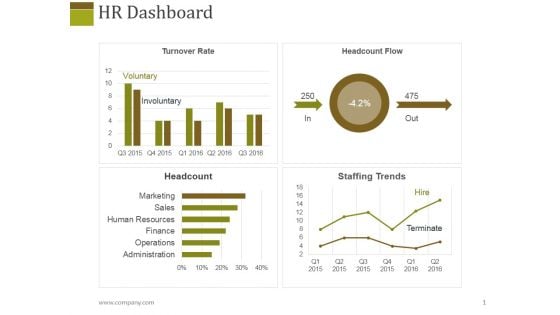
Hr Dashboard Template 2 Ppt PowerPoint Presentation Layouts Graphics
This is a hr dashboard template 2 ppt powerpoint presentation layouts graphics. This is a four stage process. The stages in this process are turnover rate, headcount flow, headcount, staffing trends.
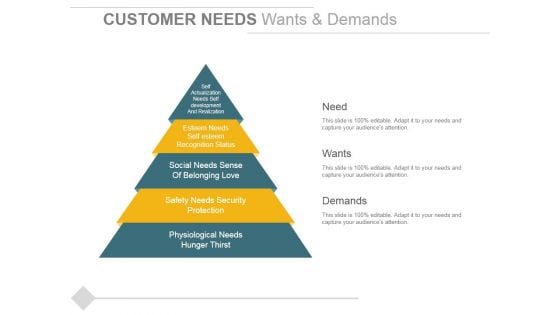
Customer Needs Wants And Demands Ppt PowerPoint Presentation Ideas Graphics
This is a customer needs wants and demands ppt powerpoint presentation ideas graphics. This is a five stage process. The stages in this process are need, wants, demands, social needs sense of belonging love, physiological needs, hunger thirst.
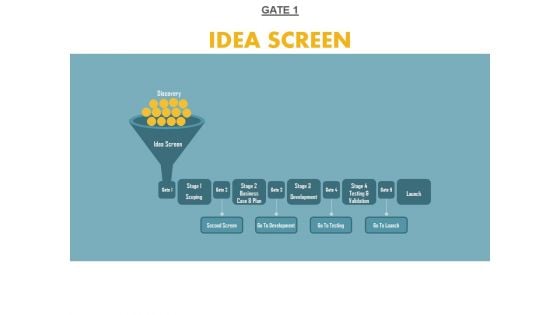
Gate 1 Idea Screen Ppt PowerPoint Presentation Styles Graphics
This is a gate 1 idea screen ppt powerpoint presentation styles graphics. This is a one stage process. The stages in this process are second screen, go to development, go to testing, go to launch.
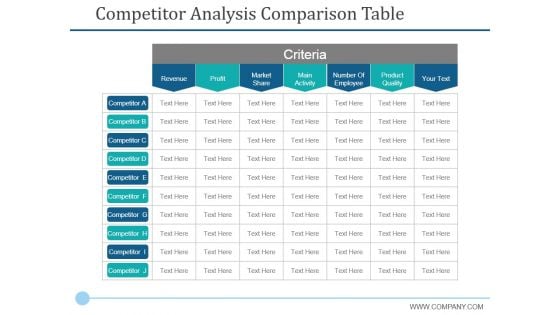
Competitor Analysis Comparison Table Ppt PowerPoint Presentation Infographic Template Graphics
This is a competitor analysis comparison table ppt powerpoint presentation infographic template graphics. This is a seven stage process. The stages in this process are profit, revenue, market share, main activity, criteria.
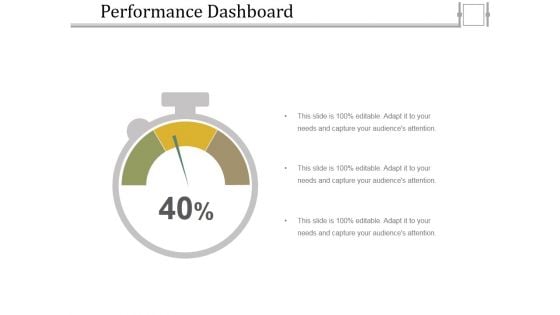
Performance Dashboard Template 2 Ppt PowerPoint Presentation Slides Graphics
This is a performance dashboard template 2 ppt powerpoint presentation slides graphics. This is a one stage process. The stages in this process are dashboard, marketing, analysis, measurement, business.
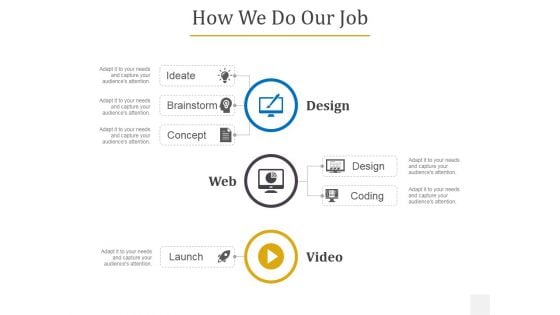
How We Do Our Job Ppt PowerPoint Presentation Infographics Graphics
This is a how we do our job ppt powerpoint presentation infographics graphics. This is a three stage process. The stages in this process are ideate, brainstorm, concept, design, coding, launch.
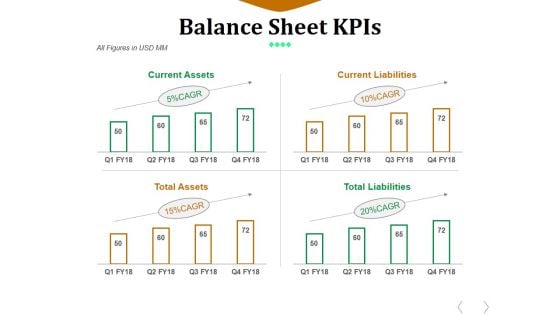
Balance Sheet Kpis Template 2 Ppt PowerPoint Presentation Ideas Graphics
This is a balance sheet kpis template 2 ppt powerpoint presentation ideas graphics. This is a four stage process. The stages in this process are current assets, current liabilities, total assets, total liabilities.
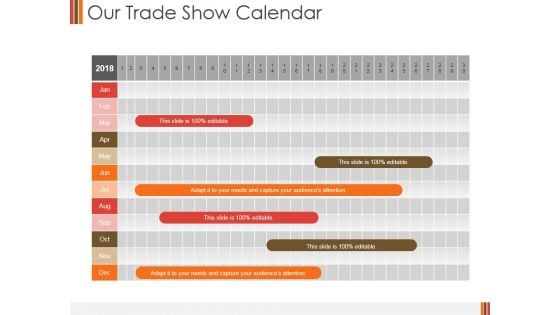
Our Trade Show Calendar Ppt PowerPoint Presentation Model Graphics
This is a our trade show calendar ppt powerpoint presentation model graphics. This is a one stage process. The stages in this process are calendar, business, management, success, strategy.


 Continue with Email

 Home
Home


