Graphics
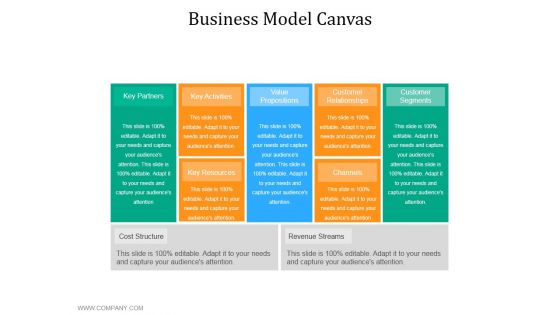
Business Model Canvas Ppt PowerPoint Presentation Model Graphics
This is a business model canvas ppt powerpoint presentation model graphics. This is a five stage process. The stages in this process are key partners, key activities, value propositions, customer relationships, customer segments, key resources, channels, cost structure, revenue streams.
Proprietary Technology Expertise Template 2 Ppt PowerPoint Presentation Icon Graphics
This is a proprietary technology expertise template 2 ppt powerpoint presentation icon graphics. This is a two stage process. The stages in this process are competitive advantage, technology, business, marketing, chess.
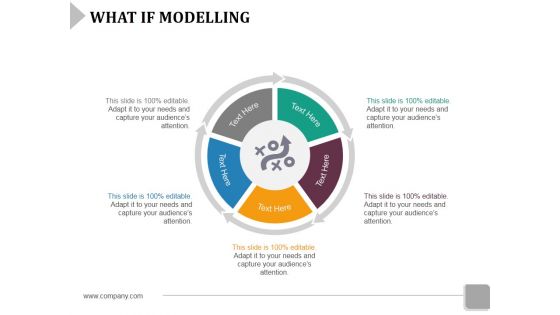
What If Modelling Template 1 Ppt Powerpoint Presentation Gallery Graphics
This is a what if modelling template 1 ppt powerpoint presentation gallery graphics. This is a three stage process. The stages in this process are business, marketing, arrows, process.
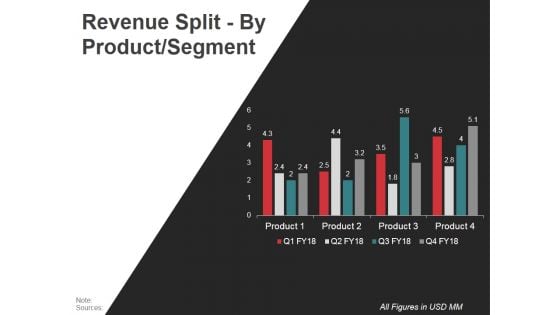
Revenue Split By Product Segment Template Ppt PowerPoint Presentation Graphics
This is a revenue split by product segment template ppt powerpoint presentation graphics. This is a four stage process. The stages in this process are product, business, marketing, planning, process.
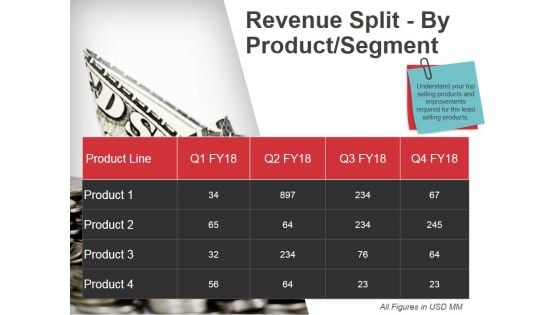
Revenue Split By Product Segment Ppt PowerPoint Presentation Ideas Graphics
This is a revenue split by product segment ppt powerpoint presentation ideas graphics. This is a four stage process. The stages in this process are business, marketing, bar graph, success.
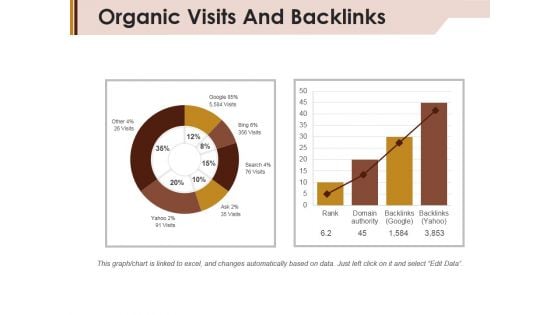
Organic Visits And Backlinks Ppt PowerPoint Presentation Layouts Graphics
This is a organic visits and backlinks ppt powerpoint presentation layouts graphics. This is a two stage process. The stages in this process are rank domain authority, backlinks, google, search, ask.
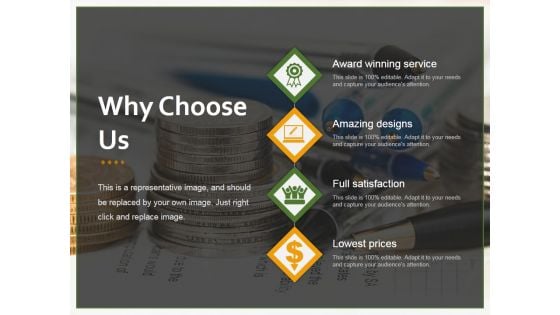
Why Choose Us Template 1 Ppt PowerPoint Presentation Portfolio Graphics
This is a why choose us template 1 ppt powerpoint presentation portfolio graphics. This is a four stage process. The stages in this award winning service, amazing designs, full satisfaction, lowest prices.
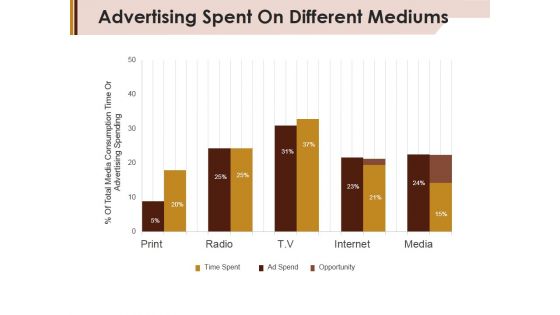
Advertising Spent On Different Mediums Ppt Powerpoint Presentation Portfolio Graphics
This is a advertising spent on different mediums ppt powerpoint presentation portfolio graphics. This is a five stage process. The stages in this process are print, radio, tv, internet, media.
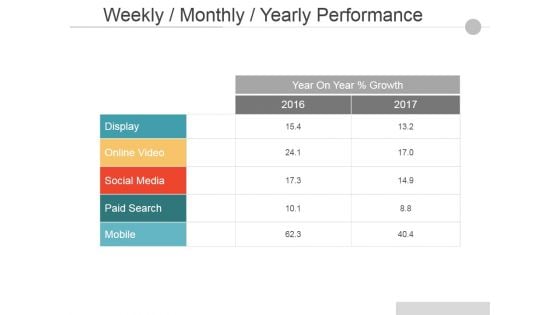
Weekly Monthly Yearly Performance Ppt PowerPoint Presentation Layouts Graphics
This is a weekly monthly yearly performance ppt powerpoint presentation layouts graphics. This is a two stage process. The stages in this process are display, online video, social media, paid search, mobile.
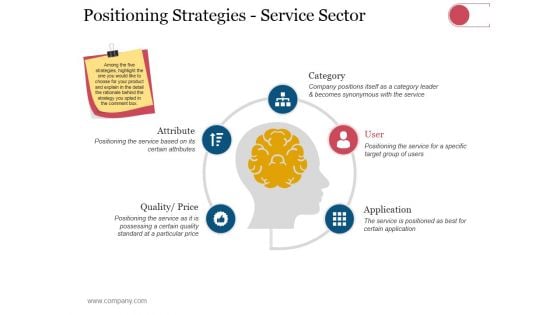
Positioning Strategies Service Sector Ppt PowerPoint Presentation Summary Graphics
This is a positioning strategies service sector ppt powerpoint presentation summary graphics. This is a five stage process. The stages in this process are category, user, application, attribute, quality price.
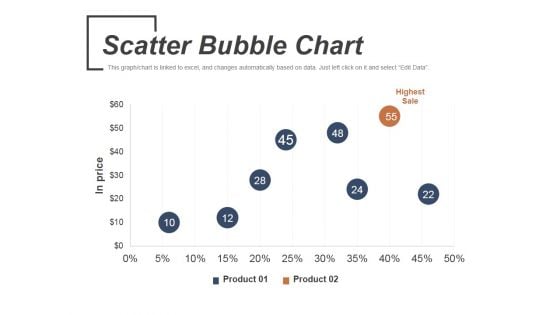
Scatter Bubble Chart Ppt PowerPoint Presentation Infographic Template Graphics
This is a scatter bubble chart ppt powerpoint presentation infographic template graphics. This is a two stage process. The stages in this process are highest sale, product, in price.
Sales Training Plan Ppt PowerPoint Presentation Icon Graphics
This is a sales training plan ppt powerpoint presentation icon graphics. This is a five stage process. The stages in this process are online support training, faq training, use cases training, field training, online sales training.
Pricing Strategy Template 1 Ppt PowerPoint Presentation Icon Graphics
This is a pricing strategy template 1 ppt powerpoint presentation icon graphics. This is a four stage process. The stages in this process are superior quality, brand, economical, value for money.
Our Main Goal Ppt PowerPoint Presentation Professional Graphics
This is a our main goal ppt powerpoint presentation professional graphics. This is a two stage process. The stages in this process are our main goal, business, success, planning, marketing.

Strategic Workforce Planning Model Ppt PowerPoint Presentation Show Graphics
This is a strategic workforce planning model ppt powerpoint presentation show graphics. This is a six stage process. The stages in this process are strategic planning, current workforce analysis, future requirements analysis, gap analysis, workforce action planning, execute and monitor.
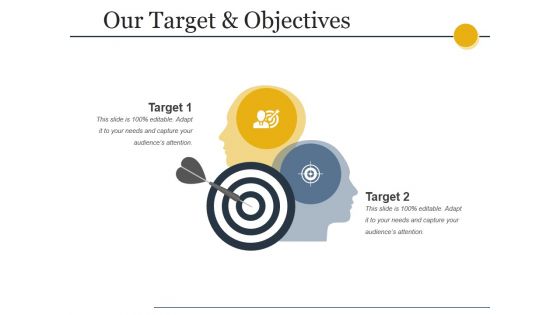
Our Target And Objectives Ppt PowerPoint Presentation Portfolio Graphics
This is a our target and objectives ppt powerpoint presentation portfolio graphics. This is a two stage process. The stages in this process are target, strategy, mind, brain, idea.
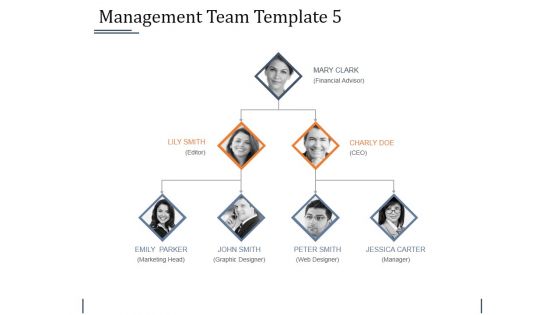
Management Team Template 5 Ppt PowerPoint Presentation Show Graphics
This is a management team template 5 ppt powerpoint presentation show graphics. This is a three stage process. The stages in this process are mary clark, charly doe, lily smith, emily parker, john smith.
Internal Analysis Organizational Culture Ppt PowerPoint Presentation Icon Graphics
This is a internal analysis organizational culture ppt powerpoint presentation icon graphics. This is a six stage process. The stages in this process are context, respect, promotions, responsibility, high performance.
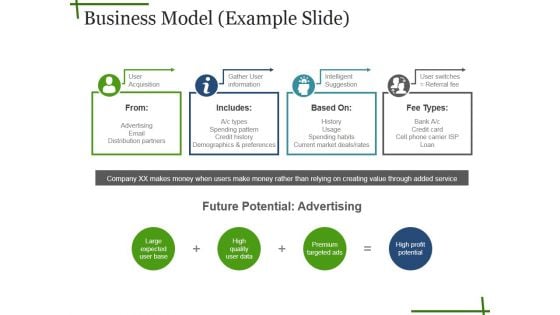
Business Model Example Slide Ppt PowerPoint Presentation Professional Graphics
This is a business model example slide ppt powerpoint presentation professional graphics. This is a four stage process. The stages in this process are user acquisition, gather user information, intelligent suggestion, user switches referral fee, large expected user base.
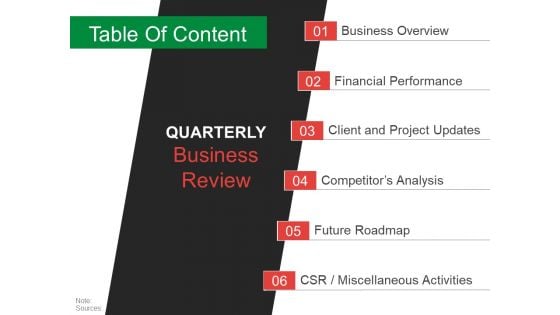
Table Of Content Template 1 Ppt PowerPoint Presentation Outline Graphics
This is a table of content template 1 ppt powerpoint presentation outline graphics. This is a six stage process. The stages in this process are business overview, financial performance, client and project updates, competitor s analysis, future roadmap.

Top Customers And Vendors Ppt PowerPoint Presentation Pictures Graphics
This is a top customers and vendors ppt powerpoint presentation pictures graphics. This is a two stage process. The stages in this process are customers, amount, vendors, business, marketing.
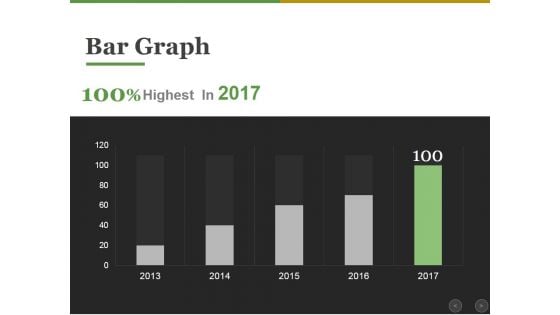
Bar Graph Ppt PowerPoint Presentation Infographic Template Graphics
This is a bar graph ppt powerpoint presentation infographic template graphics. This is a five stage process. The stages in this process are bar graph, finance, marketing, strategy, analysis, business.
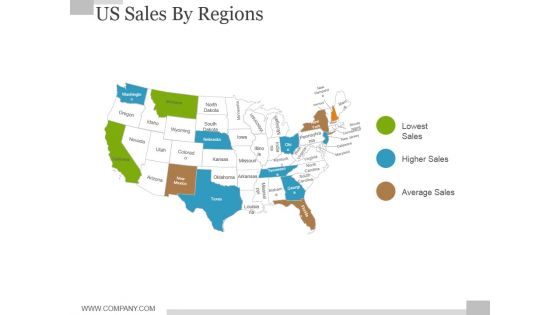
Us Sales By Regions Ppt PowerPoint Presentation Infographics Graphics
This is a us sales by regions ppt powerpoint presentation infographics graphics. This is a three stage process. The stages in this process are lowest sales, higher sales, average sales, north dakota, wyoming.
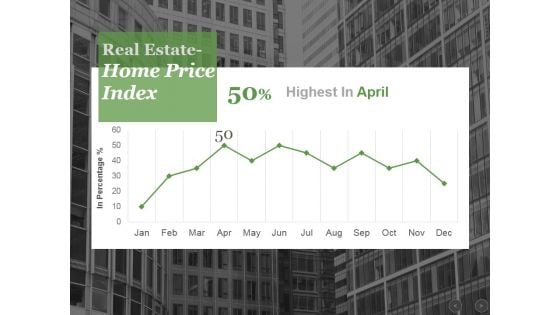
Real Estate Home Price Index Ppt PowerPoint Presentation Portfolio Graphics
This is a real estate home price index ppt powerpoint presentation portfolio graphics. This is a one stage process. The stages in this process are business, finance, marketing, strategy, investment, analysis.
Gap Analysis Template Ppt PowerPoint Presentation Icon Graphics
This is a gap analysis template ppt powerpoint presentation icon graphics. This is a three stage process. The stages in this process are gap dimension, current state, future state, gap, role segmentation.
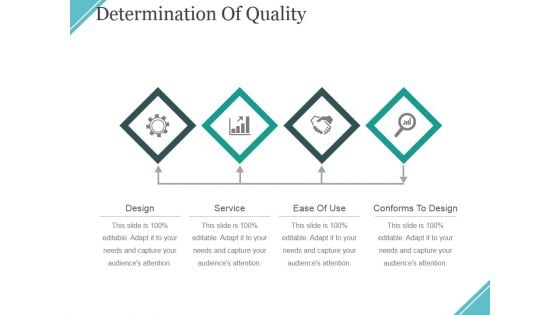
Determination Of Quality Ppt PowerPoint Presentation Ideas Graphics
This is a determination of quality ppt powerpoint presentation ideas graphics. This is a four stage process. The stages in this process are design, service, ease of use, conforms to design.
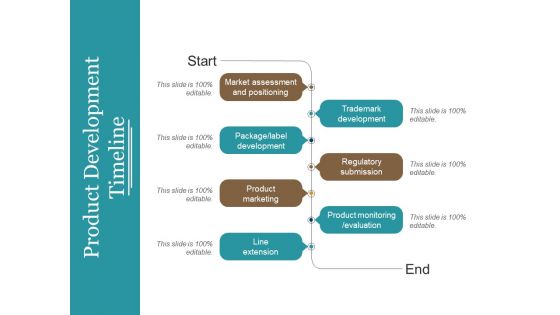
Product Development Timeline Ppt PowerPoint Presentation Summary Graphics
This is a product development timeline ppt powerpoint presentation summary graphics. This is a two stage process. The stages in this process are trademark, regulatory, product monitoring, product, line.
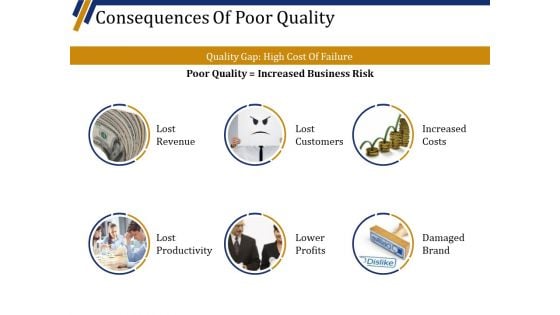
Consequences Of Poor Quality Ppt PowerPoint Presentation File Graphics
This is a consequences of poor quality ppt powerpoint presentation file graphics. This is a six stage process. The stages in this process are lost revenue, lost customers, increased costs, damaged brand, lower profits.
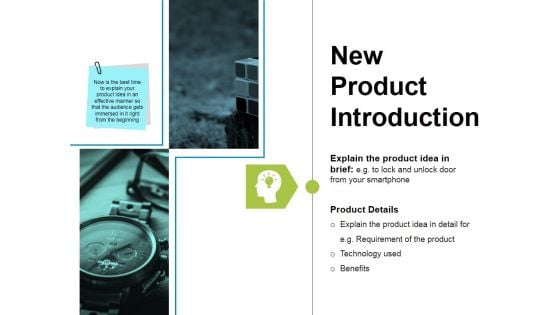
New Product Introduction Ppt PowerPoint Presentation Show Graphics
This is a new product introduction ppt powerpoint presentation show graphics. This is a two stage process. The stages in this process are explain the product idea in brief, product details, technology used, benefits.
Brand Tracking Product Awareness Ppt PowerPoint Presentation Infographics Graphics
This is a brand tracking product awareness ppt powerpoint presentation infographics graphics. This is a four stage process. The stages in this process are ad awareness, brand awareness, preference, latest purchase, business.
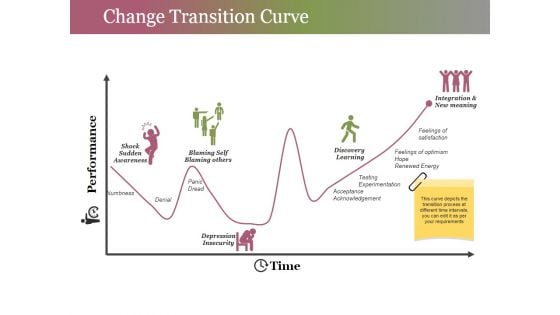
Change Transition Curve Ppt PowerPoint Presentation Gallery Graphics
This is a change transition curve ppt powerpoint presentation gallery graphics. This is a one stage process. The stages in this process are numbness, denial, panic, dread, time, performance.
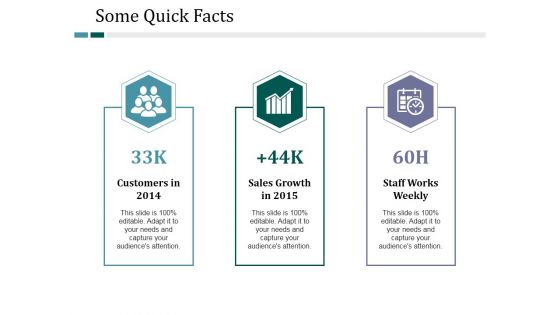
Some Quick Facts Ppt PowerPoint Presentation Inspiration Graphics
This is a some quick facts ppt powerpoint presentation inspiration graphics. This is a three stage process. The stages in this process are customers in, sales growth in, staff works weekly.

Core Values Template 2 Ppt PowerPoint Presentation Gallery Graphics
This is a core values template 2 ppt powerpoint presentation gallery graphics. This is a six stage process. The stages in this process are excellence, integrity, progressive, passionate, collaborative, respect.

client referral report ppt powerpoint presentation gallery graphics
This is a client referral report ppt powerpoint presentation gallery graphics. This is a three stage process. The stages in this process are received referrals, sent referrals, calendar events, business, management, process.
Sales Activities Dashboard Ppt PowerPoint Presentation Icon Graphics
This is a sales activities dashboard ppt powerpoint presentation icon graphics. This is a two stage process. The stages in this process are business, finance, management, analysis, budget, actual.
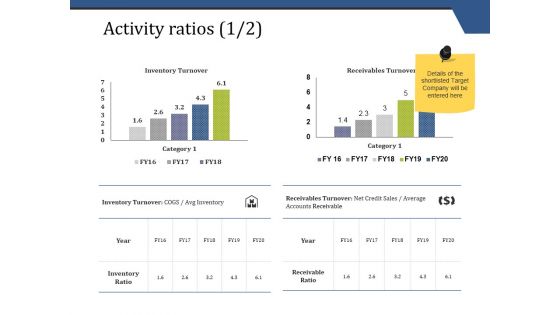
Activity Ratios Template 1 Ppt PowerPoint Presentation Show Graphics
This is a activity ratios template 1 ppt powerpoint presentation show graphics. This is a two stage process. The stages in this process are inventory turnover, receivables turnover, inventory ratio, receivable ratio.

Swot Analysis Template 1 Ppt PowerPoint Presentation File Graphics
This is a swot analysis template 1 ppt powerpoint presentation file graphics. This is a four stage process. The stages in this process are strengths, weaknesses, opportunities, threats, business.
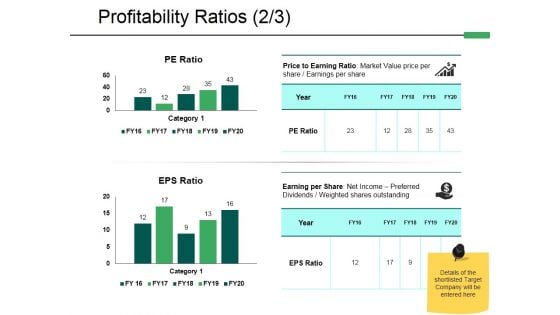
Profitability Ratios Template 2 Ppt PowerPoint Presentation File Graphics
This is a profitability ratios template 2 ppt powerpoint presentation file graphics. This is a two stage process. The stages in this process are finance, analysis, compere, strategy, business.
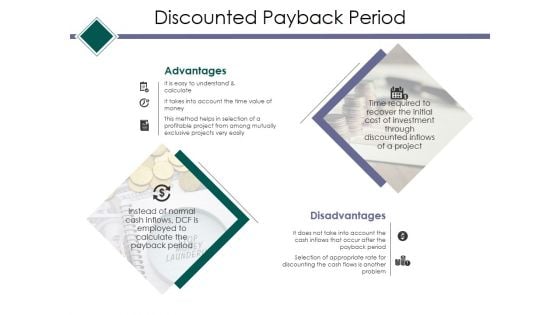
Discounted Payback Period Ppt PowerPoint Presentation Layouts Graphics
This is a discounted payback period ppt powerpoint presentation layouts graphics. This is a two stage process. The stages in this process are cost of the project, discounted payback period.
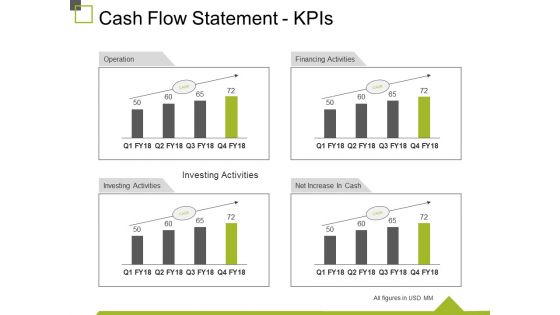
Cash Flow Statement Kpis Ppt PowerPoint Presentation Ideas Graphics
This is a cash flow statement kpis ppt powerpoint presentation ideas graphics. This is a four stage process. The stages in this process are operation, financing activities, net increase in cash, investing activities, business.
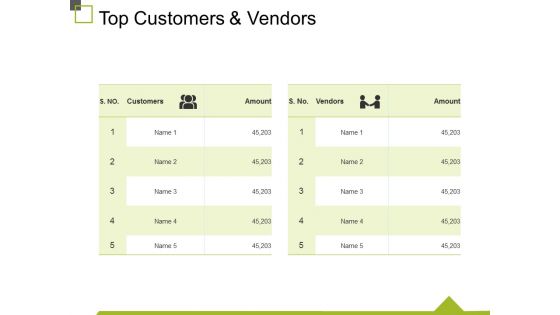
Top Customers And Vendors Ppt PowerPoint Presentation Portfolio Graphics
This is a top customers and vendors ppt powerpoint presentation portfolio graphics. This is a two stage process. The stages in this process are customers, business, marketing, amount, vendors.

About Our Company Ppt PowerPoint Presentation File Graphics
This is a about our company ppt powerpoint presentation file graphics. This is a three stage process. The stages in this process are target audiences, preferred by many, values client.
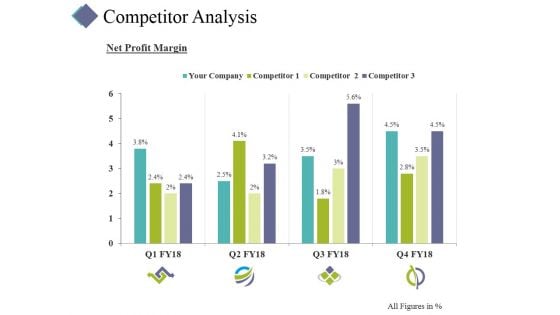
Competitor Analysis Template 4 Ppt PowerPoint Presentation Graphics
This is a competitor analysis template 4 ppt powerpoint presentation graphics. This is a four stage process. The stages in this process are competitor, finance, marketing, strategy, analysis, business.
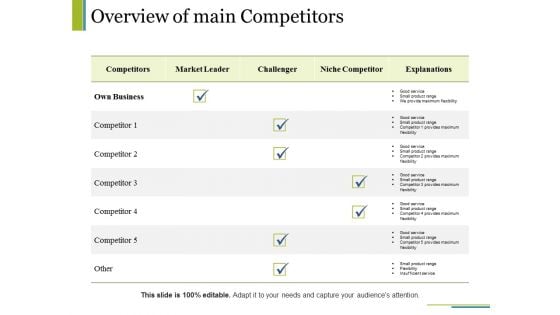
Overview Of Main Competitors Ppt PowerPoint Presentation Outline Graphics
This is a overview of main competitors ppt powerpoint presentation outline graphics. This is a five stage process. The stages in this process are business, competitors, market leader, challenger, niche competitor.
Project Conclusion Report Budget Costs Ppt PowerPoint Presentation Icon Graphics
This is a project conclusion report budget costs ppt powerpoint presentation icon graphics. This is a four stage process. The stages in this process are type of cost, planned costs, actual costs, equipment.
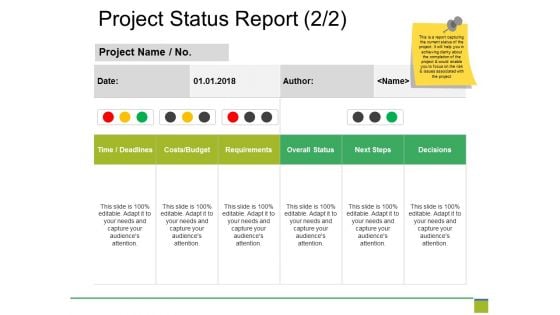
Project Status Report Template Ppt PowerPoint Presentation Outline Graphics
This is a project status report template ppt powerpoint presentation outline graphics. This is a three stage process. The stages in this process are project path, project approval, design, development, training.
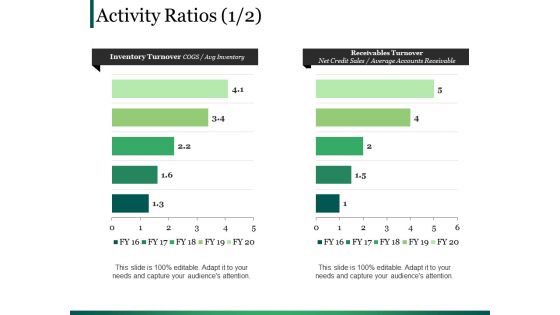
Activity Ratios Template 1 Ppt PowerPoint Presentation Portfolio Graphics
This is a activity ratios template 1 ppt powerpoint presentation portfolio graphics. This is a two stage process. The stages in this process are finance, chart graph, marketing, planning, analysis.
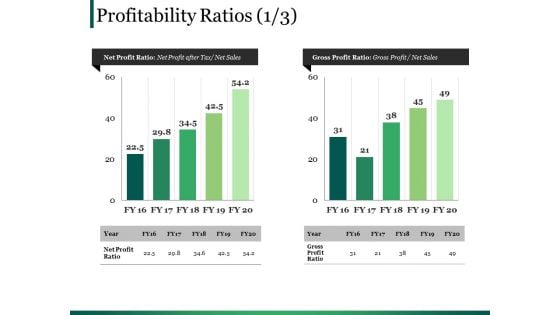
Profitability Ratios Template 2 Ppt PowerPoint Presentation Summary Graphics
This is a profitability ratios template 2 ppt powerpoint presentation summary graphics. This is a two stage process. The stages in this process are business, marketing, bar, finance, planning.
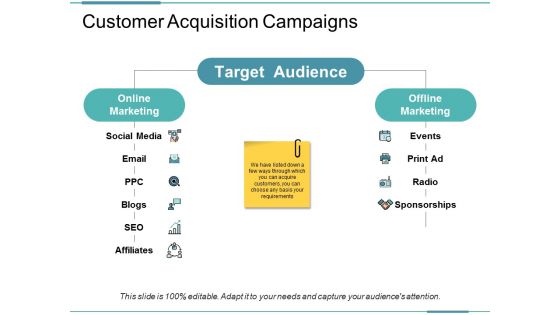
Customer Acquisition Campaigns Ppt PowerPoint Presentation Gallery Graphics
This is a customer acquisition campaigns ppt powerpoint presentation gallery graphics. This is a two stage process. The stages in this process are social media, email, online marketing, target audience, offline marketing, events.
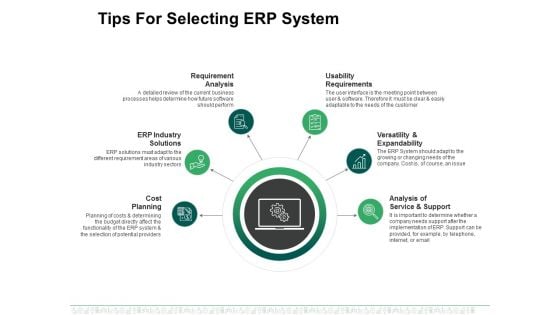
Tips For Selecting Erp System Ppt PowerPoint Presentation Infographics Graphics
This is a tips for selecting erp system ppt powerpoint presentation infographics graphics. This is a six stage process. The stages in this process are cost planning, erp industry solutions, requirement analysis, usability requirements, versatility and expandability.

Financial Due Diligence Ppt PowerPoint Presentation Infographics Graphics
This is a financial due diligence ppt powerpoint presentation infographics graphics. This is a one stage process. The stages in this process are financial due diligence, marketing, strategy, analysis, business.

Technology Intellectual Property Template 1 Ppt PowerPoint Presentation Slides Graphics
This is a technology intellectual property template 1 ppt powerpoint presentation slides graphics. This is a one stage process. The stages in this process are business, technology, bulb, strategy, marketing.

Business Development Process Ppt PowerPoint Presentation Infographic Template Graphics
This is a business development process ppt powerpoint presentation infographic template graphics. This is a four stage process. The stages in this process are Business, Attract Visitors, Gather Contact Info, More Interaction, Request A Proposal.
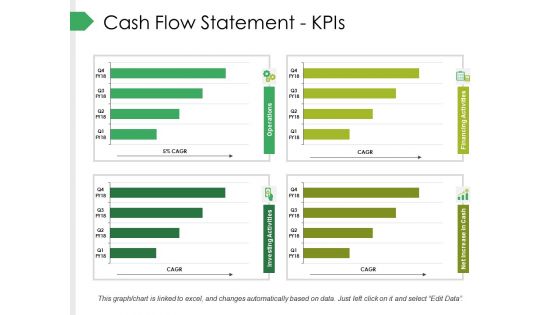
Cash Flow Statement Kpis Ppt PowerPoint Presentation Pictures Graphics
This is a cash flow statement kpis ppt powerpoint presentation pictures graphics. This is a four stage process. The stages in this process are business, marketing, graph, finance, strategy.
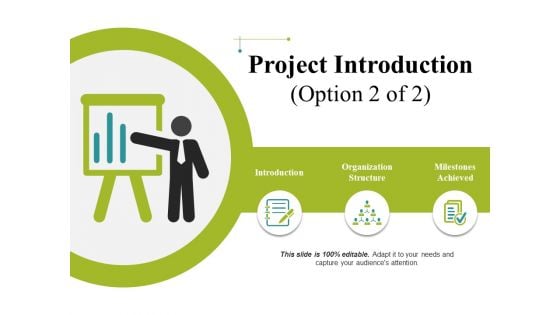
Project Introduction Template 2 Ppt PowerPoint Presentation Pictures Graphics
This is a project introduction template 2 ppt powerpoint presentation pictures graphics. This is a three stage process. The stages in this process are business, introduction, organization structure, milestones achieved, management.
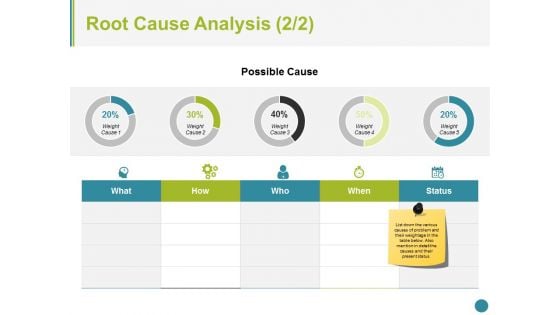
Root Cause Analysis Template 2 Ppt PowerPoint Presentation Styles Graphics
This is a root cause analysis template 2 ppt powerpoint presentation styles graphics. This is a five stage process. The stages in this process are business, icons, marketing, strategy, process.
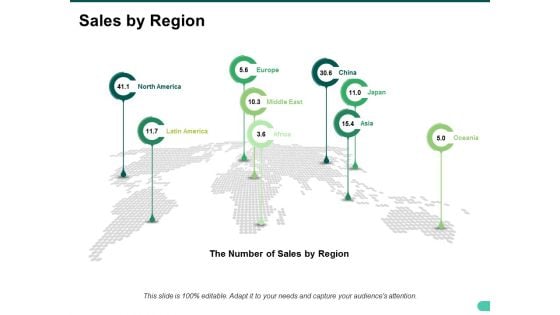
Sales By Region Ppt PowerPoint Presentation Styles Graphics
This is a sales by region ppt powerpoint presentation styles graphics. This is a nine stage process. The stages in this process are north america, latin america, europe, middle east, africa.
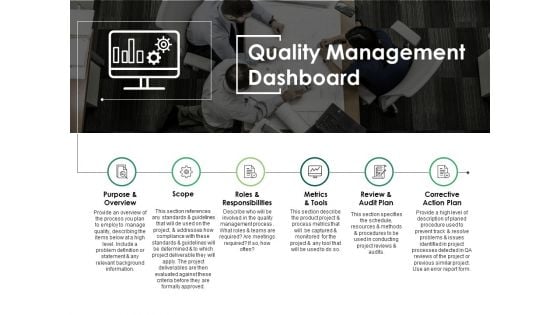
Quality Management Dashboard Ppt PowerPoint Presentation Infographics Graphics
This is a quality management dashboard ppt powerpoint presentation infographics graphics. This is a six stage process. The stages in this process are purpose and overview, scope, roles and responsibilities, metrics and tools, review and audit plan.
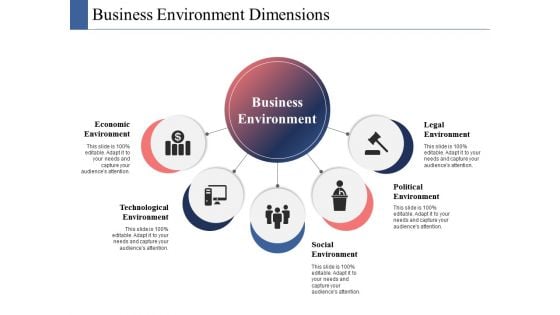
Business Environment Dimensions Ppt PowerPoint Presentation File Graphics
This is a business environment dimensions ppt powerpoint presentation file graphics. This is a five stage process. The stages in this process are economic environment, technological environment, social environment, political environment, legal environment.
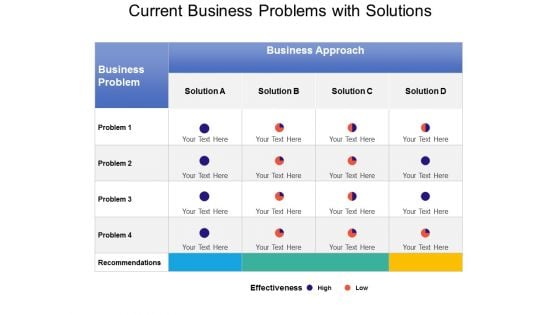
Current Business Problems With Solutions Ppt PowerPoint Presentation File Graphics
This is a current business problems with solutions ppt powerpoint presentation file graphics. This is a four stage process. The stages in this process are problem and solution, challenges and solutions, issues and solutions.


 Continue with Email

 Home
Home


