Gross Margin
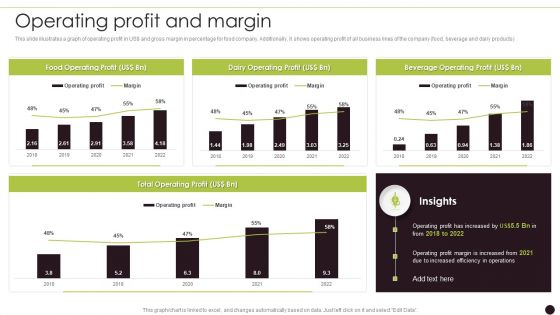
Canned Food Company Profile Operating Profit And Margin Background PDF
This slide illustrates a graph of operating profit in USdollar and gross margin in percentage for food company. Additionally, it shows operating profit of all business lines of the company food, beverage and dairy products Deliver an awe inspiring pitch with this creative Canned Food Company Profile Operating Profit And Margin Background PDF bundle. Topics like Dairy Operating, Beverage Operating , Total Operating can be discussed with this completely editable template. It is available for immediate download depending on the needs and requirements of the user.
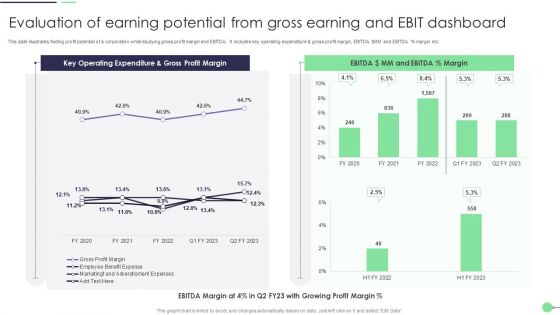
Evaluation Of Earning Potential From Gross Earning And Ebit Dashboard Professional PDF
This slide illustrates finding profit potential of a corporation while studying gross profit margin and EBITDA. It includes key operating expenditure and gross profit margin, EBITDA dollar MM and EBITDA percent margin etc. Showcasing this set of slides titled Evaluation Of Earning Potential From Gross Earning And Ebit Dashboard Professional PDF. The topics addressed in these templates are Evaluation Of Earning Potential, Gross Earning, Ebit Dashboard. All the content presented in this PPT design is completely editable. Download it and make adjustments in color, background, font etc. as per your unique business setting.
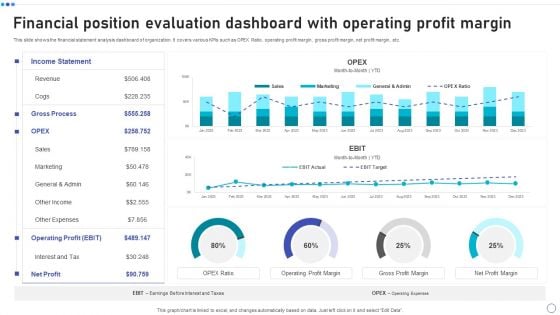
Financial Position Evaluation Dashboard With Operating Profit Margin Elements PDF
This slide shows the financial statement analysis dashboard of organization. It covers various KPIs such as OPEX Ratio, operating profit margin, gross profit margin, net profit margin, etc. Pitch your topic with ease and precision using this Financial Position Evaluation Dashboard With Operating Profit Margin Elements PDF. This layout presents information on Income Statement, Revenue, Operating Profit, Net Profit. It is also available for immediate download and adjustment. So, changes can be made in the color, design, graphics or any other component to create a unique layout.
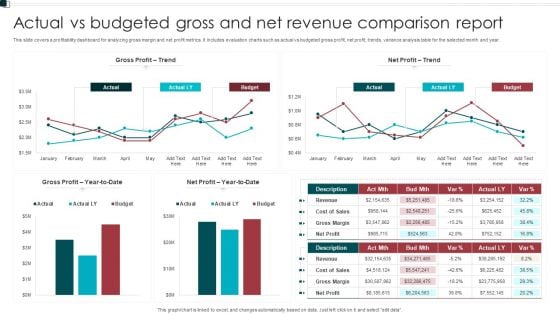
Actual Vs Budgeted Gross And Net Revenue Comparison Report Sample PDF
This slide covers a profitability dashboard for analyzing gross margin and net profit metrics. It includes evaluation charts such as actual vs budgeted gross profit, net profit, trends, variance analysis table for the selected month and year. Pitch your topic with ease and precision using this Actual Vs Budgeted Gross And Net Revenue Comparison Report Sample PDF. This layout presents information on Gross Profit, Net Profit, Budget. It is also available for immediate download and adjustment. So, changes can be made in the color, design, graphics or any other component to create a unique layout.
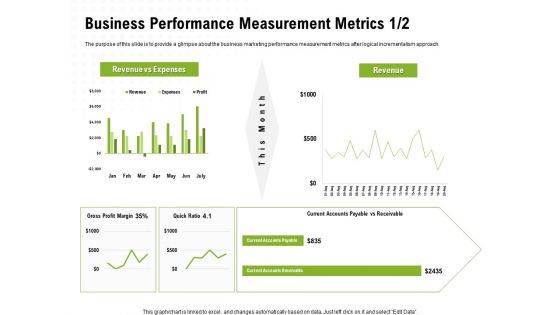
Strategic Growth Technique Business Performance Measurement Metrics Gross Ppt Summary Background Image PDF
Presenting this set of slides with name strategic growth technique business performance measurement metrics gross ppt summary background image pdf. The topics discussed in these slides are gross profit margin, quick ratio, revenue vs expenses, current accounts payable vs receivable. This is a completely editable PowerPoint presentation and is available for immediate download. Download now and impress your audience.
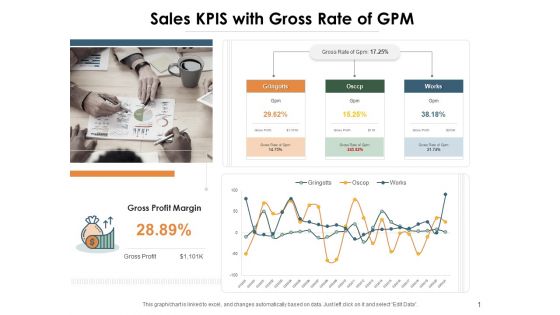
Sales KPIS With Gross Rate Of GPM Ppt PowerPoint Presentation File Infographic Template PDF
Presenting this set of slides with name sales kpis with gross rate of gpm ppt powerpoint presentation file infographic template pdf. The topics discussed in these slides are gross profit margin, gringotts, osccp, works, gpm. This is a completely editable PowerPoint presentation and is available for immediate download. Download now and impress your audience.
Incremental Approach Business Performance Measurement Metrics Gross Ppt Outline Icons PDF
Presenting this set of slides with name incremental approach business performance measurement metrics gross ppt outline icons pdf. The topics discussed in these slides are gross profit margin, quick ratio, revenue vs expenses, current accounts payable vs receivable. This is a completely editable PowerPoint presentation and is available for immediate download. Download now and impress your audience.
Incremental Planning In Decision Making Business Performance Measurement Metrics Gross Icons PDF
Presenting this set of slides with name incremental planning in decision making business performance measurement metrics gross icons pdf. The topics discussed in these slides are gross profit margin, quick ratio, revenue vs expenses, current accounts payable vs receivable. This is a completely editable PowerPoint presentation and is available for immediate download. Download now and impress your audience.
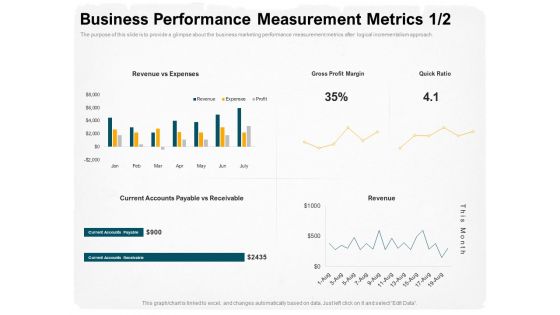
Stepwise Strategy Business Performance Measurement Metrics Gross Ppt Show Infographics PDF
Presenting this set of slides with name stepwise strategy business performance measurement metrics gross ppt show infographics pdf. The topics discussed in these slides are gross profit margin, quick ratio, revenue vs expenses, current accounts payable vs receivable. This is a completely editable PowerPoint presentation and is available for immediate download. Download now and impress your audience.
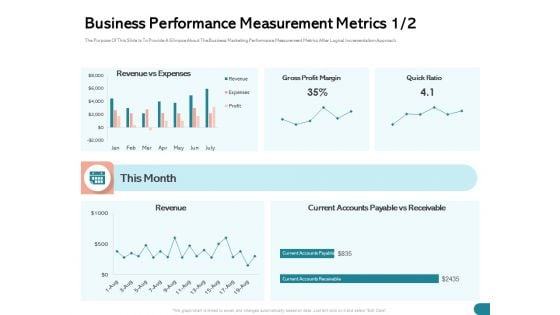
Quinns Incremental Model Business Performance Measurement Metrics Gross Ppt Slides Design Ideas PDF
Presenting this set of slides with name quinns incremental model business performance measurement metrics gross ppt slides design ideas pdf. The topics discussed in these slides are gross profit margin, quick ratio, revenue vs expenses, current accounts payable vs receivable. This is a completely editable PowerPoint presentation and is available for immediate download. Download now and impress your audience.
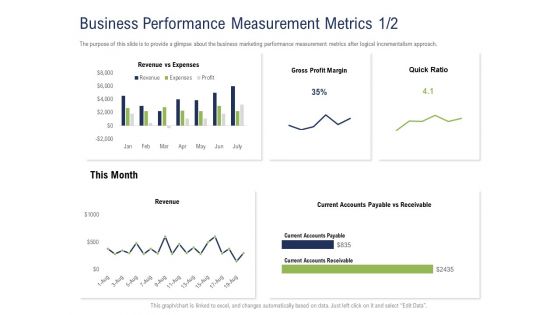
Incremental Decision Making Business Performance Measurement Metrics Gross Ppt Gallery Influencers PDF
Presenting this set of slides with name incremental decision making business performance measurement metrics gross ppt gallery influencers pdf. The topics discussed in these slides are gross profit margin, quick ratio, revenue vs expenses, current accounts payable vs receivable. This is a completely editable PowerPoint presentation and is available for immediate download. Download now and impress your audience.
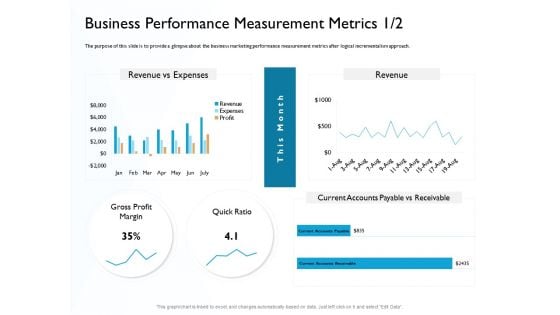
Hit And Trial Approach Business Performance Measurement Metrics Gross Ppt Portfolio Portrait PDF
Presenting this set of slides with name hit and trial approach business performance measurement metrics gross ppt portfolio portrait pdf. The topics discussed in these slides are gross profit margin, quick ratio, revenue vs expenses, current accounts payable vs receivable. This is a completely editable PowerPoint presentation and is available for immediate download. Download now and impress your audience.
Incrementalism Strategy Business Performance Measurement Metrics Gross Ppt Icon Diagrams PDF
Presenting this set of slides with name incrementalism strategy business performance measurement metrics gross ppt icon diagrams pdf. The topics discussed in these slides are gross profit margin, quick ratio, revenue vs expenses, current accounts payable vs receivable. This is a completely editable PowerPoint presentation and is available for immediate download. Download now and impress your audience.
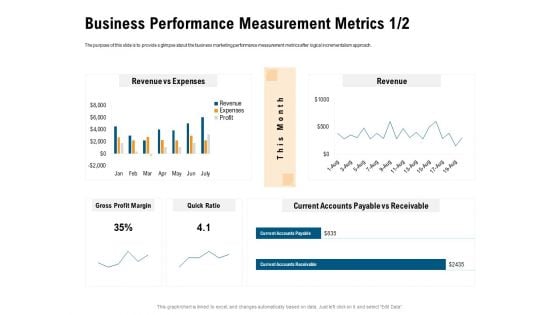
Incrementalism Process By Policy Makers Business Performance Measurement Metrics Gross Ppt Summary Example File PDF
Presenting this set of slides with name incrementalism process by policy makers business performance measurement metrics gross ppt summary example file pdf. The topics discussed in these slides are gross profit margin, quick ratio, revenue vs expenses, current accounts payable vs receivable. This is a completely editable PowerPoint presentation and is available for immediate download. Download now and impress your audience.
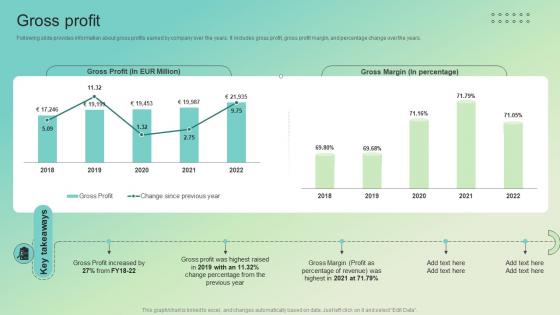
Gross Profit Enterprise Software Solution Providing Company Profile CP SS V
Following slide provides information about gross profits earned by company over the years. It includes gross profit, gross profit margin, and percentage change over the years.The Gross Profit Enterprise Software Solution Providing Company Profile CP SS V is a compilation of the most recent design trends as a series of slides. It is suitable for any subject or industry presentation, containing attractive visuals and photo spots for businesses to clearly express their messages. This template contains a variety of slides for the user to input data, such as structures to contrast two elements, bullet points, and slides for written information. Slidegeeks is prepared to create an impression. Following slide provides information about gross profits earned by company over the years. It includes gross profit, gross profit margin, and percentage change over the years.
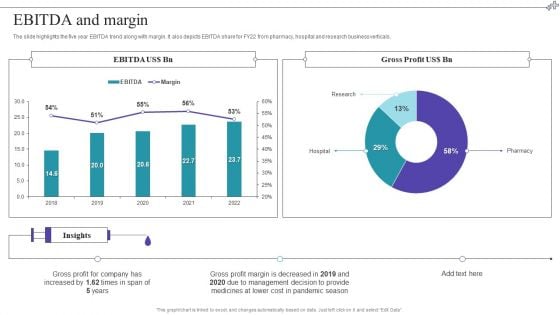
Medical Care Company Overview Ebitda And Margin Structure PDF
The slide highlights the five year EBITDA trend along with margin. It also depicts EBITDA share for FY22 from pharmacy, hospital and research business verticals. Deliver an awe inspiring pitch with this creative Medical Care Company Overview Ebitda And Margin Structure PDF bundle. Topics like Gross Profit, Management can be discussed with this completely editable template. It is available for immediate download depending on the needs and requirements of the user.
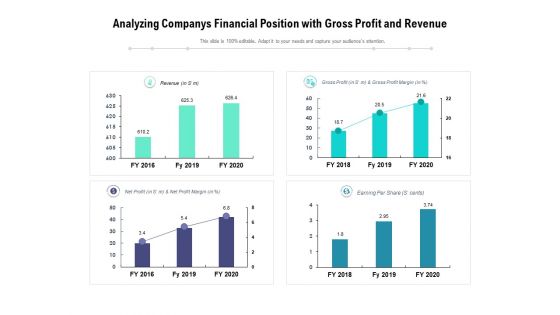
Analyzing Companys Financial Position With Gross Profit And Revenue Ppt PowerPoint Presentation File Mockup PDF
Presenting this set of slides with name analyzing companys financial position with gross profit and revenue ppt powerpoint presentation file mockup pdf. The topics discussed in these slides are revenue, profit margin, gross profit. This is a completely editable PowerPoint presentation and is available for immediate download. Download now and impress your audience.

Yearly Comparison For Operating Profit Margin And Expenses Demonstration PDF
This slide showcases comparison table that can help organization to compare operating profit margin for a period of five years. Its key components are revenue, gross profit, expenses, operating expenses, operating profit and operating margin. Showcasing this set of slides titled Yearly Comparison For Operating Profit Margin And Expenses Demonstration PDF. The topics addressed in these templates are Gross Profit, Revenue, Operating Expenses. All the content presented in this PPT design is completely editable. Download it and make adjustments in color, background, font etc. as per your unique business setting.
Erp Management Dashboard For Tracking Gross Erp And Digital Transformation For Maximizing DT SS V
This slide presents a ERP integrated finance monitoring dashboard that helps in tracking gross and net profit margin of business. It monitors KPIs such as balance, quick ratio, current ratio, total income, total expenses, accounts payable.Here you can discover an assortment of the finest PowerPoint and Google Slides templates. With these templates, you can create presentations for a variety of purposes while simultaneously providing your audience with an eye-catching visual experience. Download Erp Management Dashboard For Tracking Gross Erp And Digital Transformation For Maximizing DT SS V to deliver an impeccable presentation. These templates will make your job of preparing presentations much quicker, yet still, maintain a high level of quality. Slidegeeks has experienced researchers who prepare these templates and write high-quality content for you. Later on, you can personalize the content by editing the Erp Management Dashboard For Tracking Gross Erp And Digital Transformation For Maximizing DT SS V. This slide presents a ERP integrated finance monitoring dashboard that helps in tracking gross and net profit margin of business. It monitors KPIs such as balance, quick ratio, current ratio, total income, total expenses, accounts payable.
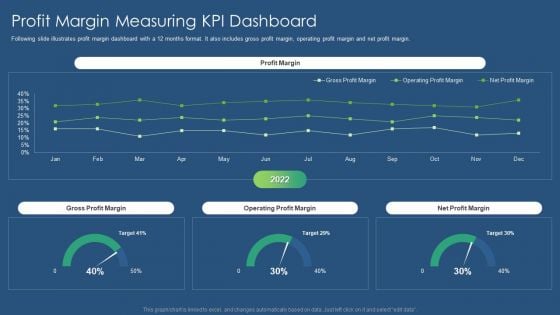
Sustainability Calculation With KPI Profit Margin Measuring Kpi Dashboard Inspiration PDF Topics PDF
Following slide illustrates profit margin dashboard with a 12 months format. It also includes gross profit margin, operating profit margin and net profit margin. Deliver and pitch your topic in the best possible manner with this sustainability calculation with kpi profit margin measuring kpi dashboard inspiration pdf. Use them to share invaluable insights on net profit margin, operating profit margin, gross profit margin and impress your audience. This template can be altered and modified as per your expectations. So, grab it now.
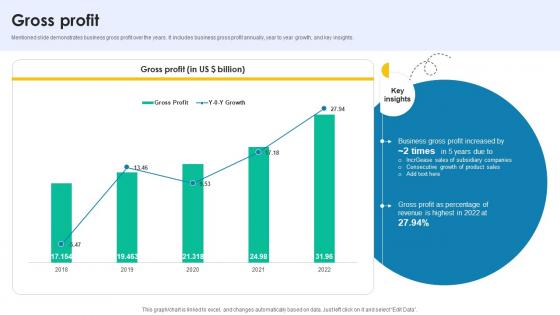
Gross Profit Medical Research And Development Company Profile CP SS V
Mentioned slide demonstrates business gross profit over the years. It includes business gross profit annually, year to year growth, and key insights. Formulating a presentation can take up a lot of effort and time, so the content and message should always be the primary focus. The visuals of the PowerPoint can enhance the presenters message, so our Gross Profit Medical Research And Development Company Profile CP SS V was created to help save time. Instead of worrying about the design, the presenter can concentrate on the message while our designers work on creating the ideal templates for whatever situation is needed. Slidegeeks has experts for everything from amazing designs to valuable content, we have put everything into Gross Profit Medical Research And Development Company Profile CP SS V. Mentioned slide demonstrates business gross profit over the years. It includes business gross profit annually, year to year growth, and key insights.

Gross Profit Split By Operating Segment Vehicle Manufacturing Company Profile CP SS V
This slide represents the gross profit spilt by Mitsubishis operating segments natural gas, industrial materials, petroleum and chemicals solution, mineral resources, etc. If you are looking for a format to display your unique thoughts, then the professionally designed Gross Profit Split By Operating Segment Vehicle Manufacturing Company Profile CP SS V is the one for you. You can use it as a Google Slides template or a PowerPoint template. Incorporate impressive visuals, symbols, images, and other charts. Modify or reorganize the text boxes as you desire. Experiment with shade schemes and font pairings. Alter, share or cooperate with other people on your work. Download Gross Profit Split By Operating Segment Vehicle Manufacturing Company Profile CP SS V and find out how to give a successful presentation. Present a perfect display to your team and make your presentation unforgettable. This slide represents the gross profit spilt by Mitsubishis operating segments natural gas, industrial materials, petroleum and chemicals solution, mineral resources, etc.
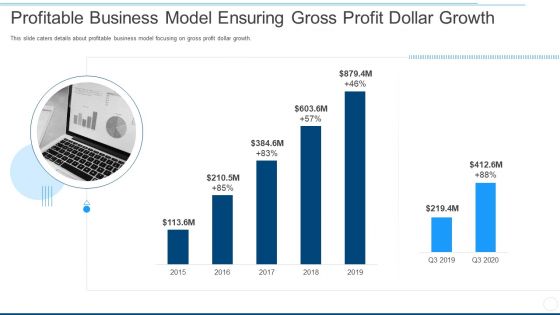
Profitable Business Model Ensuring Gross Profit Dollar Growth Ppt Gallery Design Templates PDF
This slide caters details about profitable business model focusing on gross profit dollar growth. Deliver an awe inspiring pitch with this creative profitable business model ensuring gross profit dollar growth ppt gallery design templates pdf bundle. Topics like profitable business model ensuring gross profit dollar growth can be discussed with this completely editable template. It is available for immediate download depending on the needs and requirements of the user.

Event Management Firm Overview Financial Highlights Revenue Gross Profit And Net Profit Information PDF
This slide focuses on financial highlights of event management company which represents revenue, gross profit and net profit for last five years from 2018 to 2022.Deliver and pitch your topic in the best possible manner with this Event Management Firm Overview Financial Highlights Revenue Gross Profit And Net Profit Information PDF Use them to share invaluable insights on Value, Gross Profit, Net Profit and impress your audience. This template can be altered and modified as per your expectations. So, grab it now.
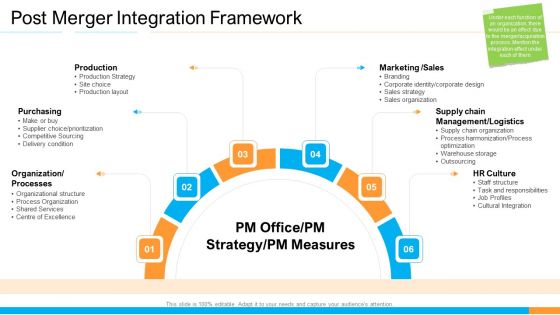
Business Takeover Plan For Inorganic Growth Profitability Ratios Gross Infographics PDF
Deliver and pitch your topic in the best possible manner with this business takeover plan for inorganic growth profitability ratios gross infographics pdf. Use them to share invaluable insights on gross profit ratio, net profit ratio, net profit after tax or net sales, gross profit or net sales and impress your audience. This template can be altered and modified as per your expectations. So, grab it now.
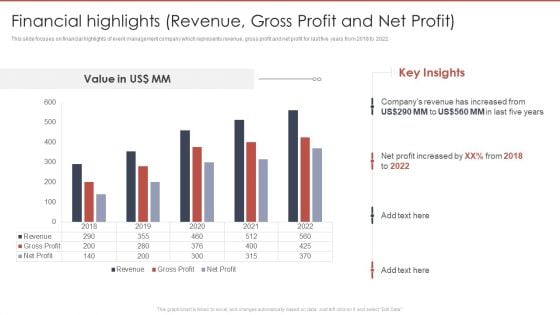
Event Planning And Management Company Profile Financial Highlights Revenue Gross Profit Slides PDF
This slide focuses on financial highlights of event management company which represents revenue, gross profit and net profit for last five years from 2018 to 2022. Deliver an awe inspiring pitch with this creative Event Planning And Management Company Profile Financial Highlights Revenue Gross Profit Slides PDF bundle. Topics like Revenue Gross Profit, Net Profit Increased, 2018 To 2022 can be discussed with this completely editable template. It is available for immediate download depending on the needs and requirements of the user.
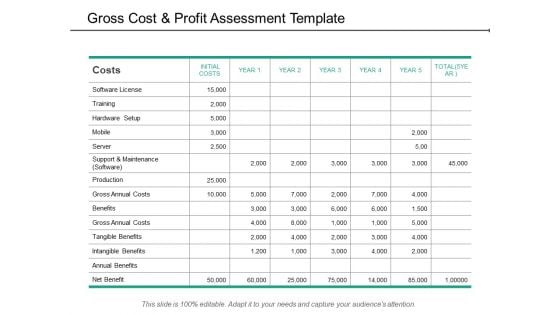
Gross Cost And Profit Assessment Template Ppt PowerPoint Presentation Layouts Background
This is a gross cost and profit assessment template ppt powerpoint presentation layouts background. This is a eight stage process. The stages in this process are cost benefit analysis, cost benefit investigation, cost benefit examination.
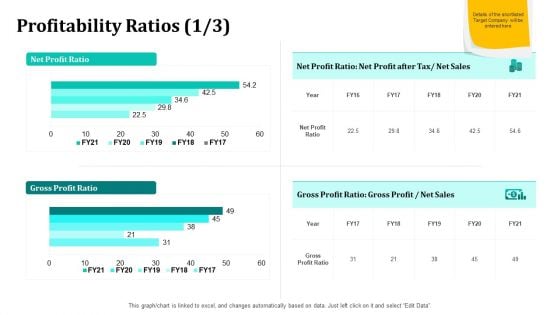
Merger And Acquisition Strategy For Inorganic Growth Profitability Ratios Gross Profit Ppt Sample PDF
Deliver and pitch your topic in the best possible manner with this merger and acquisition strategy for inorganic growth profitability ratios gross profit ppt sample pdf. Use them to share invaluable insights on net profit ratio, gross profit ratio, profitability ratios and impress your audience. This template can be altered and modified as per your expectations. So, grab it now.
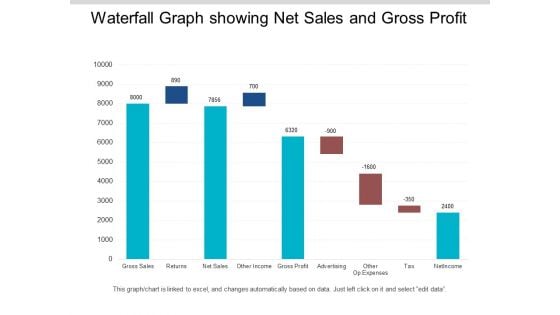
Waterfall Graph Showing Net Sales And Gross Profit Ppt PowerPoint Presentation Infographics Format
This is a waterfall graph showing net sales and gross profit ppt powerpoint presentation infographics format. This is a three stage process. The stages in this process are profit and loss, balance sheet, income statement, benefit and loss.
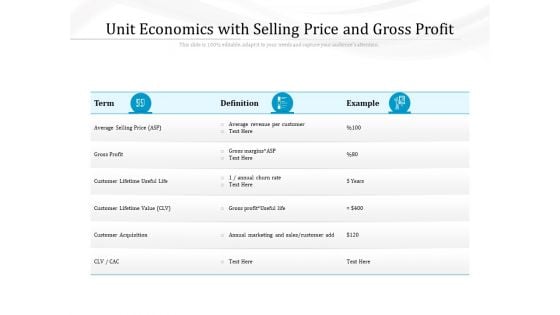
Unit Economics With Selling Price And Gross Profit Ppt PowerPoint Presentation Ideas Design Inspiration PDF
Presenting this set of slides with name unit economics with selling price and gross profit ppt powerpoint presentation ideas design inspiration pdf. The topics discussed in these slides are term, definition, example, average selling price, gross profit, customer lifetime useful life, customer acquisition. This is a completely editable PowerPoint presentation and is available for immediate download. Download now and impress your audience.
Gross And Net Revenue Comparison Shown By Graph Ppt PowerPoint Presentation File Icons PDF
Presenting this set of slides with name gross and net revenue comparison shown by graph ppt powerpoint presentation file icons pdf. The topics discussed in these slides are gross profit, net profit. This is a completely editable PowerPoint presentation and is available for immediate download. Download now and impress your audience.
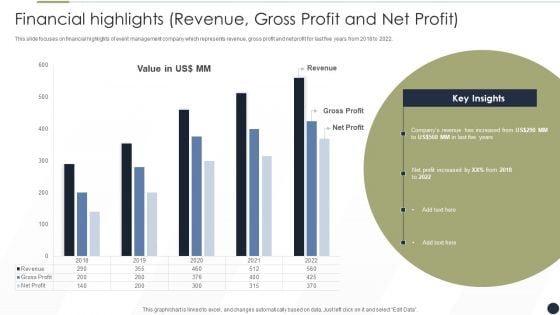
Event Management Services Company Profile Financial Highlights Revenue Gross Profit And Net Profit Template PDF
This slide focuses on financial highlights of event management company which represents revenue, gross profit and net profit for last five years from 2018 to 2022.Deliver and pitch your topic in the best possible manner with this Event Management Services Company Profile Financial Highlights Revenue Gross Profit And Net Profit Template PDF Use them to share invaluable insights on Gross Profit, Key Insights, profit increased and impress your audience. This template can be altered and modified as per your expectations. So, grab it now.
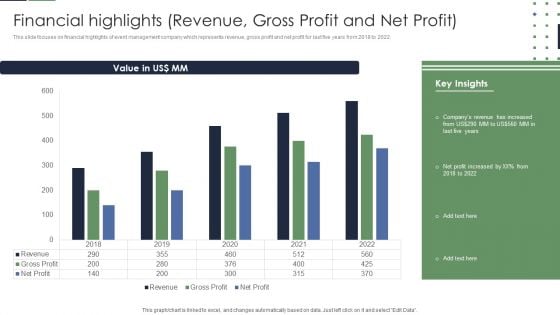
Event Planner Company Profile Financial Highlights Revenue Gross Profit And Net Profit Summary PDF
This slide focuses on financial highlights of event management company which represents revenue, gross profit and net profit for last five years from 2018 to 2022. Deliver an awe inspiring pitch with this creative Event Planner Company Profile Financial Highlights Revenue Gross Profit And Net Profit Summary PDF bundle. Topics like Value, Revenue, Net Profit can be discussed with this completely editable template. It is available for immediate download depending on the needs and requirements of the user.
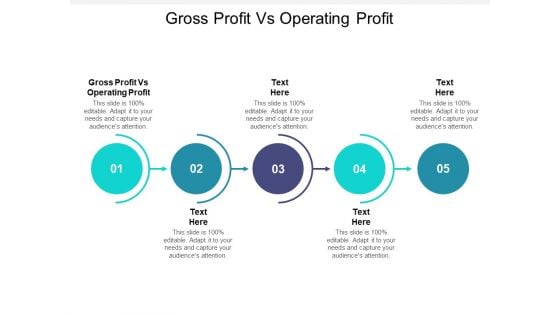
Gross Profit Vs Operating Profit Ppt PowerPoint Presentation Layouts Guide Cpb Pdf
Presenting this set of slides with name gross profit vs operating profit ppt powerpoint presentation layouts guide cpb pdf. This is an editable Powerpoint five stages graphic that deals with topics like gross profit vs operating profit to help convey your message better graphically. This product is a premium product available for immediate download and is 100 percent editable in Powerpoint. Download this now and use it in your presentations to impress your audience.
Quarterly Financial Report With Expenses And Gross Profit Ppt PowerPoint Presentation Ideas Icons
This is a quarterly financial report with expenses and gross profit ppt powerpoint presentation ideas icons. This is a five stage process. The stages in this process are accounting review, accounting report, accounting statement.
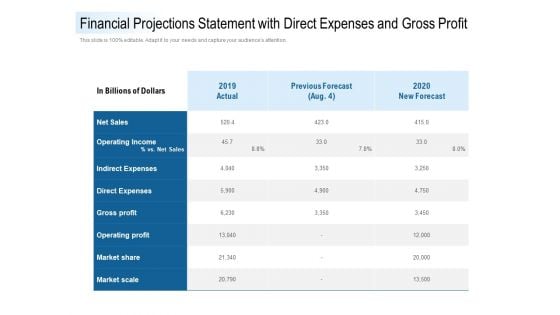
Financial Projections Statement With Direct Expenses And Gross Profit Ppt PowerPoint Presentation Show Layouts
Presenting this set of slides with name financial projections statement with direct expenses and gross profit ppt powerpoint presentation show layouts. The topics discussed in these slides are 2019 actual, previous forecast, 2020 new forecast, net sales, operating income, indirect expenses, direct expenses, gross profit, operating profit, market share, market scale. This is a completely editable PowerPoint presentation and is available for immediate download. Download now and impress your audience.
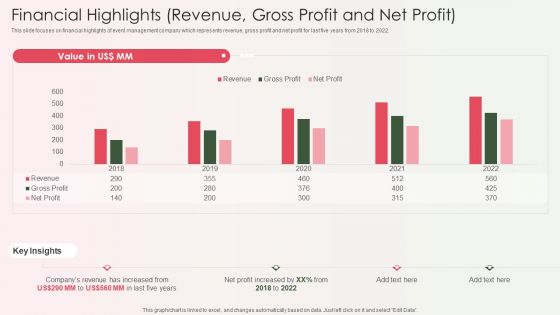
Event Organizer And Coordinator Company Profile Financial Highlights Revenue Gross Profit And Net Profit Formats PDF
This slide focuses on financial highlights of event management company which represents revenue, gross profit and net profit for last five years from 2018 to 2022.Deliver and pitch your topic in the best possible manner with this Event Organizer And Coordinator Company Profile Financial Highlights Revenue Gross Profit And Net Profit Formats PDF Use them to share invaluable insights on Revenue Increased, Profit Increased, Key Insights and impress your audience. This template can be altered and modified as per your expectations. So, grab it now.

Gross Profit Statement With Budget And Current Period Ppt PowerPoint Presentation Gallery Portrait PDF
Presenting this set of slides with name gross profit statement with budget and current period ppt powerpoint presentation gallery portrait pdf. The topics discussed in these slides are sales, revenue, budget. This is a completely editable PowerPoint presentation and is available for immediate download. Download now and impress your audience.
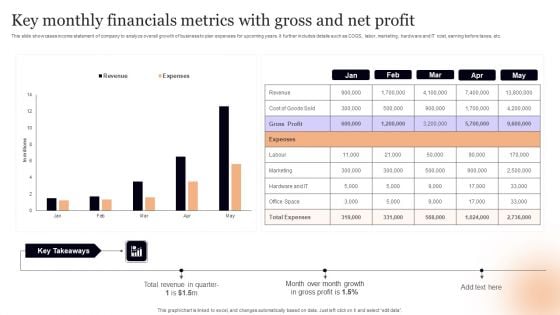
Key Monthly Financials Metrics With Gross And Net Profit Guidelines PDF
This slide showcases income statement of company to analyze overall growth of business to plan expenses for upcoming years. It further includes details such as COGS, labor, marketing, hardware and IT cost, earning before taxes, etc. Showcasing this set of slides titled Key Monthly Financials Metrics With Gross And Net Profit Guidelines PDF. The topics addressed in these templates are Key Takeaways, Total Revenue, Profit. All the content presented in this PPT design is completely editable. Download it and make adjustments in color, background, font etc. as per your unique business setting.
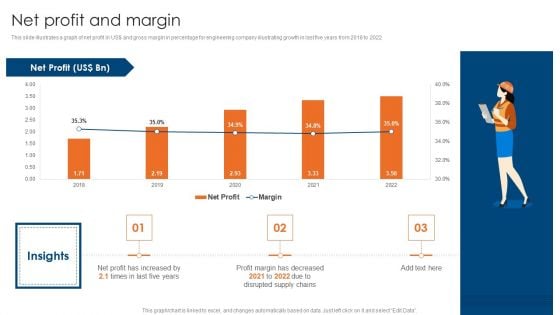
Engineering Consultancy Works Company Profile Net Profit And Margin Clipart PDF
This slide illustrates a graph of net profit in US doller and gross margin in percentage for engineering company illustrating growth in last five years from 2018 to 2022. Deliver an awe inspiring pitch with this creative Engineering Consultancy Works Company Profile Net Profit And Margin Clipart PDF bundle. Topics like Net Profit And Margin can be discussed with this completely editable template. It is available for immediate download depending on the needs and requirements of the user.
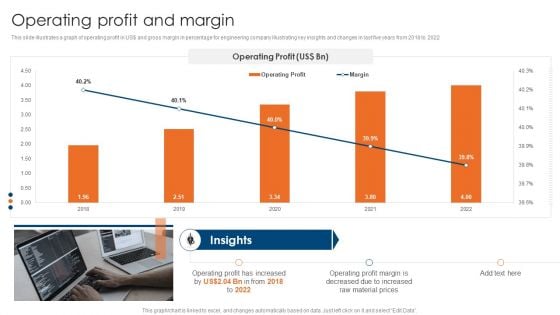
Engineering Consultancy Works Company Profile Operating Profit And Margin Topics PDF
This slide illustrates a graph of operating profit in US doller and gross margin in percentage for engineering company illustrating key insights and changes in last five years from 2018 to 2022. Deliver an awe inspiring pitch with this creative Engineering Consultancy Works Company Profile Operating Profit And Margin Topics PDF bundle. Topics like Operating, Profit, Margin can be discussed with this completely editable template. It is available for immediate download depending on the needs and requirements of the user.
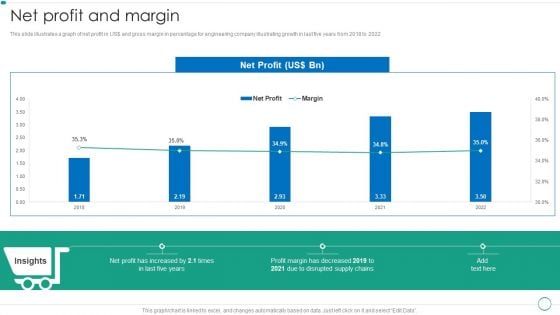
Real Estate Construction And Engineering Company Profile Net Profit And Margin Diagrams PDF
This slide illustrates a graph of net profit in US and gross margin in percentage for engineering company illustrating growth in last five years from 2018 to 2022.Deliver an awe inspiring pitch with this creative Real Estate Construction And Engineering Company Profile Net Profit And Margin Diagrams PDF bundle. Topics like Disrupted Supply, Profit Margin, Increased can be discussed with this completely editable template. It is available for immediate download depending on the needs and requirements of the user.
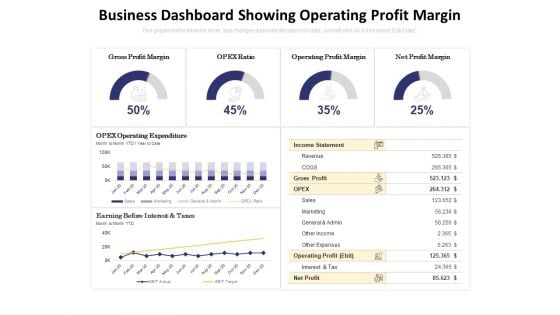
Business Dashboard Showing Operating Profit Margin Ppt PowerPoint Presentation Show Portrait PDF
Presenting this set of slides with name business dashboard showing operating profit margin ppt powerpoint presentation show portrait pdf. The topics discussed in these slides are gross profit margin, opex ratio, operating profit margin, net profit margin, opex operating expenditure. This is a completely editable PowerPoint presentation and is available for immediate download. Download now and impress your audience.

Instant Snacks And Food Firm Details Net Profit And Margin Microsoft PDF
This slide illustrates a graph of net profit in US and gross margin in percentage for food company. Additionally, it shows net profit of all business lines of the company food, beverage and dairy products.Deliver and pitch your topic in the best possible manner with this Instant Snacks And Food Firm Details Net Profit And Margin Microsoft PDF Use them to share invaluable insights on Profit Increased, Profit Margin, Disrupted Supply and impress your audience. This template can be altered and modified as per your expectations. So, grab it now.
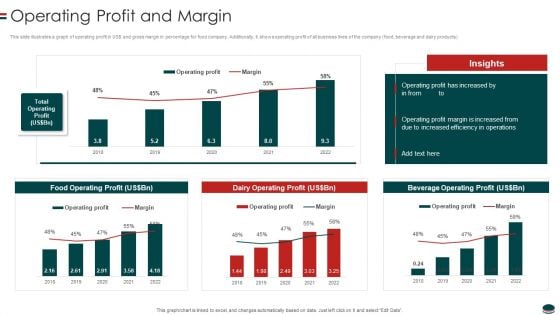
Instant Snacks And Food Firm Details Operating Profit And Margin Themes PDF
This slide illustrates a graph of operating profit in US and gross margin in percentage for food company. Additionally, it shows operating profit of all business lines of the company food, beverage and dairy products.Deliver an awe inspiring pitch with this creative Instant Snacks And Food Firm Details Operating Profit And Margin Themes PDF bundle. Topics like Operating Profit, Increased Efficiency, Beverage Operating can be discussed with this completely editable template. It is available for immediate download depending on the needs and requirements of the user.
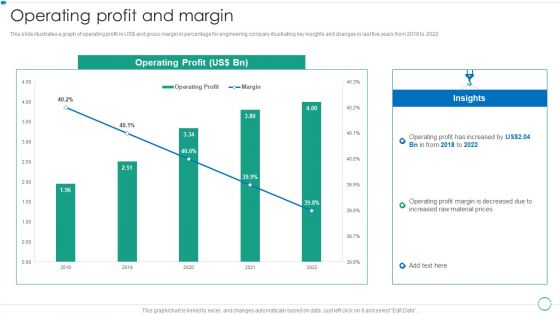
Real Estate Construction And Engineering Company Profile Operating Profit And Margin Designs PDF
This slide illustrates a graph of operating profit in US and gross margin in percentage for engineering company illustrating key insights and changes in last five years from 2018 to 2022.Deliver and pitch your topic in the best possible manner with this Real Estate Construction And Engineering Company Profile Operating Profit And Margin Designs PDF. Use them to share invaluable insights on Operating Profit, Insights, Material Prices and impress your audience. This template can be altered and modified as per your expectations. So, grab it now.
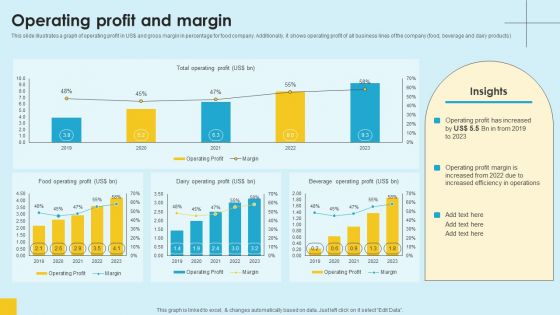
Food Company Financial Performance Summary Operating Profit And Margin Topics PDF
This slide illustrates a graph of operating profit in US dollar and gross margin in percentage for food company. Additionally, it shows operating profit of all business lines of the company food, beverage and dairy products. Find a pre-designed and impeccable Food Company Financial Performance Summary Operating Profit And Margin Topics PDF. The templates can ace your presentation without additional effort. You can download these easy-to-edit presentation templates to make your presentation stand out from others. So, what are you waiting for Download the template from Slidegeeks today and give a unique touch to your presentation.
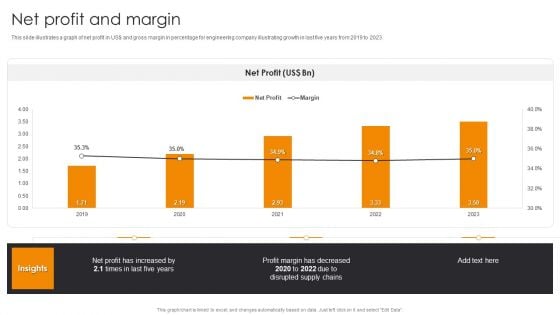
Net Profit And Margin Engineering Company Financial Analysis Report Background PDF
This slide illustrates a graph of net profit in US dollar and gross margin in percentage for engineering company illustrating growth in last five years from 2019 to 2023.Slidegeeks has constructed Net Profit And Margin Engineering Company Financial Analysis Report Background PDF after conducting extensive research and examination. These presentation templates are constantly being generated and modified based on user preferences and critiques from editors. Here, you will find the most attractive templates for a range of purposes while taking into account ratings and remarks from users regarding the content. This is an excellent jumping-off point to explore our content and will give new users an insight into our top-notch PowerPoint Templates.
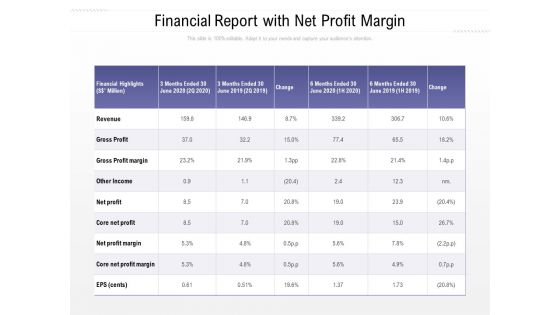
Financial Report With Net Profit Margin Ppt PowerPoint Presentation File Example PDF
Presenting this set of slides with name financial report with net profit margin ppt powerpoint presentation file example pdf. The topics discussed in these slides are revenue, gross profit, gross profit margin, other income, net profit, core net profit, net profit margin, core net profit margin. This is a completely editable PowerPoint presentation and is available for immediate download. Download now and impress your audience.
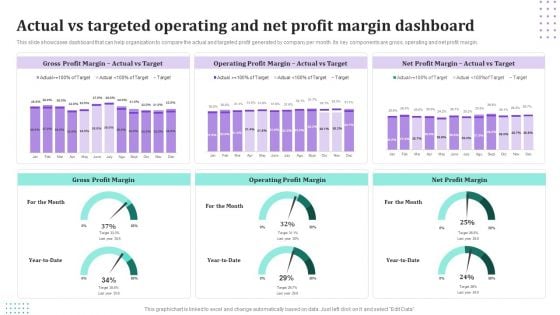
Actual Vs Targeted Operating And Net Profit Margin Dashboard Information PDF
This slide showcases dashboard that can help organization to compare the actual and targeted profit generated by company per month. Its key components are gross, operating and net profit margin. Showcasing this set of slides titled Actual Vs Targeted Operating And Net Profit Margin Dashboard Information PDF. The topics addressed in these templates are Gross Profit Margin, Operating Profit Margin, Net Profit Margin. All the content presented in this PPT design is completely editable. Download it and make adjustments in color, background, font etc. as per your unique business setting.
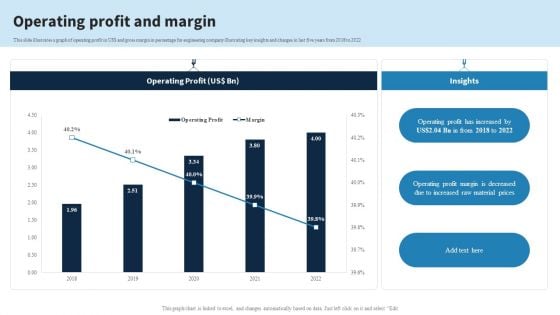
Engineering Services Company Report Operating Profit And Margin Ppt PowerPoint Presentation Gallery Show PDF
This slide illustrates a graph of operating profit in US dollar and gross margin in percentage for engineering company illustrating key insights and changes in last five years from 2018 to 2022. Do you have an important presentation coming up Are you looking for something that will make your presentation stand out from the rest Look no further than Engineering Services Company Report Operating Profit And Margin Ppt PowerPoint Presentation Gallery Show PDF. With our professional designs, you can trust that your presentation will pop and make delivering it a smooth process. And with Slidegeeks, you can trust that your presentation will be unique and memorable. So why wait Grab Engineering Services Company Report Operating Profit And Margin Ppt PowerPoint Presentation Gallery Show PDF today and make your presentation stand out from the rest.

Operating Profit And Margin Engineering Company Financial Analysis Report Portrait PDF
This slide illustrates a graph of operating profit in US dollar and gross margin in percentage for engineering company illustrating key insights and changes in last five years from 2019 to 2023. Here you can discover an assortment of the finest PowerPoint and Google Slides templates. With these templates, you can create presentations for a variety of purposes while simultaneously providing your audience with an eye-catching visual experience. Download Operating Profit And Margin Engineering Company Financial Analysis Report Portrait PDF to deliver an impeccable presentation. These templates will make your job of preparing presentations much quicker, yet still, maintain a high level of quality. Slidegeeks has experienced researchers who prepare these templates and write high-quality content for you. Later on, you can personalize the content by editing the Operating Profit And Margin Engineering Company Financial Analysis Report Portrait PDF.
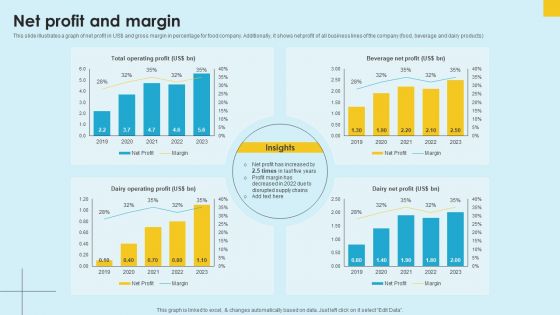
Food Company Financial Performance Summary Net Profit And Margin Professional PDF
This slide illustrates a graph of net profit in US dollar and gross margin in percentage for food company. Additionally, it shows net profit of all business lines of the company food, beverage and dairy products. Do you know about Slidesgeeks Food Company Financial Performance Summary Net Profit And Margin Professional PDF These are perfect for delivering any kind od presentation. Using it, create PowerPoint presentations that communicate your ideas and engage audiences. Save time and effort by using our pre-designed presentation templates that are perfect for a wide range of topic. Our vast selection of designs covers a range of styles, from creative to business, and are all highly customizable and easy to edit. Download as a PowerPoint template or use them as Google Slides themes.
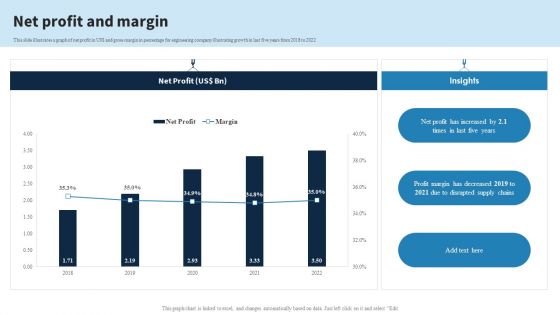
Engineering Services Company Report Net Profit And Margin Ppt PowerPoint Presentation File Aids PDF
This slide illustrates a graph of net profit in US dollar and gross margin in percentage for engineering company illustrating growth in last five years from 2018 to 2022. Present like a pro with Engineering Services Company Report Net Profit And Margin Ppt PowerPoint Presentation File Aids PDF Create beautiful presentations together with your team, using our easy-to-use presentation slides. Share your ideas in real-time and make changes on the fly by downloading our templates. So whether youre in the office, on the go, or in a remote location, you can stay in sync with your team and present your ideas with confidence. With Slidegeeks presentation got a whole lot easier. Grab these presentations today.
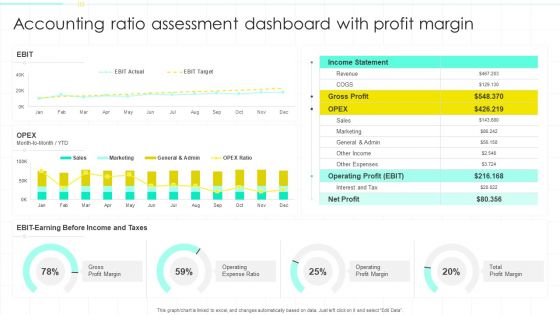
Accounting Ratio Assessment Dashboard With Profit Margin Ppt PowerPoint Presentation Summary Design Ideas PDF
Showcasing this set of slides titled Accounting Ratio Assessment Dashboard With Profit Margin Ppt PowerPoint Presentation Summary Design Ideas PDF. The topics addressed in these templates are Gross Profit, Operating Profit, Interest Tax. All the content presented in this PPT design is completely editable. Download it and make adjustments in color, background, font etc. as per your unique business setting.
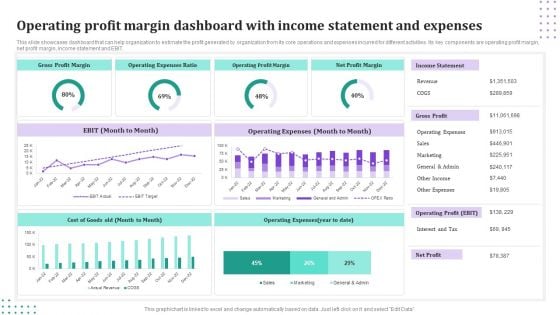
Operating Profit Margin Dashboard With Income Statement And Expenses Brochure PDF
This slide showcases dashboard that can help organization to estimate the profit generated by organization from its core operations and expenses incurred for different activities. Its key components are operating profit margin, net profit margin, income statement and EBIT. Showcasing this set of slides titled Operating Profit Margin Dashboard With Income Statement And Expenses Brochure PDF. The topics addressed in these templates are Operating Expenses, Income Statement, Gross Profit. All the content presented in this PPT design is completely editable. Download it and make adjustments in color, background, font etc. as per your unique business setting.
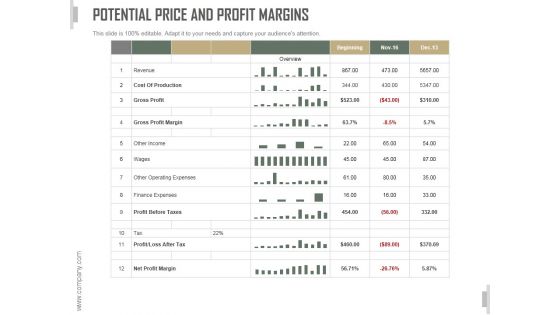
Potential Price And Profit Margins Ppt PowerPoint Presentation Visual Aids
This is a potential price and profit margins ppt powerpoint presentation visual aids. This is a twelve stage process. The stages in this process are gross profit, cost of production, gross profit margin, other income, finance expenses.
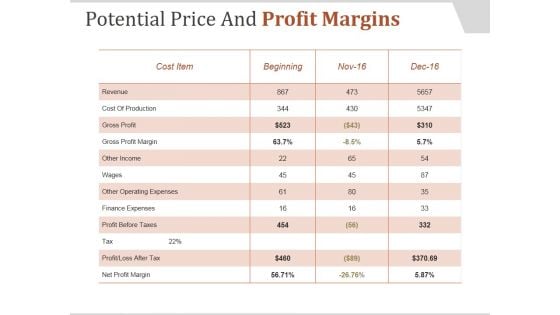
Potential Price And Profit Margins Ppt PowerPoint Presentation Design Templates
This is a potential price and profit margins ppt powerpoint presentation design templates. This is a three stage process. The stages in this process are cost item, beginning, revenue, cost of production, gross profit, gross profit margin, other income, wages.
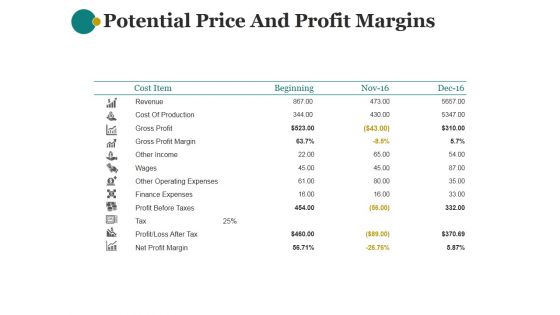
Potential Price And Profit Margins Ppt PowerPoint Presentation Background Images
This is a potential price and profit margins ppt powerpoint presentation background images. This is a three stage process. The stages in this process are cost item, beginning, revenue, cost of production, gross profit, gross profit margin, other income.
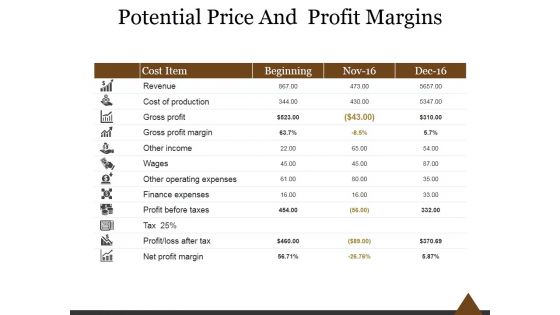
Potential Price And Profit Margins Ppt PowerPoint Presentation Infographics
This is a potential price and profit margins ppt powerpoint presentation infographics. This is a four stage process. The stages in this process are cost item, revenue, cost of production, gross profit, gross profit margin.


 Continue with Email

 Home
Home


