Gross Margin
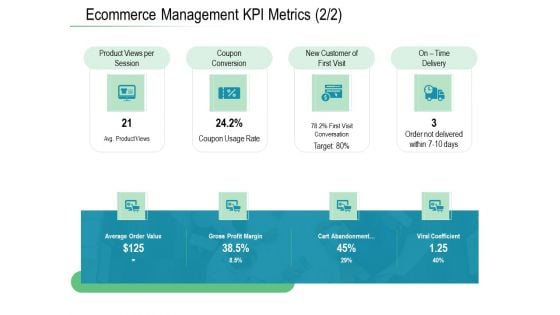
Online Distribution Services Ecommerce Management KPI Metrics Delivery Ppt Visual Aids Inspiration PDF
This is a online distribution services ecommerce management kpi metrics delivery ppt visual aids inspiration pdf template with various stages. Focus and dispense information on four stages using this creative set, that comes with editable features. It contains large content boxes to add your information on topics like average order value, gross profit margin, cart abandonment, viral coefficient. You can also showcase facts, figures, and other relevant content using this PPT layout. Grab it now.
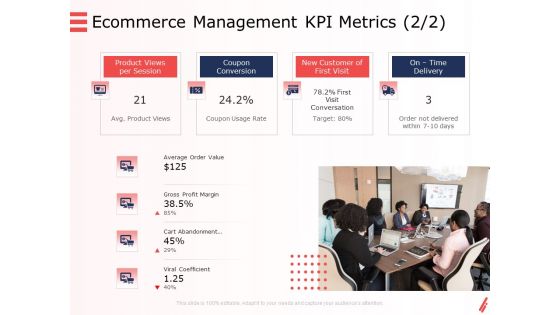
Digital Products And Services Ecommerce Management KPI Metrics Delivery Ppt Summary Images PDF
This is a digital products and services ecommerce management kpi metrics delivery ppt summary images pdf template with various stages. Focus and dispense information on four stages using this creative set, that comes with editable features. It contains large content boxes to add your information on topics like average order value, gross profit margin, cart abandonment, viral coefficient. You can also showcase facts, figures, and other relevant content using this PPT layout. Grab it now.
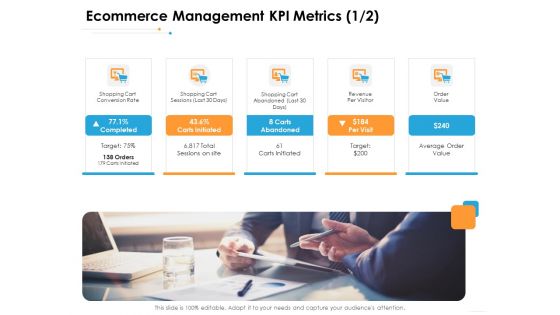
Ecommerce Management Ecommerce Management KPI Metrics Delivery Ppt Outline Clipart PDF
This is a ecommerce management ecommerce management kpi metrics delivery ppt outline clipart pdf template with various stages. Focus and dispense information on four stages using this creative set, that comes with editable features. It contains large content boxes to add your information on topics like average order value, gross profit margin, cart abandonment, viral coefficient. You can also showcase facts, figures, and other relevant content using this PPT layout. Grab it now.

Ecommerce Solution Providers Ecommerce Management KPI Metrics Value Ppt Ideas Background Designs PDF
This is a ecommerce solution providers ecommerce management kpi metrics value ppt ideas background designs pdf template with various stages. Focus and dispense information on four stages using this creative set, that comes with editable features. It contains large content boxes to add your information on topics like average order value, gross profit margin, cart abandonment, viral coefficient. You can also showcase facts, figures, and other relevant content using this PPT layout. Grab it now.

Online Trade Management System Ecommerce Management KPI Metrics Delivery Ppt Layouts Gallery PDF
This is a online trade management system ecommerce management kpi metrics delivery ppt layouts gallery pdf template with various stages. Focus and dispense information on four stages using this creative set, that comes with editable features. It contains large content boxes to add your information on topics like average order value, gross profit margin, cart abandonment, viral coefficient. You can also showcase facts, figures, and other relevant content using this PPT layout. Grab it now.

Ecommerce Management KPI Metrics Ppt Outline Infographics PDF
This is a ecommerce management kpi metrics ppt outline infographics pdf template with various stages. Focus and dispense information on four stages using this creative set, that comes with editable features. It contains large content boxes to add your information on topics like average order value, gross profit margin, conversation. You can also showcase facts, figures, and other relevant content using this PPT layout. Grab it now.
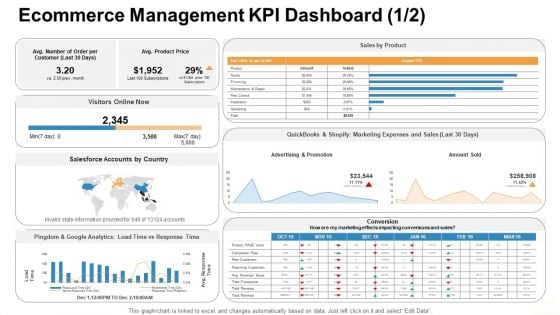
Ecommerce Management KPI Dashboard Sales Ppt Model Visual Aids PDF
This is a ecommerce management kpi dashboard sales ppt model visual aids pdf. template with various stages. Focus and dispense information on four stages using this creative set, that comes with editable features. It contains large content boxes to add your information on topics like product views per session, gross profit margin, average order value. You can also showcase facts, figures, and other relevant content using this PPT layout. Grab it now.
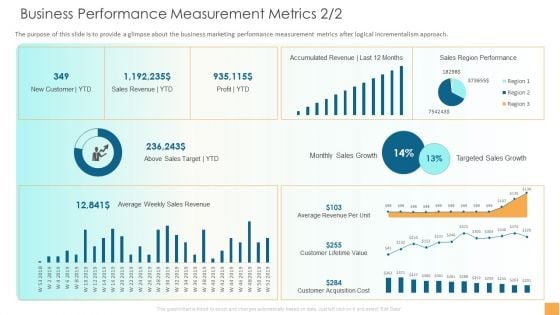
Analytical Incrementalism Business Performance Measurement Metrics Sales Infographics PDF
The purpose of this slide is to provide a glimpse about the business marketing performance measurement metrics after logical incrementalism approach. Deliver an awe-inspiring pitch with this creative analytical incrementalism business performance measurement metrics sales infographics pdf bundle. Topics like gross profit margin, revenue, quick ratio can be discussed with this completely editable template. It is available for immediate download depending on the needs and requirements of the user.
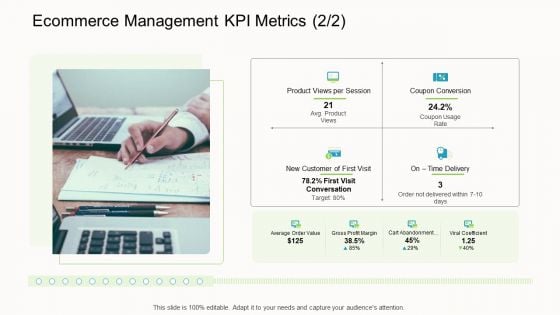
Online Corporate Approach Ecommerce Management KPI Metrics Summary PDF
Presenting online corporate approach ecommerce management kpi metrics summary pdf to provide visual cues and insights. Share and navigate important information on four stages that need your due attention. This template can be used to pitch topics like new customer, average order value, gross profit margin. In addition, this PPT design contains high-resolution images, graphics, etc, that are easily editable and available for immediate download.
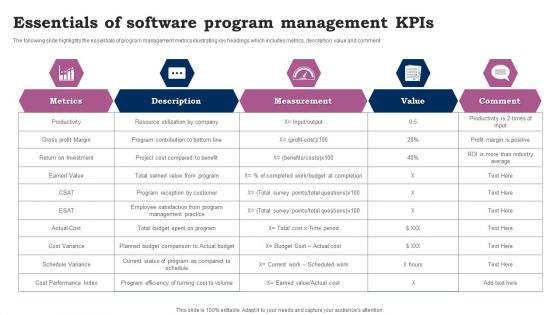
Essentials Of Software Program Management Kpis Ppt Infographics Design Inspiration PDF
The following slide highlights the essentials of program management metrics illustrating key headings which includes metrics, description, value and comment. Showcasing this set of slides titled Essentials Of Software Program Management Kpis Ppt Infographics Design Inspiration PDF. The topics addressed in these templates are Metrics, Productivity, Gross Profit Margin. All the content presented in this PPT design is completely editable. Download it and make adjustments in color, background, font etc. as per your unique business setting.
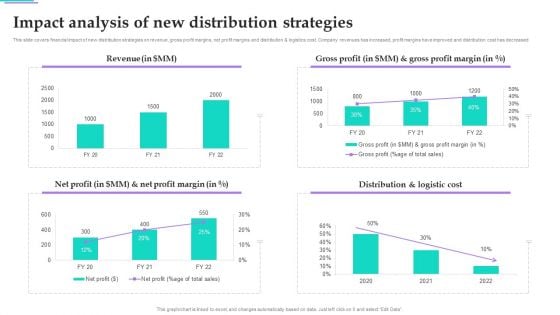
Distribution Strategies For Increasing Impact Analysis Of New Distribution Strategies Elements PDF
This slide covers financial impact of new distribution strategies on revenue, gross profit margins, net profit margins and distribution and logistics cost. Company revenues has increased, profit margins have improved and distribution cost has decreased. The best PPT templates are a great way to save time, energy, and resources. Slidegeeks have 100 percent editable powerpoint slides making them incredibly versatile. With these quality presentation templates, you can create a captivating and memorable presentation by combining visually appealing slides and effectively communicating your message. Download Distribution Strategies For Increasing Impact Analysis Of New Distribution Strategies Elements PDF from Slidegeeks and deliver a wonderful presentation.
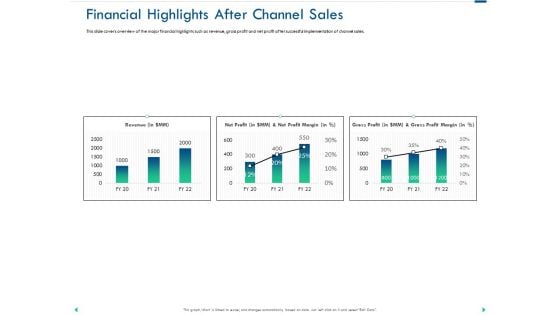
Channel Sales Taking Your Product To Market Financial Highlights After Channel Sales Professional PDF
Presenting this set of slides with name channel sales taking your product to market financial highlights after channel sales professional pdf. The topics discussed in these slides are revenue, profit margin, gross profit. This is a completely editable PowerPoint presentation and is available for immediate download. Download now and impress your audience.
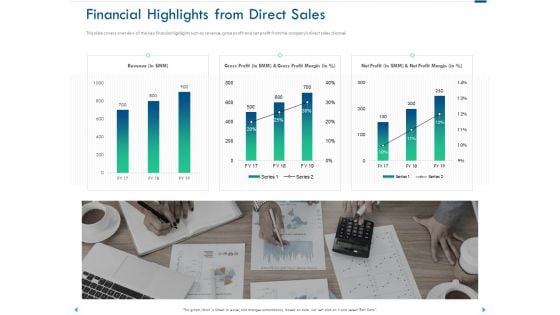
Channel Sales Taking Your Product To Market Financial Highlights From Direct Sales Topics PDF
Presenting this set of slides with name channel sales taking your product to market financial highlights from direct sales topics pdf. The topics discussed in these slides are revenue, profit margin, gross profit. This is a completely editable PowerPoint presentation and is available for immediate download. Download now and impress your audience.
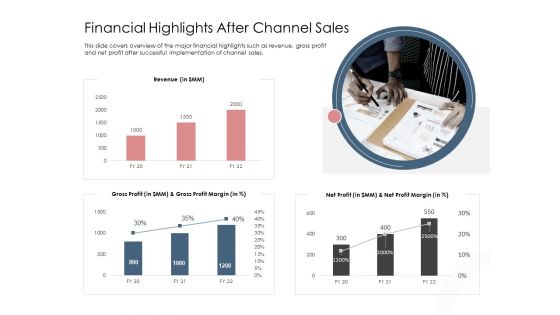
Best Practices Increase Revenue Out Indirect Financial Highlights After Channel Sales Information PDF
Deliver an awe inspiring pitch with this creative best practices increase revenue out indirect financial highlights after channel sales information pdf bundle. Topics like revenue, profit margin, gross profit can be discussed with this completely editable template. It is available for immediate download depending on the needs and requirements of the user.
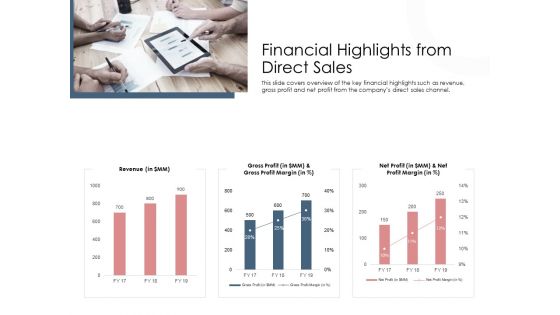
Best Practices Increase Revenue Out Indirect Financial Highlights From Direct Sales Microsoft PDF
Deliver and pitch your topic in the best possible manner with this best practices increase revenue out indirect financial highlights from direct sales microsoft pdf. Use them to share invaluable insights on revenue, profit margin, gross profit and impress your audience. This template can be altered and modified as per your expectations. So, grab it now.
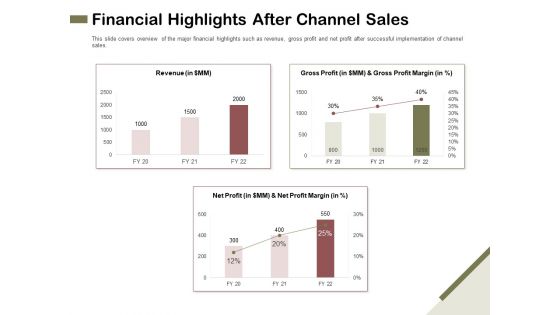
Promotional Channels And Action Plan For Increasing Revenues Financial Highlights After Channel Sales Portrait PDF
Deliver an awe inspiring pitch with this creative promotional channels and action plan for increasing revenues financial highlights after channel sales portrait pdf bundle. Topics like revenue, profit margin, gross profit can be discussed with this completely editable template. It is available for immediate download depending on the needs and requirements of the user.
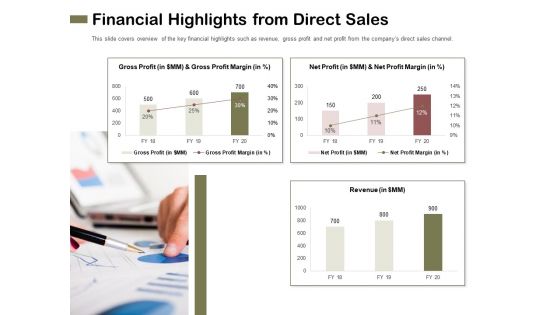
Promotional Channels And Action Plan For Increasing Revenues Financial Highlights From Direct Sales Inspiration PDF
Deliver and pitch your topic in the best possible manner with this promotional channels and action plan for increasing revenues financial highlights from direct sales inspiration pdf. Use them to share invaluable insights on revenue, profit margin, gross profit and impress your audience. This template can be altered and modified as per your expectations. So, grab it now.
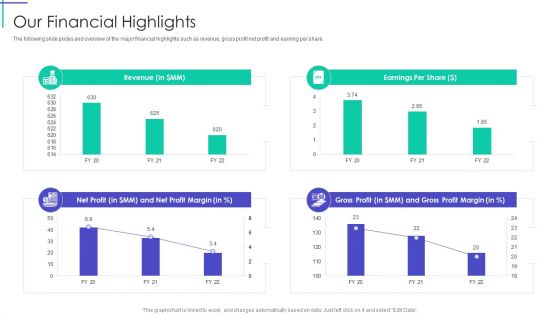
Mortgage Recovery Strategy For Finance Companies Our Financial Highlights Graphics PDF
Deliver and pitch your topic in the best possible manner with this Mortgage Recovery Strategy For Finance Companies Our Financial Highlights Graphics PDF. Use them to share invaluable insights on Net Profit Margin, Gross Profit, Revenue and impress your audience. This template can be altered and modified as per your expectations. So, grab it now.
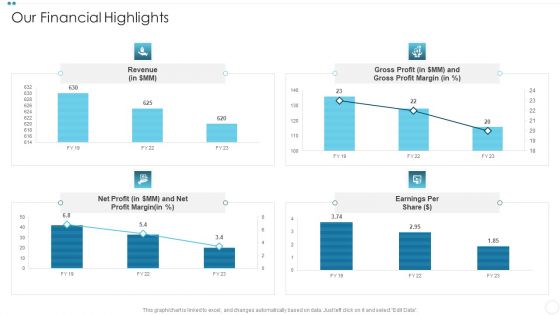
Company Sales Lead Qualification Procedure To Enhance Revenue Our Financial Highlights Graphics PDF
Deliver and pitch your topic in the best possible manner with this Company Sales Lead Qualification Procedure To Enhance Revenue Our Financial Highlights Graphics PDF Use them to share invaluable insights on Gross Profit, Profit Margin, Revenue and impress your audience. This template can be altered and modified as per your expectations. So, grab it now.
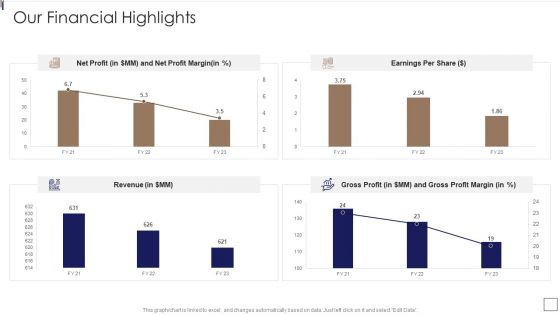
Sales Lead Qualification Procedure And Parameter Our Financial Highlights Topics PDF
Deliver and pitch your topic in the best possible manner with this Sales Lead Qualification Procedure And Parameter Our Financial Highlights Topics PDF Use them to share invaluable insights on Profit Margin, Gross Profit, Revenue and impress your audience. This template can be altered and modified as per your expectations. So, grab it now.
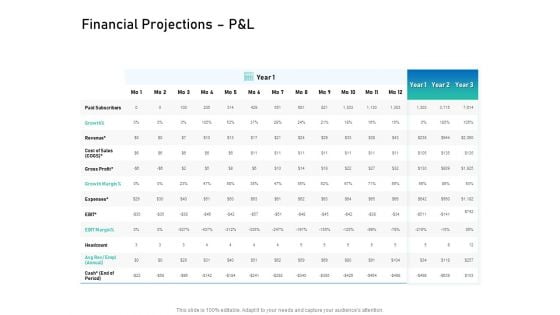
Alliance Evaluation Financial Projections P And L Growth Ppt Styles Templates PDF
Presenting this set of slides with name alliance evaluation financial projections p and l growth ppt styles templates pdf. The topics discussed in these slides are paid subscribers, growth, revenue, cost of sales, gross profit, growth margin, expenses. This is a completely editable PowerPoint presentation and is available for immediate download. Download now and impress your audience.
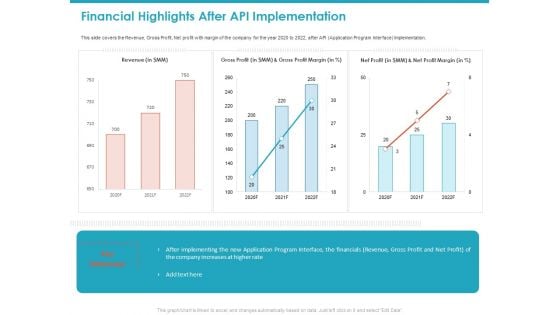
Financial Highlights After API Implementation Revenue Ppt Model Design Inspiration PDF
This slide covers the Revenue, Gross Profit, Net profit with margin of the company for the year 2020 to 2022, after API Application Program Interface Implementation. Deliver an awe-inspiring pitch with this creative financial highlights after api implementation revenue ppt model design inspiration pdf bundle. Topics like revenue, gross profit, net profit can be discussed with this completely editable template. It is available for immediate download depending on the needs and requirements of the user.
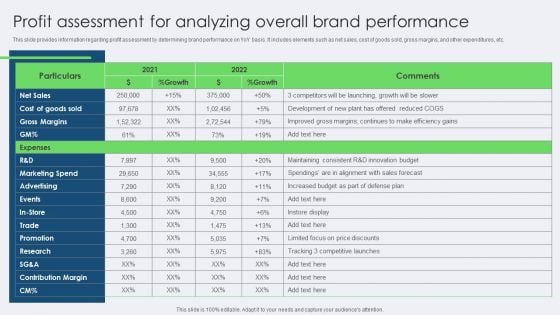
Profit Assessment For Analyzing Overall Brand Performance Inspiration PDF
This slide provides information regarding profit assessment by determining brand performance on YoY basis. It includes elements such as net sales, cost of goods sold, gross margins, and other expenditures, etc. Get a simple yet stunning designed Profit Assessment For Analyzing Overall Brand Performance Inspiration PDF. It is the best one to establish the tone in your meetings. It is an excellent way to make your presentations highly effective. So, download this PPT today from Slidegeeks and see the positive impacts. Our easy to edit Profit Assessment For Analyzing Overall Brand Performance Inspiration PDF can be your go to option for all upcoming conferences and meetings. So, what are you waiting for Grab this template today.
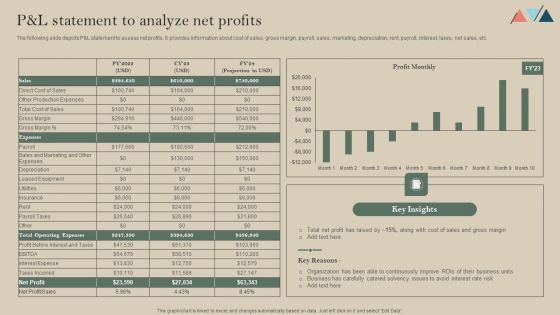
Pand L Statement To Analyze Net Profits Infographics PDF
The following slide depicts P and L statement to assess net profits. It provides information about cost of sales, gross margin, payroll, sales, marketing, depreciation, rent, payroll, interest, taxes, net sales, etc. Slidegeeks has constructed Pand L Statement To Analyze Net Profits Infographics PDF after conducting extensive research and examination. These presentation templates are constantly being generated and modified based on user preferences and critiques from editors. Here, you will find the most attractive templates for a range of purposes while taking into account ratings and remarks from users regarding the content. This is an excellent jumping-off point to explore our content and will give new users an insight into our top-notch PowerPoint Templates.
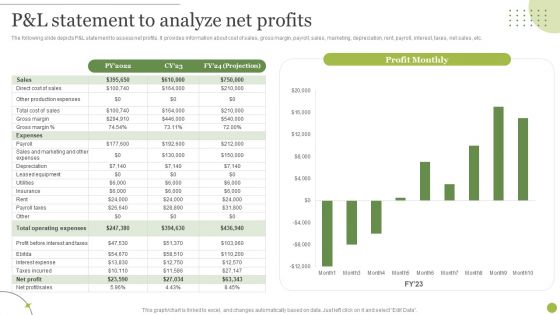
Managing E Commerce Business Accounting P And L Statement To Analyze Net Profits Elements PDF
The following slide depicts P and L statement to assess net profits. It provides information about cost of sales, gross margin, payroll, sales, marketing, depreciation, rent, payroll, interest, taxes, net sales, etc. Explore a selection of the finest Managing E Commerce Business Accounting P And L Statement To Analyze Net Profits Elements PDF here. With a plethora of professionally designed and pre made slide templates, you can quickly and easily find the right one for your upcoming presentation. You can use our Managing E Commerce Business Accounting P And L Statement To Analyze Net Profits Elements PDF to effectively convey your message to a wider audience. Slidegeeks has done a lot of research before preparing these presentation templates. The content can be personalized and the slides are highly editable. Grab templates today from Slidegeeks.
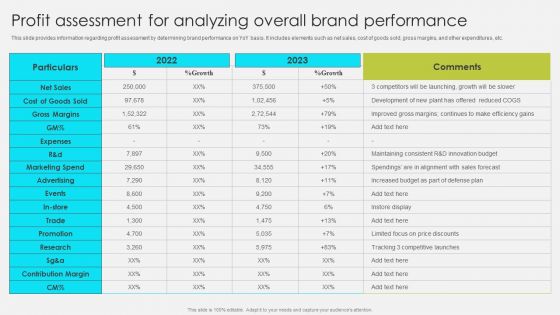
Comprehensive Promotion Guidelines To Administer Brand Profit Assessment For Analyzing Overall Brand Ideas PDF
This slide provides information regarding profit assessment by determining brand performance on YoY basis. It includes elements such as net sales, cost of goods sold, gross margins, and other expenditures, etc. Here you can discover an assortment of the finest PowerPoint and Google Slides templates. With these templates, you can create presentations for a variety of purposes while simultaneously providing your audience with an eye-catching visual experience. Download Comprehensive Promotion Guidelines To Administer Brand Profit Assessment For Analyzing Overall Brand Ideas PDF to deliver an impeccable presentation. These templates will make your job of preparing presentations much quicker, yet still, maintain a high level of quality. Slidegeeks has experienced researchers who prepare these templates and write high-quality content for you. Later on, you can personalize the content by editing the Comprehensive Promotion Guidelines To Administer Brand Profit Assessment For Analyzing Overall Brand Ideas PDF.
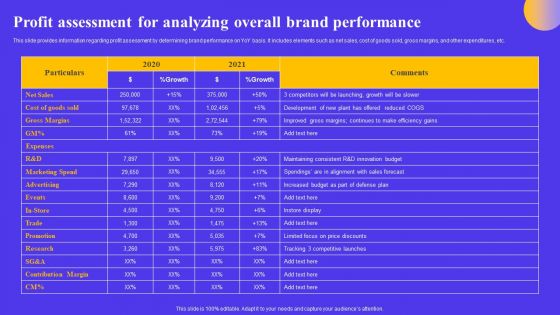
Strategic Toolkit For Brand Performance Enhancement Profit Assessment For Analyzing Overall Brand Formats PDF
This slide provides information regarding profit assessment by determining brand performance on YoY basis. It includes elements such as net sales, cost of goods sold, gross margins, and other expenditures, etc. Find highly impressive Strategic Toolkit For Brand Performance Enhancement Profit Assessment For Analyzing Overall Brand Formats PDF on Slidegeeks to deliver a meaningful presentation. You can save an ample amount of time using these presentation templates. No need to worry to prepare everything from scratch because Slidegeeks experts have already done a huge research and work for you. You need to download Strategic Toolkit For Brand Performance Enhancement Profit Assessment For Analyzing Overall Brand Formats PDF for your upcoming presentation. All the presentation templates are 100 percent editable and you can change the color and personalize the content accordingly. Download now.
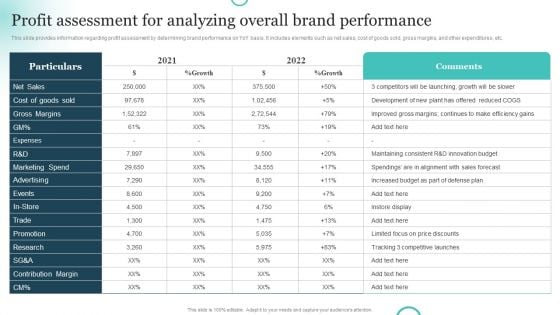
Brand Plan Toolkit For Marketers Profit Assessment For Analyzing Overall Brand Performance Topics PDF
This slide provides information regarding profit assessment by determining brand performance on YoY basis. It includes elements such as net sales, cost of goods sold, gross margins, and other expenditures, etc. Present like a pro with Brand Plan Toolkit For Marketers Profit Assessment For Analyzing Overall Brand Performance Topics PDF Create beautiful presentations together with your team, using our easy to use presentation slides. Share your ideas in real time and make changes on the fly by downloading our templates. So whether you are in the office, on the go, or in a remote location, you can stay in sync with your team and present your ideas with confidence. With Slidegeeks presentation got a whole lot easier. Grab these presentations today.
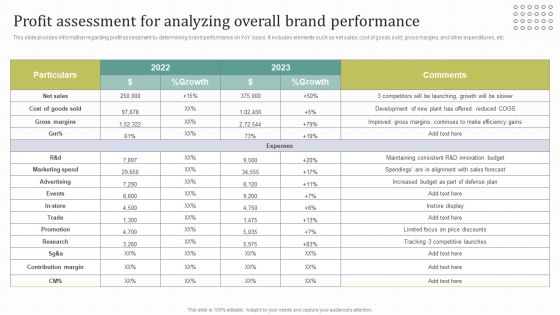
Instructions For Brand Performance Management Team Profit Assessment For Analyzing Overall Brand Structure PDF
This slide provides information regarding profit assessment by determining brand performance on YoY basis. It includes elements such as net sales, cost of goods sold, gross margins, and other expenditures, etc. The Instructions For Brand Performance Management Team Profit Assessment For Analyzing Overall Brand Structure PDF is a compilation of the most recent design trends as a series of slides. It is suitable for any subject or industry presentation, containing attractive visuals and photo spots for businesses to clearly express their messages. This template contains a variety of slides for the user to input data, such as structures to contrast two elements, bullet points, and slides for written information. Slidegeeks is prepared to create an impression.
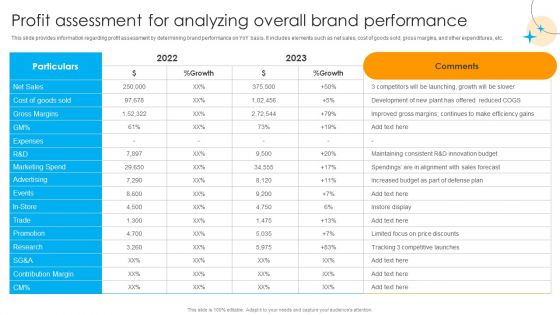
Defensive Brand Marketing Profit Assessment For Analyzing Overall Brand Performance Summary PDF
This slide provides information regarding profit assessment by determining brand performance on YoY basis. It includes elements such as net sales, cost of goods sold, gross margins, and other expenditures, etc. This Defensive Brand Marketing Profit Assessment For Analyzing Overall Brand Performance Summary PDF from Slidegeeks makes it easy to present information on your topic with precision. It provides customization options, so you can make changes to the colors, design, graphics, or any other component to create a unique layout. It is also available for immediate download, so you can begin using it right away. Slidegeeks has done good research to ensure that you have everything you need to make your presentation stand out. Make a name out there for a brilliant performance.
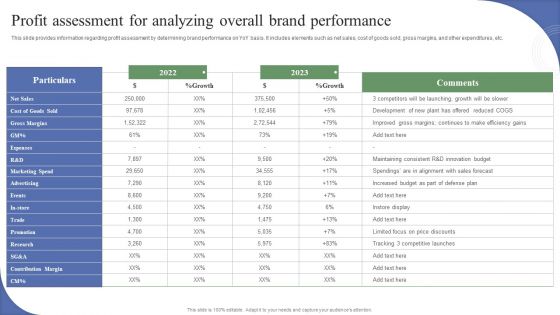
Toolkit To Administer Tactical Profit Assessment For Analyzing Overall Brand Performance Brochure PDF
This slide provides information regarding profit assessment by determining brand performance on YoY basis. It includes elements such as net sales, cost of goods sold, gross margins, and other expenditures, etc. The Toolkit To Administer Tactical Profit Assessment For Analyzing Overall Brand Performance Brochure PDF is a compilation of the most recent design trends as a series of slides. It is suitable for any subject or industry presentation, containing attractive visuals and photo spots for businesses to clearly express their messages. This template contains a variety of slides for the user to input data, such as structures to contrast two elements, bullet points, and slides for written information. Slidegeeks is prepared to create an impression.
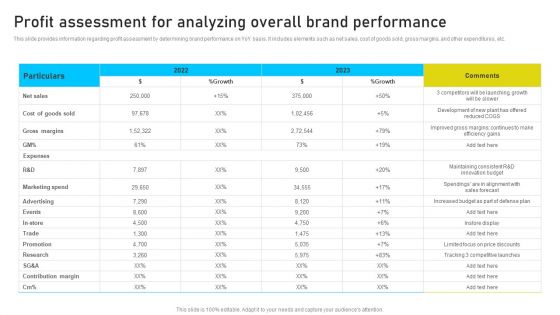
Brand Identity Management Toolkit Profit Assessment For Analyzing Overall Brand Template PDF
This slide provides information regarding profit assessment by determining brand performance on YoY basis. It includes elements such as net sales, cost of goods sold, gross margins, and other expenditures, etc. Slidegeeks is one of the best resources for PowerPoint templates. You can download easily and regulate Brand Identity Management Toolkit Profit Assessment For Analyzing Overall Brand Template PDF for your personal presentations from our wonderful collection. A few clicks is all it takes to discover and get the most relevant and appropriate templates. Use our Templates to add a unique zing and appeal to your presentation and meetings. All the slides are easy to edit and you can use them even for advertisement purposes.
How Electronic Commerce Financial Procedure Can Be Enhanced P And L Statement To Analyze Net Profits Icons PDF
The following slide depicts P and L statement to assess net profits. It provides information about cost of sales, gross margin, payroll, sales, marketing, depreciation, rent, payroll, interest, taxes, net sales, etc.Formulating a presentation can take up a lot of effort and time, so the content and message should always be the primary focus. The visuals of the PowerPoint can enhance the presenters message, so our How Electronic Commerce Financial Procedure Can Be Enhanced P And L Statement To Analyze Net Profits Icons PDF was created to help save time. Instead of worrying about the design, the presenter can concentrate on the message while our designers work on creating the ideal templates for whatever situation is needed. Slidegeeks has experts for everything from amazing designs to valuable content, we have put everything into How Electronic Commerce Financial Procedure Can Be Enhanced P And L Statement To Analyze Net Profits Icons PDF.
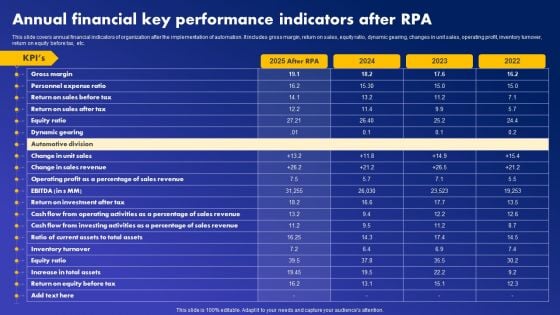
Annual Financial Key Performance Indicators After RPA Guidelines PDF
This slide covers annual financial indicators of organization after the implementation of automation. It includes gross margin, return on sales, equity ratio, dynamic gearing, changes in unit sales, operating profit, inventory turnover, return on equity before tax, etc. Create an editable Annual Financial Key Performance Indicators After RPA Guidelines PDF that communicates your idea and engages your audience. Whether you are presenting a business or an educational presentation, pre-designed presentation templates help save time. Annual Financial Key Performance Indicators After RPA Guidelines PDF is highly customizable and very easy to edit, covering many different styles from creative to business presentations. Slidegeeks has creative team members who have crafted amazing templates. So, go and get them without any delay.
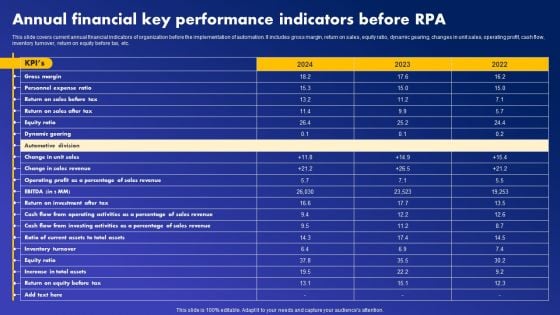
Annual Financial Key Performance Indicators Before RPA Download PDF
This slide covers current annual financial indicators of organization before the implementation of automation. It includes gross margin, return on sales, equity ratio, dynamic gearing, changes in unit sales, operating profit, cash flow, inventory turnover, return on equity before tax, etc. Slidegeeks is one of the best resources for PowerPoint templates. You can download easily and regulate Annual Financial Key Performance Indicators Before RPA Download PDF for your personal presentations from our wonderful collection. A few clicks is all it takes to discover and get the most relevant and appropriate templates. Use our Templates to add a unique zing and appeal to your presentation and meetings. All the slides are easy to edit and you can use them even for advertisement purposes.
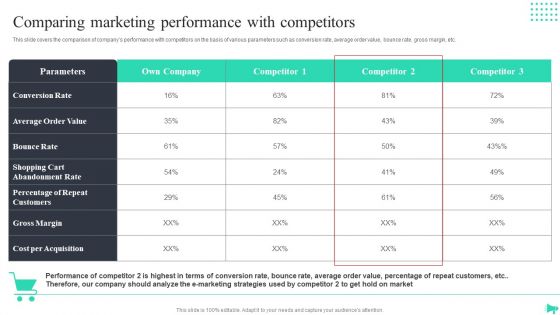
Comparing Marketing Performance With Competitors Professional PDF
This slide covers the comparison of companys performance with competitors on the basis of various parameters such as conversion rate, average order value, bounce rate, gross margin, etc. If you are looking for a format to display your unique thoughts, then the professionally designed Comparing Marketing Performance With Competitors Professional PDF is the one for you. You can use it as a Google Slides template or a PowerPoint template. Incorporate impressive visuals, symbols, images, and other charts. Modify or reorganize the text boxes as you desire. Experiment with shade schemes and font pairings. Alter, share or cooperate with other people on your work. Download Comparing Marketing Performance With Competitors Professional PDF and find out how to give a successful presentation. Present a perfect display to your team and make your presentation unforgettable.
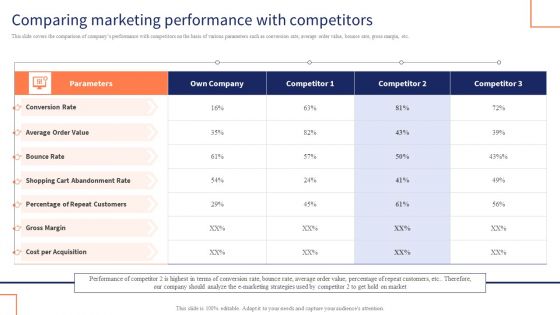
Comparing Marketing Performance With Competitors Brochure PDF
This slide covers the comparison of companys performance with competitors on the basis of various parameters such as conversion rate, average order value, bounce rate, gross margin, etc. If you are looking for a format to display your unique thoughts, then the professionally designed Comparing Marketing Performance With Competitors Brochure PDF is the one for you. You can use it as a Google Slides template or a PowerPoint template. Incorporate impressive visuals, symbols, images, and other charts. Modify or reorganize the text boxes as you desire. Experiment with shade schemes and font pairings. Alter, share or cooperate with other people on your work. Download Comparing Marketing Performance With Competitors Brochure PDF and find out how to give a successful presentation. Present a perfect display to your team and make your presentation unforgettable.
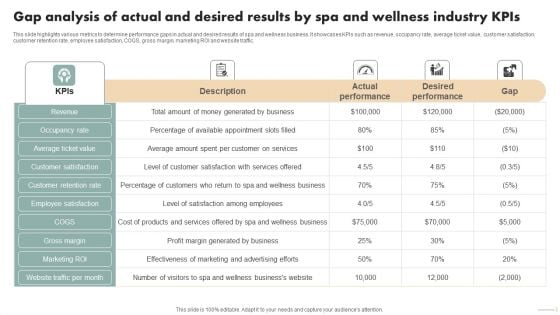
Spa Marketing Strategy Boost Reservations Enhance Revenue Gap Analysis Of Actual Desired Results Inspiration PDF
This slide highlights various metrics to determine performance gaps in actual and desired results of spa and wellness business. It showcases KPIs such as revenue, occupancy rate, average ticket value, customer satisfaction, customer retention rate, employee satisfaction, COGS, gross margin, marketing ROI and website traffic. Present like a pro with Spa Marketing Strategy Boost Reservations Enhance Revenue Gap Analysis Of Actual Desired Results Inspiration PDF Create beautiful presentations together with your team, using our easy to use presentation slides. Share your ideas in real time and make changes on the fly by downloading our templates. So whether you are in the office, on the go, or in a remote location, you can stay in sync with your team and present your ideas with confidence. With Slidegeeks presentation got a whole lot easier. Grab these presentations today.
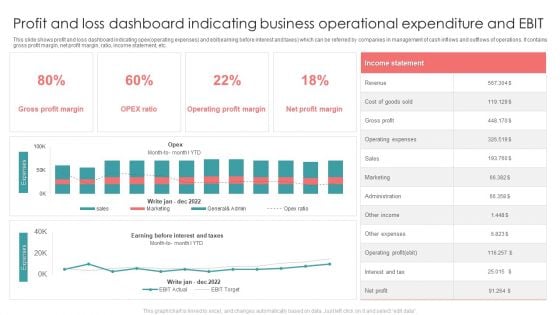
Profit And Loss Dashboard Indicating Business Operational Expenditure And EBIT Formats PDF
This slide shows profit and loss dashboard indicating opex operating expenses and ebit earning before interest and taxes which can be referred by companies in management of cash inflows and outflows of operations. It contains gross profit margin, net profit margin, ratio, income statement, etc. Showcasing this set of slides titled Profit And Loss Dashboard Indicating Business Operational Expenditure And EBIT Formats PDF. The topics addressed in these templates are Revenue, Gross Profit, Sales. All the content presented in this PPT design is completely editable. Download it and make adjustments in color, background, font etc. as per your unique business setting.
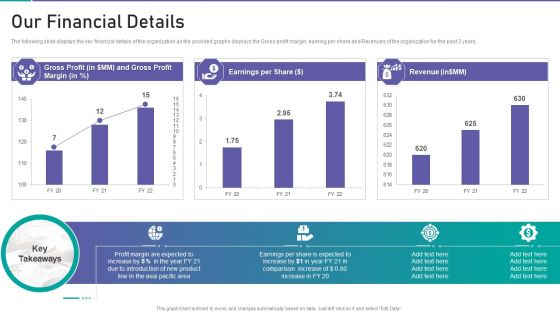
Corporate Organization Playbook Our Financial Details Ppt Model Sample PDF
The following slide displays the key financial details of the organization as the provided graphs displays the Gross profit margin, earning per share and Revenues of the organization for the past 3 years. Deliver and pitch your topic in the best possible manner with this corporate organization playbook our financial details ppt model sample pdf. Use them to share invaluable insights on gross profit, earnings per share, revenue and impress your audience. This template can be altered and modified as per your expectations. So, grab it now.
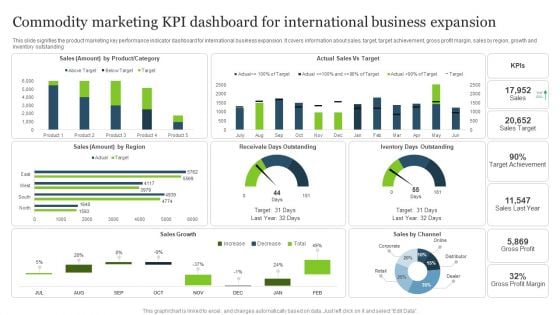
Commodity Marketing KPI Dashboard For International Business Expansion Formats PDF
This slide signifies the product marketing key performance indicator dashboard for international business expansion. It covers information about sales, target, target achievement, gross profit margin, sales by region, growth and inventory outstanding.Pitch your topic with ease and precision using this Commodity Marketing KPI Dashboard For International Business Expansion Formats PDF. This layout presents information on Target Achievement, Receivale Days, Gross Profit. It is also available for immediate download and adjustment. So, changes can be made in the color, design, graphics or any other component to create a unique layout.
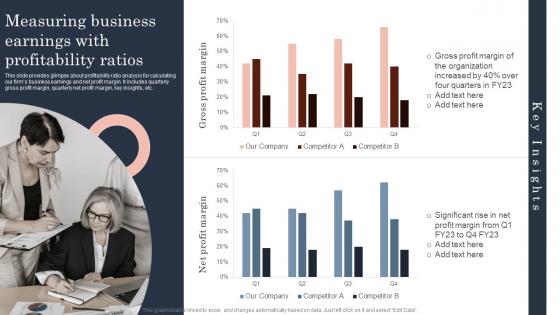
Measuring Business Earnings With Guide To Corporate Financial Growth Plan Background Pdf
This slide provides glimpse about profitability ratio analysis for calculating our firms business earnings and net profit margin. It includes quarterly gross profit margin, quarterly net profit margin, key insights, etc.Here you can discover an assortment of the finest PowerPoint and Google Slides templates. With these templates, you can create presentations for a variety of purposes while simultaneously providing your audience with an eye-catching visual experience. Download Measuring Business Earnings With Guide To Corporate Financial Growth Plan Background Pdf to deliver an impeccable presentation. These templates will make your job of preparing presentations much quicker, yet still, maintain a high level of quality. Slidegeeks has experienced researchers who prepare these templates and write high-quality content for you. Later on, you can personalize the content by editing the Measuring Business Earnings With Guide To Corporate Financial Growth Plan Background Pdf. This slide provides glimpse about profitability ratio analysis for calculating our firms business earnings and net profit margin. It includes quarterly gross profit margin, quarterly net profit margin, key insights, etc.
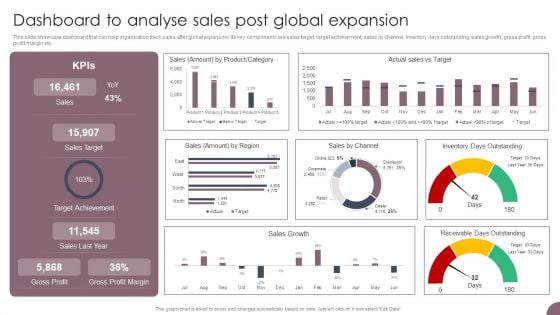
International Business Extension Dashboard To Analyse Sales Post Global Expansion Guidelines PDF
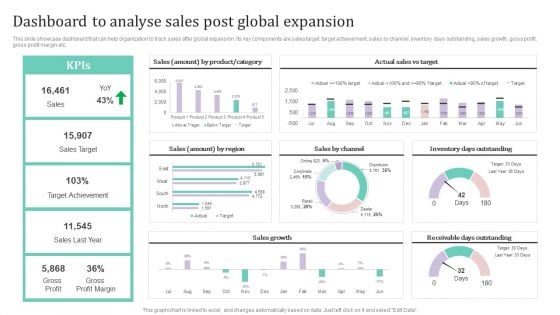
This slide showcase dashboard that can help organization track sales after global expansion. Its key components are sales target, target achievement, sales by channel, inventory days outstanding, sales growth, gross profit, gross profit margin etc. Are you in need of a template that can accommodate all of your creative concepts This one is crafted professionally and can be altered to fit any style. Use it with Google Slides or PowerPoint. Include striking photographs, symbols, depictions, and other visuals. Fill, move around, or remove text boxes as desired. Test out color palettes and font mixtures. Edit and save your work, or work with colleagues. Download International Business Extension Dashboard To Analyse Sales Post Global Expansion Guidelines PDF and observe how to make your presentation outstanding. Give an impeccable presentation to your group and make your presentation unforgettable.
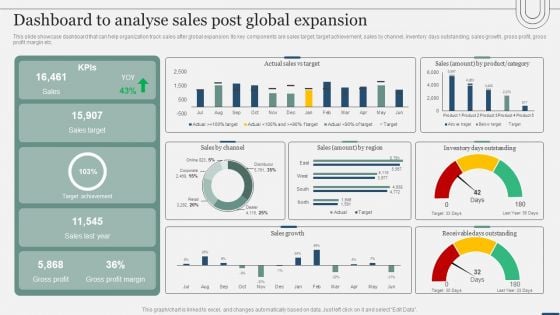
Assessing International Market Dashboard To Analyse Sales Post Global Expansion Elements PDF
This slide showcase dashboard that can help organization track sales after global expansion. Its key components are sales target, target achievement, sales by channel, inventory days outstanding, sales growth, gross profit, gross profit margin etc. Are you in need of a template that can accommodate all of your creative concepts This one is crafted professionally and can be altered to fit any style. Use it with Google Slides or PowerPoint. Include striking photographs, symbols, depictions, and other visuals. Fill, move around, or remove text boxes as desired. Test out color palettes and font mixtures. Edit and save your work, or work with colleagues. Download Assessing International Market Dashboard To Analyse Sales Post Global Expansion Elements PDF and observe how to make your presentation outstanding. Give an impeccable presentation to your group and make your presentation unforgettable.
Dashboard To Analyse Sales Post Global Expansion Ppt PowerPoint Presentation File Styles PDF
This slide showcase dashboard that can help organization to track sales after global expansion. Its key components are sales target, target achievement, sales by channel, inventory days outstanding, sales growth, gross profit, gross profit margin etc.This Dashboard To Analyse Sales Post Global Expansion Ppt PowerPoint Presentation File Styles PDF from Slidegeeks makes it easy to present information on your topic with precision. It provides customization options, so you can make changes to the colors, design, graphics, or any other component to create a unique layout. It is also available for immediate download, so you can begin using it right away. Slidegeeks has done good research to ensure that you have everything you need to make your presentation stand out. Make a name out there for a brilliant performance.
Strategic Global Expansion Business Plan Dashboard To Analyse Sales Post Global Expansion Diagrams PDF
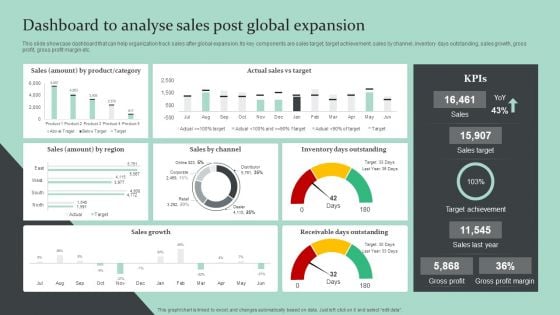
This slide showcase dashboard that can help organization track sales after global expansion. Its key components are sales target, target achievement, sales by channel, inventory days outstanding, sales growth, gross profit, gross profit margin etc. Presenting this PowerPoint presentation, titled Strategic Global Expansion Business Plan Dashboard To Analyse Sales Post Global Expansion Diagrams PDF, with topics curated by our researchers after extensive research. This editable presentation is available for immediate download and provides attractive features when used. Download now and captivate your audience. Presenting this Strategic Global Expansion Business Plan Dashboard To Analyse Sales Post Global Expansion Diagrams PDF. Our researchers have carefully researched and created these slides with all aspects taken into consideration. This is a completely customizable Strategic Global Expansion Business Plan Dashboard To Analyse Sales Post Global Expansion Diagrams PDF that is available for immediate downloading. Download now and make an impact on your audience. Highlight the attractive features available with our PPTs.
Revenue Cycle Management Deal Key Financials Of The Company Profit Rules PDF
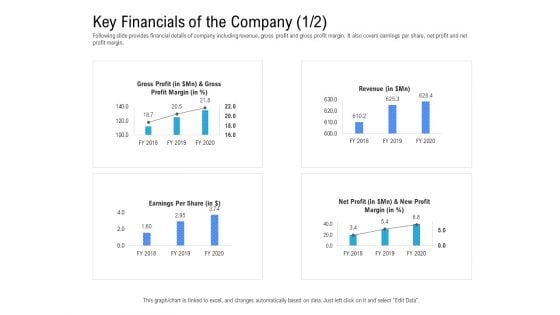
Deliver and pitch your topic in the best possible manner with this revenue cycle management deal key financials of the company profit rules pdf. Use them to share invaluable insights on gross profit, revenue, profit margin, earnings per share, financials and impress your audience. This template can be altered and modified as per your expectations. So, grab it now.

Ways To Bounce Back From Insolvency Financial Highlights For Last Three Years Microsoft PDF
Presenting this set of slides with name ways to bounce back from insolvency financial highlights for last three years microsoft pdf. The topics discussed in these slides are revenue, gross profit, net profit margin, earnings per. This is a completely editable PowerPoint presentation and is available for immediate download. Download now and impress your audience.
Ways To Bounce Back From Insolvency Future Forecast After Implementing Strategies Pictures PDF
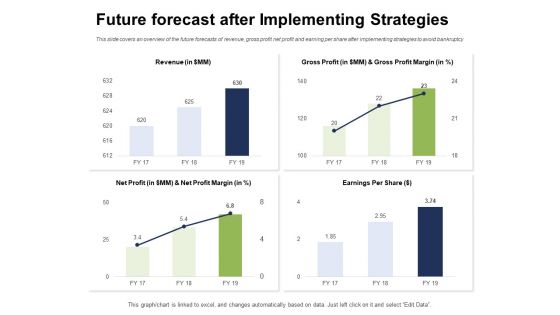
Presenting this set of slides with name ways to bounce back from insolvency future forecast after implementing strategies pictures pdf. The topics discussed in these slides are revenue, gross profit, net profit margin, earnings per. This is a completely editable PowerPoint presentation and is available for immediate download. Download now and impress your audience.
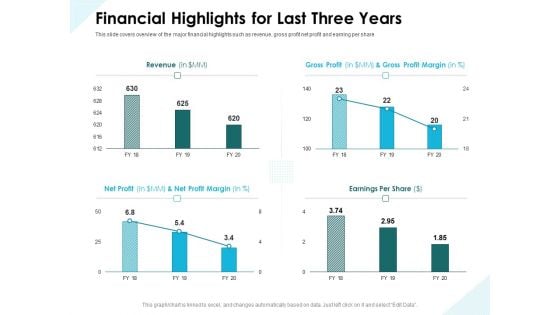
Issues Which Leads To Insolvency Financial Highlights For Last Three Years Guidelines PDF
Presenting this set of slides with name issues which leads to insolvency financial highlights for last three years guidelines pdf. The topics discussed in these slides are revenue, gross profit, net profit margin, earnings per. This is a completely editable PowerPoint presentation and is available for immediate download. Download now and impress your audience.

Issues Which Leads To Insolvency Future Forecast After Implementing Strategies Ideas PDF
Presenting this set of slides with nameissues which leads to insolvency future forecast after implementing strategies ideas pdf. The topics discussed in these slides are revenue, gross profit, net profit margin, earnings per. This is a completely editable PowerPoint presentation and is available for immediate download. Download now and impress your audience.
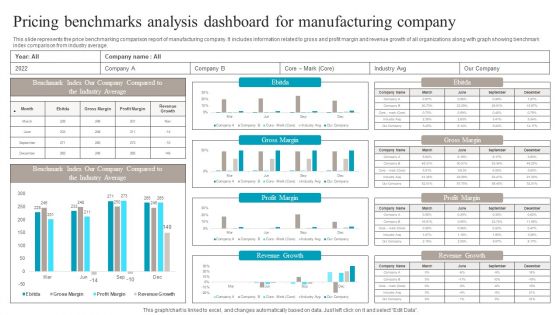
Pricing Benchmarks Analysis Dashboard For Manufacturing Company Structure PDF
This slide represents the price benchmarking comparison report of manufacturing company. It includes information related to gross and profit margin and revenue growth of all organizations along with graph showing benchmark index comparison from industry average. Pitch your topic with ease and precision using this Pricing Benchmarks Analysis Dashboard For Manufacturing Company Structure PDF. This layout presents information on Pricing Benchmarks Analysis, Dashboard For Manufacturing Company. It is also available for immediate download and adjustment. So, changes can be made in the color, design, graphics or any other component to create a unique layout.
Monthly Financial Performance Outcome Reporting Icons PDF
This slide showcases a report showing monthly results financial performance to ensure constant revenue growth. It includes key components such as gross profit margin, operating expenses ratio, operating profit margin, net profit margin, earning before interest and taxes, etc. Showcasing this set of slides titled Monthly Financial Performance Outcome Reporting Icons PDF. The topics addressed in these templates are Operating Expenses, Income Statement, Operating Expenses Ratio. All the content presented in this PPT design is completely editable. Download it and make adjustments in color, background, font etc. as per your unique business setting.
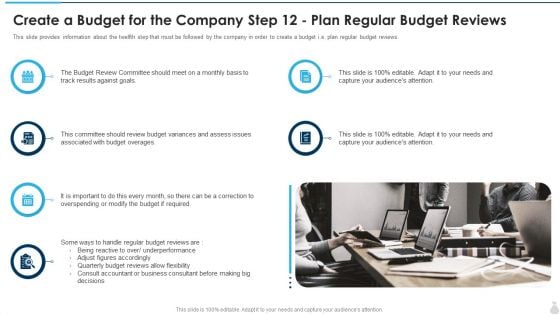
Create A Budget For The Company Step 12 Plan Regular Budget Reviews Summary PDF
This slide provides information about the third step that must be followed by the company in order to create a budget i.e. figuring out gross profit margins. Presenting create a budget for the company step 12 plan regular budget reviews summary pdf to provide visual cues and insights. Share and navigate important information on six stages that need your due attention. This template can be used to pitch topics like organizations, profit margins, financial, sales revenue. In addtion, this PPT design contains high resolution images, graphics, etc, that are easily editable and available for immediate download.
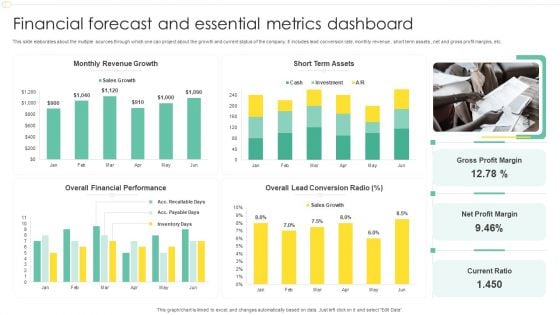
Financial Forecast And Essential Metrics Dashboard Ppt File Show PDF
This slide elaborates about the multiple sources through which one can project about the growth and current status of the company. It includes lead conversion rate, monthly revenue , short term assets , net and gross profit margins, etc. Pitch your topic with ease and precision using this Financial Forecast And Essential Metrics Dashboard Ppt File Show PDF. This layout presents information on Monthly Revenue Growth, Short Term Assets, Overall Financial Performance, Net Profit Margin. It is also available for immediate download and adjustment. So, changes can be made in the color, design, graphics or any other component to create a unique layout.
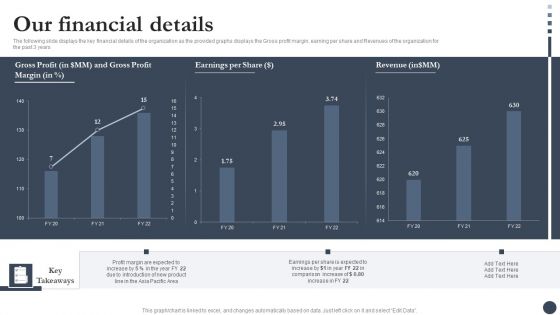
Strategic Playbook For Enterprise Administration Our Financial Details Formats PDF
The following slide displays the key financial details of the organization as the provided graphs displays the Gross profit margin, earning per share and Revenues of the organization for the past 3 years. Deliver and pitch your topic in the best possible manner with this Strategic Playbook For Enterprise Administration Our Financial Details Formats PDF. Use them to share invaluable insights on Profit Margin, Product, Revenue and impress your audience. This template can be altered and modified as per your expectations. So, grab it now.
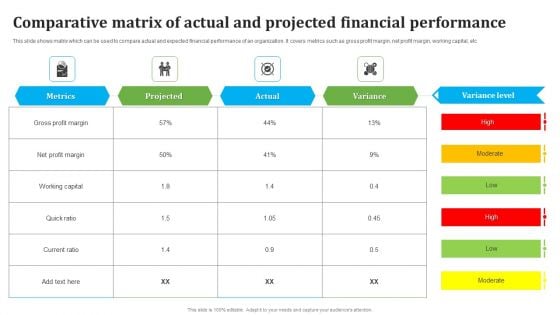
Comparative Matrix Of Actual And Projected Financial Performance Brochure PDF
This slide shows matrix which can be used to compare actual and expected financial performance of an organization. It covers metrics such as gross profit margin, net profit margin, working capital, etc. Pitch your topic with ease and precision using this Comparative Matrix Of Actual And Projected Financial Performance Brochure PDF. This layout presents information on Comparative Matrix Actual, Projected Financial Performance. It is also available for immediate download and adjustment. So, changes can be made in the color, design, graphics or any other component to create a unique layout.
Financial Procedure Dashboard Indicating Yearly Revenue Analysis Icons PDF
This slide illustrates finance process dashboard indicating yearly revenue analysis which contains gross profit margin, operating profit ratio, net profit, revenue and cost of goods sold cogs operating expenses, etc. It can be referred by company owners who can compare it with previous years performance and make related decisions for future. Showcasing this set of slides titled Financial Procedure Dashboard Indicating Yearly Revenue Analysis Icons PDF. The topics addressed in these templates are Operating Profit Percentage, Net Profit Percentage, Operating Profit Ratio. All the content presented in this PPT design is completely editable. Download it and make adjustments in color, background, font etc. as per your unique business setting.
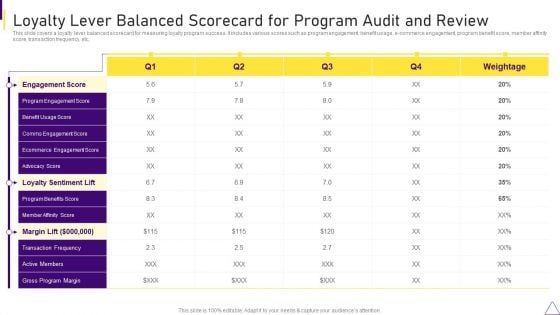
Consumer Journey Mapping Techniques Loyalty Lever Balanced Scorecard For Program Audit And Review Rules PDF
This slide covers a loyalty lever balanced scorecard for measuring loyalty program success. It includes various scores such as program engagement, benefit usage, e commerce engagement, program benefit score, member affinity score, transaction frequency, etc, Showcasing this set of slides titled Consumer Journey Mapping Techniques Loyalty Lever Balanced Scorecard For Program Audit And Review Rules PDF. The topics addressed in these templates are Gross Program Margin, Transaction Frequency, Program Benefits Score. All the content presented in this PPT design is completely editable. Download it and make adjustments in color, background, font etc. as per your unique business setting.
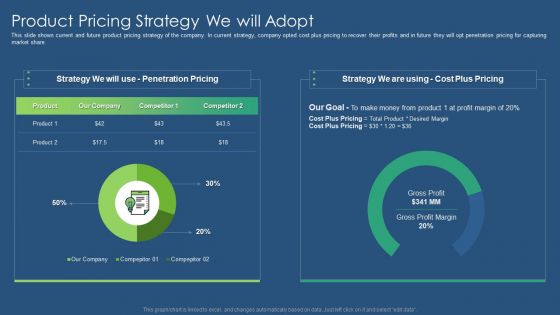
Sustainability Calculation With KPI Product Pricing Strategy We Will Adopt Information PDF Diagrams PDF
This slide shows current and future product pricing strategy of the company. In current strategy, company opted cost plus pricing to recover their profits and in future they will opt penetration pricing for capturing market share. Deliver an awe inspiring pitch with this creative sustainability calculation with kpi product pricing strategy we will adopt information pdf bundle. Topics like gross profit margin, cost plus pricing, penetration pricing can be discussed with this completely editable template. It is available for immediate download depending on the needs and requirements of the user.


 Continue with Email

 Home
Home


