Growth Chart
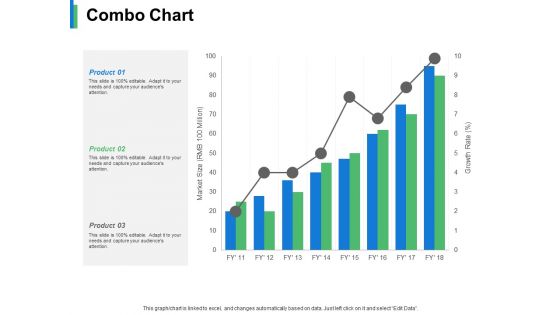
Combo Chart Product Ppt PowerPoint Presentation Slides Aids
This is a combo chart product ppt powerpoint presentation slides aids. This is a three stage process. The stages in this process are business, management, marketing, strategy, sales.

Line Chart Ppt PowerPoint Presentation Styles Graphics Example
This is a line chart ppt powerpoint presentation styles graphics example. This is a two stage process. The stages in this process are graph, business, success, marketing, line.
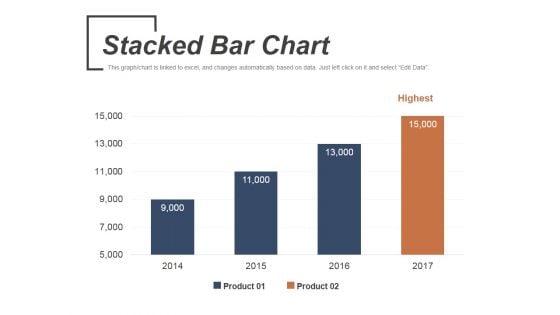
Stacked Bar Chart Ppt PowerPoint Presentation Inspiration Ideas
This is a stacked bar chart ppt powerpoint presentation inspiration ideas. This is a four stage process. The stages in this process are product, highest, business, marketing, bar graph.
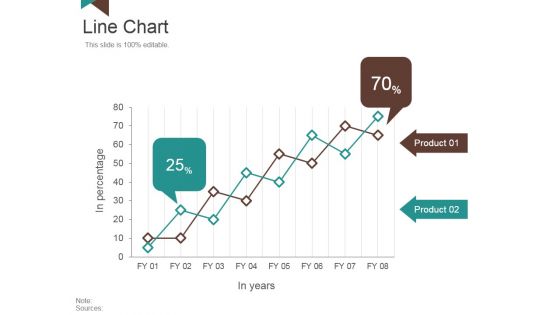
Line Chart Ppt PowerPoint Presentation Layouts Background Image
This is a line chart ppt powerpoint presentation layouts background image. This is a two stage process. The stages in this process are in percentage, in years, product.
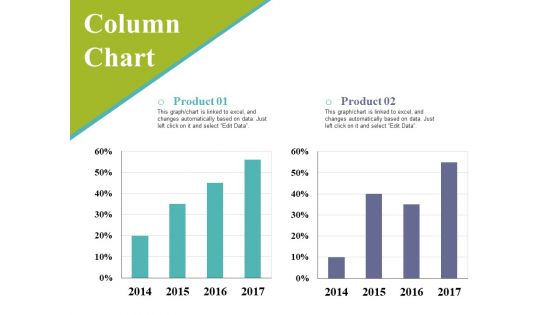
Column Chart Ppt PowerPoint Presentation Styles Background Image
This is a column chart ppt powerpoint presentation styles background image. This is a two stage process. The stages in this process are business, graph, percentage, marketing, strategy.
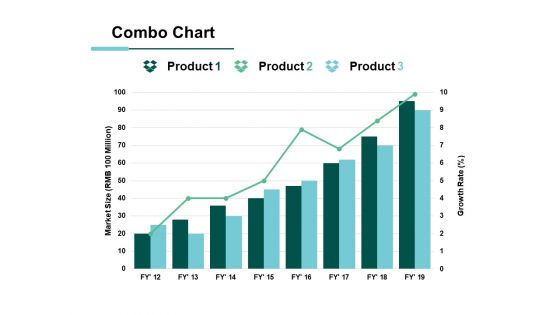
Combo Chart Product Ppt PowerPoint Presentation Ideas Styles
This is a combo chart product ppt powerpoint presentation ideas styles. This is a three stage process. The stages in this process are business, management, marketing, percentage, product.
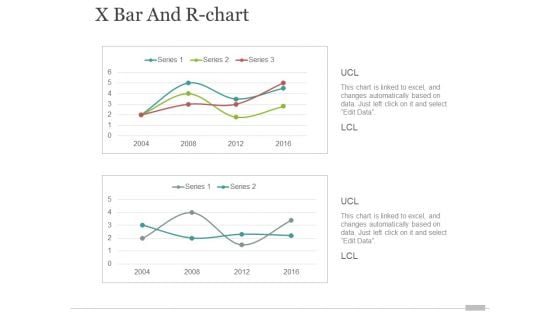
x bar and r chart ppt powerpoint presentation portfolio elements
This is a x bar and r chart ppt powerpoint presentation portfolio elements. This is a two stage process. The stages in this process are finance, business, marketing, growth.
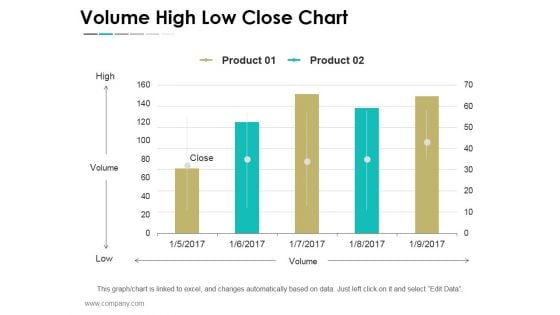
Volume High Low Close Chart Ppt PowerPoint Presentation Show Outfit
This is a volume high low close chart ppt powerpoint presentation show outfit. This is a five stage process. The stages in this process are business, strategy, marketing, success, finance, growth.

Scatter Bubble Chart Ppt PowerPoint Presentation Professional Model
This is a scatter bubble chart ppt powerpoint presentation professional model. This is a six stage process. The stages in this process are sales in profit, financial year, growth, business, marketing, strategy.
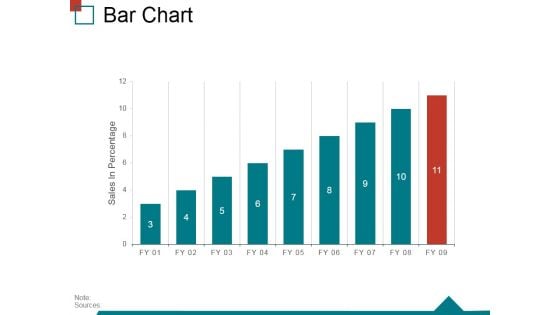
Bar Chart Ppt PowerPoint Presentation Infographic Template Skills
This is a bar chart ppt powerpoint presentation infographic template skills. This is a nine stage process. The stages in this process are sales in percentage, finance, business, marketing, strategy, success.
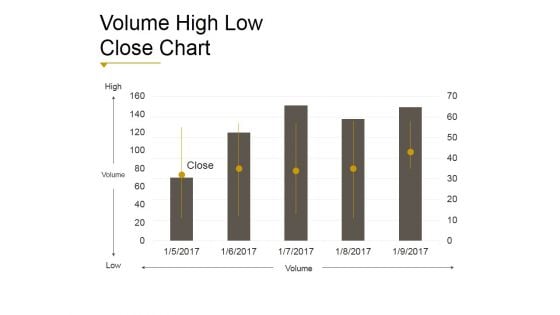
Volume High Low Close Chart Ppt PowerPoint Presentation Shapes
This is a volume high low close chart ppt powerpoint presentation shapes. This is a five stage process. The stages in this process are business, strategy, analysis, marketing, finance, growth.
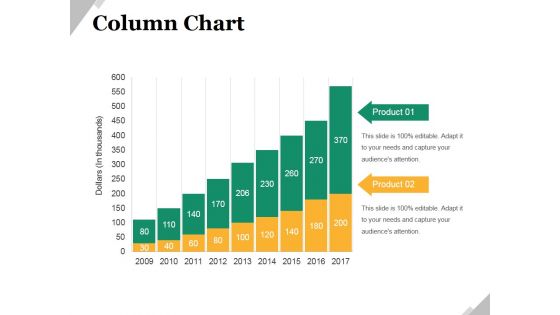
Column Chart Ppt PowerPoint Presentation Infographic Template Graphic Images
This is a column chart ppt powerpoint presentation infographic template graphic images. This is a nine stage process. The stages in this process are business, marketing, growth, product, management.
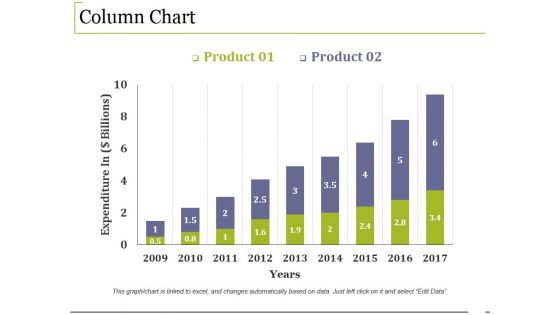
Column Chart Ppt PowerPoint Presentation Infographic Template Example File
This is a column chart ppt powerpoint presentation infographic template example file. This is a two stage process. The stages in this process are growth, finance, business, marketing, analysis.
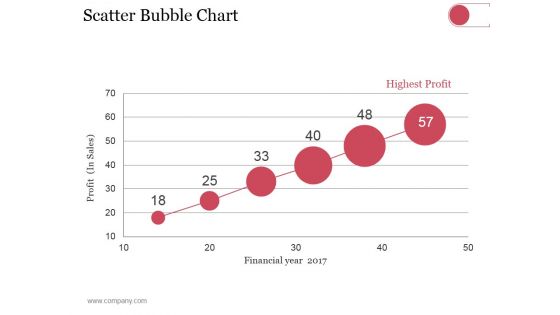
Scatter Bubble Chart Ppt PowerPoint Presentation Summary Pictures
This is a scatter bubble chart ppt powerpoint presentation summary pictures. This is a six stage process. The stages in this process are highest profit, financial year, profit in sales.
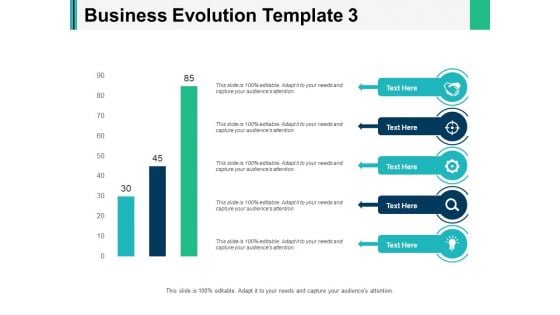
Business Evolution Chart Ppt PowerPoint Presentation Inspiration Graphics Tutorials
This is a business evolution chart ppt powerpoint presentation inspiration graphics tutorials. This is a three stage process. The stages in this process are marketing, business, management, planning, strategy.
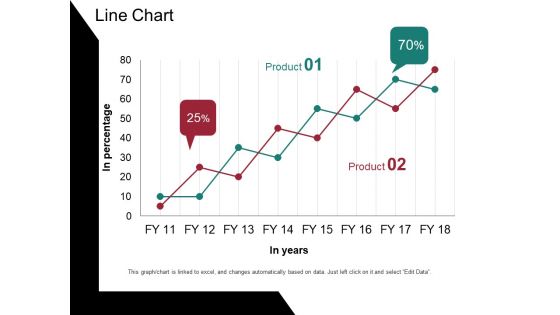
Line Chart Ppt PowerPoint Presentation Portfolio Design Templates
This is a line chart ppt powerpoint presentation portfolio design templates. This is a two stage process. The stages in this process are in percentage, in years, percentage, business, graph.
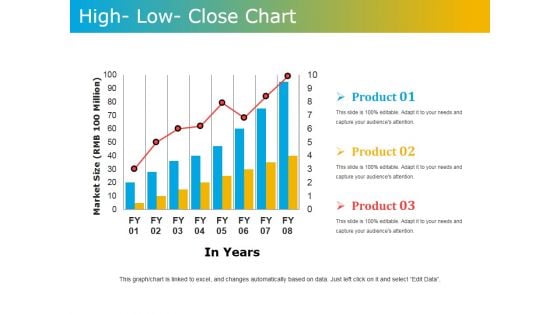
High Low Close Chart Ppt PowerPoint Presentation Model Graphics Tutorials
This is a high low close chart ppt powerpoint presentation model graphics tutorials. This is a three stage process. The stages in this process are market size, in years, product.
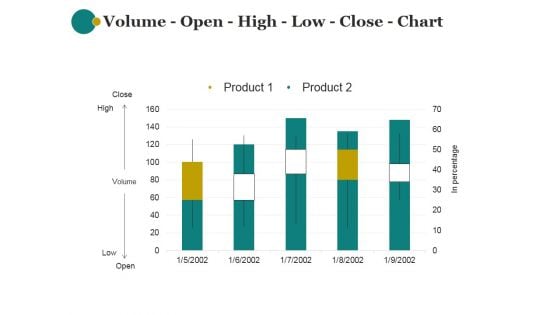
Volume Open High Low Close Chart Ppt PowerPoint Presentation Show
This is a volume open high low close chart ppt powerpoint presentation show. This is a five stage process. The stages in this process are product, marketing, business, management, strategy.
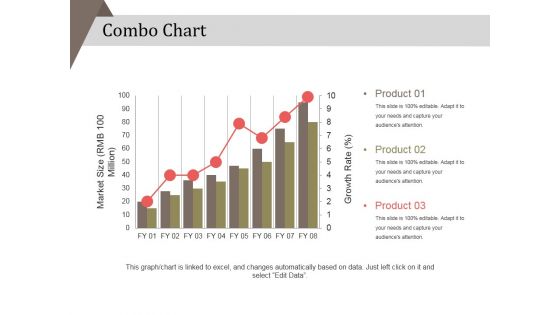
Combo Chart Ppt PowerPoint Presentation Infographic Template Brochure
This is a combo chart ppt powerpoint presentation infographic template brochure. This is a eight stage process. The stages in this process are product, market size, strategy, business, marketing.
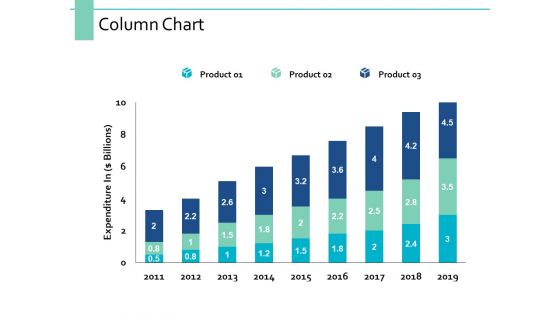
Column Chart Marketing Management Ppt PowerPoint Presentation Professional Images
This is a column chart marketing management ppt powerpoint presentation professional images. This is a three stage process. The stages in this process are finance, marketing, management, investment, analysis.
Financial Planning With Investment Chart Vector Icon Inspiration PDF
Persuade your audience using this financial planning with investment chart vector icon inspiration pdf. This PPT design covers three stages, thus making it a great tool to use. It also caters to a variety of topics including financial planning with investment chart vector icon. Download this PPT design now to present a convincing pitch that not only emphasizes the topic but also showcases your presentation skills.
Financial Chart For Investment Portfolio Management Vector Icon Rules PDF
Persuade your audience using this financial chart for investment portfolio management vector icon rules pdf. This PPT design covers three stages, thus making it a great tool to use. It also caters to a variety of topics including financial chart for investment portfolio management vector icon. Download this PPT design now to present a convincing pitch that not only emphasizes the topic but also showcases your presentation skills.
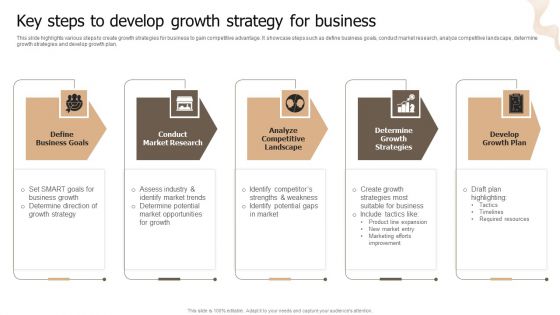
Designing Strategies For Company Growth And Success Key Steps To Develop Growth Strategy For Business Structure PDF
This slide highlights various steps to create growth strategies for business to gain competitive advantage. It showcase steps such as define business goals, conduct market research, analyze competitive landscape, determine growth strategies and develop growth plan. Do you know about Slidesgeeks Designing Strategies For Company Growth And Success Key Steps To Develop Growth Strategy For Business Structure PDF. These are perfect for delivering any kind od presentation. Using it, create PowerPoint presentations that communicate your ideas and engage audiences. Save time and effort by using our pre designed presentation templates that are perfect for a wide range of topic. Our vast selection of designs covers a range of styles, from creative to business, and are all highly customizable and easy to edit. Download as a PowerPoint template or use them as Google Slides themes.
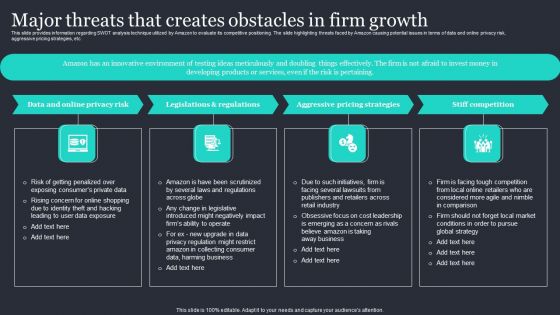
Amazon Strategic Growth Initiative On Global Scale Major Threats That Creates Obstacles In Firm Growth Elements PDF
This slide provides information regarding SWOT analysis technique utilized by Amazon to evaluate its competitive positioning. The slide highlighting threats faced by Amazon causing potential issues in terms of data and online privacy risk, aggressive pricing strategies, etc. Welcome to our selection of the Amazon Strategic Growth Initiative On Global Scale Major Threats That Creates Obstacles In Firm Growth Elements PDF. These are designed to help you showcase your creativity and bring your sphere to life. Planning and Innovation are essential for any business that is just starting out. This collection contains the designs that you need for your everyday presentations. All of our PowerPoints are 100 percent editable, so you can customize them to suit your needs. This multi purpose template can be used in various situations. Grab these presentation templates today.
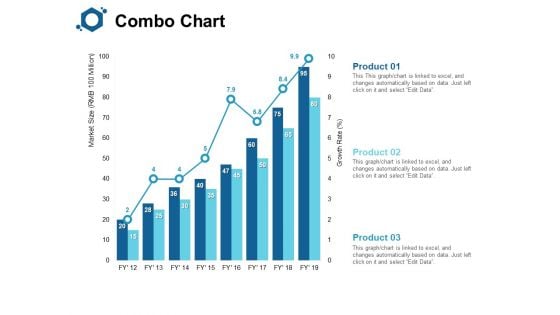
Combo Chart Finance Ppt PowerPoint Presentation Summary Images
Presenting this set of slides with name combo chart finance ppt powerpoint presentation summary images. The topics discussed in these slides are combo chart, product, growth rate, market size, financial year. This is a completely editable PowerPoint presentation and is available for immediate download. Download now and impress your audience.
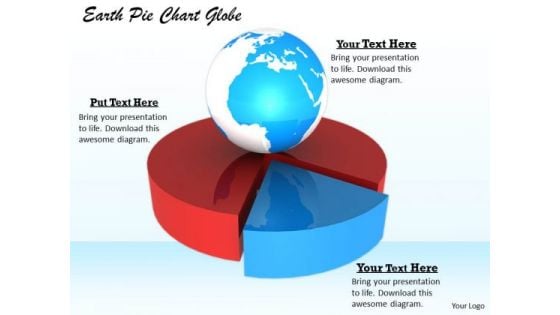
Stock Photo Marketing Concepts Earth Pie Chart Globe
Touch Base With Our stock photo marketing concepts earth pie chart globe Powerpoint Templates. Review Your Growth With Your Audience. Take A Deep Dive With Our Globe Powerpoint Templates. Get Into The Nitti Gritty Of It All.
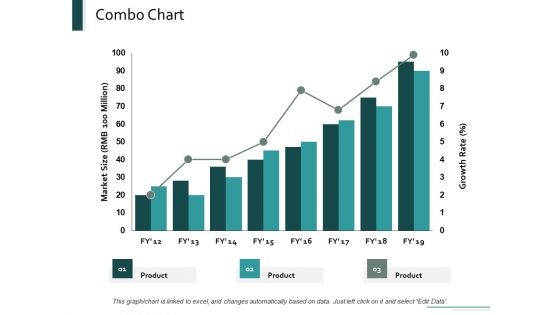
Combo Chart Marketing Ppt Powerpoint Presentation Layouts Designs Download
This is a combo chart marketing ppt powerpoint presentation layouts designs download. This is a three stage process. The stages in this process are combo chart, marketing, growth, product, finance.
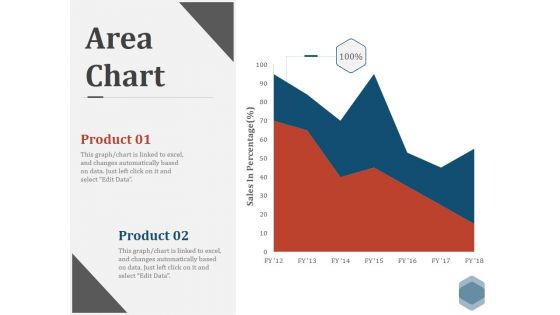
Area Chart Ppt PowerPoint Presentation Pictures Graphics Design
This is a area chart ppt powerpoint presentation pictures graphics design. This is a two stage process. The stages in this process are charts, success, finance, percentage, growth.
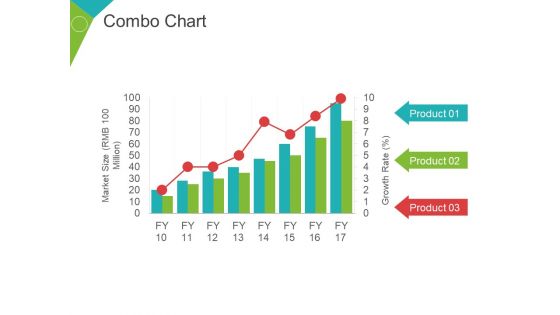
Combo Chart Ppt PowerPoint Presentation Infographic Template Graphic Images
This is a combo chart ppt powerpoint presentation infographic template graphic images. This is a three stage process. The stages in this process are market size, growth rate, percentage, business, marketing.
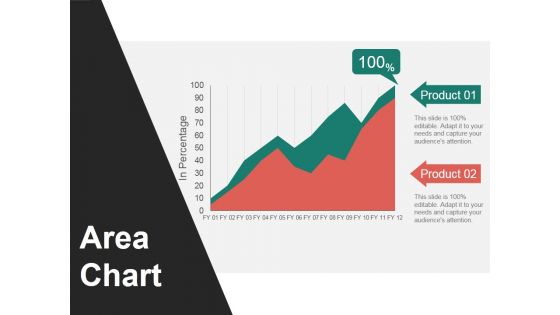
Area Chart Ppt PowerPoint Presentation Slides Graphics Design
This is a area chart ppt powerpoint presentation slides graphics design. This is a two stage process. The stages in this process are area chart, in percentage, product.
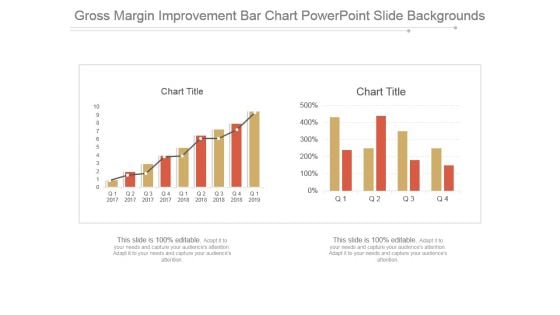
Gross Margin Improvement Bar Chart Powerpoint Slide Backgrounds
This is a gross margin improvement bar chart powerpoint slide backgrounds. This is a two stage process. The stages in this process are chart title.
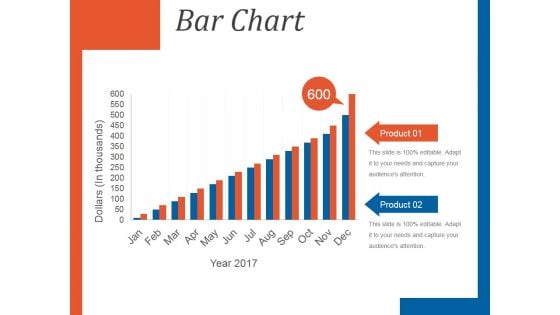
Bar Chart Template 1 Ppt PowerPoint Presentation Background Images
This is a bar chart template 1 ppt powerpoint presentation background images. This is a twelve stage process. The stages in this process are product, bar chart, dollars, year.
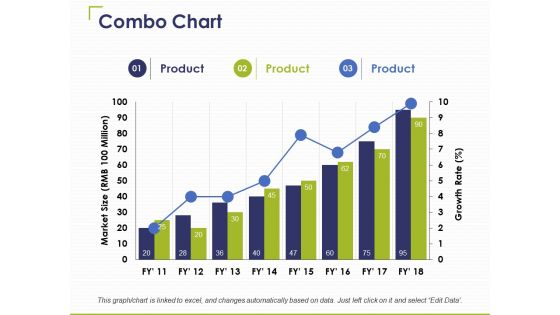
Combo Chart Ppt PowerPoint Presentation Infographics Graphics Pictures
This is a combo chart ppt powerpoint presentation infographics graphics pictures. This is a three stage process. The stages in this process are product, business, marketing, combo chart.
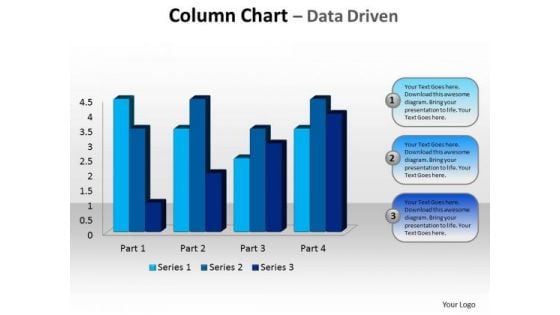
Business Editable PowerPoint Templates Business Beveled Column Chart Ppt Slides
Business Editable PowerPoint Templates Business beveled column chart PPT Slides-This PowerPoint slide is a data driven Columns Chart. The number of columns depend on the data.-Business Editable PowerPoint Templates Business beveled column chart PPT Slides-This ppt can be used for concepts relating to-chart,, graph, growth, investment, , market, percentage, , presentation report, results, statistics, stock, success and business. Experience exponential.growth with our Business Editable PowerPoint Templates Business Beveled Column Chart Ppt Slides. Your earnings will acquire a big boost.
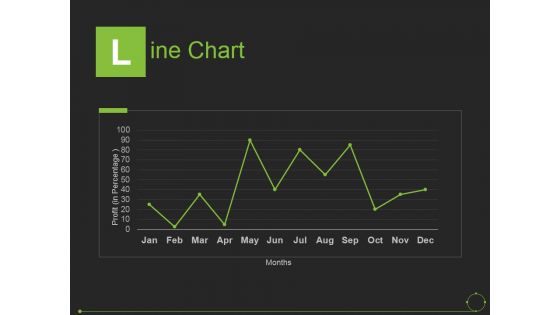
Line Chart Ppt PowerPoint Presentation File Graphics Tutorials
This is a line chart ppt powerpoint presentation file graphics tutorials. This is a one stage process. The stages in this process are months, line chart, bar graph, business, marketing.
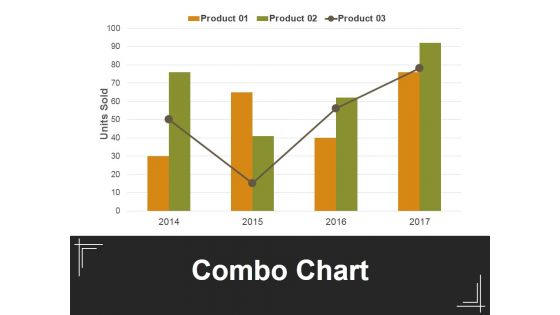
Combo Chart Ppt PowerPoint Presentation Outline Background Image
This is a combo chart ppt powerpoint presentation outline background image. This is a four stage process. The stages in this process are combo chart, units sold, bar graph, business, marketing.
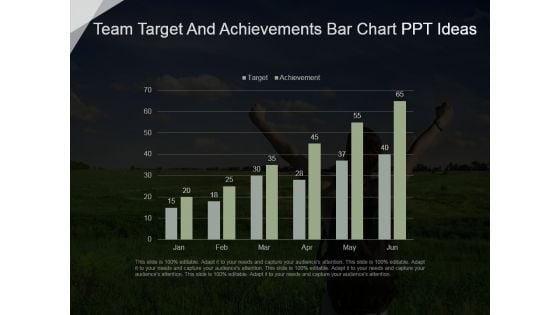
Team Target And Achievements Bar Chart Ppt Ideas
This is a team target and achievements bar chart ppt ideas. This is a six stage process. The stages in this process are business, marketing, graph chart, success, strategy.
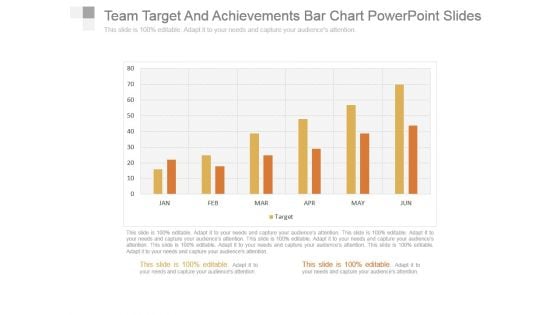
Team Target And Achievements Bar Chart Powerpoint Slides
This is a team target and achievements bar chart powerpoint slides. This is a six stage process. The stages in this process are business, success, graph chart, strategy, marketing.
Area Chart Ppt PowerPoint Presentation Icon Layout Ideas
This is a area chart ppt powerpoint presentation icon layout ideas. This is a two stage process. The stages in this process are area chart, sales in percentage, years, planning, business.
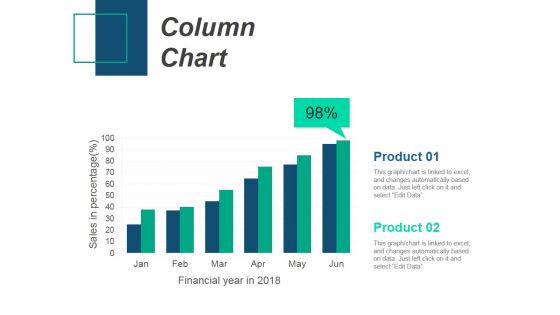
Column Chart Ppt PowerPoint Presentation Gallery Design Inspiration
This is a column chart ppt powerpoint presentation gallery design inspiration. This is a two stage process. The stages in this process are column chart, product, sales in percentage, financial years.
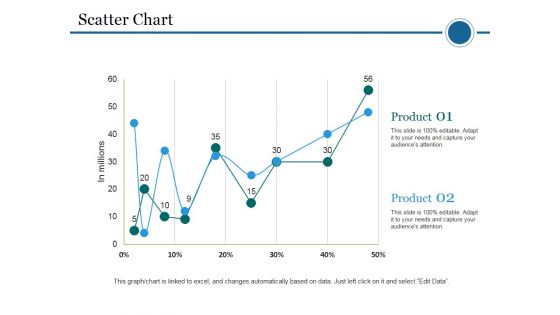
Scatter Chart Template 2 Ppt PowerPoint Presentation Portfolio Skills
This is a scatter chart template 2 ppt powerpoint presentation portfolio skills. This is a two stage process. The stages in this process are scatter chart, in millions, product, business, marketing.
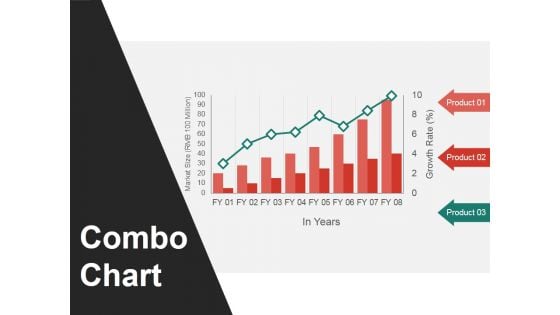
Combo Chart Ppt PowerPoint Presentation Gallery Visual Aids
This is a combo chart ppt powerpoint presentation gallery visual aids. This is a three stage process. The stages in this process are combo chart, in years, market size, product.
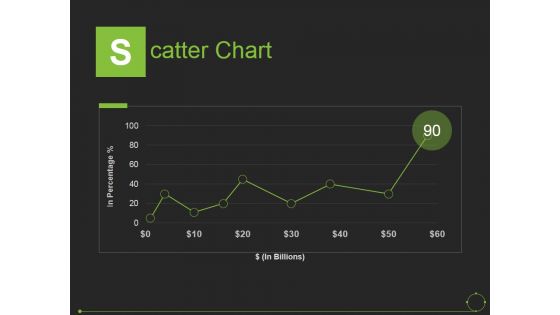
Scatter Chart Ppt PowerPoint Presentation Show Graphic Images
This is a scatter chart ppt powerpoint presentation show graphic images. This is a one stage process. The stages in this process are in percentage, in billions, scatter chart.
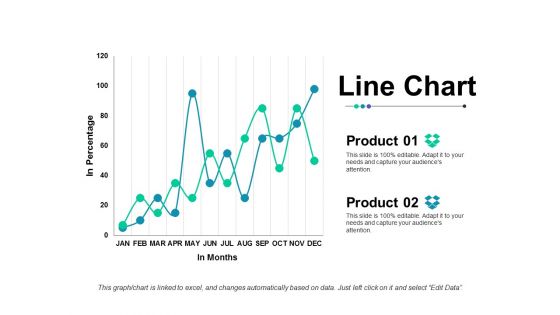
Line Chart Ppt Powerpoint Presentation Outline Slide Portrait
This is a line chart ppt powerpoint presentation outline slide portrait. This is a two stage process. The stages in this process are line chart, finance, strategy, business, analysis.
Bar Chart Ppt PowerPoint Presentation Icon Design Templates
This is a bar chart ppt powerpoint presentation icon design templates. This is a nine stage process. The stages in this process are sales in percentage, bar graph, business, marketing, growth.
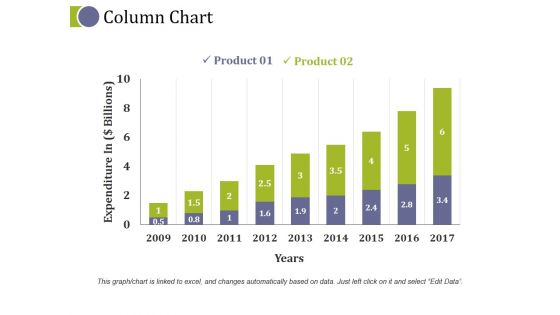
Column Chart Ppt PowerPoint Presentation Ideas Visual Aids
This is a column chart ppt powerpoint presentation ideas visual aids. This is a two stage process. The stages in this process are growth, business, finance, marketing, analysis.

Combo Chart Ppt PowerPoint Presentation Styles Example File
This is a combo chart ppt powerpoint presentation styles example file. This is a three stage process. The stages in this process are finance, growth, business, analysis, marketing.
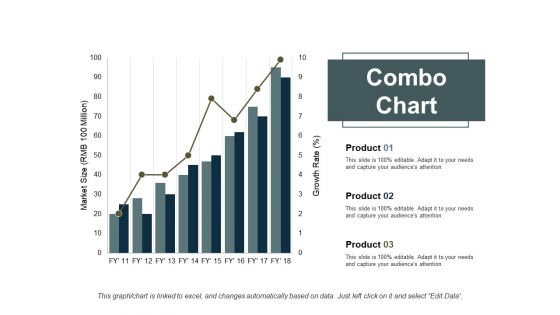
Combo Chart Finance Ppt PowerPoint Presentation Slides Backgrounds
This is a combo chart finance ppt powerpoint presentation slides backgrounds. This is a three stage process. The stages in this process are combo chart, finance, marketing, analysis, business.
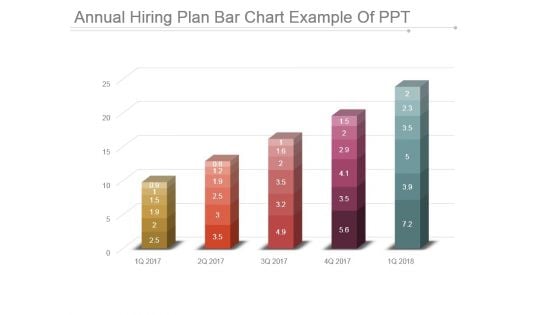
Annual Hiring Plan Bar Chart Example Of Ppt
This is a annual hiring plan bar chart example of ppt. This is a five stage process. The stages in this process are bar graph, business, marketing, growth, success.
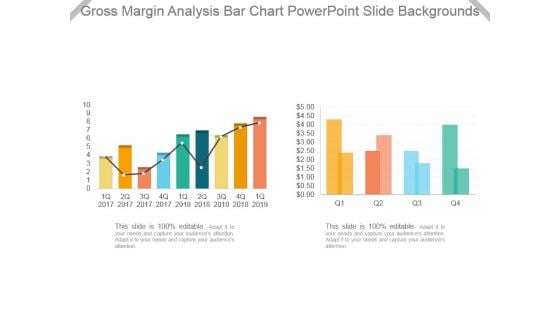
Gross Margin Analysis Bar Chart Powerpoint Slide Backgrounds
This is a gross margin analysis bar chart powerpoint slide backgrounds. This is a two stage process. The stages in this process are bar graph, business, marketing, growth, success.
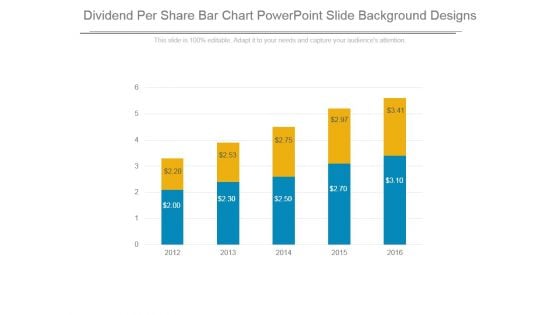
Dividend Per Share Bar Chart Powerpoint Slide Background Designs
This is a dividend per share bar chart powerpoint slide background designs. This is a five stage process. The stages in this process are business, marketing, success, growth, bar graph.
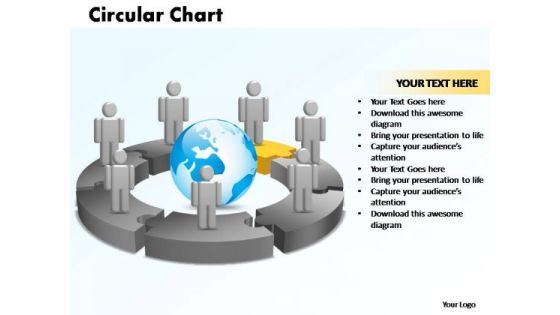
PowerPoint Themes Circular Chart With Globe Ppt Layout
PowerPoint Themes Circular Chart With Globe PPT Layout-The Circle of Life - a concept emmbedded in our minds and hence easy to comprehend. Life and Business is made up of processes comprising stages that flow from one to another. An excellent graphic to attract the attention of and understanding by your audience to improve earnings.-PowerPoint Themes Circular Chart With Globe PPT Layout Double your growth with our PowerPoint Themes Circular Chart With Globe Ppt Layout. Download without worries with our money back guaranteee.

Scatter Chart Ppt PowerPoint Presentation Infographic Template Objects
This is a scatter chart ppt powerpoint presentation infographic template objects. This is a nine stage process. The stages in this process are product, growth, success, graph.
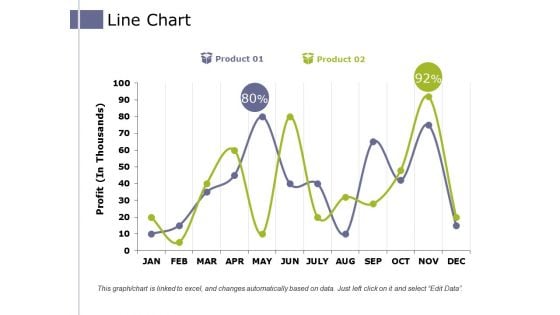
Line Chart Ppt PowerPoint Presentation Pictures Example Introduction
This is a line chart ppt powerpoint presentation pictures example introduction. This is a two stage process. The stages in this process are product, profit, business, growth, success.

Scatter Chart Ppt PowerPoint Presentation Portfolio Design Inspiration
This is a scatter chart ppt powerpoint presentation portfolio design inspiration. This is a twelve stage process. The stages in this process are graph, growth, success, business.
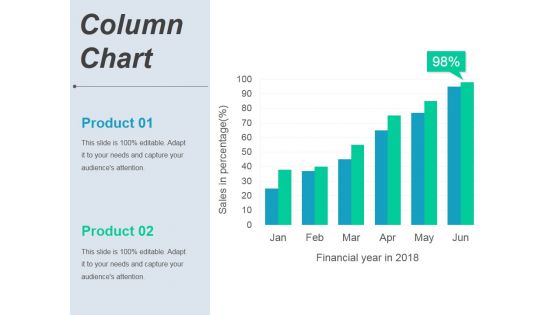
Column Chart Ppt PowerPoint Presentation Portfolio Graphics Template
This is a column chart ppt powerpoint presentation portfolio graphics template. This is a six stage process. The stages in this process are product, finance, growth, success, business.

Combo Chart Ppt PowerPoint Presentation Professional Graphics Example
This is a combo chart ppt powerpoint presentation professional graphics example. This is a eight stage process. The stages in this process are product, finance, growth, success, business.
Bar Chart Ppt PowerPoint Presentation Icon Infographic Template
This is a bar chart ppt powerpoint presentation icon infographic template. This is a nine stage process. The stages in this process are product, marketing, management, business, success.
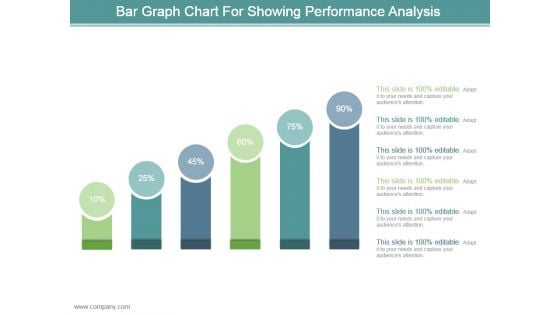
Bar Graph Chart For Showing Performance Analysis Ppt Design
This is a bar graph chart for showing performance analysis ppt design. This is a six stage process. The stages in this process are business, marketing, process, success, presentation.
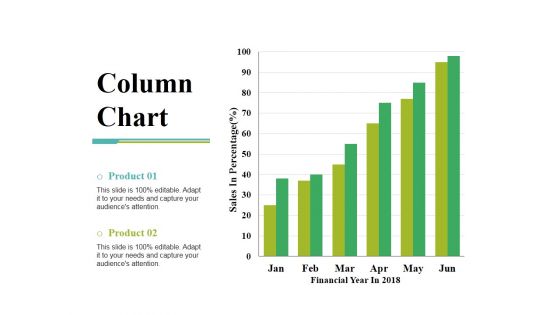
Column Chart Ppt PowerPoint Presentation Gallery Slide Portrait
This is a column chart ppt powerpoint presentation gallery slide portrait. This is a two stage process. The stages in this process are sales in percentage, financial year, product, bar graph, growth.


 Continue with Email

 Home
Home


