Growth Icon
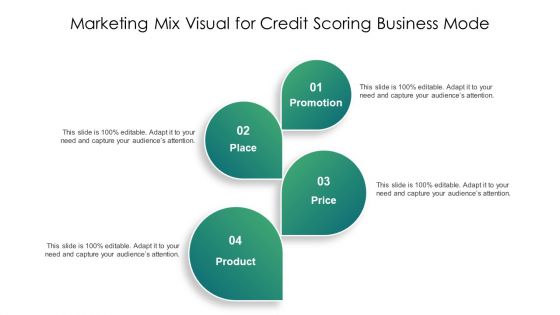
Marketing Mix Visual For Credit Scoring Business Model Ppt Infographic Template Example 2015 PDF
Presenting marketing mix visual for credit scoring business model ppt infographic template example 2015 pdf to dispense important information. This template comprises four stages. It also presents valuable insights into the topics including product, place, price, promotion. This is a completely customizable PowerPoint theme that can be put to use immediately. So, download it and address the topic impactfully.
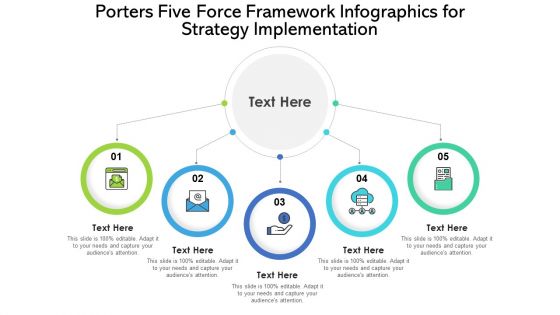
Porters Five Force Framework Infographics For Strategy Implementation Ppt PowerPoint Presentation File Graphics Design PDF
Presenting porters five force framework infographics for strategy implementation ppt powerpoint presentation file graphics design pdf to dispense important information. This template comprises five stages. It also presents valuable insights into the topics including porters five force framework infographics for strategy implementation This is a completely customizable PowerPoint theme that can be put to use immediately. So, download it and address the topic impactfully.
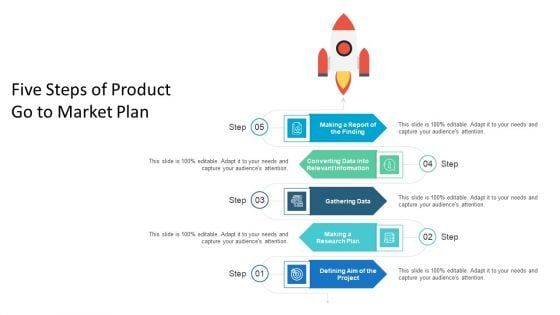
Five Steps Of Product Go To Market Plan Ppt Infographics Graphics Template PDF
Presenting five steps of product go to market plan ppt infographics graphics template pdf to dispense important information. This template comprises five stages. It also presents valuable insights into the topics including making a research plan, converting data into relevant information, gathering data. This is a completely customizable PowerPoint theme that can be put to use immediately. So, download it and address the topic impactfully.
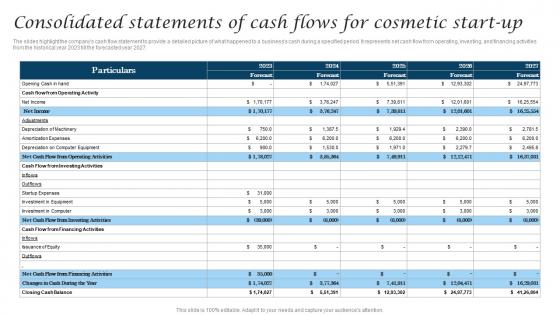
Consolidated Statements Of Cash Flows For Cosmetic Industry Business Brochure Pdf
The slides highlight the companys cash flow statement to provide a detailed picture of what happened to a businesss cash during a specified period. It represents net cash flow from operating, investing, and financing activities from the historical year 2023 till the forecasted year 2027. Slidegeeks is here to make your presentations a breeze with Consolidated Statements Of Cash Flows For Cosmetic Industry Business Brochure Pdf With our easy-to-use and customizable templates, you can focus on delivering your ideas rather than worrying about formatting. With a variety of designs to choose from, you are sure to find one that suits your needs. And with animations and unique photos, illustrations, and fonts, you can make your presentation pop. So whether you are giving a sales pitch or presenting to the board, make sure to check out Slidegeeks first The slides highlight the companys cash flow statement to provide a detailed picture of what happened to a businesss cash during a specified period. It represents net cash flow from operating, investing, and financing activities from the historical year 2023 till the forecasted year 2027.
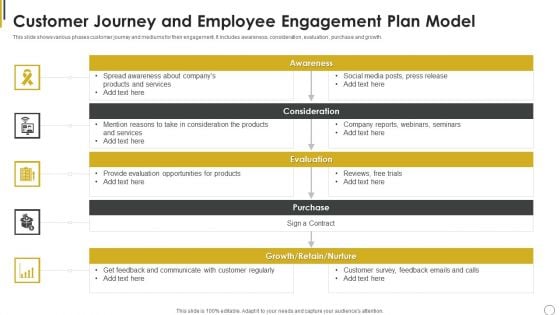
Customer Journey And Employee Engagement Plan Model Ppt Portfolio Design Inspiration PDF
This slide shows various phases customer journey and mediums for their engagement. It includes awareness, consideration, evaluation , purchase and growth. Showcasing this set of slides titled Customer Journey And Employee Engagement Plan Model Ppt Portfolio Design Inspiration PDF. The topics addressed in these templates are Awareness Consideration Evaluation, Purchase Growth Retain, Nurture Provide Evaluation. All the content presented in this PPT design is completely editable. Download it and make adjustments in color, background, font etc. as per your unique business setting.
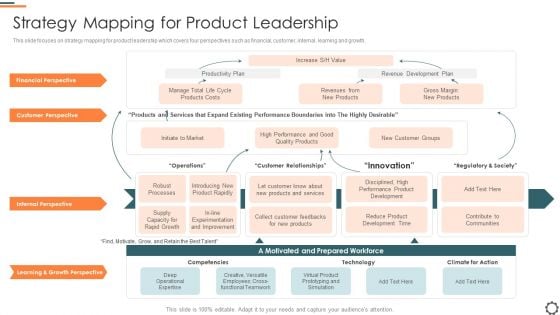
Agile Group For Product Development Strategy Mapping For Product Leadership Formats PDF
This slide focuses on strategy mapping for product leadership which covers four perspectives such as financial, customer, internal, learning and growth. Deliver an awe inspiring pitch with this creative agile group for product development strategy mapping for product leadership formats pdf bundle. Topics like financial perspective, customer perspective, learning and growth perspective can be discussed with this completely editable template. It is available for immediate download depending on the needs and requirements of the user.

Sales Folder Business PowerPoint Templates And PowerPoint Backgrounds 0711
Microsoft PowerPoint Template and Background with folder icon with clock Give the gift of career growth with our Sales Folder Business PowerPoint Templates And PowerPoint Backgrounds 0711. Dont waste time struggling with PowerPoint. Let us do it for you.
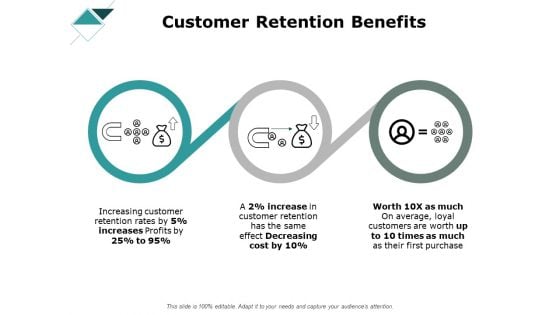
Customer Retention Benefits Ppt PowerPoint Presentation Gallery Graphics Design
This is acustomer loyalty management ppt powerpoint presentation icon graphics design. This is a three stage process. The stages in this process are marketing, business, management, planning, strategy.
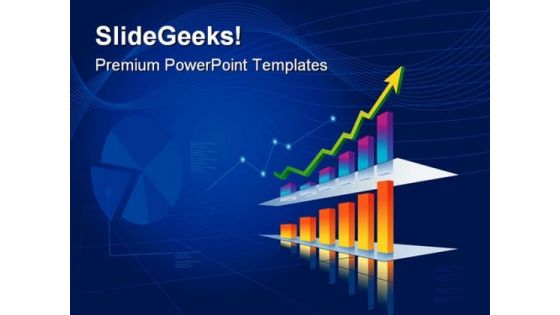
Financial Growth01 Business PowerPoint Themes And PowerPoint Slides 0711
Microsoft PowerPoint Theme and Slide with business finance depicting growth Our Financial Growth01 Business PowerPoint Themes And PowerPoint Slides 0711 are maintenance free. All they require is a dash of your thoughts.
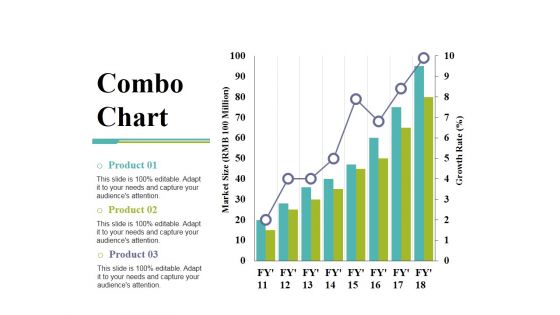
Combo Chart Ppt PowerPoint Presentation Show Deck
This is a combo chart ppt powerpoint presentation show deck. This is a three stage process. The stages in this process are growth rate, market size, product, bar graph, growth.
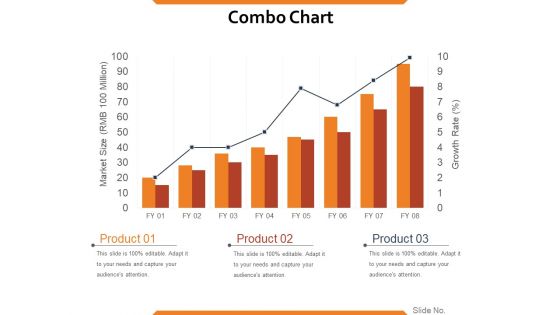
Combo Chart Ppt PowerPoint Presentation Styles Good
This is a combo chart ppt powerpoint presentation styles good. This is a eight stage process. The stages in this process are market size, growth rate, product, growth, strategy, graph, finance.
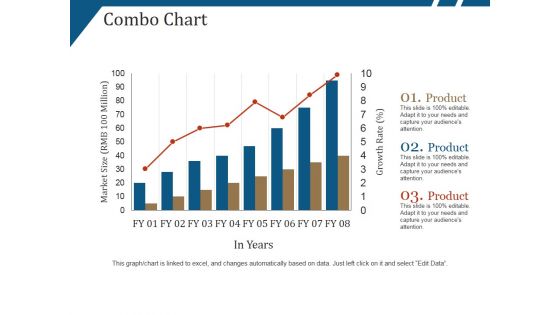
Combo Chart Ppt PowerPoint Presentation Summary Ideas
This is a combo chart ppt powerpoint presentation summary ideas. This is a eight stage process. The stages in this process are market size, growth rate, product, in years.
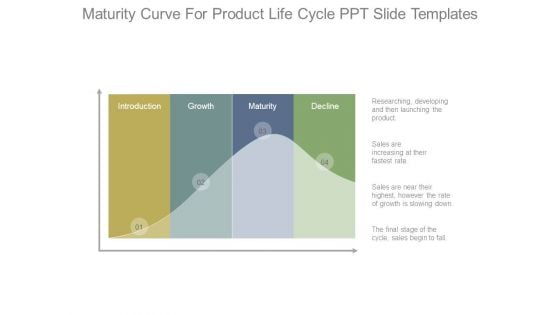
Maturity Curve For Product Life Cycle Ppt Slide Templates
This is a maturity curve for product life cycle ppt slide templates. This is a four stage process. The stages in this process are researching developing and then launching the product, sales are increasing at their fastest rate, sales are near their highest however the rate of growth is slowing down, the final stage of the cycle sales begin to fall, introduction, growth, maturity, decline.
Green Leaves Eco Hand Vector Ppt Powerpoint Presentation Show Topics
This is a green leaves eco hand vector ppt powerpoint presentation show topics. This is a three stage process. The stages in this process are fitness icon, wellbeing icon, wellness icon.
Health Nature And Wellness Vector Ppt Powerpoint Presentation Pictures Show
This is a health nature and wellness vector ppt powerpoint presentation pictures show. This is a three stage process. The stages in this process are fitness icon, wellbeing icon, wellness icon.
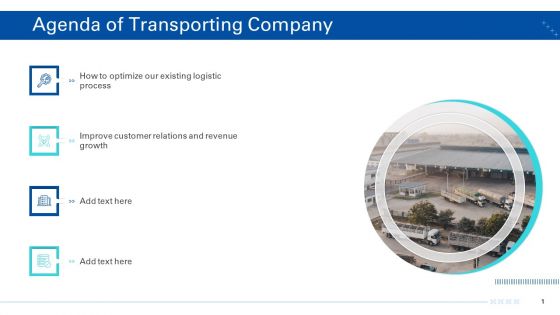
Transporting Company Agenda Of Transporting Company Ppt Show Smartart PDF
Deliver an awe-inspiring pitch with this creative transporting company agenda of transporting company ppt show smart art pdf. bundle. Topics like optimize our existing logistic process, improve customer relations and revenue growth can be discussed with this completely editable template. It is available for immediate download depending on the needs and requirements of the user.
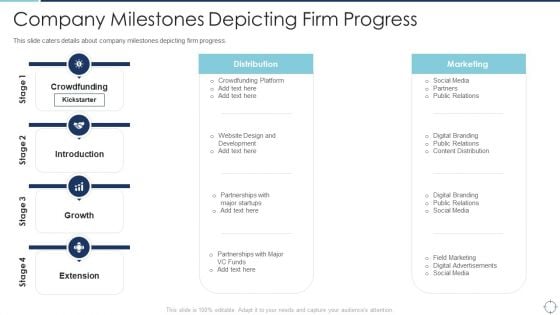
Goals Slide Pitch Deck Company Milestones Depicting Firm Progress Slides PDF
This slide caters details about company milestones depicting firm progress. Deliver an awe inspiring pitch with this creative goals slide pitch deck company milestones depicting firm progress slides pdf bundle. Topics like crowdfunding, introduction, growth can be discussed with this completely editable template. It is available for immediate download depending on the needs and requirements of the user.
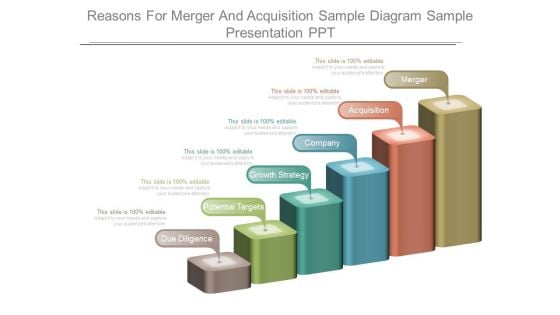
Reasons For Merger And Aquisition Sample Diagram Sample Presentation Ppt
This is a reasons for merger and aquisition sample diagram sample presentation ppt. This is a six stage process. The stages in this process are merger, acquisition, company, growth strategy, potential targets, due diligence.
Pitch Deck For Entrepreneurs Raising Money For A New Business Ppt PowerPoint Presentation Complete Deck With Slides
This is a pitch deck for entrepreneurs raising money for a new business ppt powerpoint presentation complete deck with slides. This is a one stage process. The stages in this process are business, growth strategy, marketing, management, bar graph.
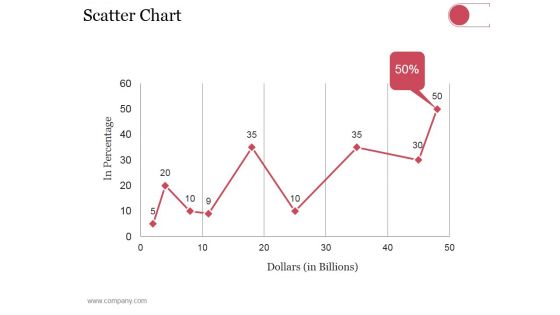
Scatter Chart Ppt PowerPoint Presentation Styles Show
This is a scatter chart ppt powerpoint presentation styles show. This is a nine stage process. The stages in this process are dollars, in percentage, finance, growth strategy.
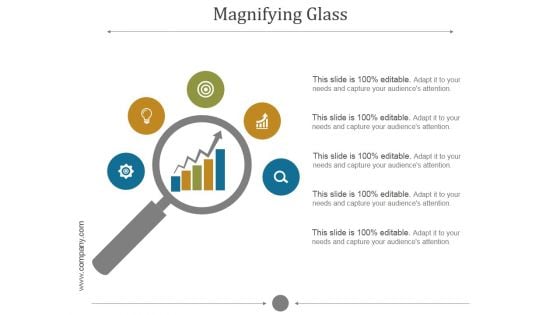
Magnifying Glass Ppt PowerPoint Presentation Shapes
This is a magnifying glass ppt powerpoint presentation shapes. This is a five stage process. The stages in this process are business, magnify, icons, search, growth.
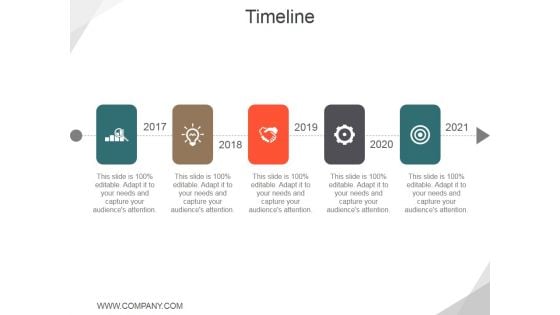
Timeline Ppt PowerPoint Presentation Inspiration File Formats
This is a timeline ppt powerpoint presentation inspiration file formats. This is a five stage process. The stages in this process are years, icons, strategy, growth, time planning.
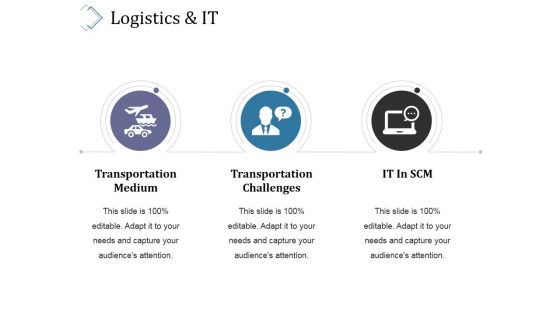
Logistics And It Ppt PowerPoint Presentation Layouts Files
This is a logistics and it ppt powerpoint presentation layouts files. This is a three stage process. The stages in this process are icon, business, growth, marketing, management.
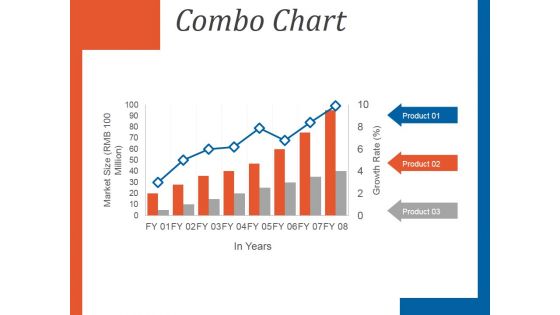
Combo Chart Ppt PowerPoint Presentation Design Ideas
This is a combo chart ppt powerpoint presentation design ideas. This is a eight stage process. The stages in this process are market size, combo chart, in years, product, growth rate.
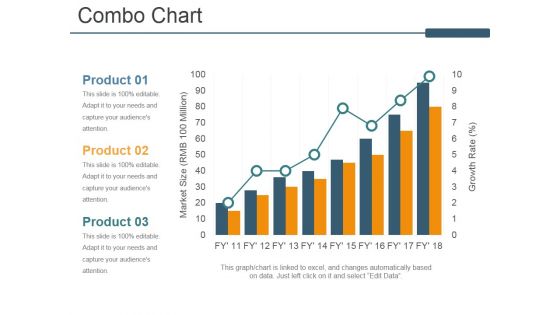
Combo Chart Ppt PowerPoint Presentation Layouts Portfolio
This is a combo chart ppt powerpoint presentation layouts portfolio. This is a three stage process. The stages in this process are combo chart, product, market size, growth rate.
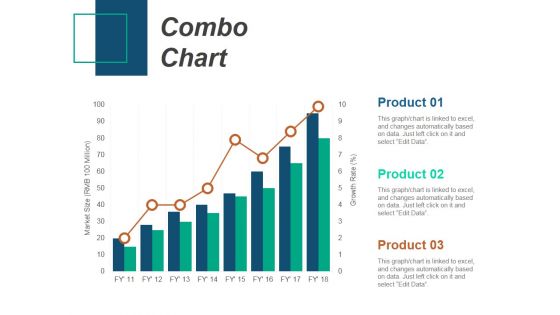
Combo Chart Ppt PowerPoint Presentation Summary Background Image
This is a combo chart ppt powerpoint presentation summary background image. This is a three stage process. The stages in this process are combo chart, product, growth rate, market size.
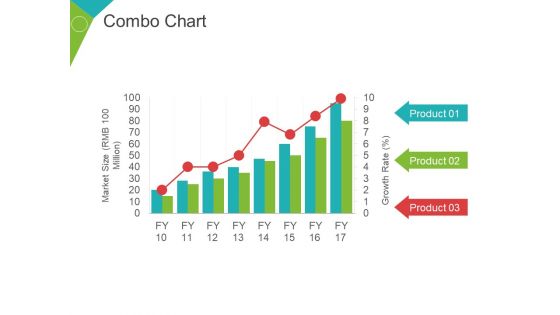
Combo Chart Ppt PowerPoint Presentation Infographic Template Graphic Images
This is a combo chart ppt powerpoint presentation infographic template graphic images. This is a three stage process. The stages in this process are market size, growth rate, percentage, business, marketing.
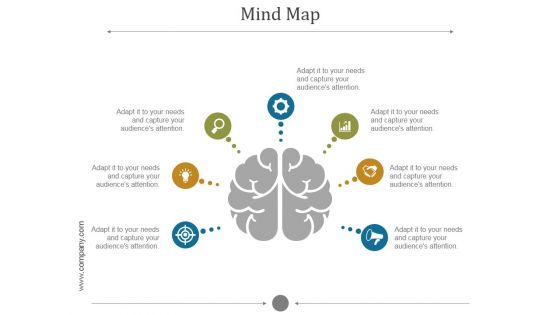
Mind Map Ppt PowerPoint Presentation Ideas
This is a mind map ppt powerpoint presentation ideas. This is a seven stage process. The stages in this process are icons, brain, mind, innovation, intellectual.

Career Development Planning Powerpoint Guide
This is a career development planning powerpoint guide. This is a four stage process. The stages in this process are career objectives, icons, business, marketing, presentation.
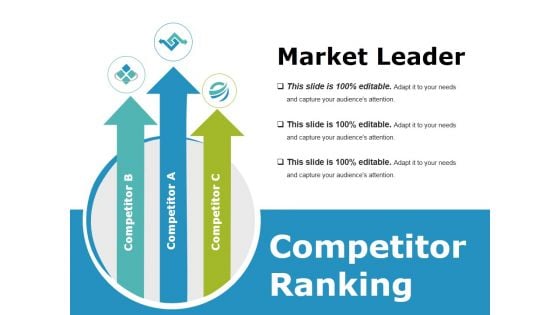
Competitor Ranking Ppt PowerPoint Presentation File Gridlines
This is a competitor ranking ppt powerpoint presentation file gridlines. This is a three stage process. The stages in this process are business, arrow, icons, marketing, strategy.

Chat And Voice Process Customer Support Ppt PowerPoint Presentation Infographics Slides
Presenting this set of slides with name chat and voice process customer support ppt powerpoint presentation infographics slides. The topics discussed in these slides are technology, mobile icon, ivr icon. This is a completely editable PowerPoint presentation and is available for immediate download. Download now and impress your audience.
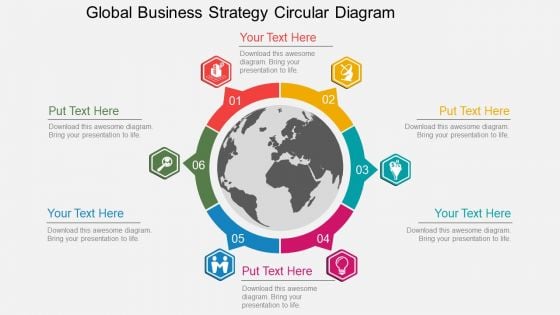
Global Business Strategy Circular Diagram Powerpoint Template
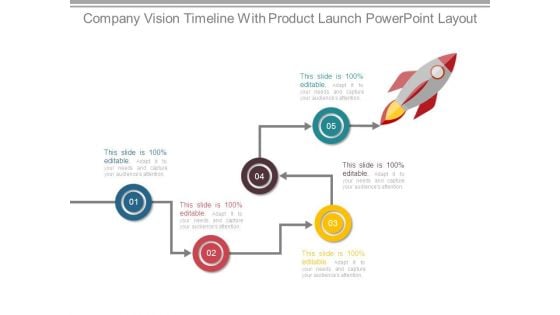
Company Vision Timeline With Product Launch Powerpoint Layout
This is a company vision timeline with product launch powerpoint layout. This is a five stage process. The stages in this process are business, marketing, strategy, process, management, icons, arrow.

Our Mission Ppt PowerPoint Presentation Infographic Template Backgrounds
This is a our mission ppt powerpoint presentation infographic template backgrounds. This is a one stage process. The stages in this process are our mission, icons, strategy, launch, achievement.

Business Strategy Innovation Ppt PowerPoint Presentation Complete Deck With Slides
This is a business strategy innovation ppt powerpoint presentation complete deck with slides. This is a one stage process. The stages in this process are business, strategy, innovation, icons, marketing.

Growth01 Business PowerPoint Themes And PowerPoint Slides 0511
Microsoft PowerPoint Theme and Slide with confident businessman climbing a bar chart Branch out with our Growth01 Business PowerPoint Themes And PowerPoint Slides 0511. You will come out on top.
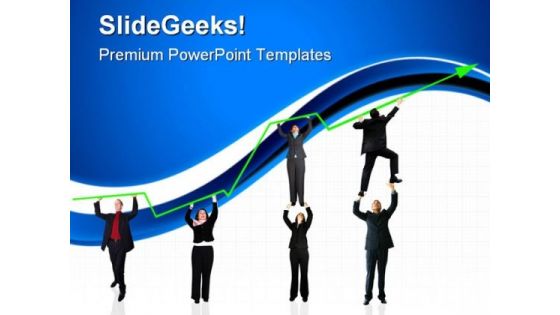
Business Growth03 Success PowerPoint Themes And PowerPoint Slides 0611
Microsoft PowerPoint Theme and Slide with business people pushing a business graph upwards Make our Business Growth03 Success PowerPoint Themes And PowerPoint Slides 0611 the abode for your thoughts. They will exist in complete comfort.

Business Growth01 Success PowerPoint Themes And PowerPoint Slides 0611
Microsoft PowerPoint Theme and Slide with business people pushing a business graph upwards Our Business Growth01 Success PowerPoint Themes And PowerPoint Slides 0611 have an eclectic outlook. They are conducive to all customs.
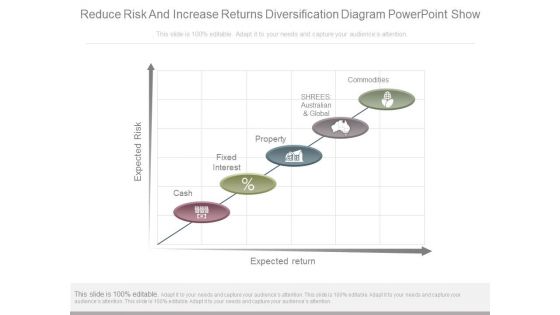
Reduce Risk And Increase Returns Diversification Diagram Powerpoint Show
This is a reduce risk and increase returns diversification diagram powerpoint show. This is a five stage process. The stages in this process are expected risk, expected return, cash, fixed interest, property, shrees australian and global, commodities.

Growth01 Business PowerPoint Templates And PowerPoint Backgrounds 0511
Microsoft PowerPoint Template and Background with confident businessman climbing a bar chart Applaud the performance of your employees. Give them due credit through our Growth01 Business PowerPoint Templates And PowerPoint Backgrounds 0511.
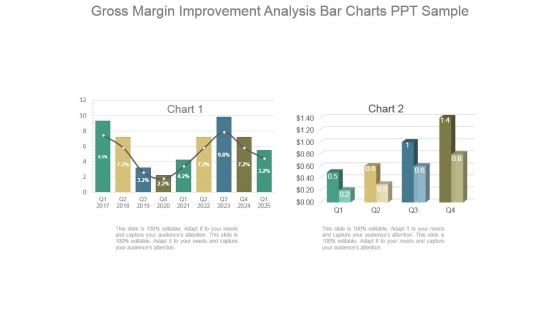
Gross Margin Improvement Analysis Bar Charts Ppt Sample
This is a gross margin improvement analysis bar charts ppt sample. This is a two stage process. The stages in this process are chart.
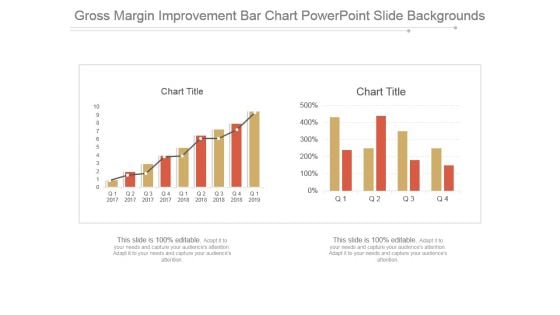
Gross Margin Improvement Bar Chart Powerpoint Slide Backgrounds
This is a gross margin improvement bar chart powerpoint slide backgrounds. This is a two stage process. The stages in this process are chart title.

Business Growth2011 Concept Globe PowerPoint Templates And PowerPoint Backgrounds 0211
Microsoft PowerPoint Template and Background with chart of the global gains in 2011 North America in the background Tackle the issue in it's entirety. Put up the overall picture with our Business Growth2011 Concept Globe PowerPoint Templates And PowerPoint Backgrounds 0211.
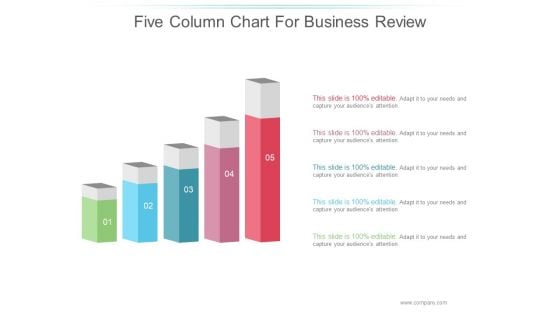
Five Column Chart For Business Review Ppt PowerPoint Presentation Diagrams
This is a five column chart for business review ppt powerpoint presentation diagrams. This is a five stage process. The stages in this process are business, marketing, bulb, icon, management.
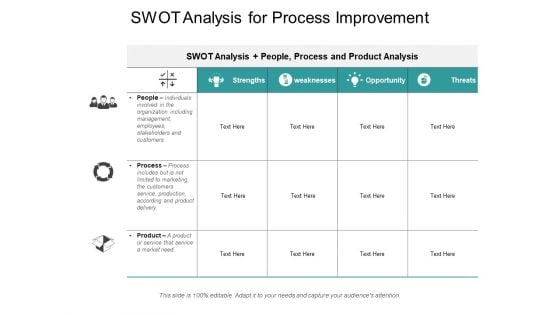
Swot Analysis For Process Improvement Ppt PowerPoint Presentation Show Graphics
This is a swot analysis for process improvement ppt powerpoint presentation show graphics. This is a three stage process. The stages in this process are business growth, people process product, 3ps.

Business Improvement Process Plan Develop Integrate And Evaluate Ppt PowerPoint Presentation Outline Demonstration
Presenting this set of slides with name business improvement process plan develop integrate and evaluate ppt powerpoint presentation outline demonstration. This is a six stage process. The stages in this process are growth, improvement, enhancement. This is a completely editable PowerPoint presentation and is available for immediate download. Download now and impress your audience.
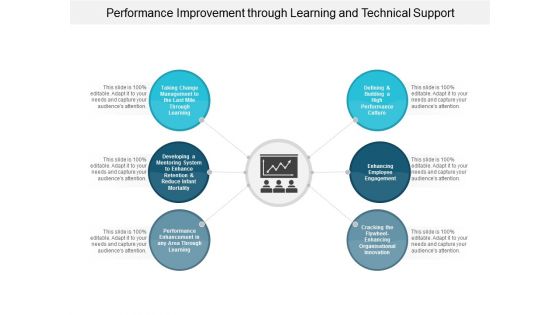
Performance Improvement Through Learning And Technical Support Ppt PowerPoint Presentation Pictures
Presenting this set of slides with name performance improvement through learning and technical support ppt powerpoint presentation pictures. This is a six stage process. The stages in this process are growth, improvement, enhancement. This is a completely editable PowerPoint presentation and is available for immediate download. Download now and impress your audience.
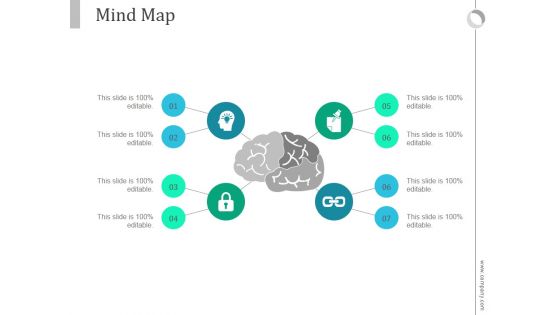
Mind Map Ppt PowerPoint Presentation Influencers
This is a mind map ppt powerpoint presentation influencers. This is a eight stage process. The stages in this process are business, marketing, management, skill, mind map.
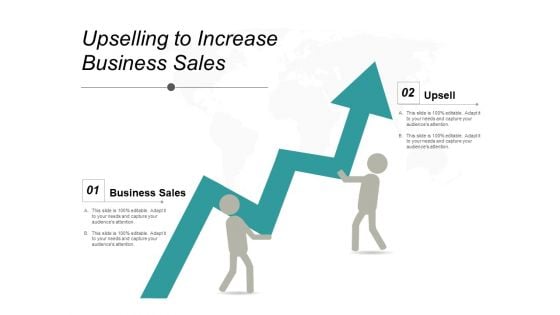
Upselling To Increase Business Sales Ppt PowerPoint Presentation Professional Slideshow
This is a upselling to increase business sales ppt powerpoint presentation professional slideshow. This is a two stage process. The stages in this process are sales, selling, upselling.
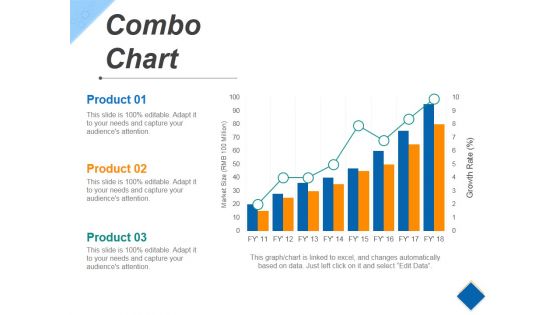
Combo Chart Ppt PowerPoint Presentation Diagram Images
This is a combo chart ppt powerpoint presentation diagram images. This is a eight stage process. The stages in this process are growth, success, business, marketing, product.
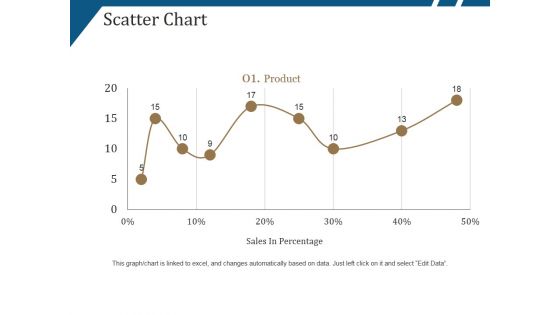
Scatter Chart Ppt PowerPoint Presentation Summary Deck
This is a scatter chart ppt powerpoint presentation summary deck. This is a nine stage process. The stages in this process are product, sales in percentage, growth, success.
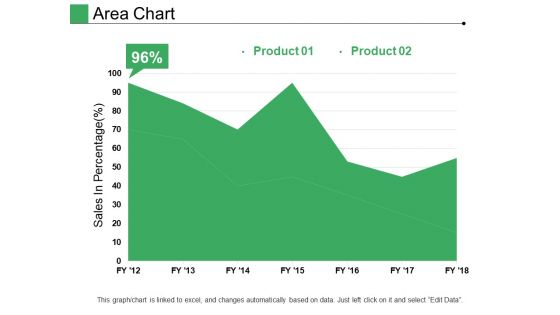
Area Chart Ppt PowerPoint Presentation Pictures Designs
This is a area chart ppt powerpoint presentation pictures designs. This is a two stage process. The stages in this process are product, sales in percentage, growth, success.
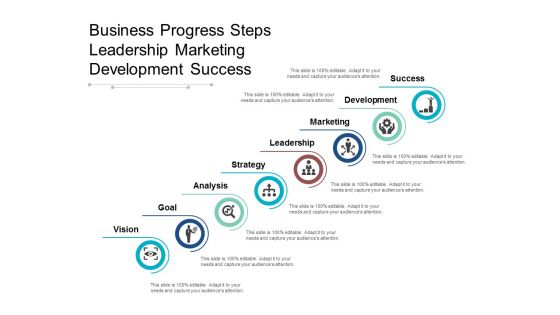
Business Progress Steps Leadership Marketing Development Success Ppt PowerPoint Presentation Styles Picture
Presenting this set of slides with name business progress steps leadership marketing development success ppt powerpoint presentation styles picture. This is a eight stage process. The stages in this process are growth, improvement, enhancement. This is a completely editable PowerPoint presentation and is available for immediate download. Download now and impress your audience.

Career Path Development Ppt Powerpoint Presentation Infographic Template Tips
This is a career path development ppt powerpoint presentation infographic template tips. This is a three stage process. The stages in this process are increase, improvement, enhancement.

Career Progress Discover Research Network And Transition Ppt PowerPoint Presentation Ideas Graphic Images
Presenting this set of slides with name career progress discover research network and transition ppt powerpoint presentation ideas graphic images. This is a six stage process. The stages in this process are growth, improvement, enhancement. This is a completely editable PowerPoint presentation and is available for immediate download. Download now and impress your audience.
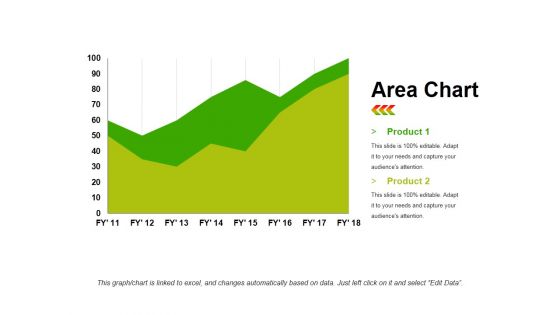
Area Chart Ppt PowerPoint Presentation Layouts Structure
This is a area chart ppt powerpoint presentation layouts structure. This is a two stage process. The stages in this process are area chart, product, business, growth, success.
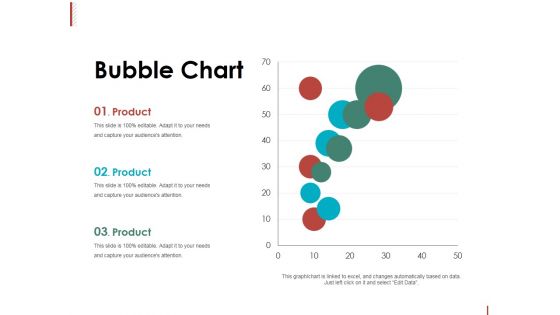
Bubble Chart Ppt PowerPoint Presentation File Professional
This is a bubble chart ppt powerpoint presentation file professional. This is a three stage process. The stages in this process are product, bubble chart, growth, business, success.
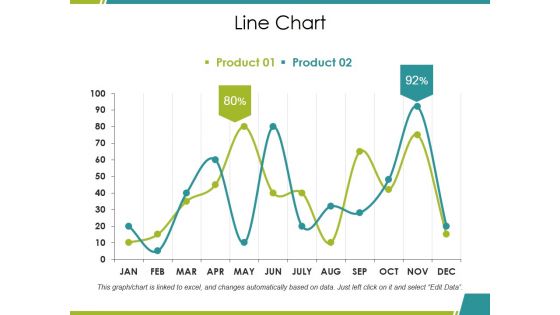
Line Chart Ppt PowerPoint Presentation Model Pictures
This is a line chart ppt powerpoint presentation model pictures. This is a two stage process. The stages in this process are product, percentage, growth, line chart, business.
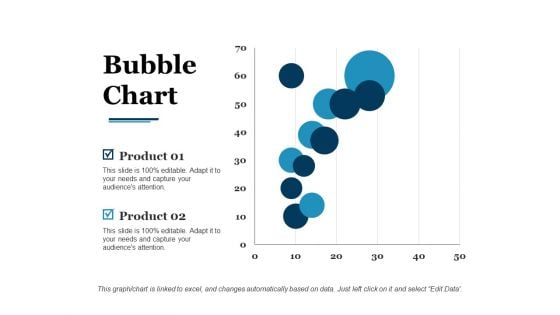
Bubble Chart Ppt PowerPoint Presentation Pictures Good
This is a bubble chart ppt powerpoint presentation pictures good. This is a two stage process. The stages in this process are product, bubble chart, growth.
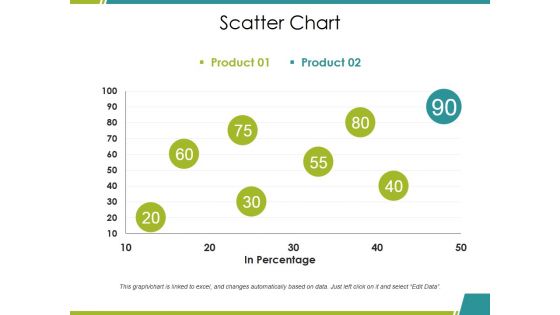
Scatter Chart Ppt PowerPoint Presentation Summary Inspiration
This is a scatter chart ppt powerpoint presentation summary inspiration. This is a two stage process. The stages in this process are product, in percentage, growth, success, business.

Bubble Chart Ppt PowerPoint Presentation Infographics Images
This is a bubble chart ppt powerpoint presentation infographics images. This is a two stage process. The stages in this process are product, bubble chart, business, growth, success.
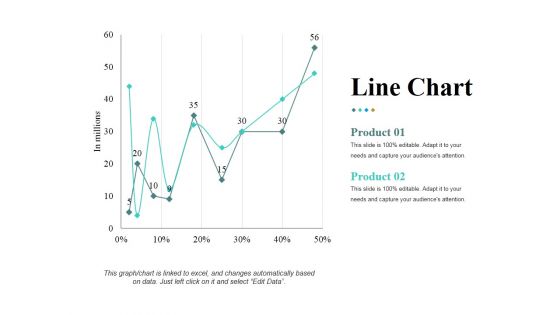
Line Chart Ppt PowerPoint Presentation Pictures Ideas
This is a line chart ppt powerpoint presentation pictures ideas. This is a two stage process. The stages in this process are in millions, percentage, finance, product, growth.
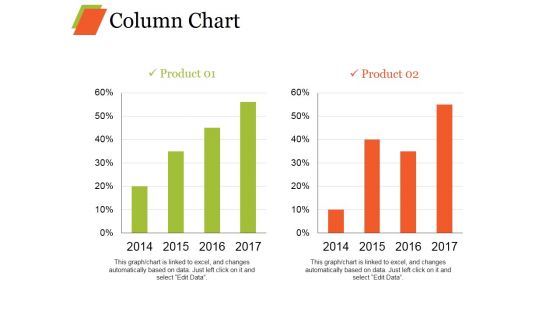
Column Chart Ppt PowerPoint Presentation Infographics Model
This is a column chart ppt powerpoint presentation infographics model. This is a two stage process. The stages in this process are bar graph, growth, product, percentage, year.
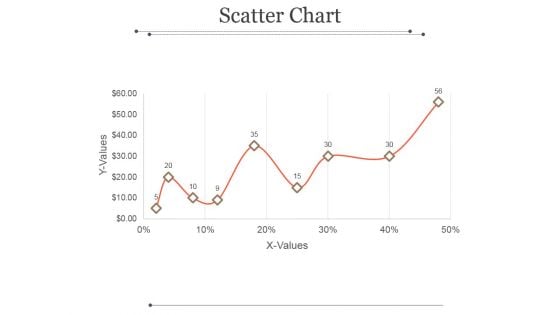
Scatter Chart Ppt PowerPoint Presentation Example
This is a scatter chart ppt powerpoint presentation example. This is a nine stage process. The stages in this process are x values, y values, business, growth, success.
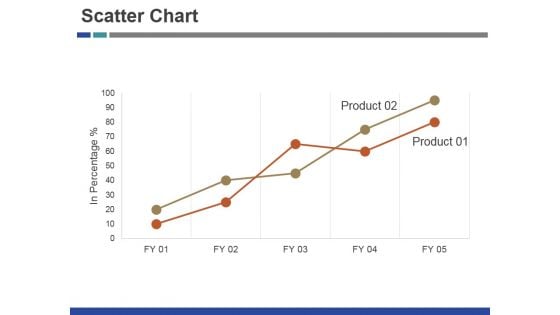
Scatter Chart Ppt PowerPoint Presentation Inspiration Brochure
This is a scatter chart ppt powerpoint presentation inspiration brochure. This is a two stage process. The stages in this process are product, growth, success, business.
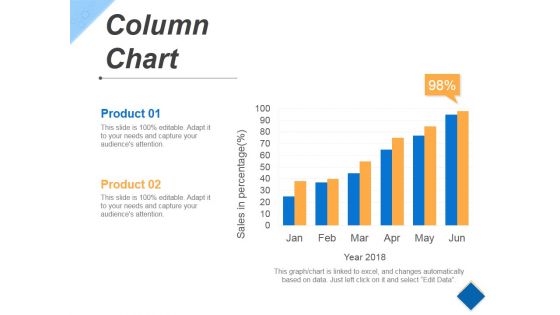
Column Chart Ppt PowerPoint Presentation Styles Vector
This is a column chart ppt powerpoint presentation styles vector. This is a six stage process. The stages in this process are growth, success, business, marketing, product.
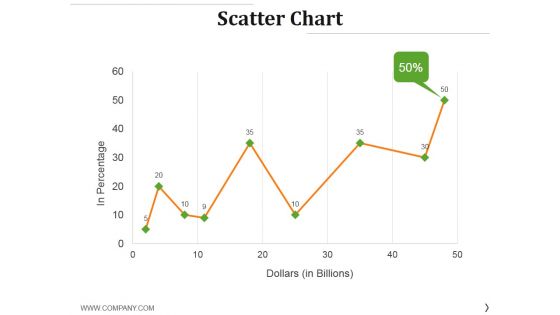
Scatter Chart Ppt PowerPoint Presentation Layouts Gridlines
This is a scatter chart ppt powerpoint presentation layouts gridlines. This is a nine stage process. The stages in this process are in percentage, dollars, growth, success, finance.

Line Chart Ppt PowerPoint Presentation Pictures Maker
This is a line chart ppt powerpoint presentation pictures maker. This is a two stage process. The stages in this process are financial years, product, growth, success.
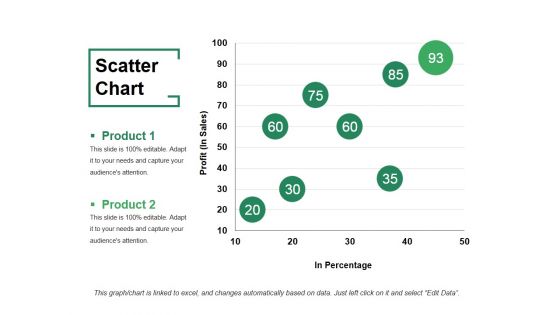
Scatter Chart Ppt PowerPoint Presentation File Visuals
This is a scatter chart ppt powerpoint presentation file visuals. This is a two stage process. The stages in this process are product, profit, in percentage, growth, success.
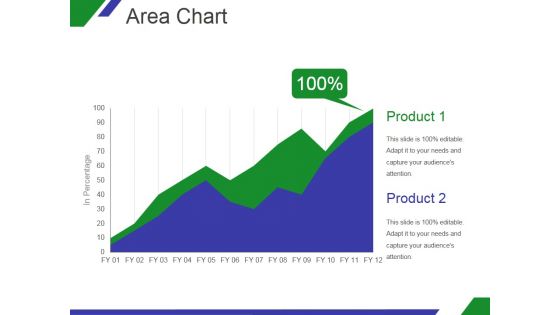
Area Chart Ppt PowerPoint Presentation Designs
This is a area chart ppt powerpoint presentation designs. This is a two stage process. The stages in this process are product, graph, in percentage, growth, business.
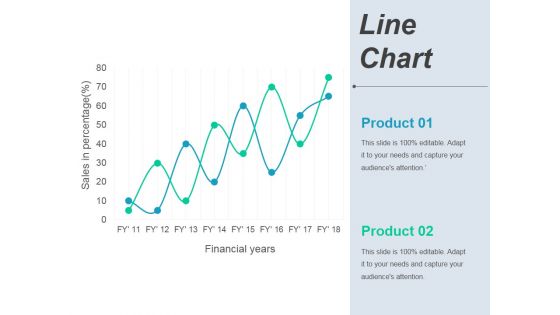
Line Chart Ppt PowerPoint Presentation Ideas Deck
This is a line chart ppt powerpoint presentation ideas deck. This is a two stage process. The stages in this process are business, marketing, finance, growth.
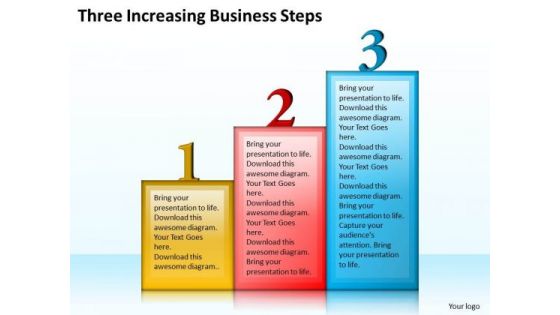
Business Strategy Concepts Three Increasing Steps Strategic Planning Ppt Slide
Our Timeline Ppt Template Three Increasing Business Steps help in a duel of wits. They get your ideas to come out on top. Our Business PowerPoint Templates play a dual role. They aid and abet you in your endeavour. Win any duel with our Finance PowerPoint Templates. Your thoughts will be faster on the draw.
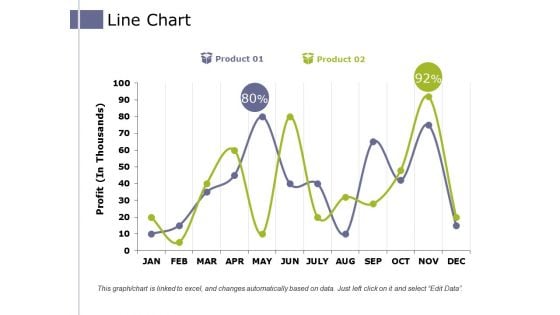
Line Chart Ppt PowerPoint Presentation Pictures Example Introduction
This is a line chart ppt powerpoint presentation pictures example introduction. This is a two stage process. The stages in this process are product, profit, business, growth, success.

Scatter Chart Ppt PowerPoint Presentation Infographic Template Objects
This is a scatter chart ppt powerpoint presentation infographic template objects. This is a nine stage process. The stages in this process are product, growth, success, graph.

Scatter Chart Ppt PowerPoint Presentation Portfolio Design Inspiration
This is a scatter chart ppt powerpoint presentation portfolio design inspiration. This is a twelve stage process. The stages in this process are graph, growth, success, business.
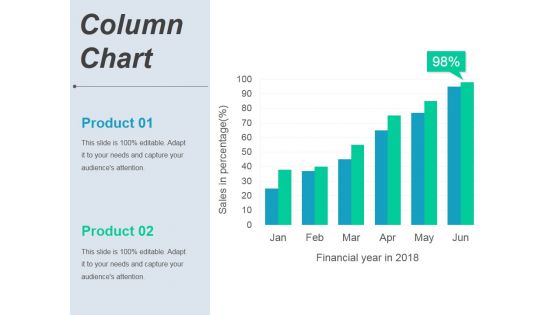
Column Chart Ppt PowerPoint Presentation Portfolio Graphics Template
This is a column chart ppt powerpoint presentation portfolio graphics template. This is a six stage process. The stages in this process are product, finance, growth, success, business.

Combo Chart Ppt PowerPoint Presentation Professional Graphics Example
This is a combo chart ppt powerpoint presentation professional graphics example. This is a eight stage process. The stages in this process are product, finance, growth, success, business.
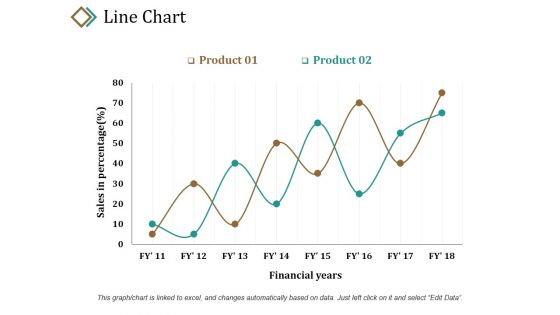
Line Chart Ppt PowerPoint Presentation Layouts Example
This is a line chart ppt powerpoint presentation layouts example. This is a two stage process. The stages in this process are sales in percentage, product, financial years, growth, success.

Line Chart Ppt PowerPoint Presentation Show Guide
This is a line chart ppt powerpoint presentation show guide. This is a two stage process. The stages in this process are product, sales in percentage, financial years, growth, success.
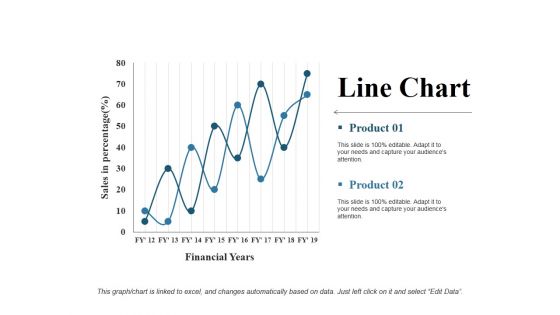
Line Chart Ppt PowerPoint Presentation Gallery Rules
This is a line chart ppt powerpoint presentation gallery rules. This is a two stage process. The stages in this process are financial years, product, sales in percentage, line chart, growth.
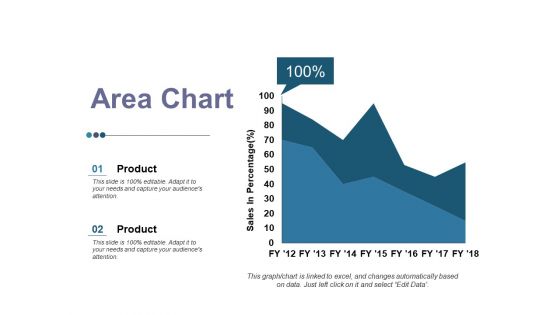
Area Chart Ppt PowerPoint Presentation Inspiration Graphics
This is a area chart ppt powerpoint presentation inspiration graphics. This is a two stage process. The stages in this process are product, area chart, business, growth, sales in percentage.
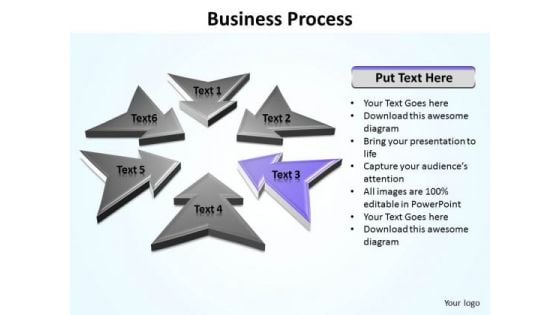
Ppt Direction Arrows Of Layout Editable PowerPoint World Map Templates
PPT direction arrows of layout editable powerpoint world map Templates-The above template contains a graphic of arrows pointing towards the center. Clarity of thought has been the key to your growth. Use our templates to illustrate your ability.-PPT direction arrows of layout editable powerpoint world map Templates-Abstract, Achievement, Aim, Arrow, Background, Business, Chart, Communication, Competition, Concept, Design, Direction, Development, Diagram, Direction, Finance, Financial, Forecast, Forward, Goal, Graph, Graphic, Growth, Icon, Illustration, Increase, Investment, Leader, Leadership, Design, Marketing, Price, Process, Profit, Progress, Progress, Shape, Sign, Success, Symbol, Target, Team, Teamwork Augment your assets with our Ppt Direction Arrows Of Layout Editable PowerPoint World Map Templates. They have many desirable attributes.
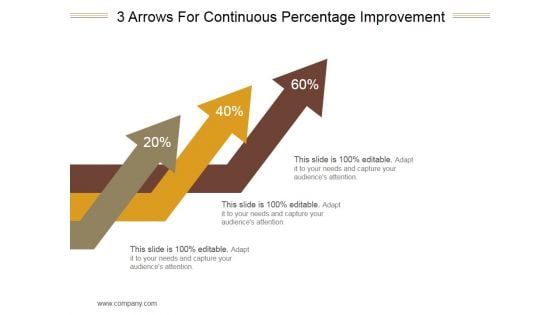
3 Arrows For Continuous Percentage Improvement Ppt PowerPoint Presentation Images
This is a 3 arrows for continuous percentage improvement ppt powerpoint presentation images. This is a three stage process. The stages in this process are arrows, marketing, strategy, management, business.
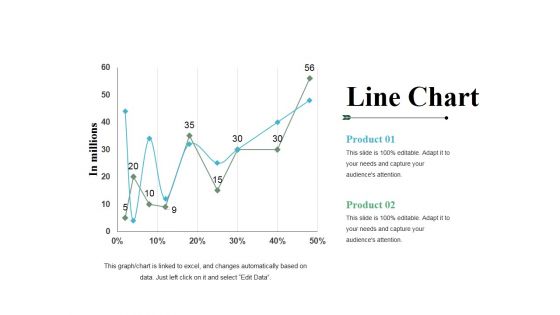
Line Chart Ppt PowerPoint Presentation File Templates
This is a line chart ppt powerpoint presentation file templates. This is a two stage process. The stages in this process are product, line chart, growth, percentage, in millions.
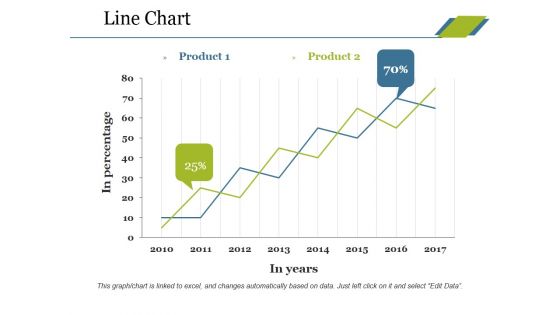
Line Chart Ppt PowerPoint Presentation Professional Tips
This is a line chart ppt powerpoint presentation professional tips. This is a two stage process. The stages in this process are product, in percentage, in years, growth, success.
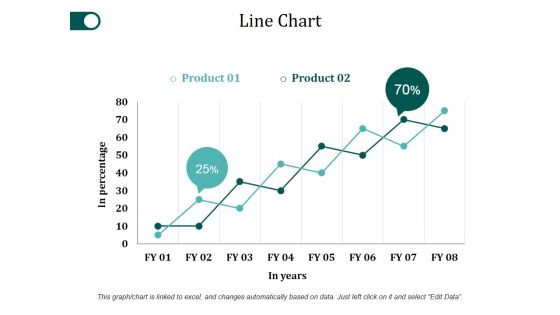
Line Chart Ppt PowerPoint Presentation Slides Ideas
This is a line chart ppt powerpoint presentation slides ideas. This is a two stage process. The stages in this process are product, in percentage, in years, growth, success.
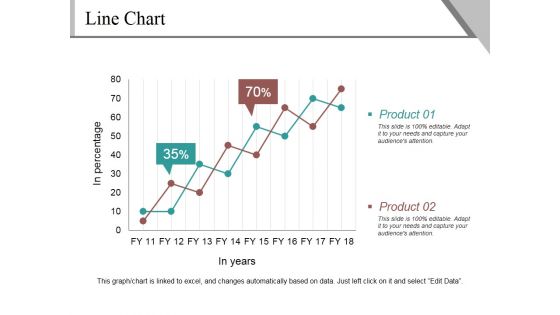
Line Chart Ppt PowerPoint Presentation Infographics Example
This is a line chart ppt powerpoint presentation infographics example. This is a two stage process. The stages in this process are product, in percentage, in years, finance, growth.
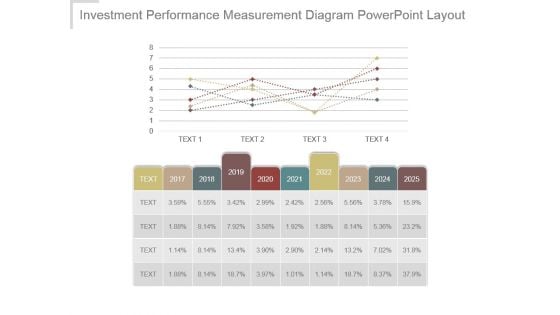
Investment Performance Measurement Diagram Powerpoint Layout
This is a investment performance measurement diagram powerpoint layout. This is a five stage process. The stages in this process are bar graph, growth, success, business, marketing.
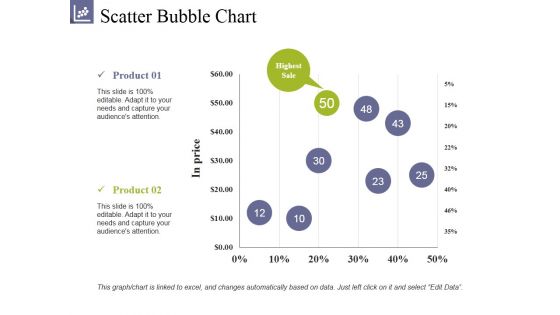
Scatter Bubble Chart Ppt PowerPoint Presentation Summary Clipart
This is a scatter bubble chart ppt powerpoint presentation summary clipart. This is a two stage process. The stages in this process are product, highest sale, in prices, growth, success.
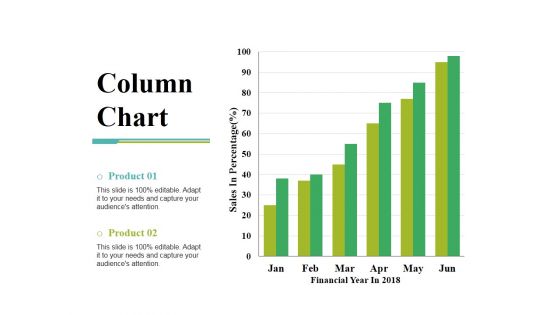
Column Chart Ppt PowerPoint Presentation Gallery Slide Portrait
This is a column chart ppt powerpoint presentation gallery slide portrait. This is a two stage process. The stages in this process are sales in percentage, financial year, product, bar graph, growth.
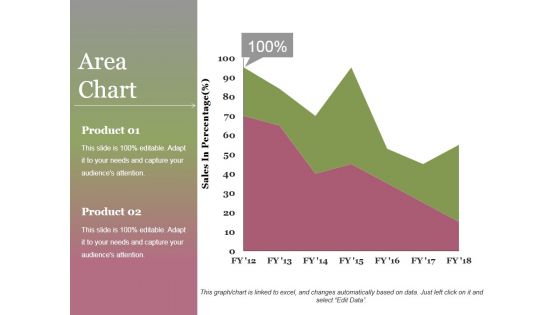
Area Chart Ppt PowerPoint Presentation Infographics File Formats
This is a area chart ppt powerpoint presentation infographics file formats. This is a two stage process. The stages in this process are area chart, product, sales in percentage, growth, success.
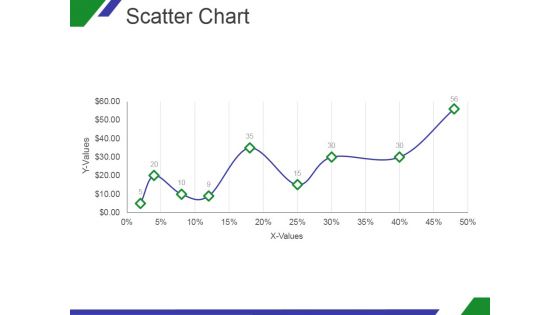
Scatter Chart Ppt PowerPoint Presentation Designs Download
This is a scatter chart ppt powerpoint presentation designs download. This is a nine stage process. The stages in this process are x values, y values, graph, growth, success.

Scatter Chart Ppt PowerPoint Presentation Model Template
This is a scatter chart ppt powerpoint presentation model template. This is a nine stage process. The stages in this process are x values, y values, graph, growth, success.
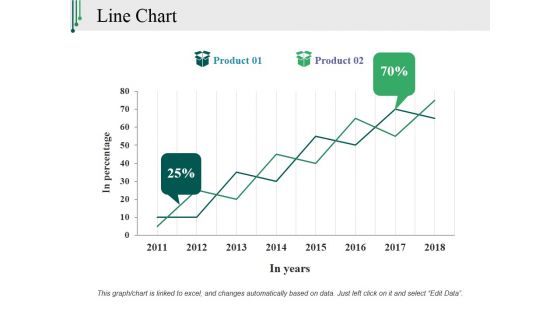
Line Chart Ppt PowerPoint Presentation Slides Mockup
This is a line chart ppt powerpoint presentation slides mockup. This is a two stage process. The stages in this process are in percentage, in years, product, growth, success.
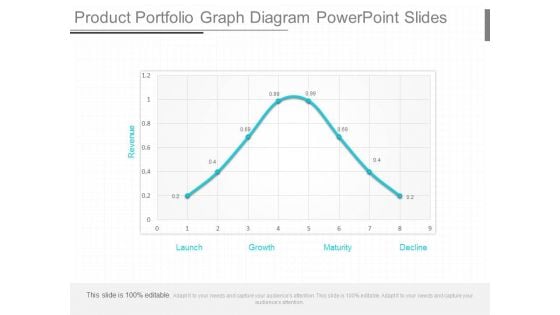
Product Portfolio Graph Diagram Powerpoint Slides
This is a product portfolio graph diagram powerpoint slides. This is a eight stage process. The stages in this process are revenue, launch, growth, maturity, decline.

Curve Chart For Product Life Cycle Presentation Outline
This is a curve chart for product life cycle presentation outline. This is a five stage process. The stages in this process are sales over time, product extension, introduction, growth, maturity, decline, time.
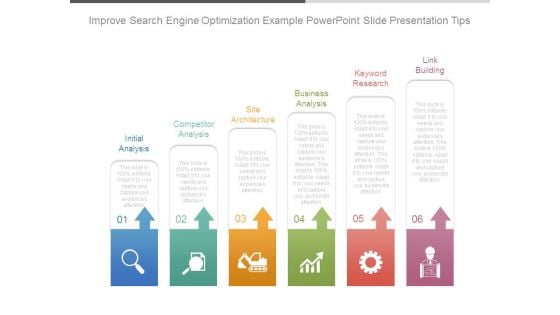
Improve Search Engine Optimization Example Powerpoint Slide Presentation Tips
This is a improve search engine optimization example powerpoint slide presentation tips. This is a six stage process. The stages in this process are initial analysis, competitor analysis, site architecture, business analysis, keyword research, link building.
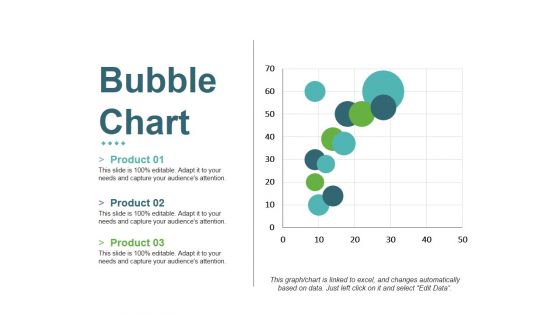
Bubble Chart Ppt PowerPoint Presentation Inspiration Graphics Download
This is a bubble chart ppt powerpoint presentation inspiration graphics download. This is a three stage process. The stages in this process are product, growth, success, bubble chart, business.
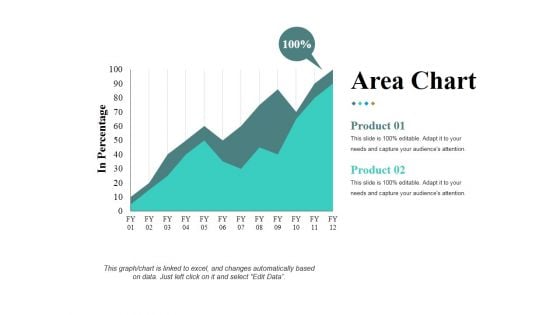
Area Chart Ppt PowerPoint Presentation Infographic Template Samples
This is a area chart ppt powerpoint presentation infographic template samples. This is a two stage process. The stages in this process are in percentage product, business, marketing, growth.
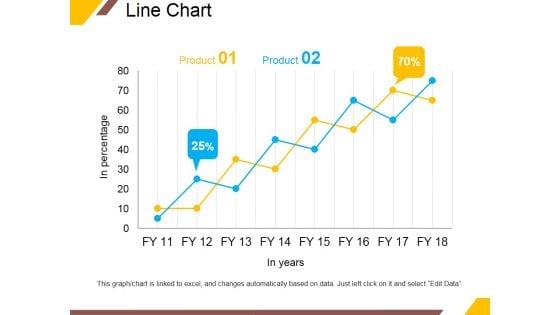
Line Chart Ppt PowerPoint Presentation Portfolio Infographic Template
This is a line chart ppt powerpoint presentation portfolio infographic template. This is a two stage process. The stages in this process are product, in years, business, percentage, growth.
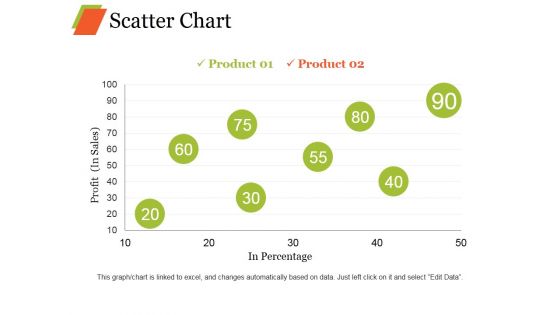
Scatter Chart Ppt PowerPoint Presentation Professional Graphic Images
This is a scatter chart ppt powerpoint presentation professional graphic images. This is a eight stage process. The stages in this process are product, profit, in percentage growth, business.
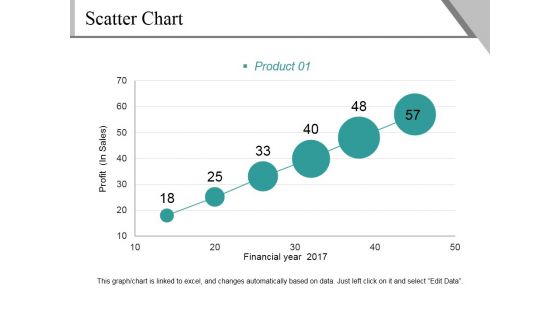
Scatter Chart Ppt PowerPoint Presentation File Background Image
This is a scatter chart ppt powerpoint presentation file background image. This is a six stage process. The stages in this process are profit, financial year, product, growth, success.
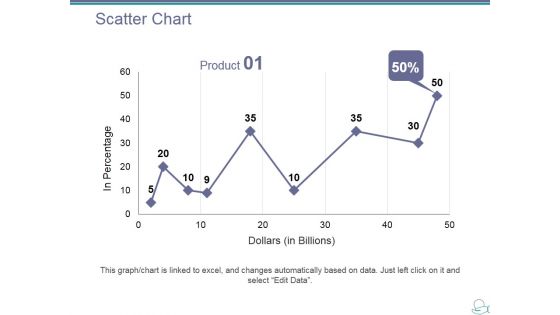
Scatter Chart Ppt PowerPoint Presentation Ideas Designs Download
This is a scatter chart ppt powerpoint presentation ideas designs download. This is a one stage process. The stages in this process are product, dollar, in percentage, growth, success.
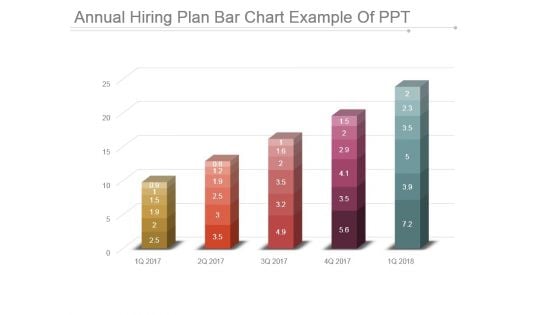
Annual Hiring Plan Bar Chart Example Of Ppt
This is a annual hiring plan bar chart example of ppt. This is a five stage process. The stages in this process are bar graph, business, marketing, growth, success.
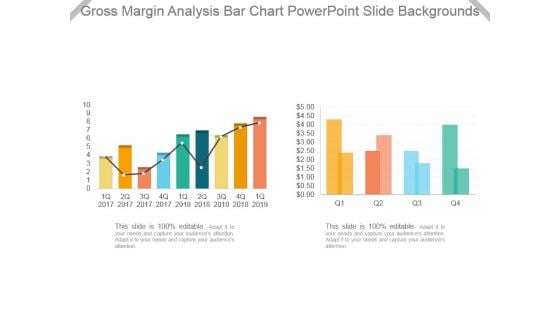
Gross Margin Analysis Bar Chart Powerpoint Slide Backgrounds
This is a gross margin analysis bar chart powerpoint slide backgrounds. This is a two stage process. The stages in this process are bar graph, business, marketing, growth, success.
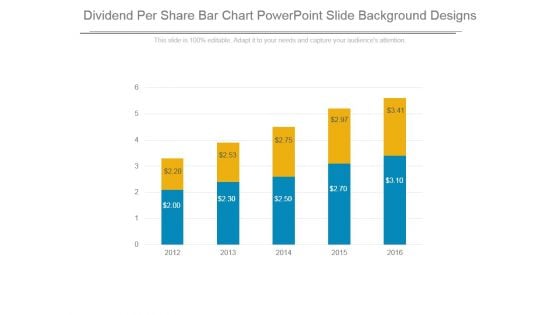
Dividend Per Share Bar Chart Powerpoint Slide Background Designs
This is a dividend per share bar chart powerpoint slide background designs. This is a five stage process. The stages in this process are business, marketing, success, growth, bar graph.
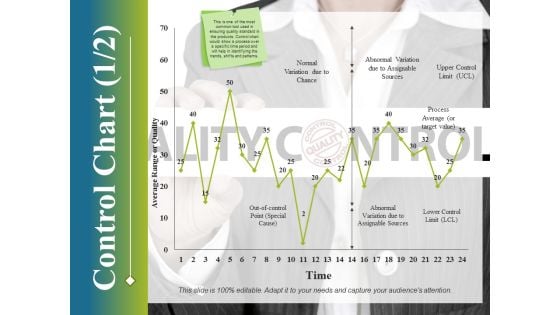
Control Chart Template 1 Ppt PowerPoint Presentation Infographic Template Deck
This is a control chart template 1 ppt powerpoint presentation infographic template deck. This is a one stage process. The stages in this process are control chart, growth, finance, marketing, strategy, business.

Xbar And R Chart Ppt PowerPoint Presentation Inspiration Styles
This is a xbar and r chart ppt powerpoint presentation inspiration styles. This is a two stage process. The stages in this process are subtitle, lcl, ucl, growth, graph.
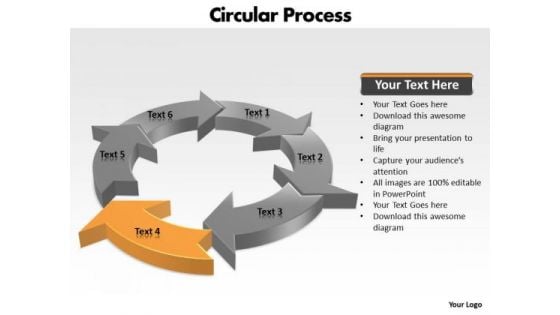
Ppt Components Of Circular PowerPoint Menu Template Process Chart Templates
PPT components of circular powerpoint menu template process chart Templates-This circular flow diagram can helps to illustrate the economic exchange that takes place in the building of wealth. Clarity of thought has been the key to your growth. Use our template to illustrate your ability.-PPT components of circular powerpoint menu template process chart Templates-Arrow, Chart, Circular, Color, Colorful, Connect, Connection, Design, Diagram, Finance, Graphic, Group, Growth, Icon, Illustration, Marketing, Pieces, Process, Recycle, Recycling, Round, Set, Strategy, Symbol, Wheel Consult experts with our Ppt Components Of Circular PowerPoint Menu Template Process Chart Templates. Download without worries with our money back guaranteee.
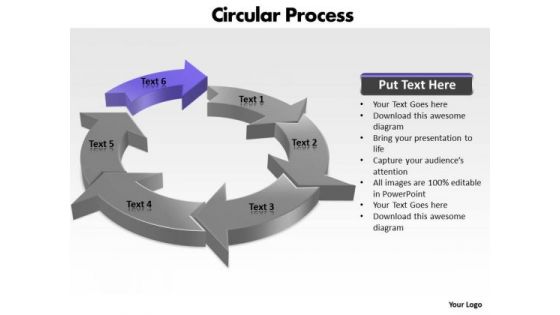
Ppt Components Of Circular Process PowerPoint Design Download 2010 Templates
PPT components of circular process powerpoint design download 2010 Templates-Use the circular flow diagram as a basis for your explanation. Present your views using our innovative slide and be assured of leaving a lasting impression.-PPT components of circular process powerpoint design download 2010 Templates-Arrow, Chart, Circular, Color, Colorful, Connect, Connection, Design, Diagram, Finance, Graphic, Group, Growth, Icon, Illustration, Marketing, Pieces, Process, Recycle, Recycling, Round, Set, Strategy, Symbol, Wheel Achieve high-growth with our Ppt Components Of Circular Process PowerPoint Design Download 2010 Templates. They will make you look good.
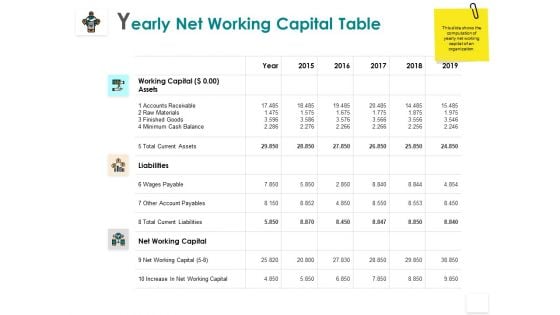
Yearly Net Working Capital Table Liabilities Minimum Ppt PowerPoint Presentation Infographic Template Diagrams
Presenting this set of slides with name yearly net working capital table liabilities minimum ppt powerpoint presentation infographic template diagrams. The topics discussed in these slides are liabilities, increase, business, planning, strategy. This is a completely editable PowerPoint presentation and is available for immediate download. Download now and impress your audience.
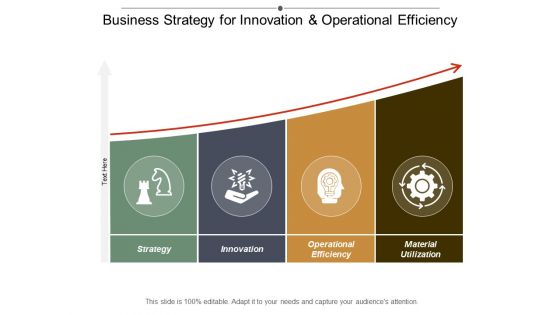
Business Strategy For Innovation And Operational Efficiency Ppt Powerpoint Presentation Slides Picture
This is a business strategy for innovation and operational efficiency ppt powerpoint presentation slides picture. This is a four stage process. The stages in this process are productivity improvement, output improvement, productivity enhancement.
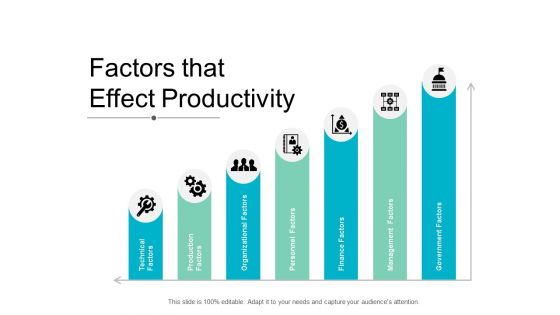
Factors That Effect Productivity Ppt Powerpoint Presentation Pictures Images
This is a factors that effect productivity ppt powerpoint presentation pictures images. This is a seven stage process. The stages in this process are productivity improvement, output improvement, productivity enhancement.
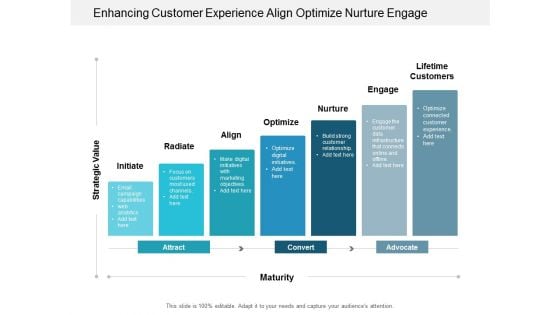
Enhancing Customer Experience Align Optimize Nurture Engage Ppt Powerpoint Presentation Infographic Template Graphics Design
This is a enhancing customer experience align optimize nurture engage ppt powerpoint presentation infographic template graphics design. This is a seven stage process. The stages in this process are customer satisfaction, customer services, customer engagement model.

Enable Engage Enhance Employees At Workplace Ppt PowerPoint Presentation Summary Elements
Presenting this set of slides with name enable engage enhance employees at workplace ppt powerpoint presentation summary elements. This is a four stage process. The stages in this process are empower, employee engagement, human projection. This is a completely editable PowerPoint presentation and is available for immediate download. Download now and impress your audience.
Air Balloon Graphic With Text Space Powerpoint Templates
This business slide has been designed with graphics of air balloon. Download this diagram to portray concepts like growth, finance, marketing, and communication. This slide is innovatively designed to highlight your worthy view.
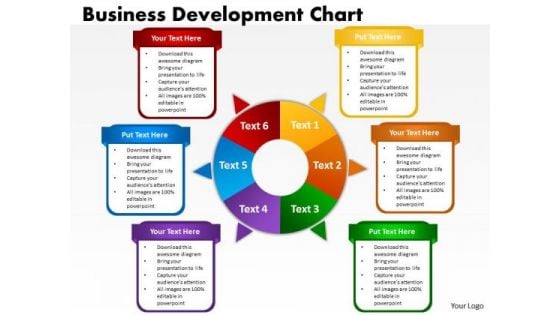
Consulting Diagram Business Development Chart Strategic Management
Document Your Views On Our Consulting Diagram Business Development Chart Strategic Management Powerpoint Templates. They Will Create A Strong Impression.
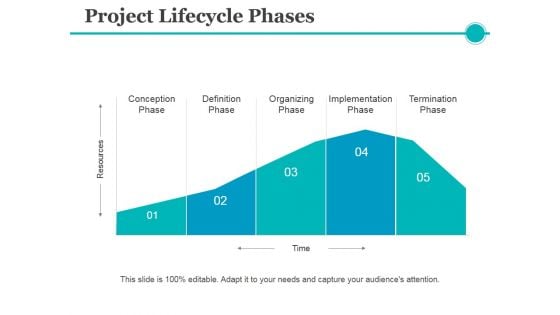
Project Lifecycle Phases Template 1 Ppt PowerPoint Presentation Layouts Layout
This is a project lifecycle phases template 1 ppt powerpoint presentation layouts layout. This is a five stage process. The stages in this process are definition phase, organizing phase, termination phase, implementation phase.
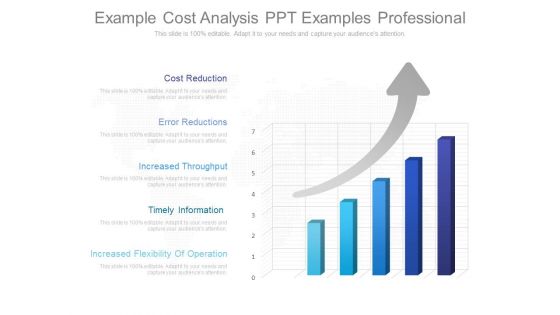
Example Cost Analysis Ppt Examples Professional
This is a example cost analysis ppt examples professional. This is a five stage process. The stages in this process are cost reduction, error reductions, increased throughput, timely information, increased flexibility of operation.
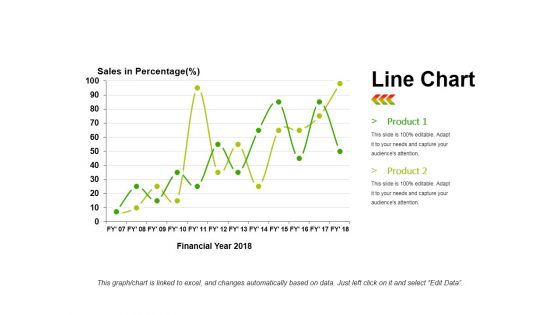
Line Chart Ppt PowerPoint Presentation Infographics Infographics
This is a line chart ppt powerpoint presentation infographics infographics. This is a two stage process. The stages in this process are product, sales in percentage, financial year, line chart, finance.
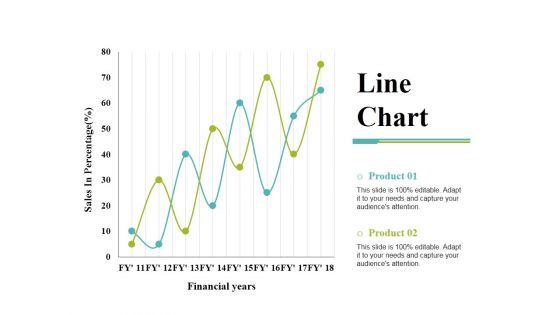
Line Chart Ppt PowerPoint Presentation Gallery Templates
This is a line chart ppt powerpoint presentation gallery templates. This is a two stage process. The stages in this process are product, financial years, sales in percentage, line chart.
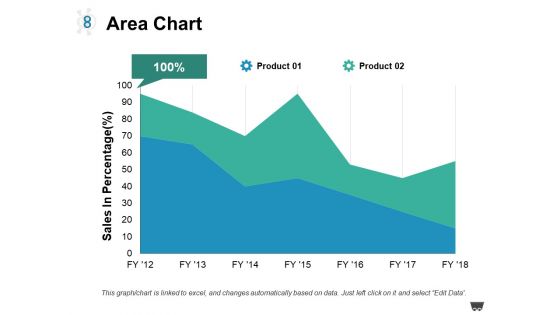
Area Chart Ppt PowerPoint Presentation Model Guidelines
This is a area chart ppt powerpoint presentation model guidelines. This is a two stage process. The stages in this process are product, area chart, sales in percentage.
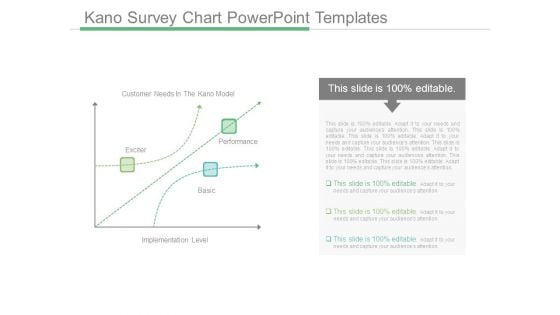
Kano Survey Chart Powerpoint Templates
This is a kano survey chart powerpoint templates. This is a three stage process. The stages in this process are customer needs in the kano model, exciter, performance, basic, implementation level.
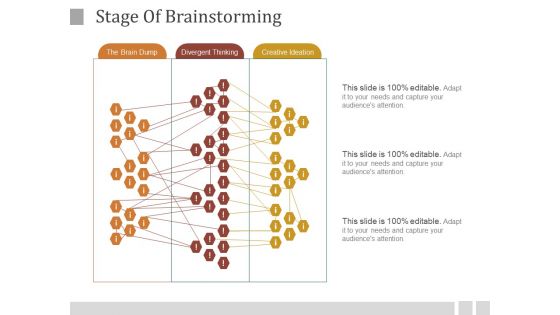
Stage Of Brainstorming Ppt PowerPoint Presentation Visual Aids
This is a stage of brainstorming ppt powerpoint presentation visual aids. This is a three stage process. The stages in this process are the brain dump, divergent thinking, creative ideation.
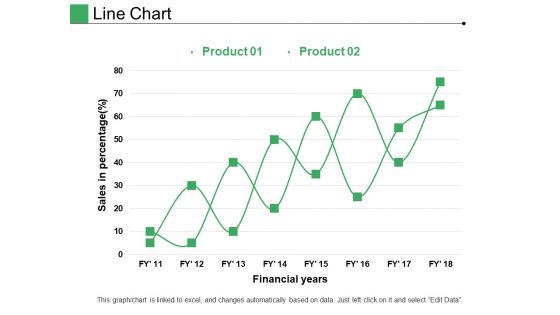
Line Chart Ppt PowerPoint Presentation Pictures Layout
This is a line chart ppt powerpoint presentation pictures layout. This is a two stage process. The stages in this process are product, financial years, sales in percentage.
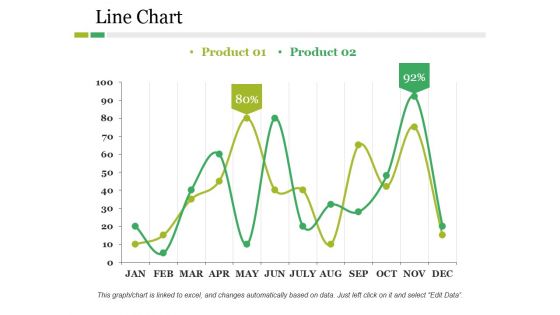
Line Chart Ppt PowerPoint Presentation Pictures Structure
This is a line chart ppt powerpoint presentation pictures structure. This is a two stage process. The stages in this process are product, business, line chart, finance, percentage.
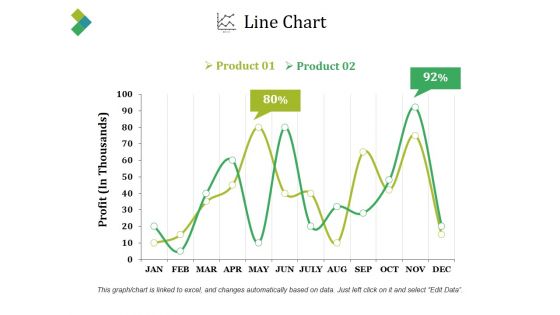
Line Chart Ppt PowerPoint Presentation Slides
This is a line chart ppt powerpoint presentation slides. This is a two stage process. The stages in this process are product, profit, percentage, finance, line chart.
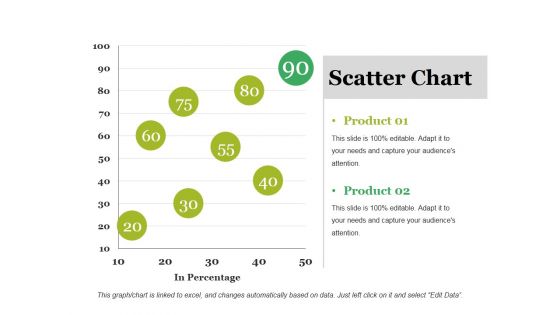
Scatter Chart Ppt PowerPoint Presentation Outline Ideas
This is a scatter chart ppt powerpoint presentation outline ideas. This is a two stage process. The stages in this process are product, scatter chart, business, in percentage, marketing.
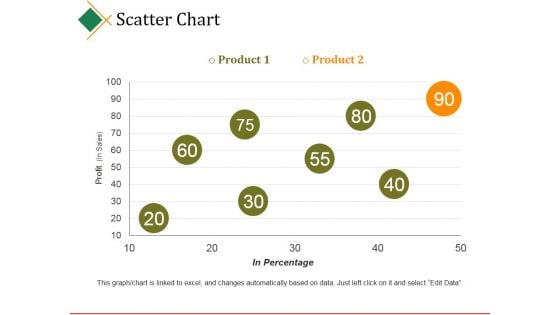
Scatter Chart Ppt PowerPoint Presentation Model
This is a scatter chart ppt powerpoint presentation model. This is a two stage process. The stages in this process are business, product, profit, in percentage, business.
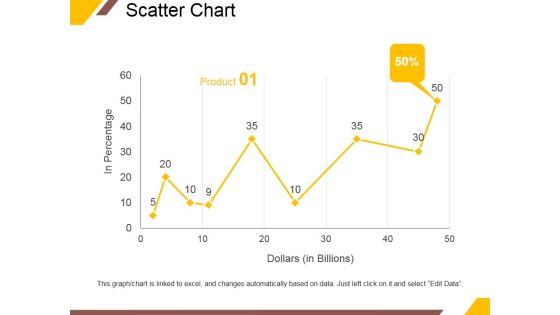
Scatter Chart Ppt PowerPoint Presentation Gallery Vector
This is a scatter chart ppt powerpoint presentation gallery vector. This is a nine stage process. The stages in this process are in percentage, dollars, product, percentage, finance.
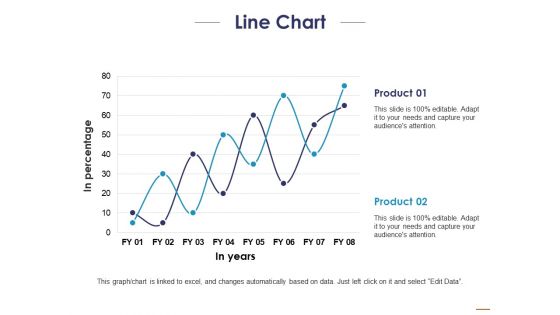
Line Chart Ppt PowerPoint Presentation Layouts Templates
This is a line chart ppt powerpoint presentation layouts templates. This is a two stage process. The stages in this process are product, in percentage, in years.
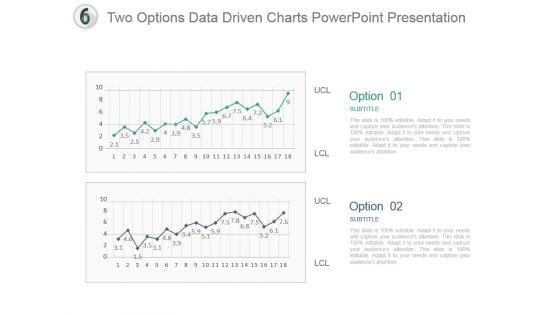
Two Options Data Driven Charts Powerpoint Presentation
This is a two options data driven charts powerpoint presentation. This is a two stage process. The stages in this process are business, success, strategy, process, marketing, management.
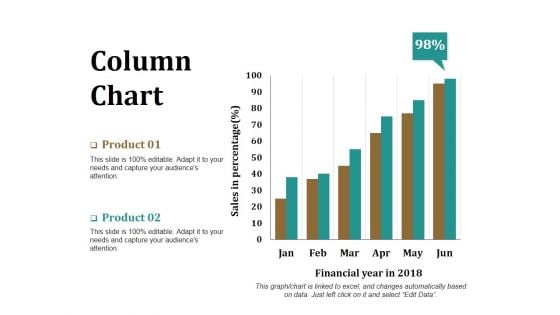
Column Chart Ppt PowerPoint Presentation Model Graphics Download
This is a column chart ppt powerpoint presentation model graphics download. This is a two stage process. The stages in this process are product, financial year, sales in percentage, bar graph, success.
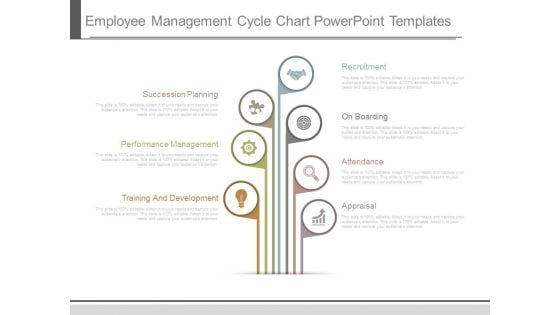
Employee Management Cycle Chart Powerpoint Templates
This is a employee management cycle chart powerpoint templates. This is a seven stage process. The stages in this process are succession planning, performance management, training and development, recruitment, on boarding, attendance, appraisal.
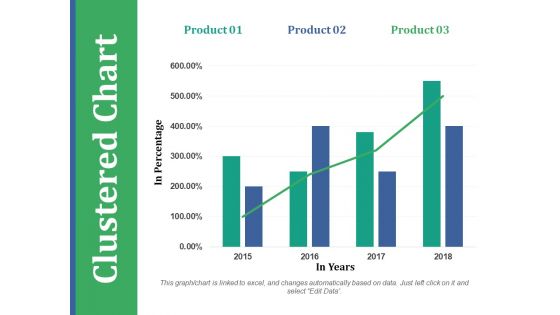
Clustered Chart Ppt PowerPoint Presentation Outline Templates
This is a clustered chart ppt powerpoint presentation outline templates. This is a three stage process. The stages in this process are product, in percentage, in years, clustered chart.
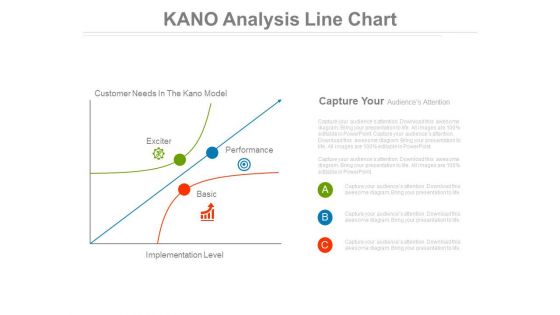
Kano Analysis Line Chart Ppt Slides
This is a kano analysis line chart ppt slides. This is a three stage process. The stages in this process are marketing, business.\n\n
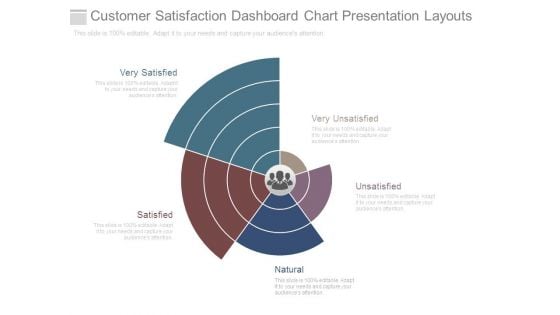
Customer Satisfaction Dashboard Chart Presentation Layouts
This is a customer satisfaction dashboard chart presentation layouts. This is a five stage process. The stages in this process are very satisfied, satisfied, unsatisfied, natural, very unsatisfied.
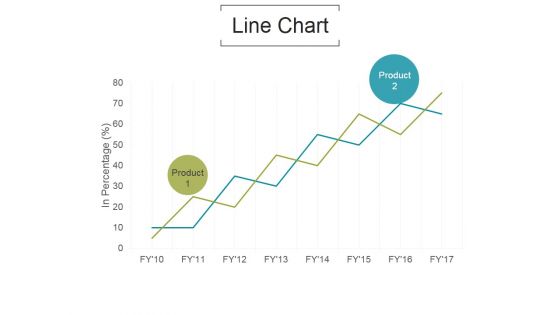
Line Chart Ppt PowerPoint Presentation Model
This is a line chart ppt powerpoint presentation model. This is a two stage process. The stages in this process are in percentage, product, business.
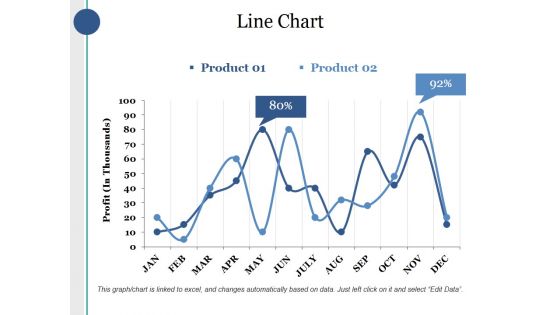
Line Chart Ppt PowerPoint Presentation Layouts Sample
This is a line chart ppt powerpoint presentation layouts sample. This is a two stage process. The stages in this process are product, profit, percentage, finance, business.
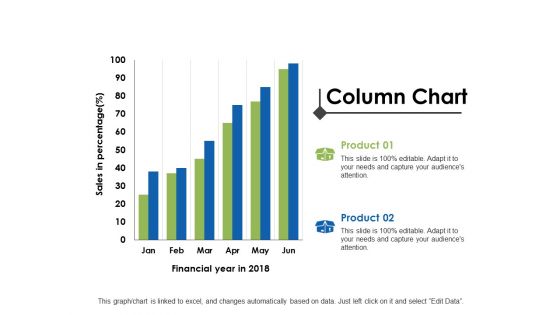
Column Chart Ppt PowerPoint Presentation Layouts Rules
This is a column chart ppt powerpoint presentation layouts rules. This is a two stage process. The stages in this process are analysis, finance, marketing, management, investment.
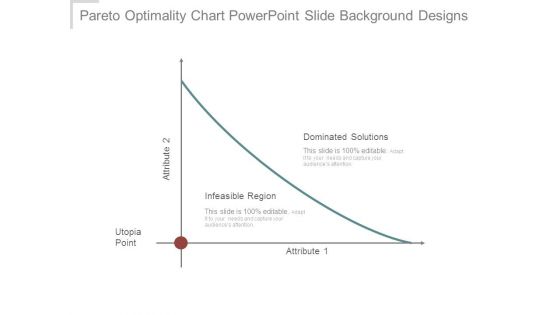
Pareto Optimality Chart Powerpoint Slide Background Designs
This is a pareto optimality chart powerpoint slide background designs. This is a one stage process. The stages in this process are dominated solutions, infeasible region, utopia point, attribute.
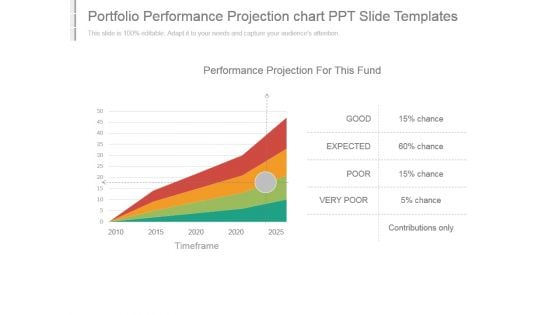
Portfolio Performance Projection Chart Ppt Slide Templates
This is a portfolio performance projection chart ppt slide templates. This is a four stage process. The stages in this process are performance projection for this fund, good, expected, poor, very poor, contributions only, timeframe.
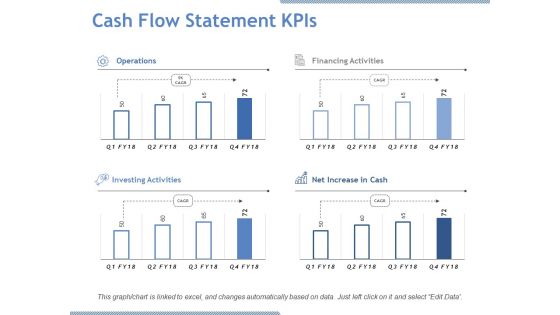
Cash Flow Statement Kpis Ppt PowerPoint Presentation Model Samples
This is a cash flow statement kpis ppt powerpoint presentation model samples. This is a four stage process. The stages in this process are operations, financing activities, investing activities, increase in cash.
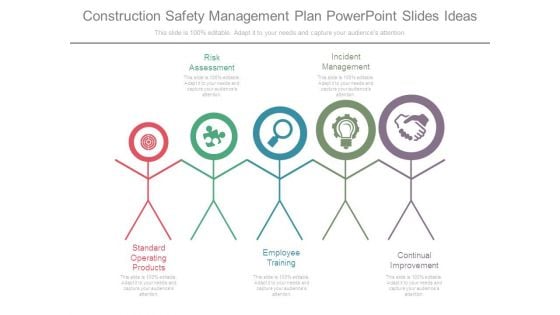
Construction Safety Management Plan Powerpoint Slides Ideas
This is a construction safety management plan powerpoint slides ideas. This is a five stage process. The stages in this process are risk assessment, incident management, standard operating products, employee training, continual improvement.
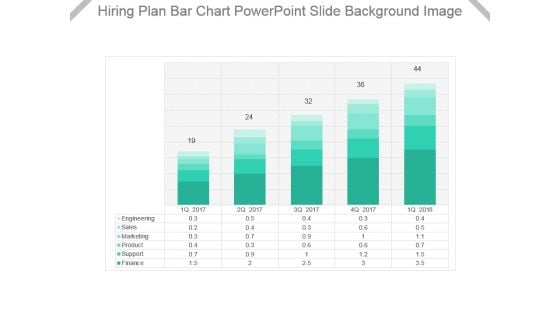
Hiring Plan Bar Chart Powerpoint Slide Background Image
This is a hiring plan bar chart powerpoint slide background image. This is a five stage process. The stages in this process are engineering, sales, marketing, product, support, finance.
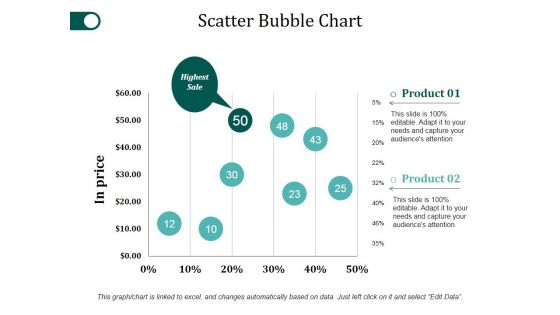
Scatter Bubble Chart Ppt PowerPoint Presentation Styles Objects
This is a scatter bubble chart ppt powerpoint presentation styles objects. This is a two stage process. The stages in this process are product, in price, highest sale, percentage, finance.
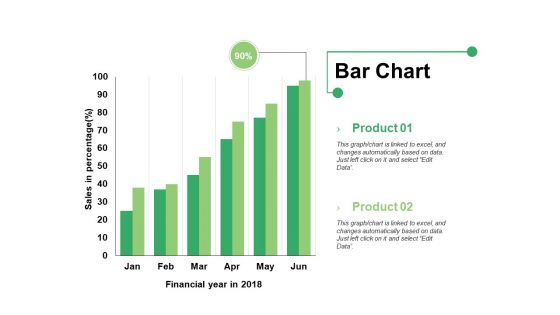
Bar Chart Ppt PowerPoint Presentation Infographics Format Ideas
This is a bar chart ppt powerpoint presentation infographics format ideas. This is a two stage process. The stages in this process are bar graph, product, financial year, sales in percentage.
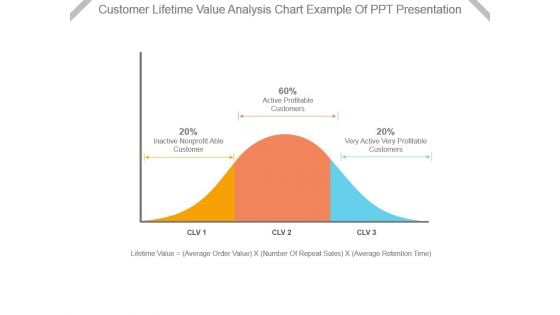
Customer Lifetime Value Analysis Chart Example Of Ppt Presentation
This is a customer lifetime value analysis chart example of ppt presentation. This is a three stage process. The stages in this process are inactive nonprofit able customer, active profitable customers, very active very profitable customers, lifetime value, average order value, number of repeat sales, average retention time.
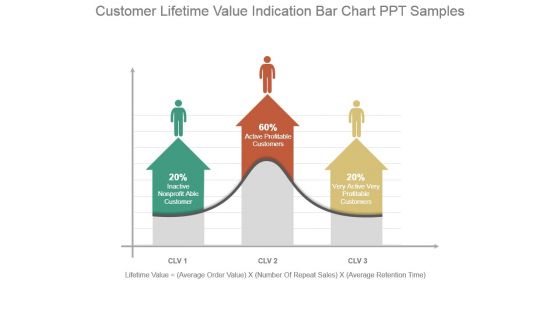
Customer Lifetime Value Indication Bar Chart Ppt Samples
This is a customer lifetime value indication bar chart ppt samples. This is a three stage process. The stages in this process are inactive nonprofit able customer, active profitable customers, very active very profitable customers, lifetime value, average order value, number of repeat sales, average retention time.
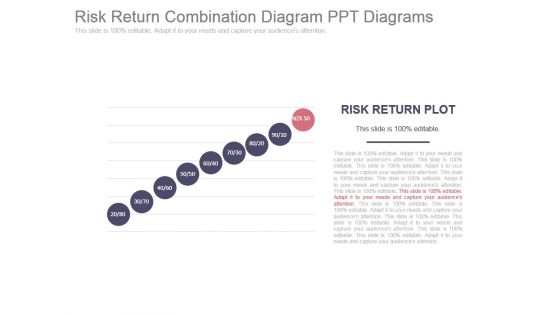
Risk Return Combination Diagram Ppt Diagrams
This is a risk return combination diagram ppt diagrams. This is a nine stage process. The stages in this process are risk return plot.
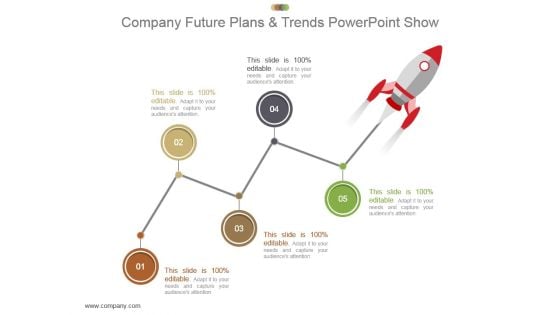
Company Future Plans And Trends Powerpoint Show
This is a company future plans and trends powerpoint show. This is a five stage process. The stages in this process are plan, rocket, company, trend, career.
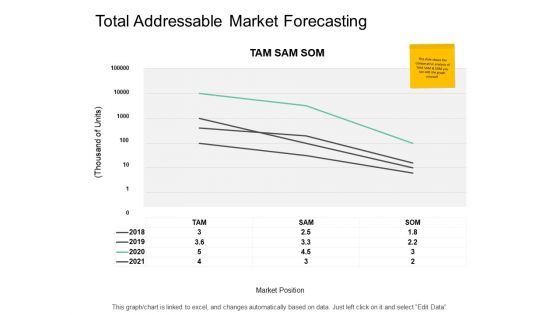
Total Addressable Market Forecasting Ppt PowerPoint Presentation Professional Deck
Presenting this set of slides with name total addressable market forecasting ppt powerpoint presentation professional deck. The topics discussed in these slides are marketing, business, management, planning, strategy. This is a completely editable PowerPoint presentation and is available for immediate download. Download now and impress your audience.
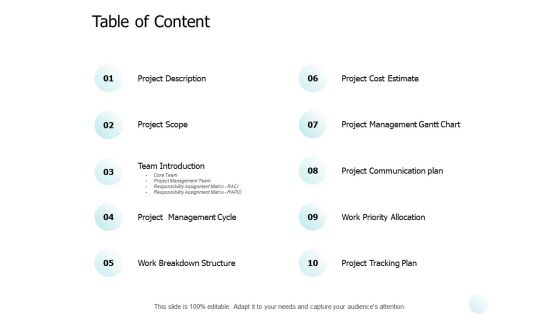
Table Of Content Ppt PowerPoint Presentation Show Pictures
Presenting this set of slides with name table of content ppt powerpoint presentation show pictures. The topics discussed in these slides are marketing, business, management, planning, strategy. This is a completely editable PowerPoint presentation and is available for immediate download. Download now and impress your audience.
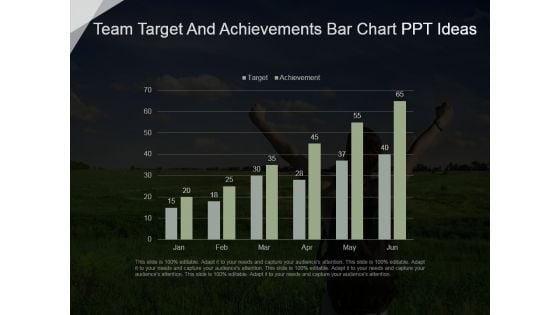
Team Target And Achievements Bar Chart Ppt Ideas
This is a team target and achievements bar chart ppt ideas. This is a six stage process. The stages in this process are business, marketing, graph chart, success, strategy.
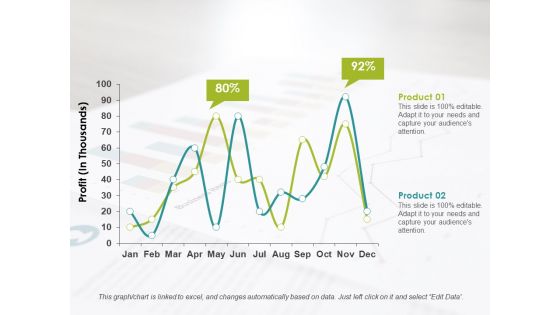
Line Chart Ppt PowerPoint Presentation Infographics Format Ideas
This is a line chart ppt powerpoint presentation infographics format ideas. This is a two stage process. The stages in this process are product, profit, business.
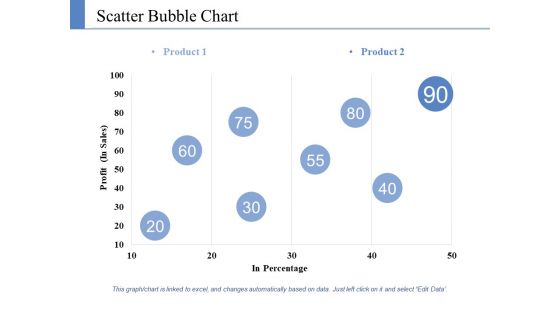
Scatter Bubble Chart Ppt PowerPoint Presentation Styles Information
This is a scatter bubble chart ppt powerpoint presentation styles information. This is a two stage process. The stages in this process are product, profit, in percentage.
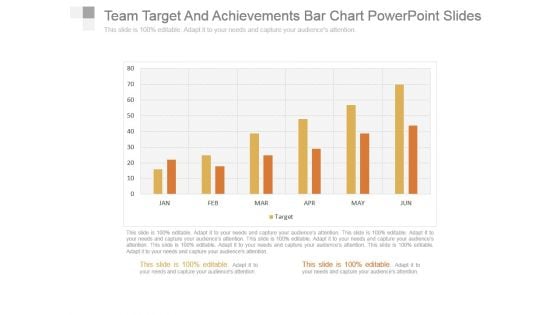
Team Target And Achievements Bar Chart Powerpoint Slides
This is a team target and achievements bar chart powerpoint slides. This is a six stage process. The stages in this process are business, success, graph chart, strategy, marketing.
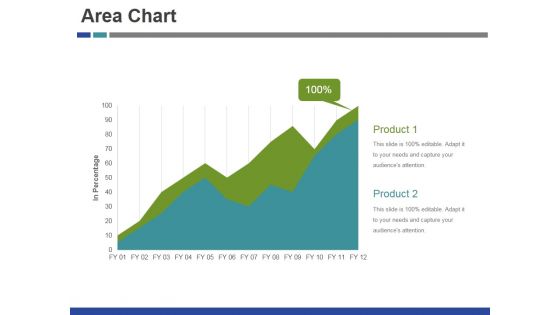
Area Chart Ppt PowerPoint Presentation Infographic Template Show
This is a area chart ppt powerpoint presentation infographic template show. This is a two stage process. The stages in this process are product, marketing, management, business, success.
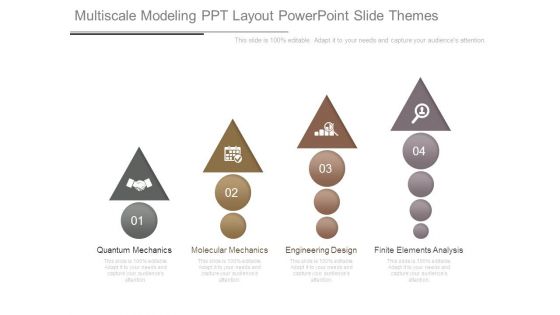
Multiscale Modeling Ppt Layout Powerpoint Slide Themes
This is a Multiscale Modeling Ppt Layout Powerpoint Slide Themes. This is a four stage process. The stages in this process are quantum mechanics, molecular mechanics, engineering design, finite elements analysis.
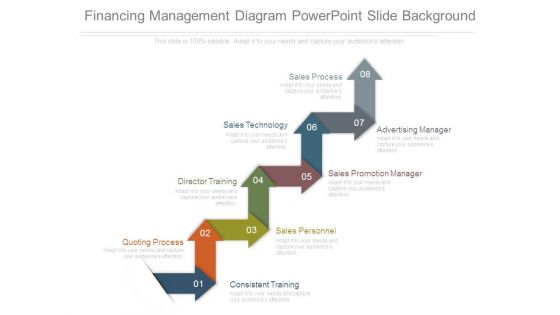
Financing Management Diagram Powerpoint Slide Background
This is a financing management diagram powerpoint slide background. This is a eight stage process. The stages in this process are sales process, sales technology, advertising manager, sales promotion manager, director training, sales personnel, consistent training, quoting process.
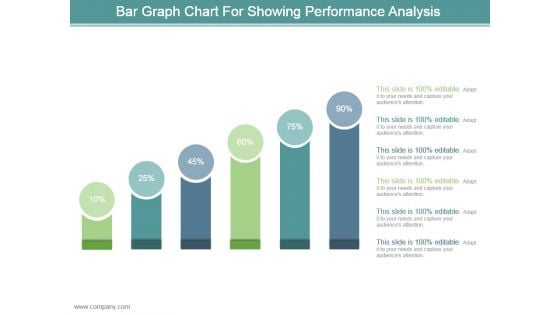
Bar Graph Chart For Showing Performance Analysis Ppt Design
This is a bar graph chart for showing performance analysis ppt design. This is a six stage process. The stages in this process are business, marketing, process, success, presentation.
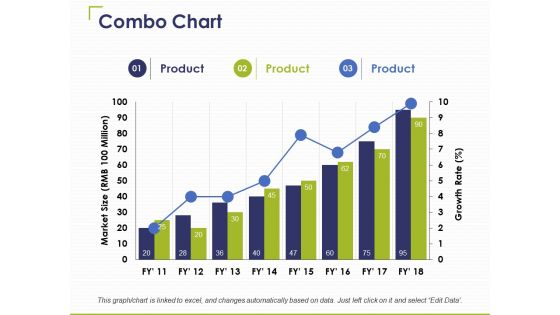
Combo Chart Ppt PowerPoint Presentation Infographics Graphics Pictures
This is a combo chart ppt powerpoint presentation infographics graphics pictures. This is a three stage process. The stages in this process are product, business, marketing, combo chart.
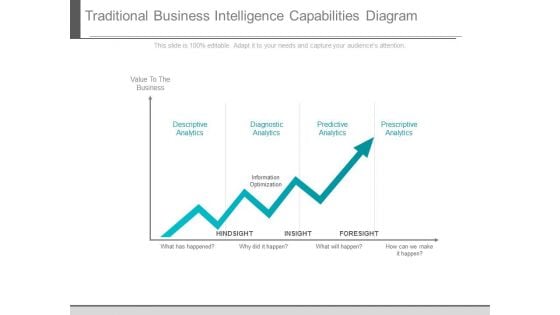
Traditional Business Intelligence Capabilities Diagram
This is a traditional business intelligence capabilities diagram. This is a one stage process. The stages in this process are descriptive analytics, diagnostic analytics, predictive analytics, prescriptive analytics, information optimization, value to the business, hindsight, insight, foresight.
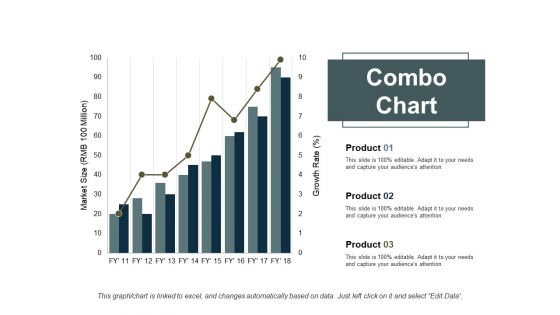
Combo Chart Finance Ppt PowerPoint Presentation Slides Backgrounds
This is a combo chart finance ppt powerpoint presentation slides backgrounds. This is a three stage process. The stages in this process are combo chart, finance, marketing, analysis, business.
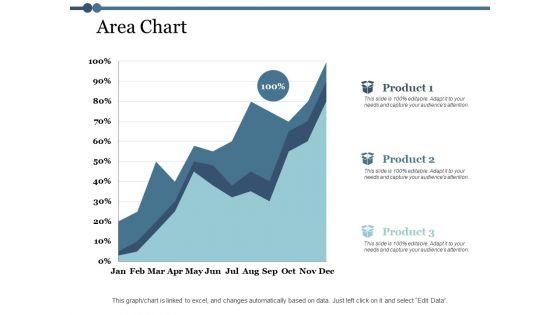
Area Chart Finance Ppt PowerPoint Presentation Outline Design Templates
This is a area chart finance ppt powerpoint presentation outline design templates. This is a three stage process. The stages in this process arefinance, marketing, management, investment, analysis.
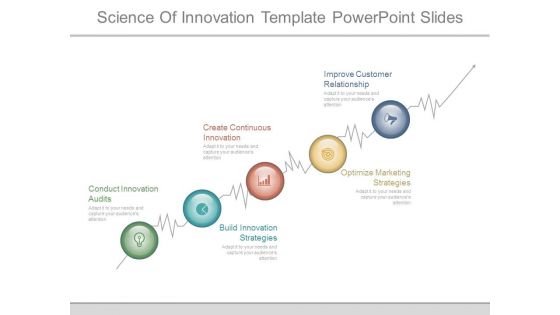
Science Of Innovation Template Powerpoint Slides
This is a science of innovation template powerpoint slides. This is a five stage process. The stages in this process are conduct innovation audits, create continuous innovation, improve customer relationship, build innovation strategies, optimize marketing strategies.
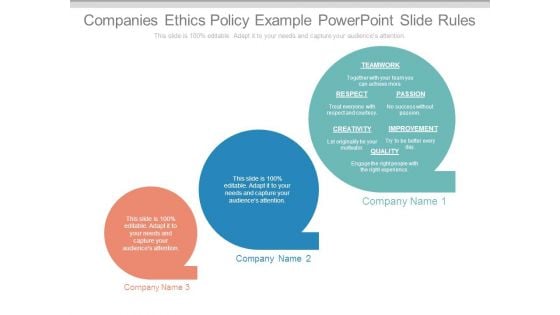
Companies Ethics Policy Example Powerpoint Slide Rules
This is a companies ethics policy example powerpoint slide rules. This is a three stage process. The stages in this process are teamwork, passion, respect, creativity, improvement, quality, company name.
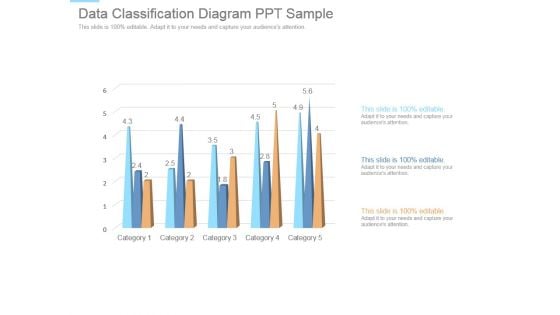
Data Classification Diagram Ppt Sample
This is a data classification diagram ppt sample. This is a five stage process. The stages in this process are category.
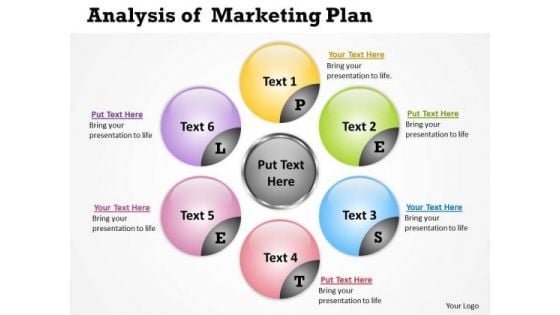
Strategic Management Analysis Of Marketing Plan Sales Diagram
Your Listeners Will Never Doodle. Our Strategic Management Analysis of Marketing Plan Sales Diagram Powerpoint Templates Will Hold Their Concentration.
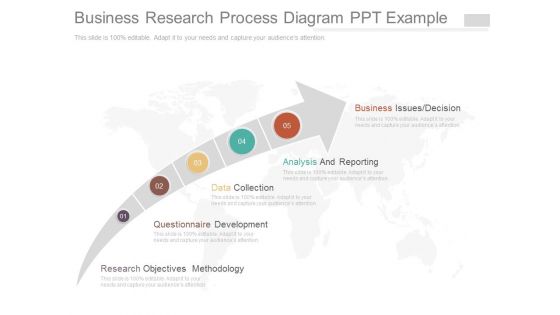
Business Research Process Diagram Ppt Example
This is a business research process diagram ppt example. This is a five stage process. The stages in this process are business issues decision, analysis and reporting, data collection, questionnaire development, research objectives methodology.
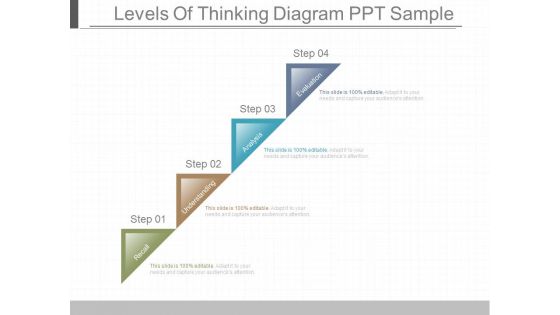
Levels Of Thinking Diagram Ppt Sample
This is a levels of thinking diagram ppt sample. This is a four stage process. The stages in this process are recall, understanding, analysis, evaluation.
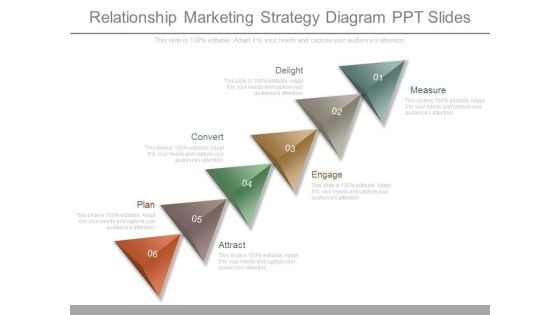
Relationship Marketing Strategy Diagram Ppt Slides
This is a relationship marketing strategy diagram ppt slides. This is a six stage process. The stages in this process are delight, convert, plan, attract, engage, measure.
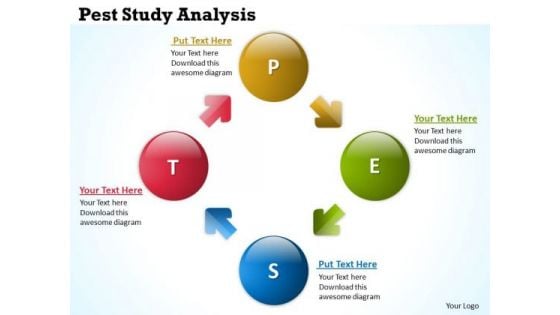
Strategic Management Pest Study Analysis Business Diagram
Our Strategic Management Pest Study Analysis Business Diagram Powerpoint Templates Heighten Concentration. Your Audience Will Be On The Edge.
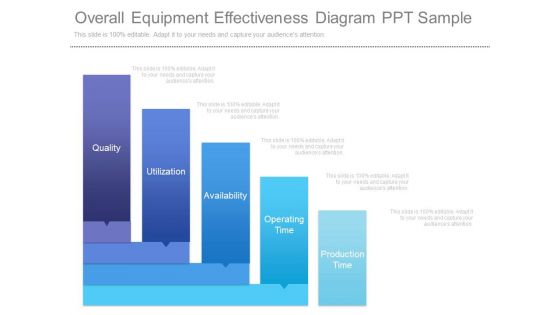
Overall Equipment Effectiveness Diagram Ppt Sample
This is a overall equipment effectiveness diagram ppt sample. This is a five stage process. The stages in this process are quality, utilization, availability, operating time, production time.
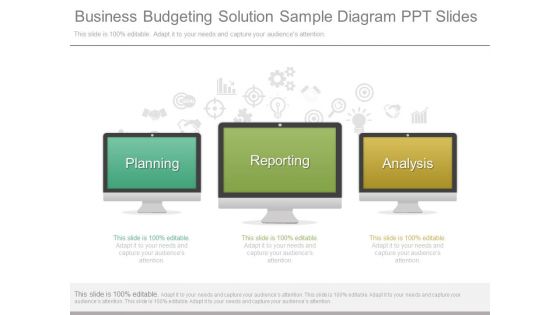
Business Budgeting Solution Sample Diagram Ppt Slides
This is a business budgeting solution sample diagram ppt slides. This is a three stage process. The stages in this process are planning, reporting, analysis.
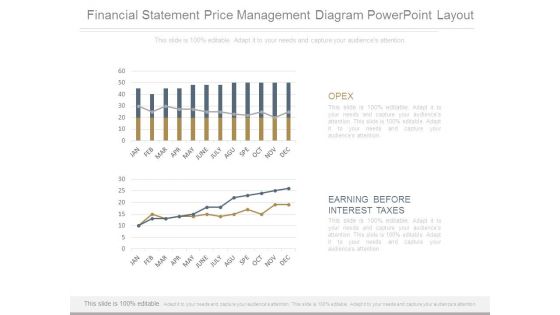
Financial Statement Price Management Diagram Powerpoint Layout
This is a financial statement price management diagram powerpoint layout. This is a two stage process. The stages in this process are opex, earning before interest taxes.
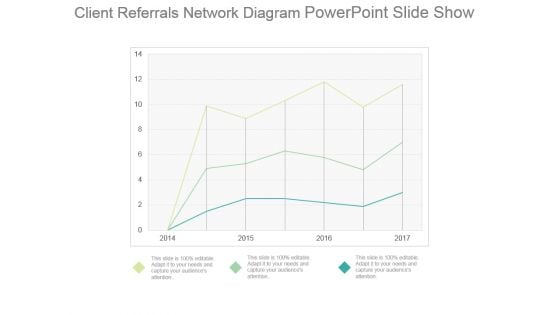
Client Referrals Network Diagram Powerpoint Slide Show
This is a client referrals network diagram powerpoint slide show. This is a three stage process. The stages in this process are business, marketing, strategy, management, analysis.
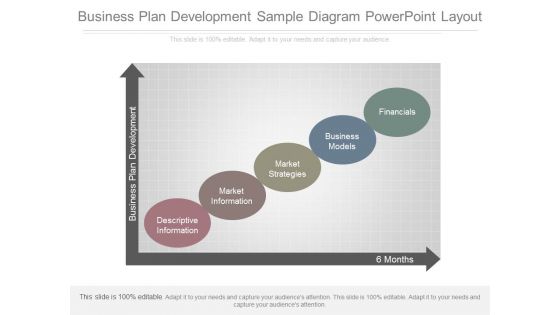
Business Plan Development Sample Diagram Powerpoint Layout
This is a business plan development sample diagram powerpoint layout. This is a five stage process. The stages in this process are business plan development, descriptive information, market information, market strategies, business models, financials.
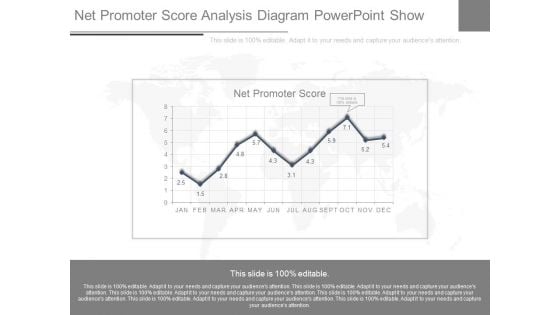
Net Promoter Score Analysis Diagram Powerpoint Show
This is a net promoter score analysis diagram powerpoint show. This is a twelve stage process. The stages in this process are net promoter score, jan, feb, mar, apr, may, jun, jul, aug, sep, oct, nov, dec.
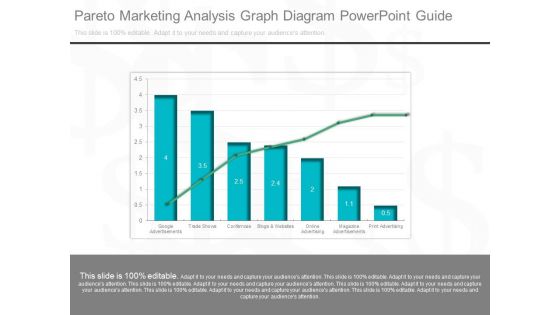
Pareto Marketing Analysis Graph Diagram Powerpoint Guide
This is a pareto marketing analysis graph diagram powerpoint guide. This is a seven stage process. The stages in this process are google advertisements, trade shows, conferences, blog and websites, online advertising, magazine advertisements, print advertising.

 Home
Home