Growth Icon
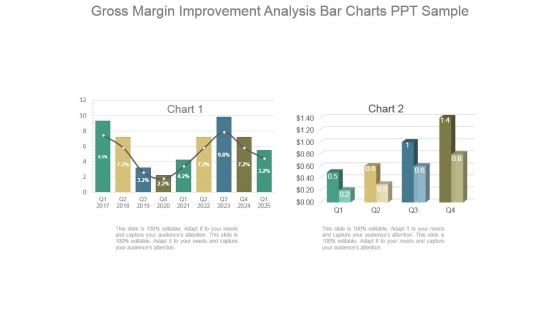
Gross Margin Improvement Analysis Bar Charts Ppt Sample
This is a gross margin improvement analysis bar charts ppt sample. This is a two stage process. The stages in this process are chart.
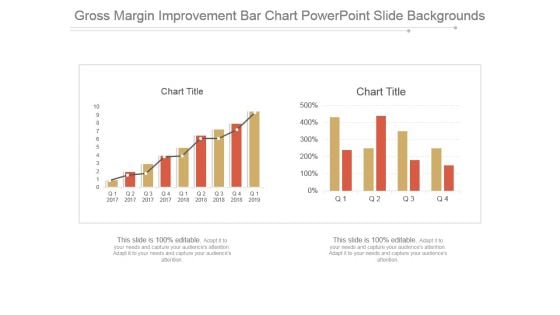
Gross Margin Improvement Bar Chart Powerpoint Slide Backgrounds
This is a gross margin improvement bar chart powerpoint slide backgrounds. This is a two stage process. The stages in this process are chart title.

Business Growth2011 Concept Globe PowerPoint Templates And PowerPoint Backgrounds 0211
Microsoft PowerPoint Template and Background with chart of the global gains in 2011 North America in the background Tackle the issue in it's entirety. Put up the overall picture with our Business Growth2011 Concept Globe PowerPoint Templates And PowerPoint Backgrounds 0211.
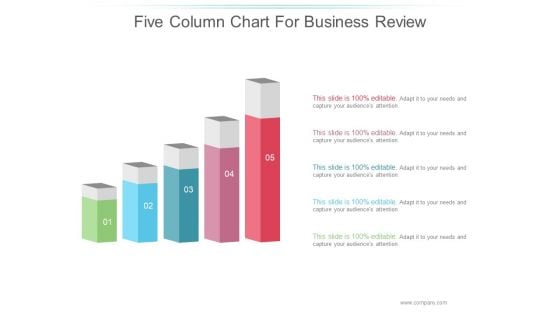
Five Column Chart For Business Review Ppt PowerPoint Presentation Diagrams
This is a five column chart for business review ppt powerpoint presentation diagrams. This is a five stage process. The stages in this process are business, marketing, bulb, icon, management.
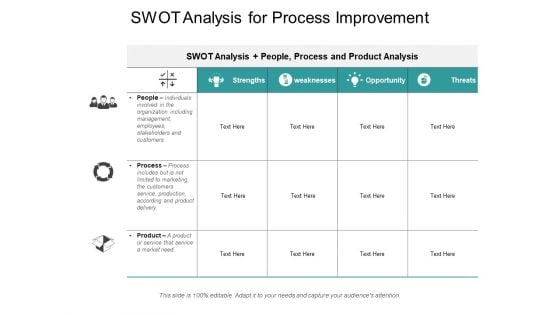
Swot Analysis For Process Improvement Ppt PowerPoint Presentation Show Graphics
This is a swot analysis for process improvement ppt powerpoint presentation show graphics. This is a three stage process. The stages in this process are business growth, people process product, 3ps.

Business Improvement Process Plan Develop Integrate And Evaluate Ppt PowerPoint Presentation Outline Demonstration
Presenting this set of slides with name business improvement process plan develop integrate and evaluate ppt powerpoint presentation outline demonstration. This is a six stage process. The stages in this process are growth, improvement, enhancement. This is a completely editable PowerPoint presentation and is available for immediate download. Download now and impress your audience.
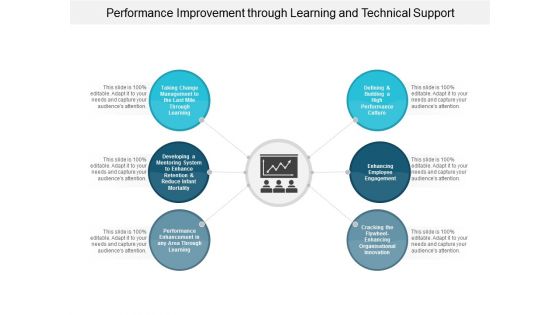
Performance Improvement Through Learning And Technical Support Ppt PowerPoint Presentation Pictures
Presenting this set of slides with name performance improvement through learning and technical support ppt powerpoint presentation pictures. This is a six stage process. The stages in this process are growth, improvement, enhancement. This is a completely editable PowerPoint presentation and is available for immediate download. Download now and impress your audience.
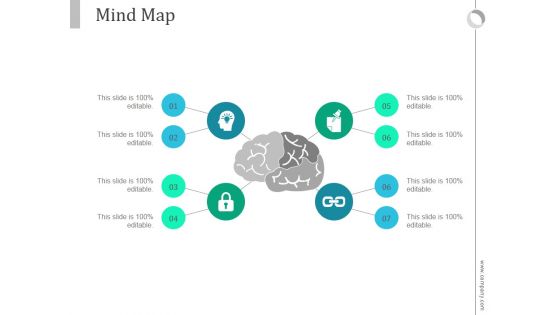
Mind Map Ppt PowerPoint Presentation Influencers
This is a mind map ppt powerpoint presentation influencers. This is a eight stage process. The stages in this process are business, marketing, management, skill, mind map.
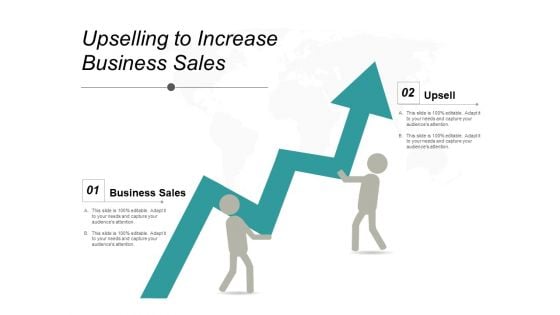
Upselling To Increase Business Sales Ppt PowerPoint Presentation Professional Slideshow
This is a upselling to increase business sales ppt powerpoint presentation professional slideshow. This is a two stage process. The stages in this process are sales, selling, upselling.
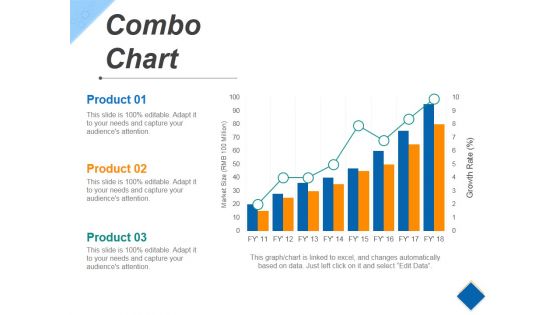
Combo Chart Ppt PowerPoint Presentation Diagram Images
This is a combo chart ppt powerpoint presentation diagram images. This is a eight stage process. The stages in this process are growth, success, business, marketing, product.
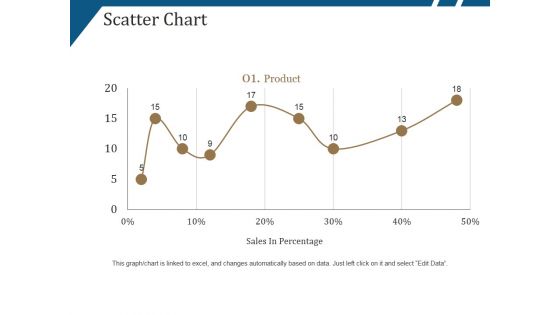
Scatter Chart Ppt PowerPoint Presentation Summary Deck
This is a scatter chart ppt powerpoint presentation summary deck. This is a nine stage process. The stages in this process are product, sales in percentage, growth, success.
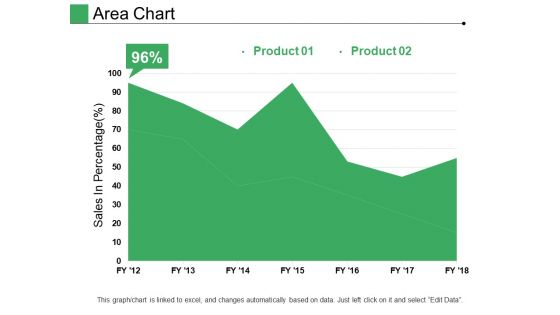
Area Chart Ppt PowerPoint Presentation Pictures Designs
This is a area chart ppt powerpoint presentation pictures designs. This is a two stage process. The stages in this process are product, sales in percentage, growth, success.
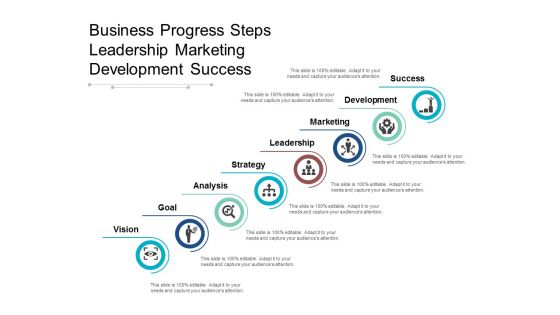
Business Progress Steps Leadership Marketing Development Success Ppt PowerPoint Presentation Styles Picture
Presenting this set of slides with name business progress steps leadership marketing development success ppt powerpoint presentation styles picture. This is a eight stage process. The stages in this process are growth, improvement, enhancement. This is a completely editable PowerPoint presentation and is available for immediate download. Download now and impress your audience.

Career Path Development Ppt Powerpoint Presentation Infographic Template Tips
This is a career path development ppt powerpoint presentation infographic template tips. This is a three stage process. The stages in this process are increase, improvement, enhancement.

Career Progress Discover Research Network And Transition Ppt PowerPoint Presentation Ideas Graphic Images
Presenting this set of slides with name career progress discover research network and transition ppt powerpoint presentation ideas graphic images. This is a six stage process. The stages in this process are growth, improvement, enhancement. This is a completely editable PowerPoint presentation and is available for immediate download. Download now and impress your audience.
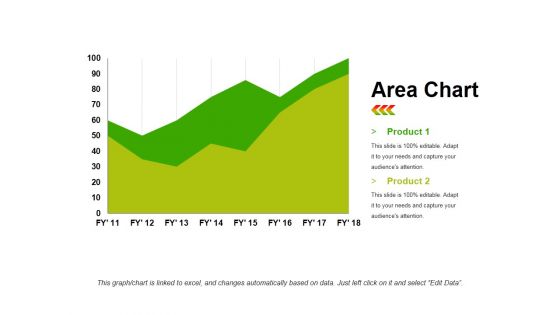
Area Chart Ppt PowerPoint Presentation Layouts Structure
This is a area chart ppt powerpoint presentation layouts structure. This is a two stage process. The stages in this process are area chart, product, business, growth, success.
Bubble Chart Ppt PowerPoint Presentation File Professional
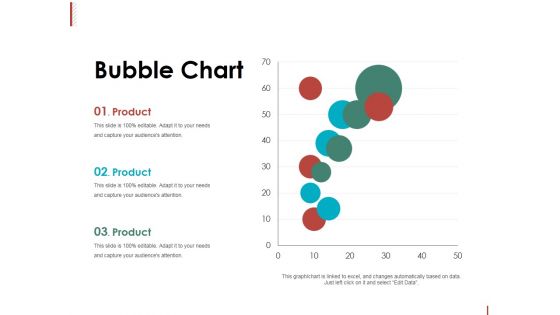
This is a bubble chart ppt powerpoint presentation file professional. This is a three stage process. The stages in this process are product, bubble chart, growth, business, success.
Line Chart Ppt PowerPoint Presentation Model Pictures
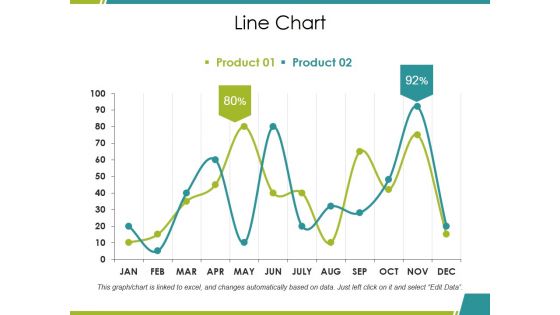
This is a line chart ppt powerpoint presentation model pictures. This is a two stage process. The stages in this process are product, percentage, growth, line chart, business.
Bubble Chart Ppt PowerPoint Presentation Pictures Good
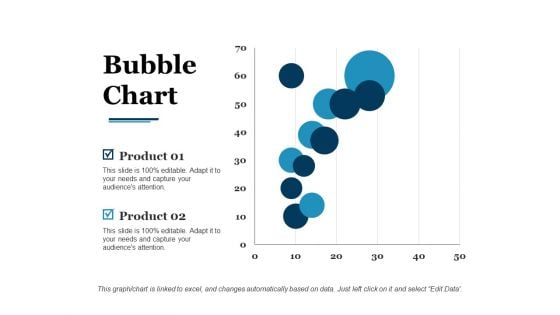
This is a bubble chart ppt powerpoint presentation pictures good. This is a two stage process. The stages in this process are product, bubble chart, growth.
Scatter Chart Ppt PowerPoint Presentation Summary Inspiration
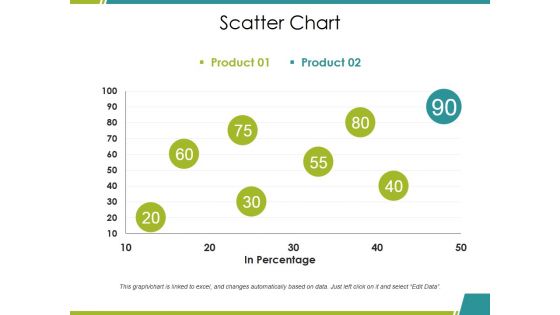
This is a scatter chart ppt powerpoint presentation summary inspiration. This is a two stage process. The stages in this process are product, in percentage, growth, success, business.

Bubble Chart Ppt PowerPoint Presentation Infographics Images
This is a bubble chart ppt powerpoint presentation infographics images. This is a two stage process. The stages in this process are product, bubble chart, business, growth, success.
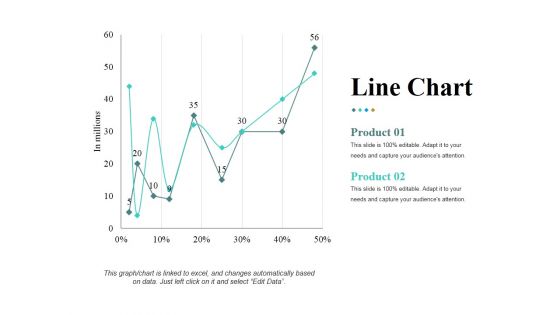
Line Chart Ppt PowerPoint Presentation Pictures Ideas
This is a line chart ppt powerpoint presentation pictures ideas. This is a two stage process. The stages in this process are in millions, percentage, finance, product, growth.
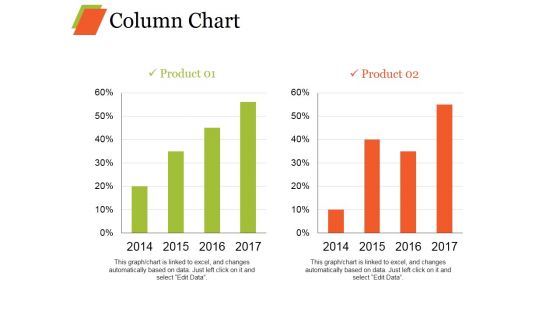
Column Chart Ppt PowerPoint Presentation Infographics Model
This is a column chart ppt powerpoint presentation infographics model. This is a two stage process. The stages in this process are bar graph, growth, product, percentage, year.
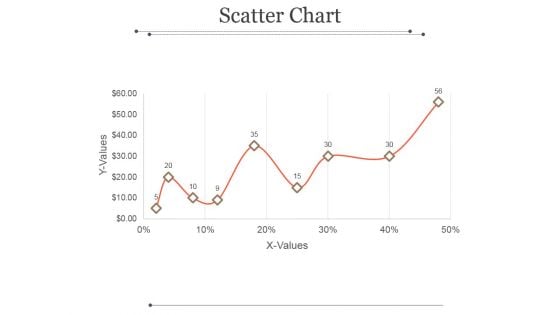
Scatter Chart Ppt PowerPoint Presentation Example
This is a scatter chart ppt powerpoint presentation example. This is a nine stage process. The stages in this process are x values, y values, business, growth, success.
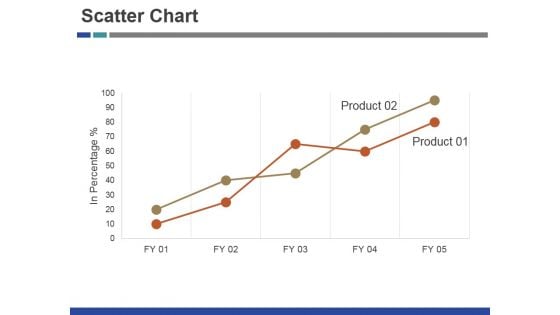
Scatter Chart Ppt PowerPoint Presentation Inspiration Brochure
This is a scatter chart ppt powerpoint presentation inspiration brochure. This is a two stage process. The stages in this process are product, growth, success, business.
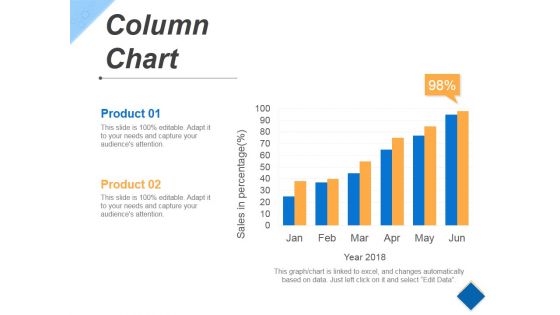
Column Chart Ppt PowerPoint Presentation Styles Vector
This is a column chart ppt powerpoint presentation styles vector. This is a six stage process. The stages in this process are growth, success, business, marketing, product.
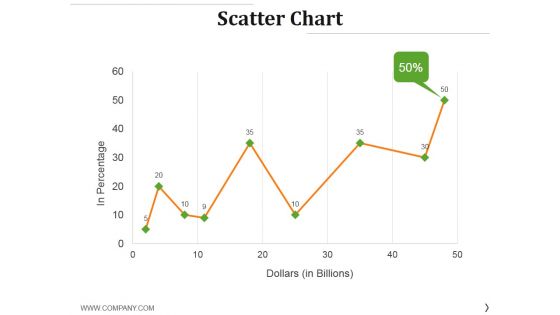
Scatter Chart Ppt PowerPoint Presentation Layouts Gridlines
This is a scatter chart ppt powerpoint presentation layouts gridlines. This is a nine stage process. The stages in this process are in percentage, dollars, growth, success, finance.

Line Chart Ppt PowerPoint Presentation Pictures Maker
This is a line chart ppt powerpoint presentation pictures maker. This is a two stage process. The stages in this process are financial years, product, growth, success.
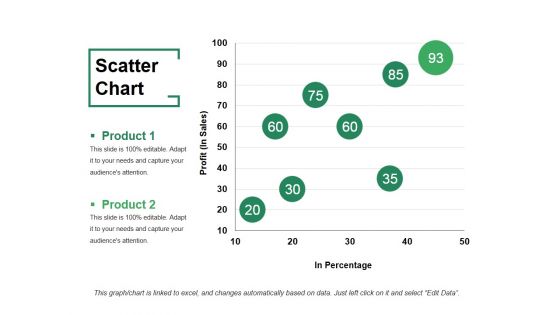
Scatter Chart Ppt PowerPoint Presentation File Visuals
This is a scatter chart ppt powerpoint presentation file visuals. This is a two stage process. The stages in this process are product, profit, in percentage, growth, success.
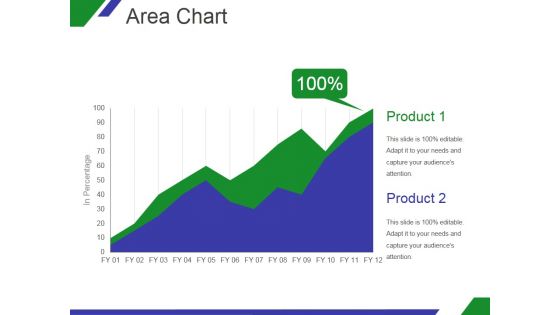
Area Chart Ppt PowerPoint Presentation Designs
This is a area chart ppt powerpoint presentation designs. This is a two stage process. The stages in this process are product, graph, in percentage, growth, business.
Line Chart Ppt PowerPoint Presentation Ideas Deck
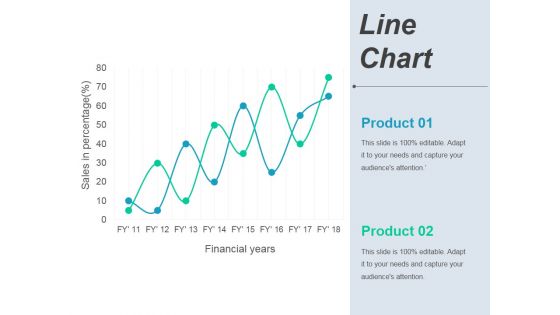
This is a line chart ppt powerpoint presentation ideas deck. This is a two stage process. The stages in this process are business, marketing, finance, growth.
Business Strategy Concepts Three Increasing Steps Strategic Planning Ppt Slide
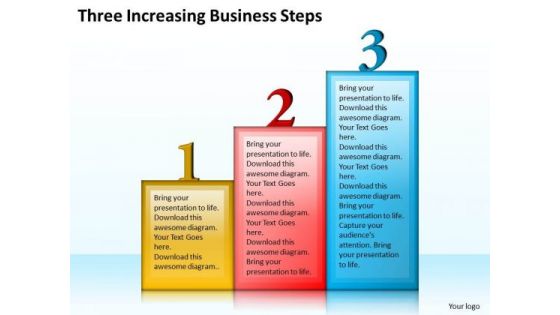
Our Timeline Ppt Template Three Increasing Business Steps help in a duel of wits. They get your ideas to come out on top. Our Business PowerPoint Templates play a dual role. They aid and abet you in your endeavour. Win any duel with our Finance PowerPoint Templates. Your thoughts will be faster on the draw.
Line Chart Ppt PowerPoint Presentation Pictures Example Introduction
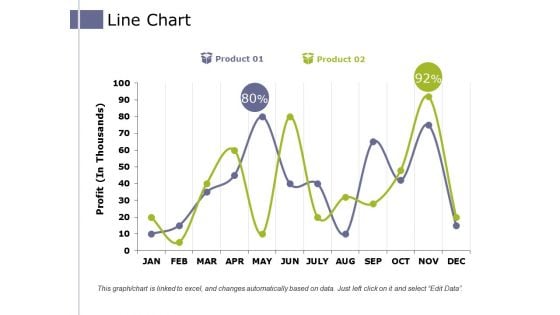
This is a line chart ppt powerpoint presentation pictures example introduction. This is a two stage process. The stages in this process are product, profit, business, growth, success.

Scatter Chart Ppt PowerPoint Presentation Infographic Template Objects
This is a scatter chart ppt powerpoint presentation infographic template objects. This is a nine stage process. The stages in this process are product, growth, success, graph.

Scatter Chart Ppt PowerPoint Presentation Portfolio Design Inspiration
This is a scatter chart ppt powerpoint presentation portfolio design inspiration. This is a twelve stage process. The stages in this process are graph, growth, success, business.
Column Chart Ppt PowerPoint Presentation Portfolio Graphics Template
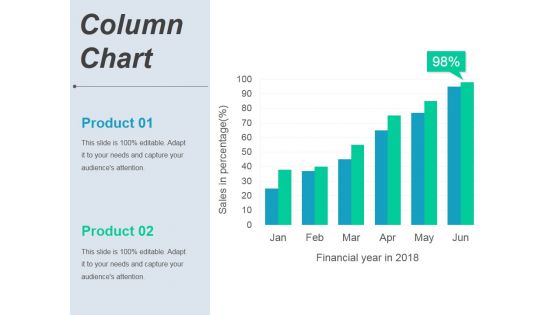
This is a column chart ppt powerpoint presentation portfolio graphics template. This is a six stage process. The stages in this process are product, finance, growth, success, business.

Combo Chart Ppt PowerPoint Presentation Professional Graphics Example
This is a combo chart ppt powerpoint presentation professional graphics example. This is a eight stage process. The stages in this process are product, finance, growth, success, business.
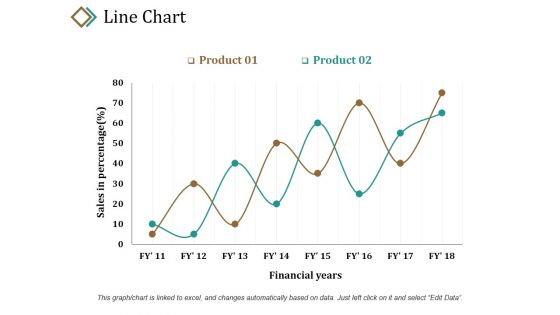
Line Chart Ppt PowerPoint Presentation Layouts Example
This is a line chart ppt powerpoint presentation layouts example. This is a two stage process. The stages in this process are sales in percentage, product, financial years, growth, success.

Line Chart Ppt PowerPoint Presentation Show Guide
This is a line chart ppt powerpoint presentation show guide. This is a two stage process. The stages in this process are product, sales in percentage, financial years, growth, success.
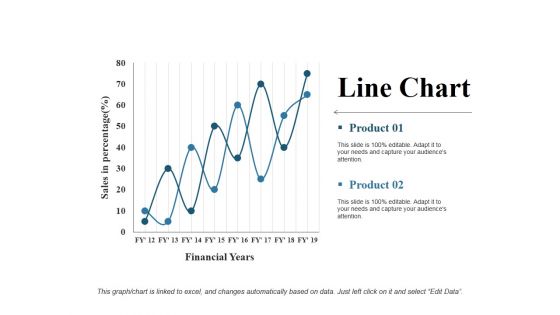
Line Chart Ppt PowerPoint Presentation Gallery Rules
This is a line chart ppt powerpoint presentation gallery rules. This is a two stage process. The stages in this process are financial years, product, sales in percentage, line chart, growth.
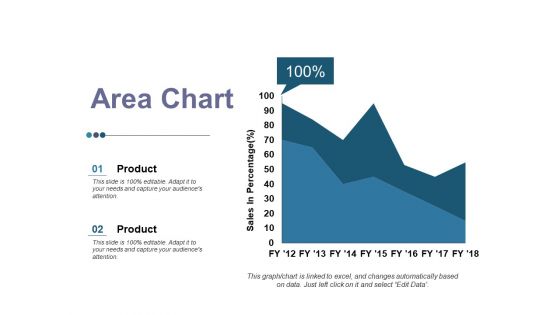
Area Chart Ppt PowerPoint Presentation Inspiration Graphics
This is a area chart ppt powerpoint presentation inspiration graphics. This is a two stage process. The stages in this process are product, area chart, business, growth, sales in percentage.
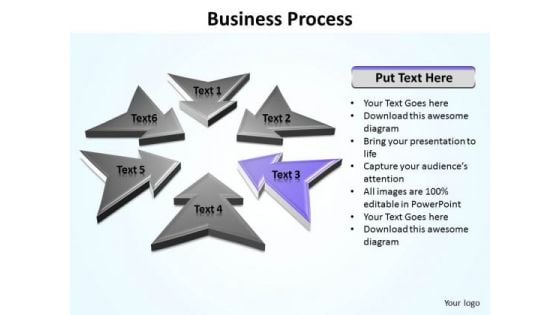
Ppt Direction Arrows Of Layout Editable PowerPoint World Map Templates
PPT direction arrows of layout editable powerpoint world map Templates-The above template contains a graphic of arrows pointing towards the center. Clarity of thought has been the key to your growth. Use our templates to illustrate your ability.-PPT direction arrows of layout editable powerpoint world map Templates-Abstract, Achievement, Aim, Arrow, Background, Business, Chart, Communication, Competition, Concept, Design, Direction, Development, Diagram, Direction, Finance, Financial, Forecast, Forward, Goal, Graph, Graphic, Growth, Icon, Illustration, Increase, Investment, Leader, Leadership, Design, Marketing, Price, Process, Profit, Progress, Progress, Shape, Sign, Success, Symbol, Target, Team, Teamwork Augment your assets with our Ppt Direction Arrows Of Layout Editable PowerPoint World Map Templates. They have many desirable attributes.
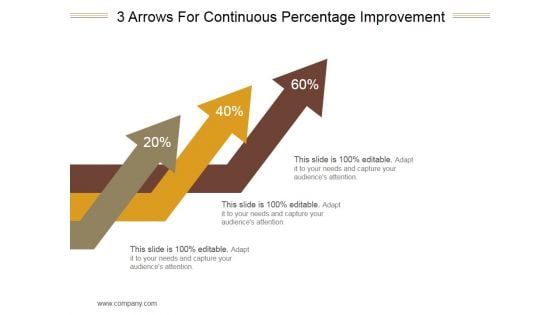
3 Arrows For Continuous Percentage Improvement Ppt PowerPoint Presentation Images
This is a 3 arrows for continuous percentage improvement ppt powerpoint presentation images. This is a three stage process. The stages in this process are arrows, marketing, strategy, management, business.
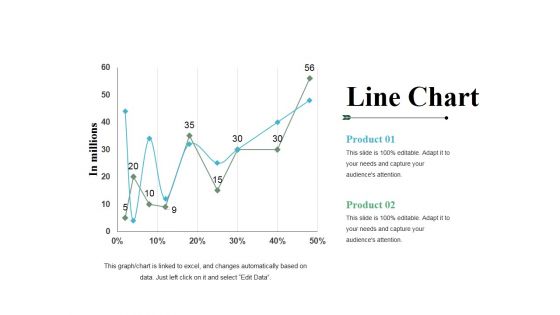
Line Chart Ppt PowerPoint Presentation File Templates
This is a line chart ppt powerpoint presentation file templates. This is a two stage process. The stages in this process are product, line chart, growth, percentage, in millions.
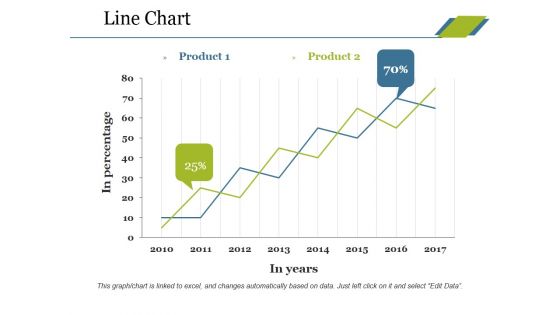
Line Chart Ppt PowerPoint Presentation Professional Tips
This is a line chart ppt powerpoint presentation professional tips. This is a two stage process. The stages in this process are product, in percentage, in years, growth, success.
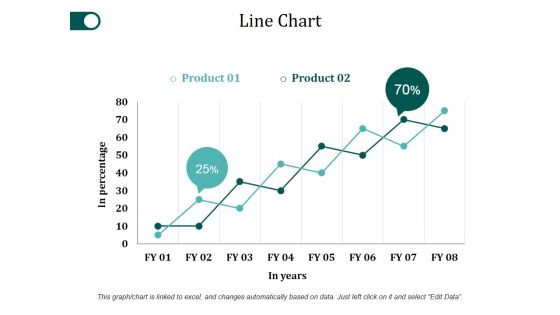
Line Chart Ppt PowerPoint Presentation Slides Ideas
This is a line chart ppt powerpoint presentation slides ideas. This is a two stage process. The stages in this process are product, in percentage, in years, growth, success.
Line Chart Ppt PowerPoint Presentation Infographics Example
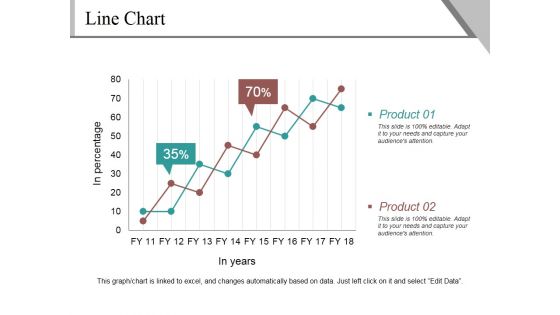
This is a line chart ppt powerpoint presentation infographics example. This is a two stage process. The stages in this process are product, in percentage, in years, finance, growth.
Investment Performance Measurement Diagram Powerpoint Layout
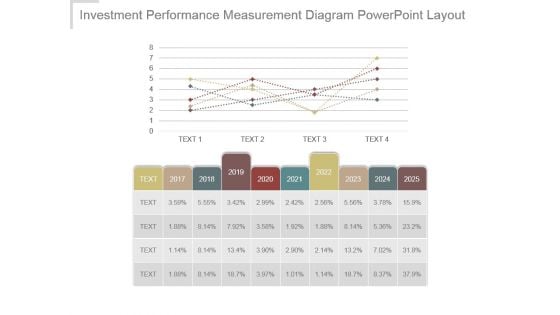
This is a investment performance measurement diagram powerpoint layout. This is a five stage process. The stages in this process are bar graph, growth, success, business, marketing.
Scatter Bubble Chart Ppt PowerPoint Presentation Summary Clipart
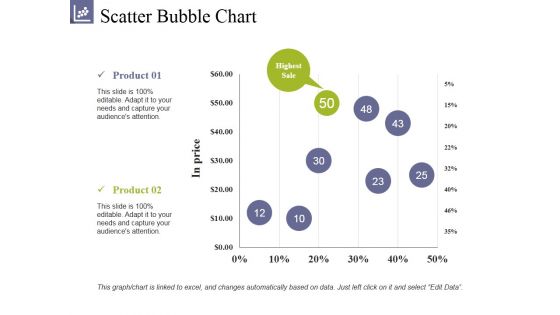
This is a scatter bubble chart ppt powerpoint presentation summary clipart. This is a two stage process. The stages in this process are product, highest sale, in prices, growth, success.
Column Chart Ppt PowerPoint Presentation Gallery Slide Portrait
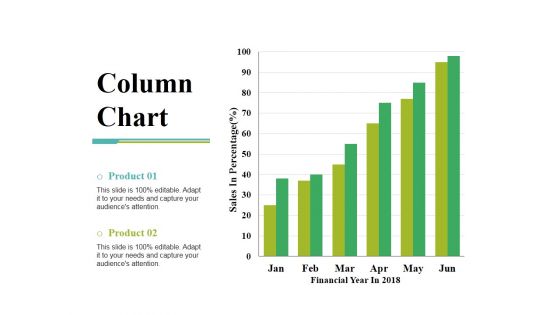
This is a column chart ppt powerpoint presentation gallery slide portrait. This is a two stage process. The stages in this process are sales in percentage, financial year, product, bar graph, growth.
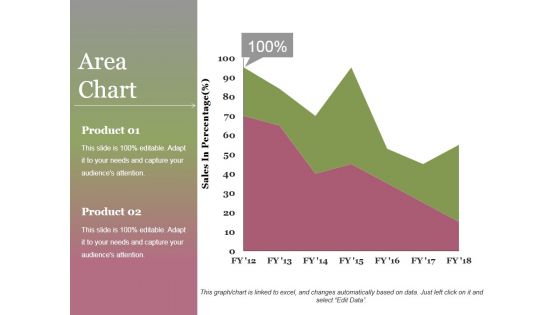
Area Chart Ppt PowerPoint Presentation Infographics File Formats
This is a area chart ppt powerpoint presentation infographics file formats. This is a two stage process. The stages in this process are area chart, product, sales in percentage, growth, success.
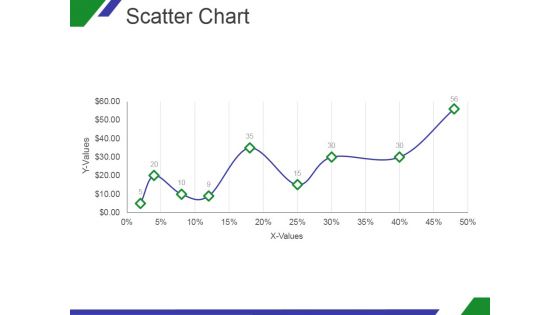
Scatter Chart Ppt PowerPoint Presentation Designs Download
This is a scatter chart ppt powerpoint presentation designs download. This is a nine stage process. The stages in this process are x values, y values, graph, growth, success.

Scatter Chart Ppt PowerPoint Presentation Model Template
This is a scatter chart ppt powerpoint presentation model template. This is a nine stage process. The stages in this process are x values, y values, graph, growth, success.
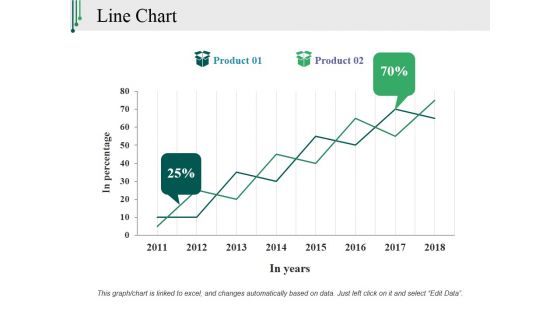
Line Chart Ppt PowerPoint Presentation Slides Mockup
This is a line chart ppt powerpoint presentation slides mockup. This is a two stage process. The stages in this process are in percentage, in years, product, growth, success.
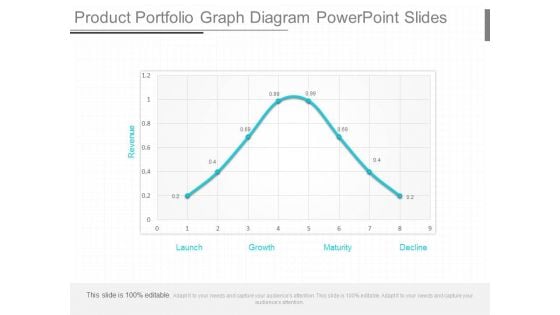
Product Portfolio Graph Diagram Powerpoint Slides
This is a product portfolio graph diagram powerpoint slides. This is a eight stage process. The stages in this process are revenue, launch, growth, maturity, decline.

Curve Chart For Product Life Cycle Presentation Outline
This is a curve chart for product life cycle presentation outline. This is a five stage process. The stages in this process are sales over time, product extension, introduction, growth, maturity, decline, time.
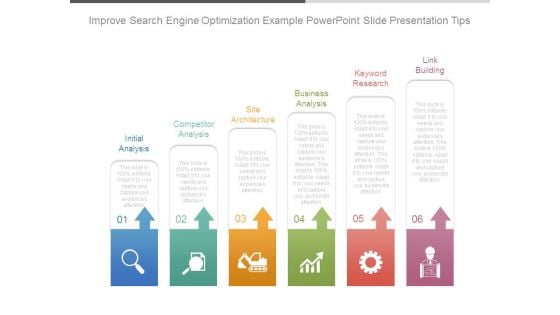
Improve Search Engine Optimization Example Powerpoint Slide Presentation Tips
This is a improve search engine optimization example powerpoint slide presentation tips. This is a six stage process. The stages in this process are initial analysis, competitor analysis, site architecture, business analysis, keyword research, link building.
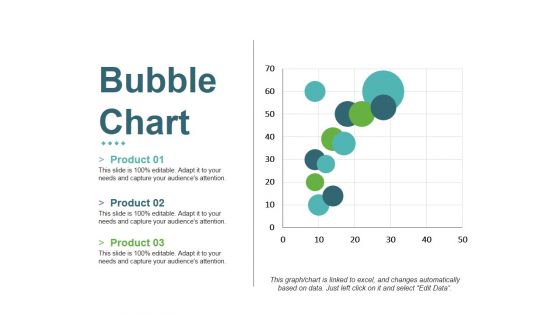
Bubble Chart Ppt PowerPoint Presentation Inspiration Graphics Download
This is a bubble chart ppt powerpoint presentation inspiration graphics download. This is a three stage process. The stages in this process are product, growth, success, bubble chart, business.
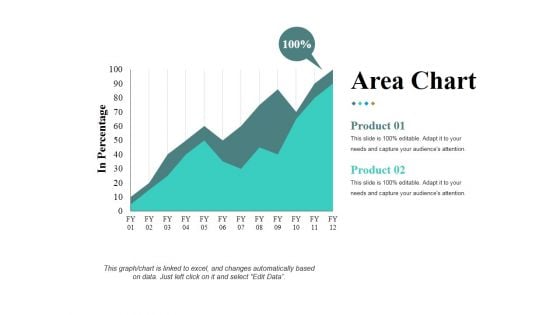
Area Chart Ppt PowerPoint Presentation Infographic Template Samples
This is a area chart ppt powerpoint presentation infographic template samples. This is a two stage process. The stages in this process are in percentage product, business, marketing, growth.
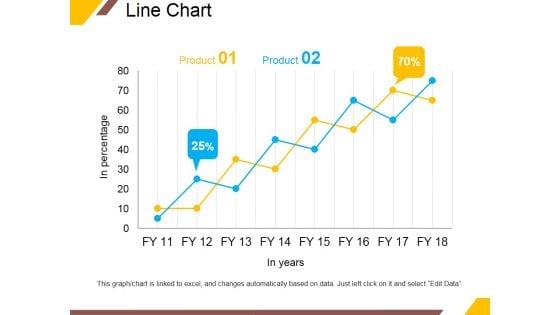
Line Chart Ppt PowerPoint Presentation Portfolio Infographic Template
This is a line chart ppt powerpoint presentation portfolio infographic template. This is a two stage process. The stages in this process are product, in years, business, percentage, growth.
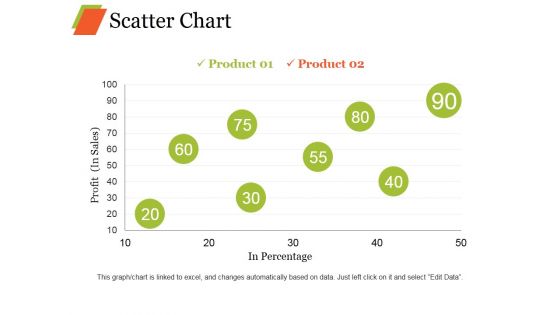
Scatter Chart Ppt PowerPoint Presentation Professional Graphic Images
This is a scatter chart ppt powerpoint presentation professional graphic images. This is a eight stage process. The stages in this process are product, profit, in percentage growth, business.
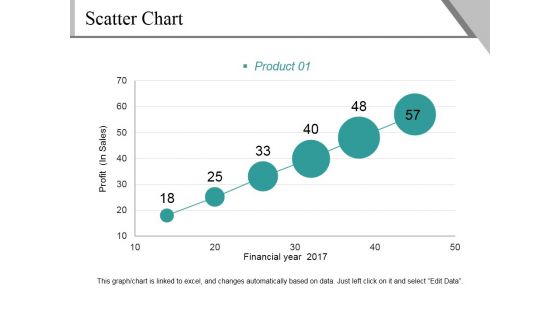
Scatter Chart Ppt PowerPoint Presentation File Background Image
This is a scatter chart ppt powerpoint presentation file background image. This is a six stage process. The stages in this process are profit, financial year, product, growth, success.
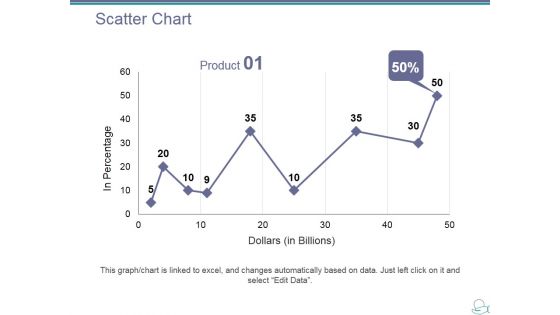
Scatter Chart Ppt PowerPoint Presentation Ideas Designs Download
This is a scatter chart ppt powerpoint presentation ideas designs download. This is a one stage process. The stages in this process are product, dollar, in percentage, growth, success.
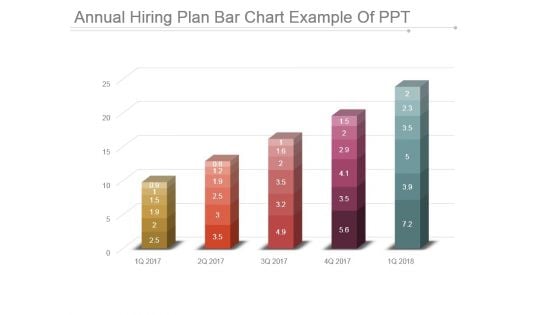
Annual Hiring Plan Bar Chart Example Of Ppt
This is a annual hiring plan bar chart example of ppt. This is a five stage process. The stages in this process are bar graph, business, marketing, growth, success.
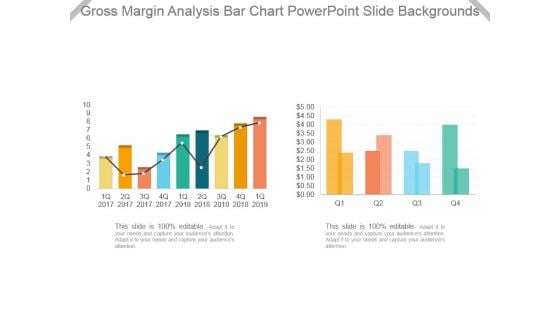
Gross Margin Analysis Bar Chart Powerpoint Slide Backgrounds
This is a gross margin analysis bar chart powerpoint slide backgrounds. This is a two stage process. The stages in this process are bar graph, business, marketing, growth, success.
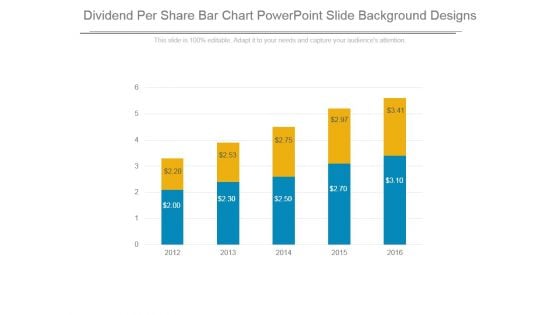
Dividend Per Share Bar Chart Powerpoint Slide Background Designs
This is a dividend per share bar chart powerpoint slide background designs. This is a five stage process. The stages in this process are business, marketing, success, growth, bar graph.
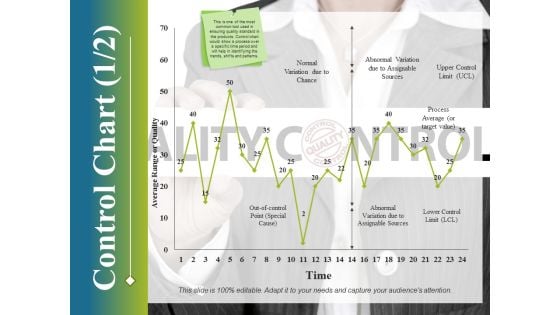
Control Chart Template 1 Ppt PowerPoint Presentation Infographic Template Deck
This is a control chart template 1 ppt powerpoint presentation infographic template deck. This is a one stage process. The stages in this process are control chart, growth, finance, marketing, strategy, business.

Xbar And R Chart Ppt PowerPoint Presentation Inspiration Styles
This is a xbar and r chart ppt powerpoint presentation inspiration styles. This is a two stage process. The stages in this process are subtitle, lcl, ucl, growth, graph.
Ppt Components Of Circular PowerPoint Menu Template Process Chart Templates
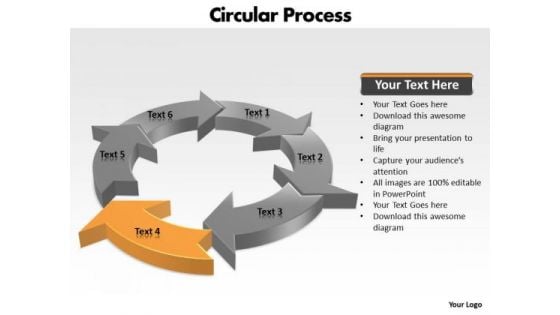
PPT components of circular powerpoint menu template process chart Templates-This circular flow diagram can helps to illustrate the economic exchange that takes place in the building of wealth. Clarity of thought has been the key to your growth. Use our template to illustrate your ability.-PPT components of circular powerpoint menu template process chart Templates-Arrow, Chart, Circular, Color, Colorful, Connect, Connection, Design, Diagram, Finance, Graphic, Group, Growth, Icon, Illustration, Marketing, Pieces, Process, Recycle, Recycling, Round, Set, Strategy, Symbol, Wheel Consult experts with our Ppt Components Of Circular PowerPoint Menu Template Process Chart Templates. Download without worries with our money back guaranteee.
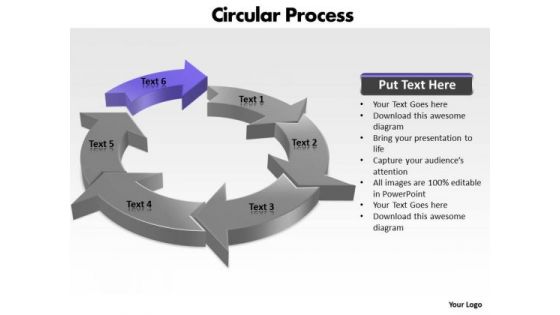
Ppt Components Of Circular Process PowerPoint Design Download 2010 Templates
PPT components of circular process powerpoint design download 2010 Templates-Use the circular flow diagram as a basis for your explanation. Present your views using our innovative slide and be assured of leaving a lasting impression.-PPT components of circular process powerpoint design download 2010 Templates-Arrow, Chart, Circular, Color, Colorful, Connect, Connection, Design, Diagram, Finance, Graphic, Group, Growth, Icon, Illustration, Marketing, Pieces, Process, Recycle, Recycling, Round, Set, Strategy, Symbol, Wheel Achieve high-growth with our Ppt Components Of Circular Process PowerPoint Design Download 2010 Templates. They will make you look good.
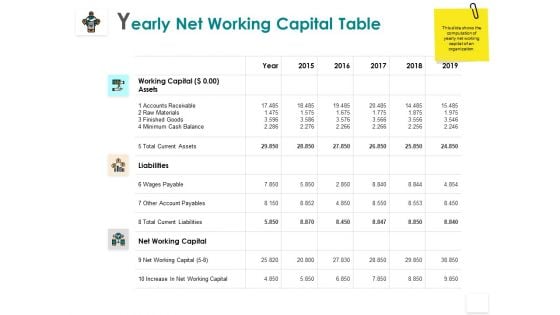
Yearly Net Working Capital Table Liabilities Minimum Ppt PowerPoint Presentation Infographic Template Diagrams
Presenting this set of slides with name yearly net working capital table liabilities minimum ppt powerpoint presentation infographic template diagrams. The topics discussed in these slides are liabilities, increase, business, planning, strategy. This is a completely editable PowerPoint presentation and is available for immediate download. Download now and impress your audience.
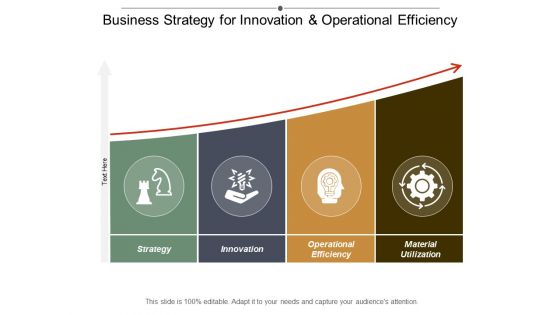
Business Strategy For Innovation And Operational Efficiency Ppt Powerpoint Presentation Slides Picture
This is a business strategy for innovation and operational efficiency ppt powerpoint presentation slides picture. This is a four stage process. The stages in this process are productivity improvement, output improvement, productivity enhancement.
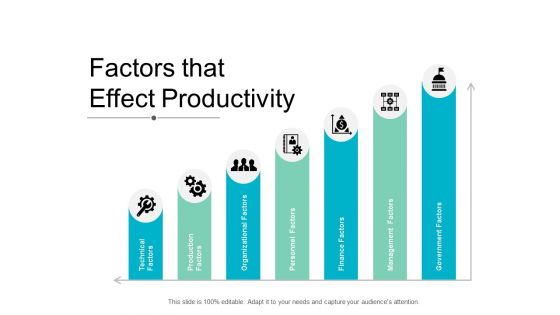
Factors That Effect Productivity Ppt Powerpoint Presentation Pictures Images
This is a factors that effect productivity ppt powerpoint presentation pictures images. This is a seven stage process. The stages in this process are productivity improvement, output improvement, productivity enhancement.
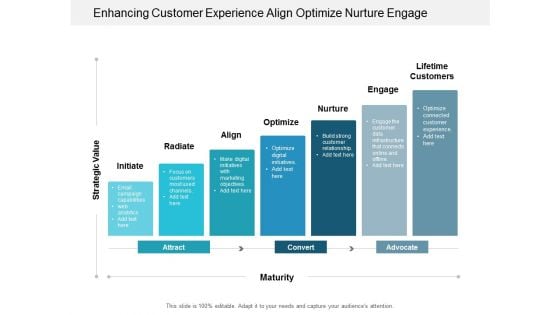
Enhancing Customer Experience Align Optimize Nurture Engage Ppt Powerpoint Presentation Infographic Template Graphics Design
This is a enhancing customer experience align optimize nurture engage ppt powerpoint presentation infographic template graphics design. This is a seven stage process. The stages in this process are customer satisfaction, customer services, customer engagement model.

Enable Engage Enhance Employees At Workplace Ppt PowerPoint Presentation Summary Elements
Presenting this set of slides with name enable engage enhance employees at workplace ppt powerpoint presentation summary elements. This is a four stage process. The stages in this process are empower, employee engagement, human projection. This is a completely editable PowerPoint presentation and is available for immediate download. Download now and impress your audience.
Air Balloon Graphic With Text Space Powerpoint Templates
This business slide has been designed with graphics of air balloon. Download this diagram to portray concepts like growth, finance, marketing, and communication. This slide is innovatively designed to highlight your worthy view.
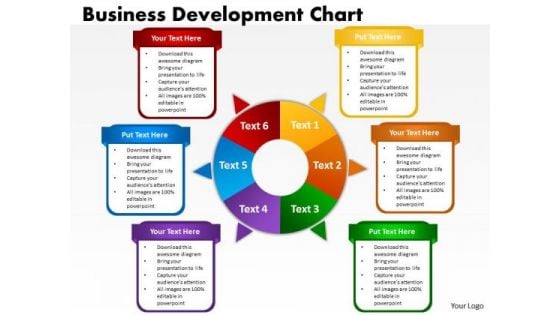
Consulting Diagram Business Development Chart Strategic Management
Document Your Views On Our Consulting Diagram Business Development Chart Strategic Management Powerpoint Templates. They Will Create A Strong Impression.
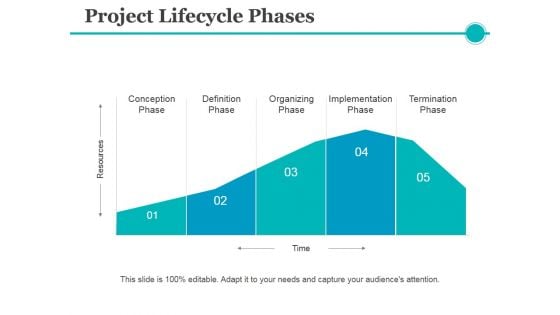
Project Lifecycle Phases Template 1 Ppt PowerPoint Presentation Layouts Layout
This is a project lifecycle phases template 1 ppt powerpoint presentation layouts layout. This is a five stage process. The stages in this process are definition phase, organizing phase, termination phase, implementation phase.
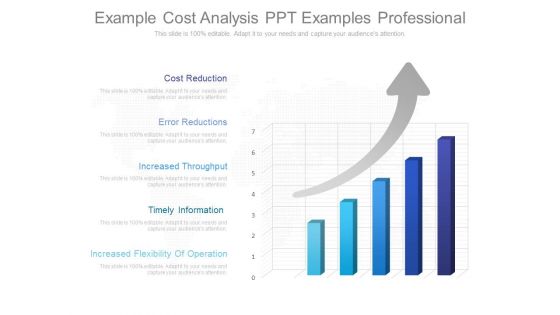
Example Cost Analysis Ppt Examples Professional
This is a example cost analysis ppt examples professional. This is a five stage process. The stages in this process are cost reduction, error reductions, increased throughput, timely information, increased flexibility of operation.
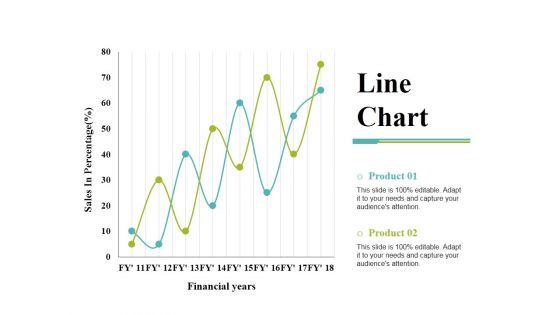
Line Chart Ppt PowerPoint Presentation Gallery Templates
This is a line chart ppt powerpoint presentation gallery templates. This is a two stage process. The stages in this process are product, financial years, sales in percentage, line chart.
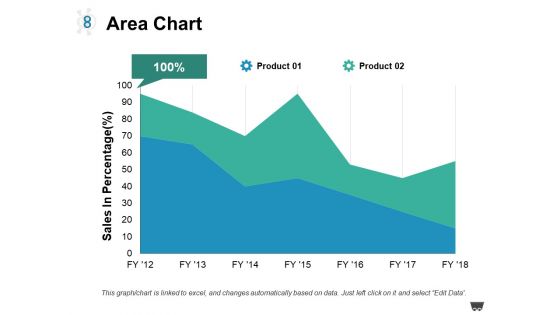
Area Chart Ppt PowerPoint Presentation Model Guidelines
This is a area chart ppt powerpoint presentation model guidelines. This is a two stage process. The stages in this process are product, area chart, sales in percentage.
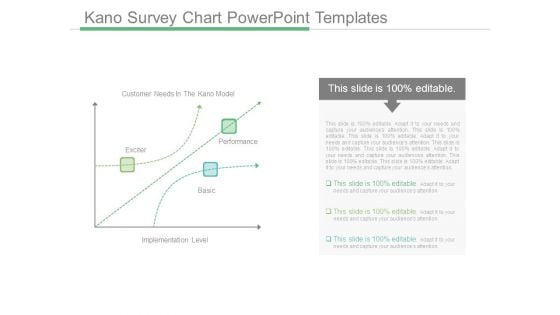
Kano Survey Chart Powerpoint Templates
This is a kano survey chart powerpoint templates. This is a three stage process. The stages in this process are customer needs in the kano model, exciter, performance, basic, implementation level.
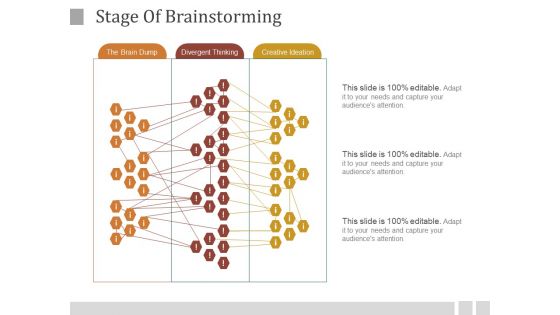
Stage Of Brainstorming Ppt PowerPoint Presentation Visual Aids
This is a stage of brainstorming ppt powerpoint presentation visual aids. This is a three stage process. The stages in this process are the brain dump, divergent thinking, creative ideation.
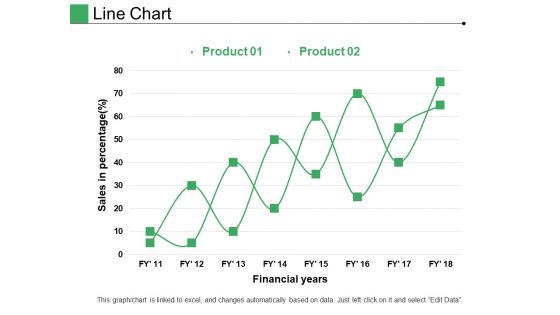
Line Chart Ppt PowerPoint Presentation Pictures Layout
This is a line chart ppt powerpoint presentation pictures layout. This is a two stage process. The stages in this process are product, financial years, sales in percentage.
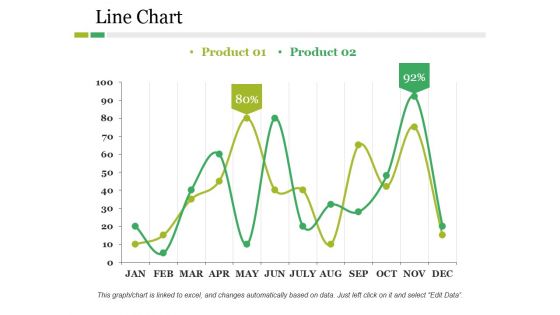
Line Chart Ppt PowerPoint Presentation Pictures Structure
This is a line chart ppt powerpoint presentation pictures structure. This is a two stage process. The stages in this process are product, business, line chart, finance, percentage.
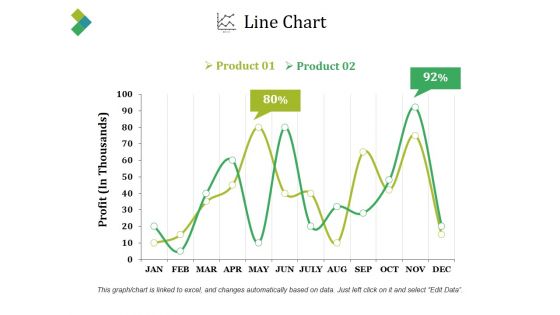
Line Chart Ppt PowerPoint Presentation Slides
This is a line chart ppt powerpoint presentation slides. This is a two stage process. The stages in this process are product, profit, percentage, finance, line chart.
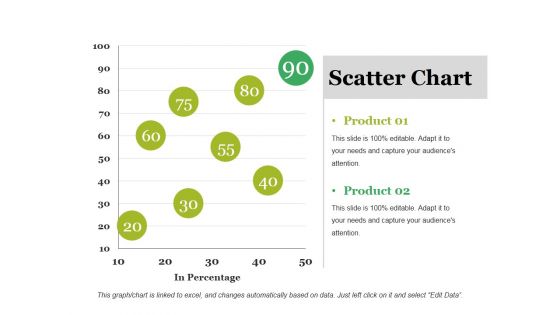
Scatter Chart Ppt PowerPoint Presentation Outline Ideas
This is a scatter chart ppt powerpoint presentation outline ideas. This is a two stage process. The stages in this process are product, scatter chart, business, in percentage, marketing.
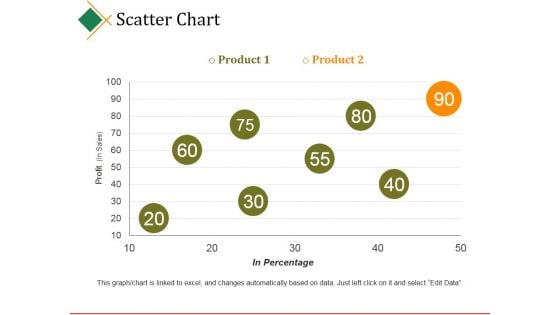
Scatter Chart Ppt PowerPoint Presentation Model
This is a scatter chart ppt powerpoint presentation model. This is a two stage process. The stages in this process are business, product, profit, in percentage, business.
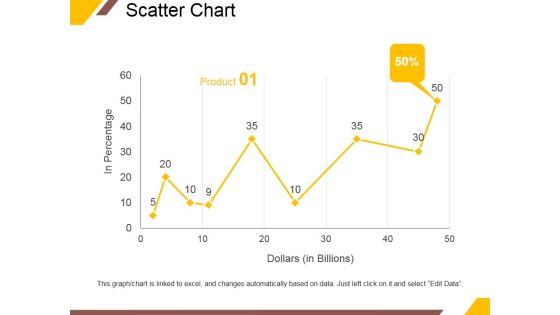
Scatter Chart Ppt PowerPoint Presentation Gallery Vector
This is a scatter chart ppt powerpoint presentation gallery vector. This is a nine stage process. The stages in this process are in percentage, dollars, product, percentage, finance.
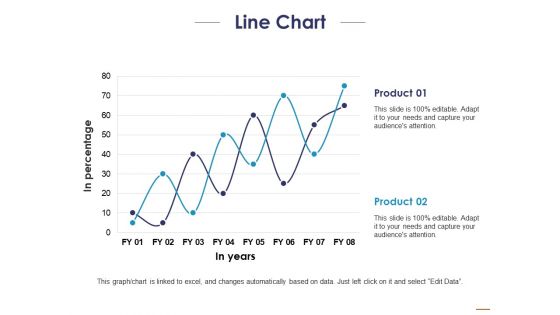
Line Chart Ppt PowerPoint Presentation Layouts Templates
This is a line chart ppt powerpoint presentation layouts templates. This is a two stage process. The stages in this process are product, in percentage, in years.
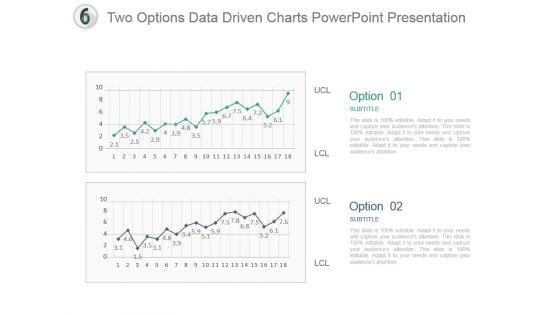
Two Options Data Driven Charts Powerpoint Presentation
This is a two options data driven charts powerpoint presentation. This is a two stage process. The stages in this process are business, success, strategy, process, marketing, management.
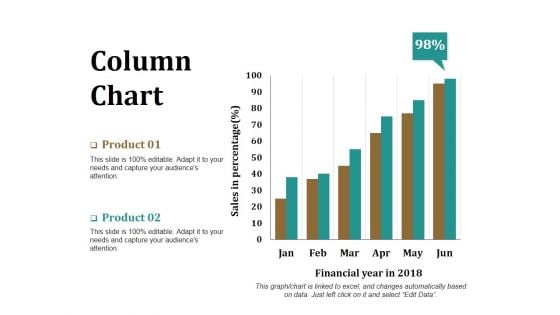
Column Chart Ppt PowerPoint Presentation Model Graphics Download
This is a column chart ppt powerpoint presentation model graphics download. This is a two stage process. The stages in this process are product, financial year, sales in percentage, bar graph, success.
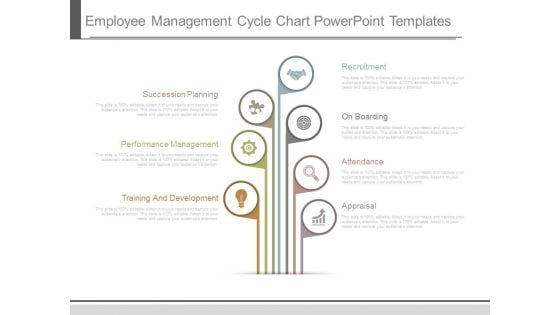
Employee Management Cycle Chart Powerpoint Templates
This is a employee management cycle chart powerpoint templates. This is a seven stage process. The stages in this process are succession planning, performance management, training and development, recruitment, on boarding, attendance, appraisal.
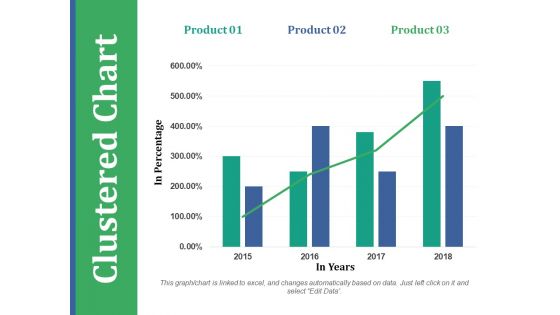
Clustered Chart Ppt PowerPoint Presentation Outline Templates
This is a clustered chart ppt powerpoint presentation outline templates. This is a three stage process. The stages in this process are product, in percentage, in years, clustered chart.
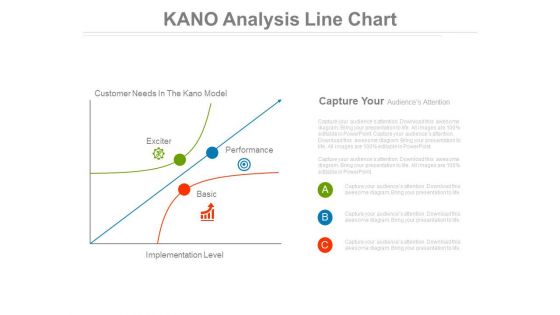
Kano Analysis Line Chart Ppt Slides
This is a kano analysis line chart ppt slides. This is a three stage process. The stages in this process are marketing, business.\n\n
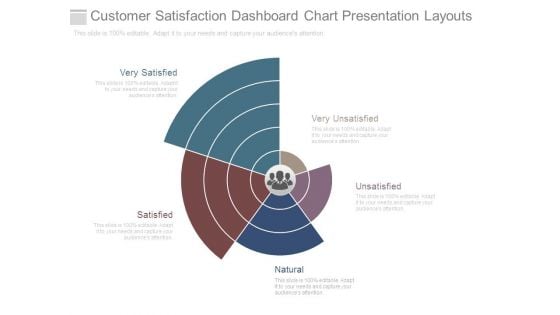
Customer Satisfaction Dashboard Chart Presentation Layouts
This is a customer satisfaction dashboard chart presentation layouts. This is a five stage process. The stages in this process are very satisfied, satisfied, unsatisfied, natural, very unsatisfied.
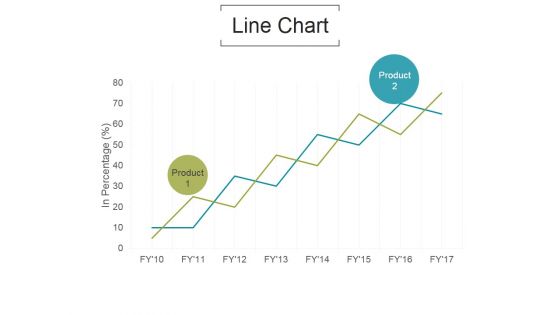
Line Chart Ppt PowerPoint Presentation Model
This is a line chart ppt powerpoint presentation model. This is a two stage process. The stages in this process are in percentage, product, business.
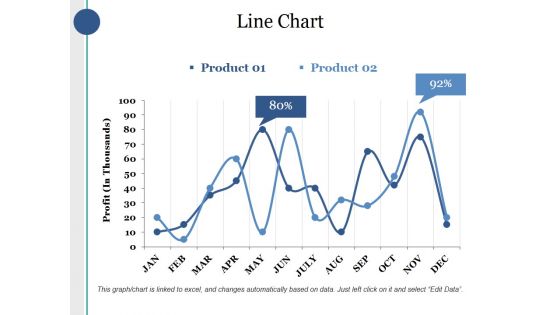
Line Chart Ppt PowerPoint Presentation Layouts Sample
This is a line chart ppt powerpoint presentation layouts sample. This is a two stage process. The stages in this process are product, profit, percentage, finance, business.
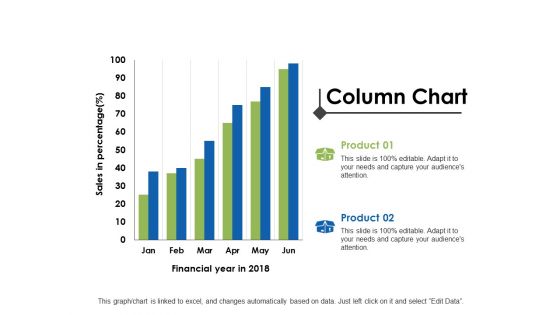
Column Chart Ppt PowerPoint Presentation Layouts Rules
This is a column chart ppt powerpoint presentation layouts rules. This is a two stage process. The stages in this process are analysis, finance, marketing, management, investment.
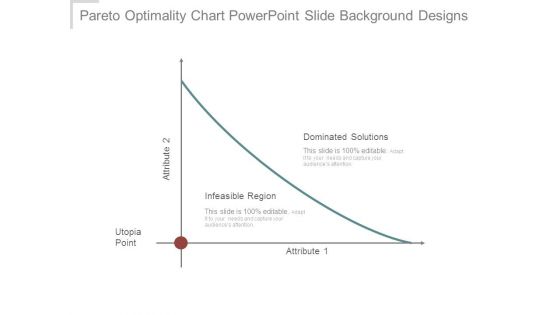
Pareto Optimality Chart Powerpoint Slide Background Designs
This is a pareto optimality chart powerpoint slide background designs. This is a one stage process. The stages in this process are dominated solutions, infeasible region, utopia point, attribute.
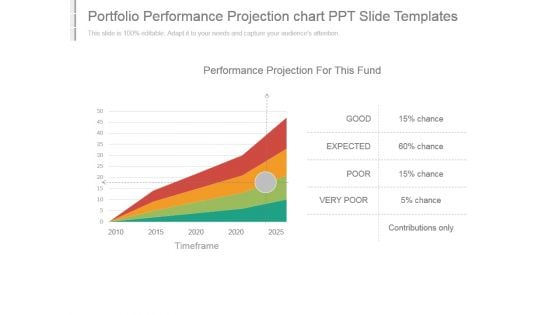
Portfolio Performance Projection Chart Ppt Slide Templates
This is a portfolio performance projection chart ppt slide templates. This is a four stage process. The stages in this process are performance projection for this fund, good, expected, poor, very poor, contributions only, timeframe.
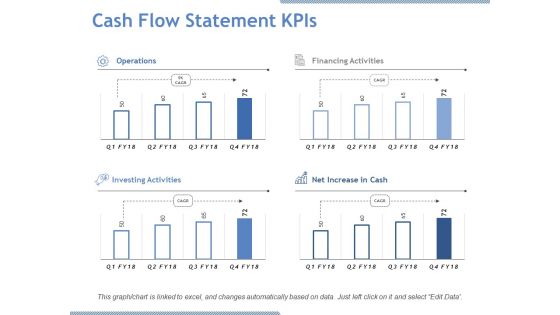
Cash Flow Statement Kpis Ppt PowerPoint Presentation Model Samples
This is a cash flow statement kpis ppt powerpoint presentation model samples. This is a four stage process. The stages in this process are operations, financing activities, investing activities, increase in cash.
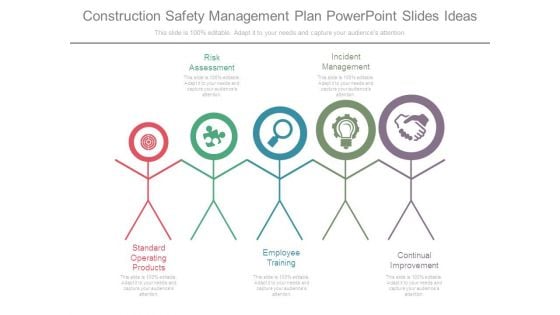
Construction Safety Management Plan Powerpoint Slides Ideas
This is a construction safety management plan powerpoint slides ideas. This is a five stage process. The stages in this process are risk assessment, incident management, standard operating products, employee training, continual improvement.
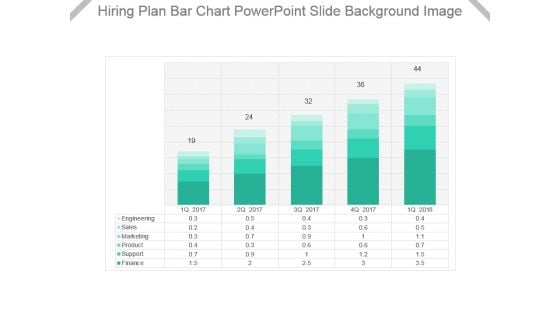
Hiring Plan Bar Chart Powerpoint Slide Background Image
This is a hiring plan bar chart powerpoint slide background image. This is a five stage process. The stages in this process are engineering, sales, marketing, product, support, finance.
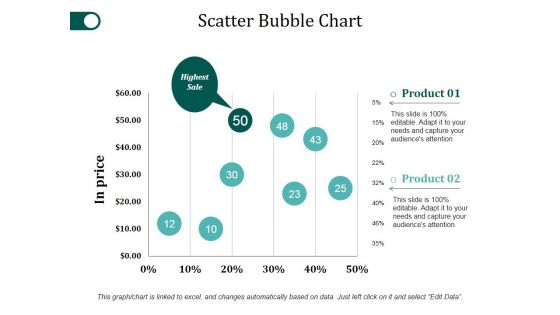
Scatter Bubble Chart Ppt PowerPoint Presentation Styles Objects
This is a scatter bubble chart ppt powerpoint presentation styles objects. This is a two stage process. The stages in this process are product, in price, highest sale, percentage, finance.
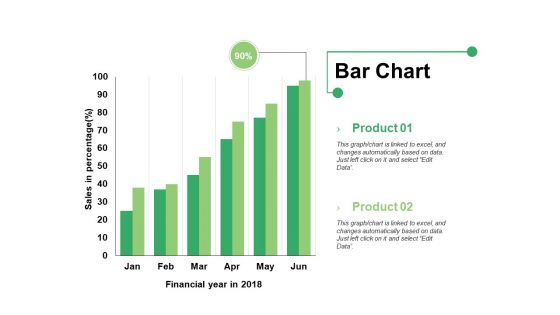
Bar Chart Ppt PowerPoint Presentation Infographics Format Ideas
This is a bar chart ppt powerpoint presentation infographics format ideas. This is a two stage process. The stages in this process are bar graph, product, financial year, sales in percentage.
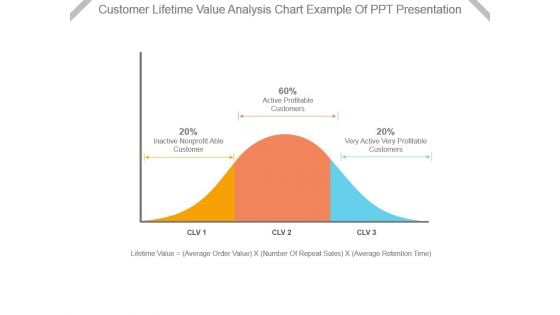
Customer Lifetime Value Analysis Chart Example Of Ppt Presentation
This is a customer lifetime value analysis chart example of ppt presentation. This is a three stage process. The stages in this process are inactive nonprofit able customer, active profitable customers, very active very profitable customers, lifetime value, average order value, number of repeat sales, average retention time.
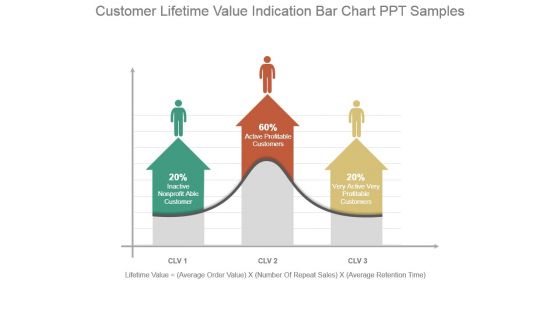
Customer Lifetime Value Indication Bar Chart Ppt Samples
This is a customer lifetime value indication bar chart ppt samples. This is a three stage process. The stages in this process are inactive nonprofit able customer, active profitable customers, very active very profitable customers, lifetime value, average order value, number of repeat sales, average retention time.
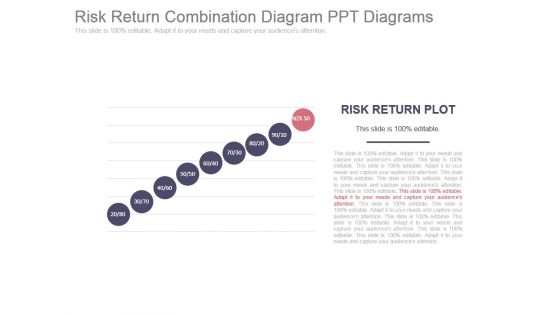
Risk Return Combination Diagram Ppt Diagrams
This is a risk return combination diagram ppt diagrams. This is a nine stage process. The stages in this process are risk return plot.
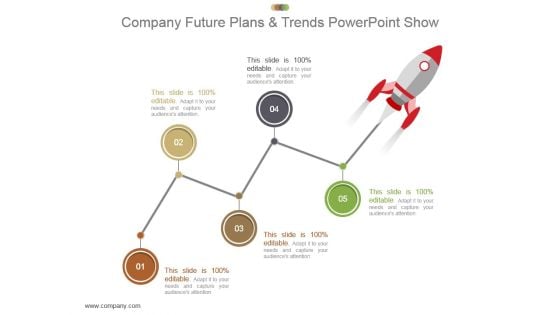
Company Future Plans And Trends Powerpoint Show
This is a company future plans and trends powerpoint show. This is a five stage process. The stages in this process are plan, rocket, company, trend, career.
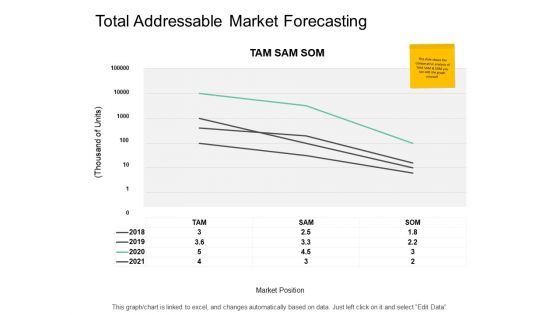
Total Addressable Market Forecasting Ppt PowerPoint Presentation Professional Deck
Presenting this set of slides with name total addressable market forecasting ppt powerpoint presentation professional deck. The topics discussed in these slides are marketing, business, management, planning, strategy. This is a completely editable PowerPoint presentation and is available for immediate download. Download now and impress your audience.
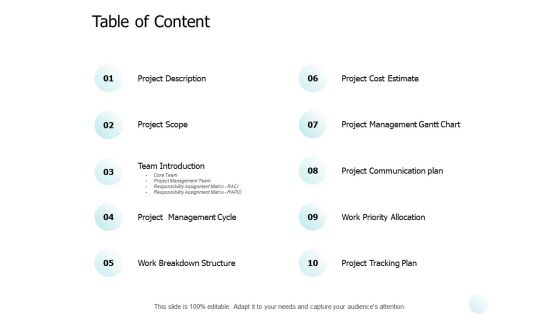
Table Of Content Ppt PowerPoint Presentation Show Pictures
Presenting this set of slides with name table of content ppt powerpoint presentation show pictures. The topics discussed in these slides are marketing, business, management, planning, strategy. This is a completely editable PowerPoint presentation and is available for immediate download. Download now and impress your audience.
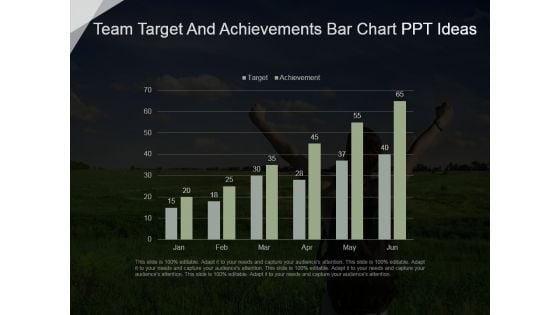
Team Target And Achievements Bar Chart Ppt Ideas
This is a team target and achievements bar chart ppt ideas. This is a six stage process. The stages in this process are business, marketing, graph chart, success, strategy.
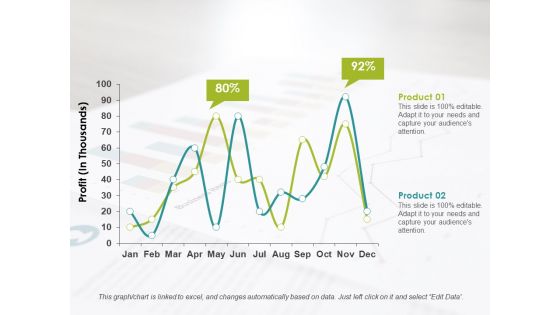
Line Chart Ppt PowerPoint Presentation Infographics Format Ideas
This is a line chart ppt powerpoint presentation infographics format ideas. This is a two stage process. The stages in this process are product, profit, business.
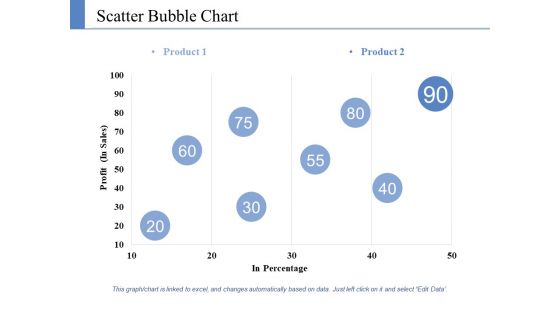
Scatter Bubble Chart Ppt PowerPoint Presentation Styles Information
This is a scatter bubble chart ppt powerpoint presentation styles information. This is a two stage process. The stages in this process are product, profit, in percentage.
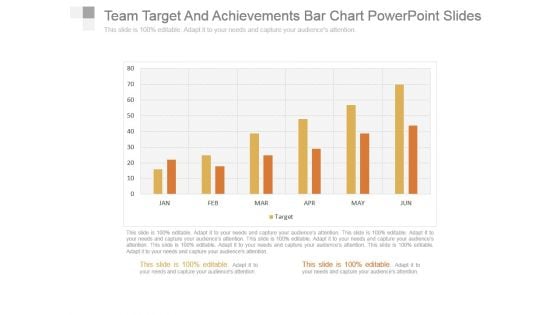
Team Target And Achievements Bar Chart Powerpoint Slides
This is a team target and achievements bar chart powerpoint slides. This is a six stage process. The stages in this process are business, success, graph chart, strategy, marketing.
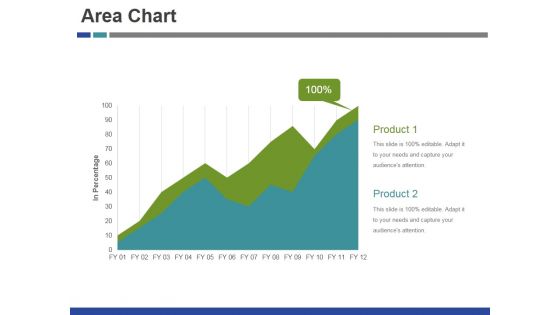
Area Chart Ppt PowerPoint Presentation Infographic Template Show
This is a area chart ppt powerpoint presentation infographic template show. This is a two stage process. The stages in this process are product, marketing, management, business, success.
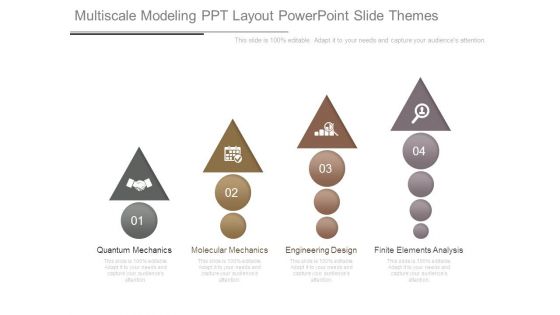
Multiscale Modeling Ppt Layout Powerpoint Slide Themes
This is a Multiscale Modeling Ppt Layout Powerpoint Slide Themes. This is a four stage process. The stages in this process are quantum mechanics, molecular mechanics, engineering design, finite elements analysis.
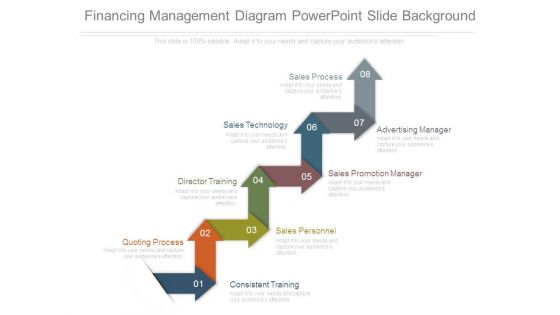
Financing Management Diagram Powerpoint Slide Background
This is a financing management diagram powerpoint slide background. This is a eight stage process. The stages in this process are sales process, sales technology, advertising manager, sales promotion manager, director training, sales personnel, consistent training, quoting process.
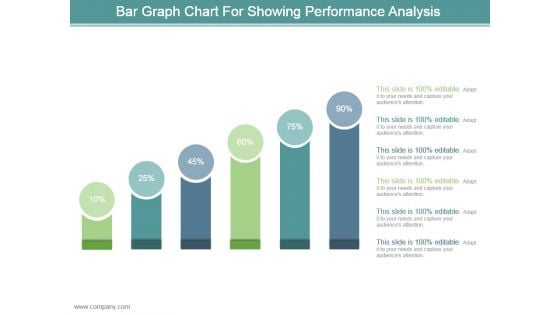
Bar Graph Chart For Showing Performance Analysis Ppt Design
This is a bar graph chart for showing performance analysis ppt design. This is a six stage process. The stages in this process are business, marketing, process, success, presentation.
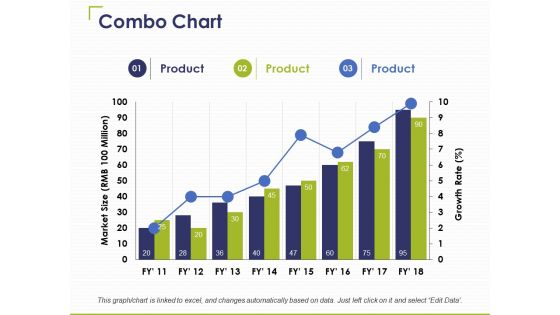
Combo Chart Ppt PowerPoint Presentation Infographics Graphics Pictures
This is a combo chart ppt powerpoint presentation infographics graphics pictures. This is a three stage process. The stages in this process are product, business, marketing, combo chart.
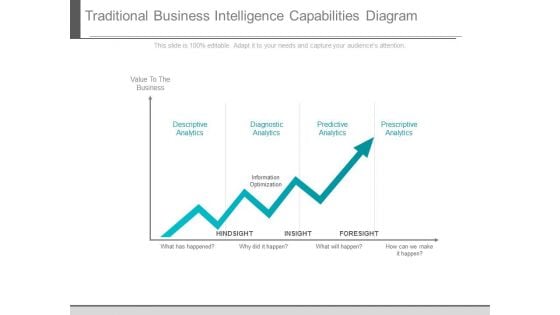
Traditional Business Intelligence Capabilities Diagram
This is a traditional business intelligence capabilities diagram. This is a one stage process. The stages in this process are descriptive analytics, diagnostic analytics, predictive analytics, prescriptive analytics, information optimization, value to the business, hindsight, insight, foresight.
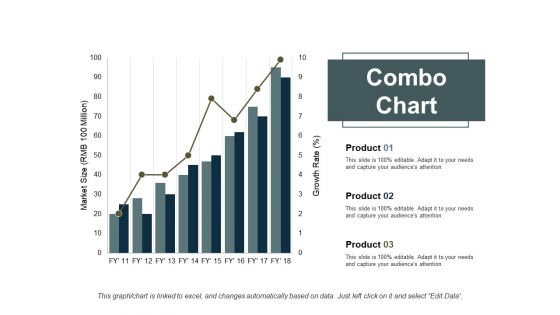
Combo Chart Finance Ppt PowerPoint Presentation Slides Backgrounds
This is a combo chart finance ppt powerpoint presentation slides backgrounds. This is a three stage process. The stages in this process are combo chart, finance, marketing, analysis, business.
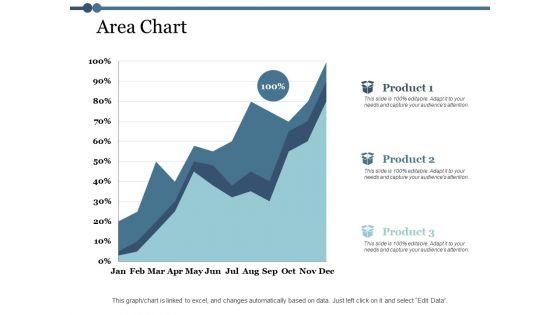
Area Chart Finance Ppt PowerPoint Presentation Outline Design Templates
This is a area chart finance ppt powerpoint presentation outline design templates. This is a three stage process. The stages in this process arefinance, marketing, management, investment, analysis.
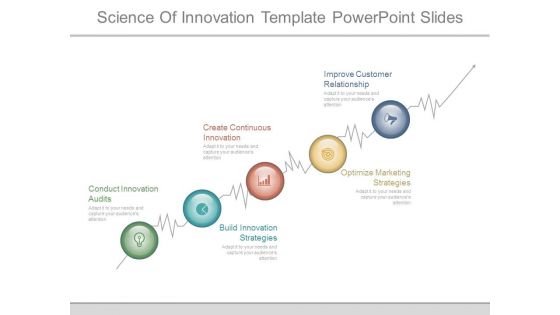
Science Of Innovation Template Powerpoint Slides
This is a science of innovation template powerpoint slides. This is a five stage process. The stages in this process are conduct innovation audits, create continuous innovation, improve customer relationship, build innovation strategies, optimize marketing strategies.
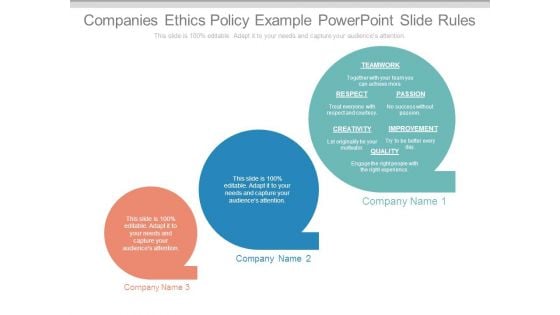
Companies Ethics Policy Example Powerpoint Slide Rules
This is a companies ethics policy example powerpoint slide rules. This is a three stage process. The stages in this process are teamwork, passion, respect, creativity, improvement, quality, company name.
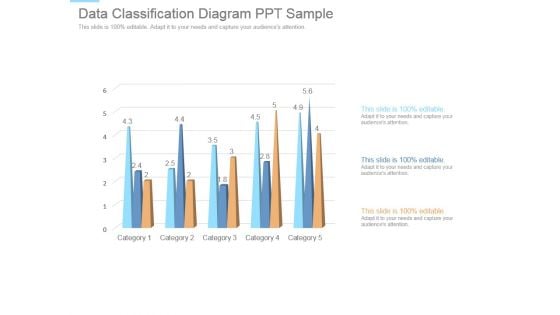
Data Classification Diagram Ppt Sample
This is a data classification diagram ppt sample. This is a five stage process. The stages in this process are category.
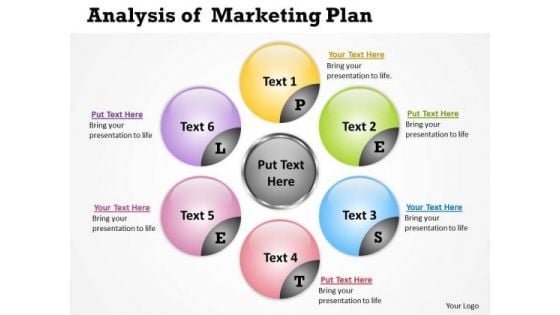
Strategic Management Analysis Of Marketing Plan Sales Diagram
Your Listeners Will Never Doodle. Our Strategic Management Analysis of Marketing Plan Sales Diagram Powerpoint Templates Will Hold Their Concentration.
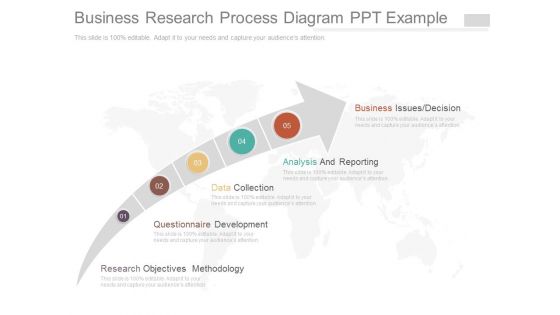
Business Research Process Diagram Ppt Example
This is a business research process diagram ppt example. This is a five stage process. The stages in this process are business issues decision, analysis and reporting, data collection, questionnaire development, research objectives methodology.
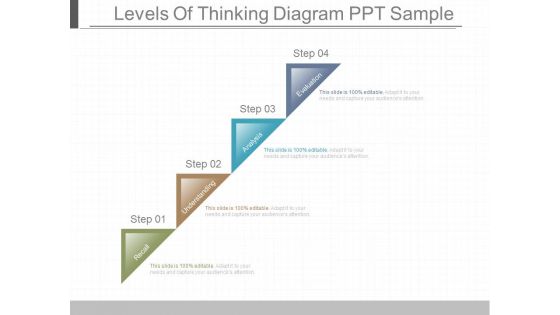
Levels Of Thinking Diagram Ppt Sample
This is a levels of thinking diagram ppt sample. This is a four stage process. The stages in this process are recall, understanding, analysis, evaluation.
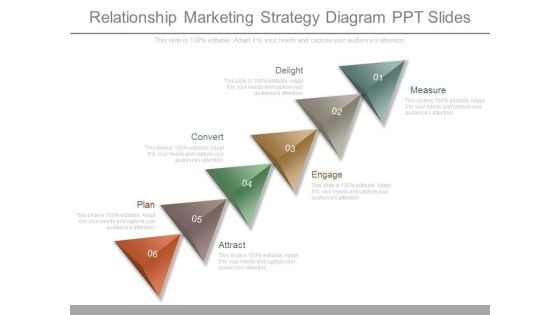
Relationship Marketing Strategy Diagram Ppt Slides
This is a relationship marketing strategy diagram ppt slides. This is a six stage process. The stages in this process are delight, convert, plan, attract, engage, measure.
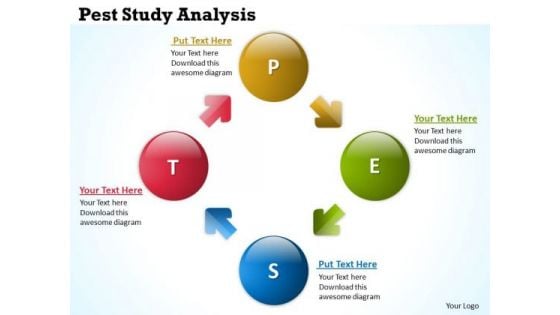
Strategic Management Pest Study Analysis Business Diagram
Our Strategic Management Pest Study Analysis Business Diagram Powerpoint Templates Heighten Concentration. Your Audience Will Be On The Edge.
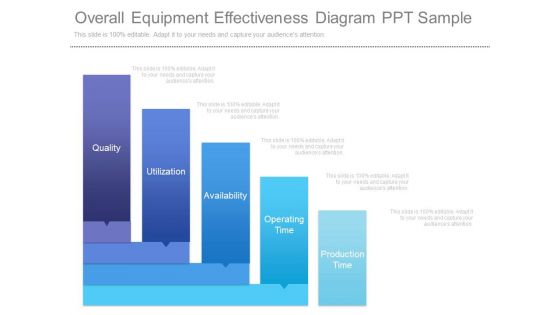
Overall Equipment Effectiveness Diagram Ppt Sample
This is a overall equipment effectiveness diagram ppt sample. This is a five stage process. The stages in this process are quality, utilization, availability, operating time, production time.
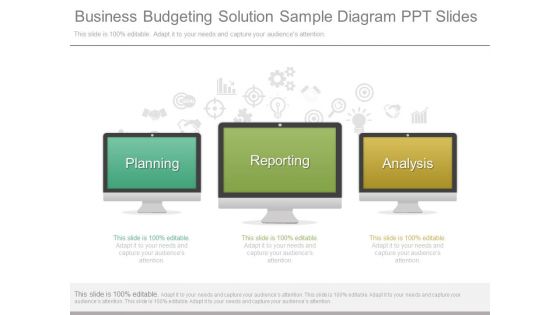
Business Budgeting Solution Sample Diagram Ppt Slides
This is a business budgeting solution sample diagram ppt slides. This is a three stage process. The stages in this process are planning, reporting, analysis.
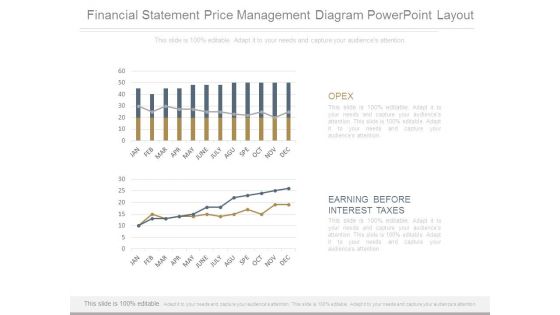
Financial Statement Price Management Diagram Powerpoint Layout
This is a financial statement price management diagram powerpoint layout. This is a two stage process. The stages in this process are opex, earning before interest taxes.
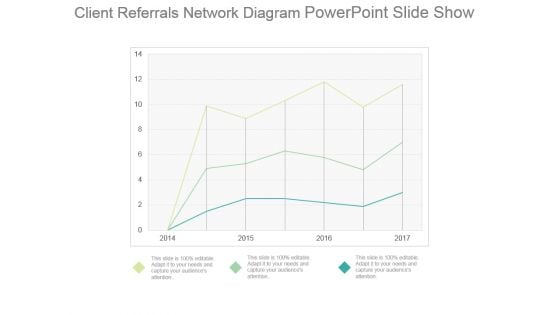
Client Referrals Network Diagram Powerpoint Slide Show
This is a client referrals network diagram powerpoint slide show. This is a three stage process. The stages in this process are business, marketing, strategy, management, analysis.
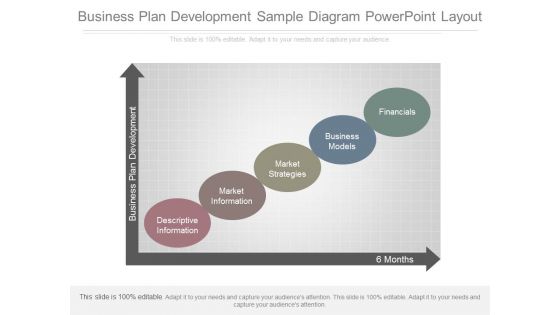
Business Plan Development Sample Diagram Powerpoint Layout
This is a business plan development sample diagram powerpoint layout. This is a five stage process. The stages in this process are business plan development, descriptive information, market information, market strategies, business models, financials.
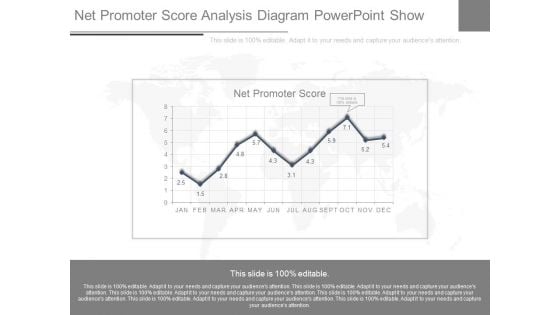
Net Promoter Score Analysis Diagram Powerpoint Show
This is a net promoter score analysis diagram powerpoint show. This is a twelve stage process. The stages in this process are net promoter score, jan, feb, mar, apr, may, jun, jul, aug, sep, oct, nov, dec.
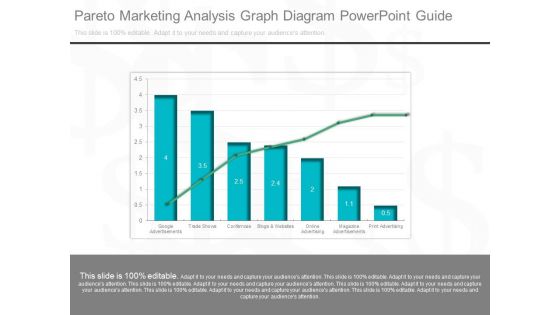
Pareto Marketing Analysis Graph Diagram Powerpoint Guide
This is a pareto marketing analysis graph diagram powerpoint guide. This is a seven stage process. The stages in this process are google advertisements, trade shows, conferences, blog and websites, online advertising, magazine advertisements, print advertising.
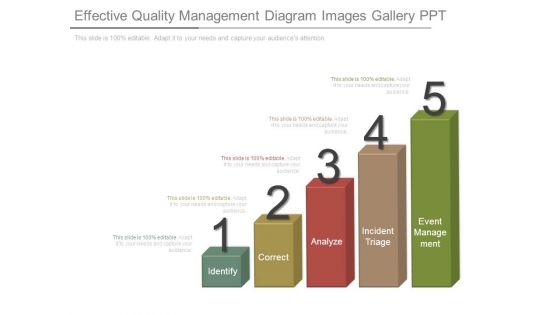
Effective Quality Management Diagram Images Gallery Ppt
This is a effective quality management diagram images gallery ppt. This is a five stage process. The stages in this process are identify, correct, analyze, incident triage, event management.
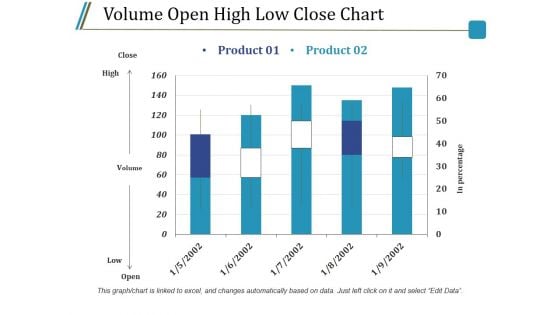
Volume Open High Low Close Chart Ppt PowerPoint Presentation Infographics Guide
This is a volume open high low close chart ppt powerpoint presentation infographics guide. This is a two stage process. The stages in this process are close, high, volume, low, open, product.
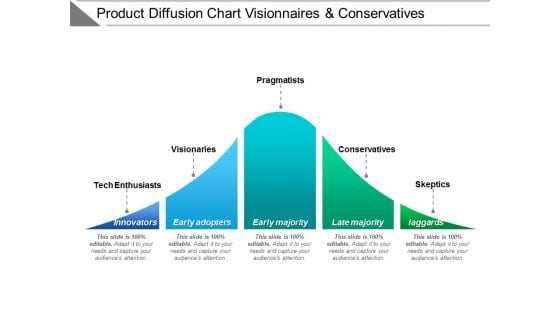
Product Diffusion Chart Visionaries And Conservatives Ppt PowerPoint Presentation Model Clipart
This is a product diffusion chart visionaries and conservatives ppt powerpoint presentation model clipart. This is a five stage process. The stages in this process are adoption curve, crossing the chasm, hype cycle.
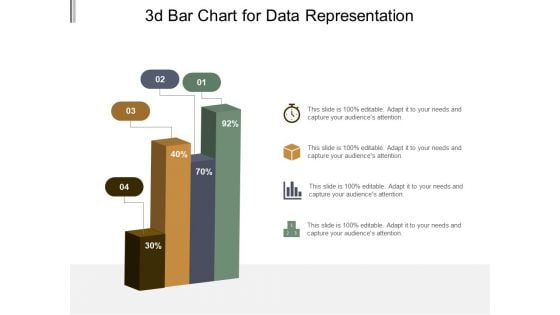
3D Bar Chart For Data Representation Ppt PowerPoint Presentation Model Graphic Tips
This is a 3d bar chart for data representation ppt powerpoint presentation model graphic tips. This is a four stage process. The stages in this process are art, colouring, paint brush.
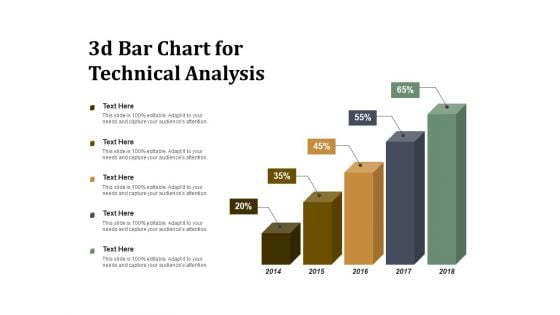
3D Bar Chart For Technical Analysis Ppt PowerPoint Presentation Summary Visuals
This is a 3d bar chart for technical analysis ppt powerpoint presentation summary visuals. This is a five stage process. The stages in this process are art, colouring, paint brush.

Effectiveness Of Teamwork Team With Gears And Bar Chart Ppt Powerpoint Presentation Ideas Information
This is a effectiveness of teamwork team with gears and bar chart ppt powerpoint presentation ideas information. This is a four stage process. The stages in this process are team performance, member performance, group performance.
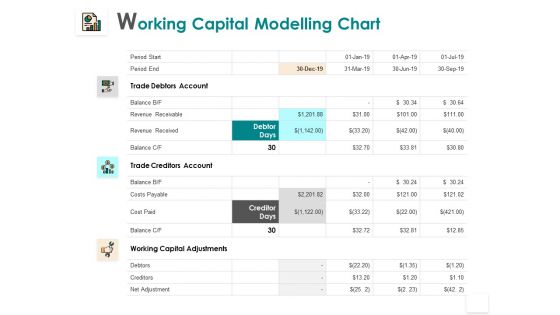
Working Capital Modelling Chart Adjustments Adjustment Ppt PowerPoint Presentation Inspiration Rules
Presenting this set of slides with name working capital modelling chart adjustments adjustment ppt powerpoint presentation inspiration rules. The topics discussed in these slides are costs, revenue, adjustments, debtors, creditors. This is a completely editable PowerPoint presentation and is available for immediate download. Download now and impress your audience.
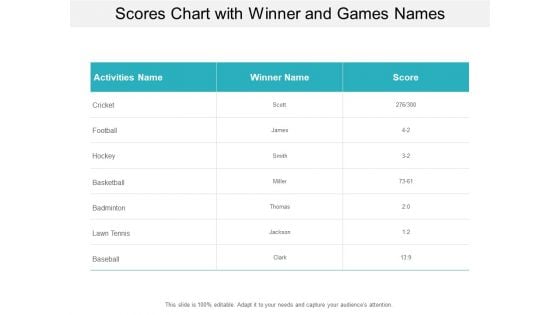
Scores Chart With Winner And Games Names Ppt PowerPoint Presentation Infographics Skills
Presenting this set of slides with name scores chart with winner and games names ppt powerpoint presentation infographics skills. The topics discussed in these slides are marketing, strategy, management. This is a completely editable PowerPoint presentation and is available for immediate download. Download now and impress your audience.
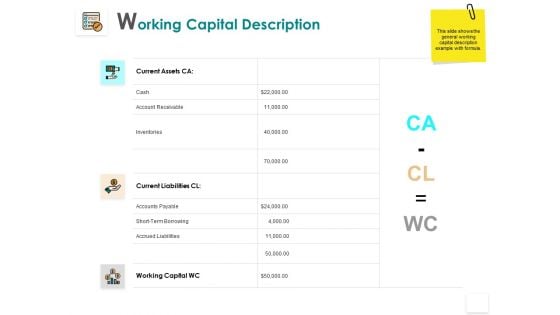
Working Capital Description Liabilities Receivable Ppt PowerPoint Presentation Inspiration Shapes
Presenting this set of slides with name working capital description liabilities receivable ppt powerpoint presentation inspiration shapes. The topics discussed in these slides are liabilities, increase, business, planning, strategy. This is a completely editable PowerPoint presentation and is available for immediate download. Download now and impress your audience.
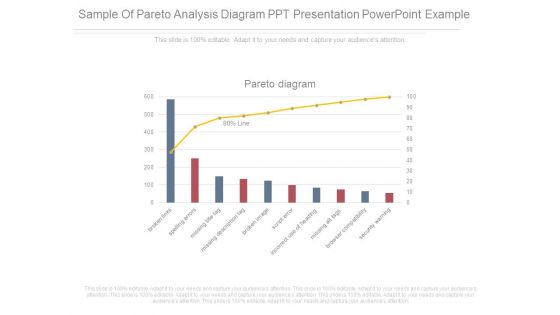
Sample Of Pareto Analysis Diagram Ppt Presentation Powerpoint Example
This is a sample of pareto analysis diagram ppt presentation powerpoint example. This is a ten stage process. The stages in this process are pareto diagram, broken links, spelling errors, missing title tag, missing description tag, broken image, script error, incorrect use of heading, missing alt tags, browser capability, security warning.
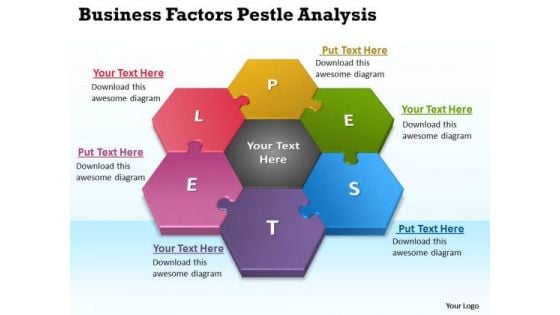
Mba Models And Frameworks Business Factors Pestel Analysis Consulting Diagram
Establish The Dominance Of Your Ideas. Our MBA Models And Frameworks Business Factors Pestel Analysis Consulting Diagram Powerpoint Templates Will Put Them On Top.
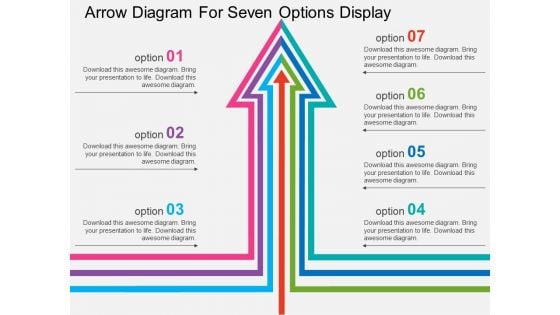
Arrow Diagram For Seven Options Display Powerpoint Template
This PowerPoint template has been designed with arrow diagram. This infographic template useful for seven options display. Accelerate the impact of your ideas using this template.
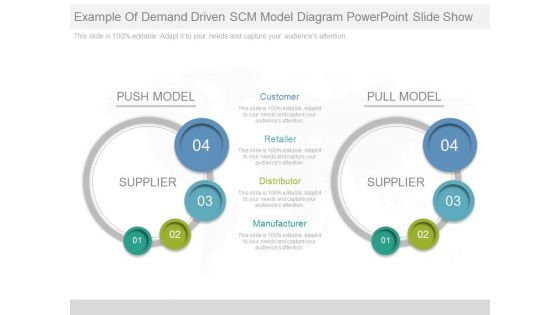
Example Of Demand Driven Scm Model Diagram Powerpoint Slide Show
This is a example of demand driven scm model diagram powerpoint slide show. This is a four stage process. The stages in this process are push model, supplier, pull model, customer, retailer, distributor, manufacturer.
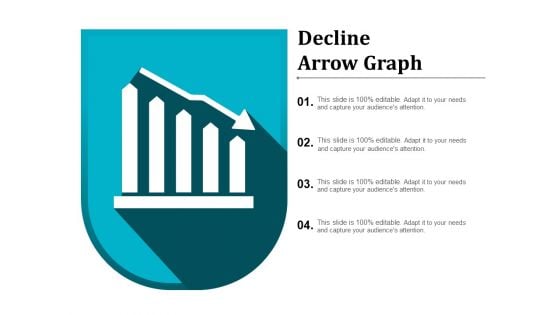
Decline Arrow Graph Ppt PowerPoint Presentation Pictures Portfolio
This is a decline arrow graph ppt powerpoint presentation pictures portfolio. This is a four stage process The stages in this process are downward step, downward phases, downward process.

Improving Business Revenue Bar Graph Ppt PowerPoint Presentation Infographic Template
This is a improving business revenue bar graph ppt powerpoint presentation infographic template. This is a six stage process. The stages in this process are graph, arrow, finance, percentage, success.

Master Manufacturing Program Ppt PowerPoint Presentation Complete Deck With Slides
Improve your presentation delivery using this Master Manufacturing Program Ppt PowerPoint Presentation Complete Deck With Slides. Support your business vision and objectives using this well-structured PPT deck. This template offers a great starting point for delivering beautifully designed presentations on the topic of your choice. Comprising fourteen this professionally designed template is all you need to host discussion and meetings with collaborators. Each slide is self-explanatory and equipped with high-quality graphics that can be adjusted to your needs. Therefore, you will face no difficulty in portraying your desired content using this PPT slideshow. This PowerPoint slideshow contains every important element that you need for a great pitch. It is not only editable but also available for immediate download and utilization. The color, font size, background, shapes everything can be modified to create your unique presentation layout. Therefore, download it now.
Flag On Peak On Mountain Powerpoint Templates
Our above business diagram has been designed with colorful tags. This slide is suitable to present evaluation of business project. Use this business diagram to present your work in a more smart and precise manner.
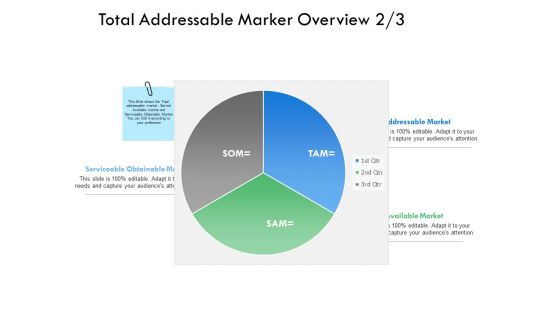
Total Addressable Marker Overview Obtainable Ppt PowerPoint Presentation Gallery Templates
Presenting this set of slides with name total addressable marker overview obtainable ppt powerpoint presentation gallery templates. The topics discussed in these slides are stacked column, finance, marketing, analysis, business, investment. This is a completely editable PowerPoint presentation and is available for immediate download. Download now and impress your audience.
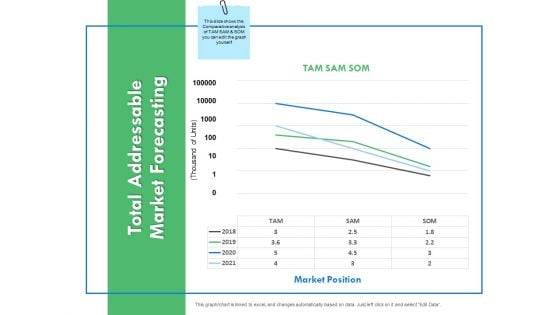
Total Addressable Market Forecasting Ppt PowerPoint Presentation Model Slideshow
Presenting this set of slides with name total addressable market forecasting ppt powerpoint presentation model slideshow. The topics discussed in these slides are bar graph, finance, marketing, analysis, investment. This is a completely editable PowerPoint presentation and is available for immediate download. Download now and impress your audience.
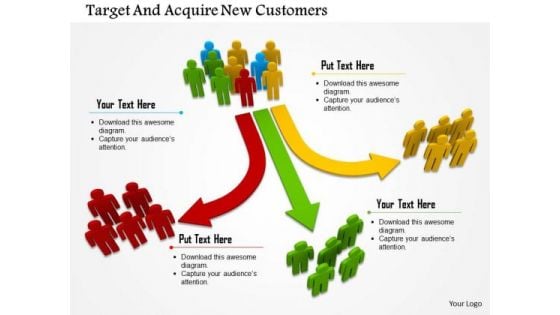
Target And Acquire New Customers PowerPoint Templates
Concept of three way customer segmentation has been defined in this power point template. This 3d diagram contains the graphic of customers group and way. You have identified the key result areas. Focus on each through this slide.
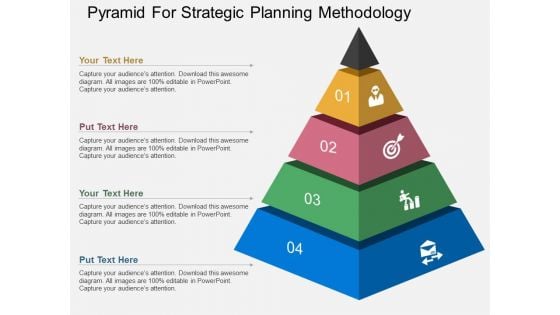
Pyramid For Strategic Planning Methodology Powerpoint Template
Our above PPT slide contains colorful diagram of pyramid. This PowerPoint template may be used to display strategic planning methodology. This template is designed to attract the attention of your audience.
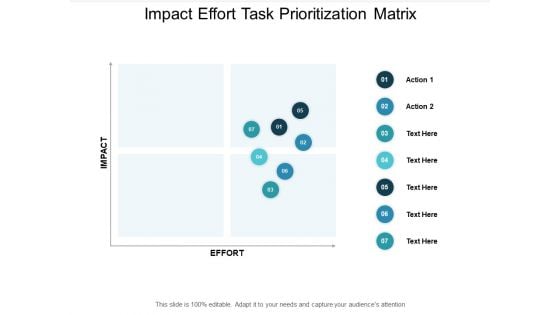
Impact Effort Task Prioritization Matrix Ppt PowerPoint Presentation Infographics Show
This is a impact effort task prioritization matrix ppt powerpoint presentation infographics show. The topics discussed in this diagram are priority matrix, responsibility matrix, action matrix. This is a completely editable PowerPoint presentation, and is available for immediate download.
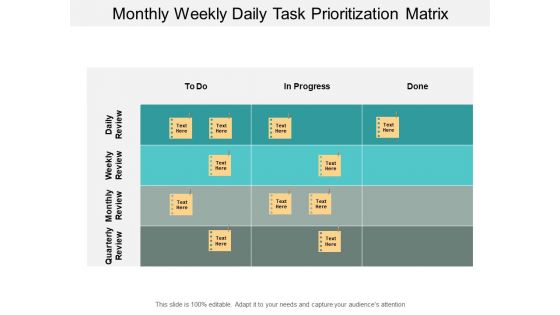
Monthly Weekly Daily Task Prioritization Matrix Ppt PowerPoint Presentation Model Guide
This is a monthly weekly daily task prioritization matrix ppt powerpoint presentation model guide. The topics discussed in this diagram are priority matrix, responsibility matrix, action matrix. This is a completely editable PowerPoint presentation, and is available for immediate download.

Project Planning Task Assignment Matrix Ppt PowerPoint Presentation Ideas Brochure
This is a project planning task assignment matrix ppt powerpoint presentation ideas brochure. The topics discussed in this diagram are priority matrix, responsibility matrix, action matrix. This is a completely editable PowerPoint presentation, and is available for immediate download.
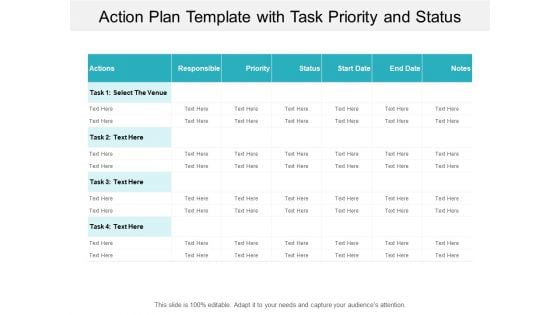
Action Plan Template With Task Priority And Status Ppt PowerPoint Presentation Slides Samples
This is a action plan template with task priority and status ppt powerpoint presentation slides samples. The topics discussed in this diagram are priority matrix, responsibility matrix, action matrix. This is a completely editable PowerPoint presentation, and is available for immediate download.
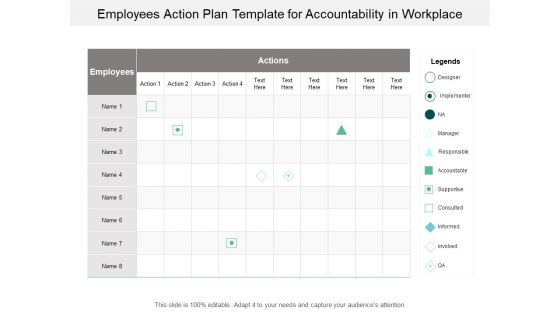
Employees Action Plan Template For Accountability In Workplace Ppt PowerPoint Presentation Layouts Portrait
This is a employees action plan template for accountability in workplace ppt powerpoint presentation layouts portrait. The topics discussed in this diagram are priority matrix, responsibility matrix, action matrix. This is a completely editable PowerPoint presentation, and is available for immediate download.
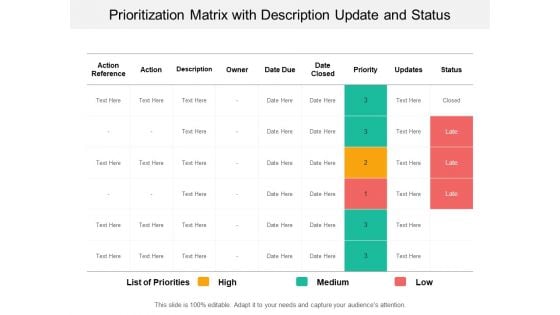
Prioritization Matrix With Description Update And Status Ppt PowerPoint Presentation Slides Smartart
This is a prioritization matrix with description update and status ppt powerpoint presentation slides smartart. The topics discussed in this diagram are priority matrix, responsibility matrix, action matrix. This is a completely editable PowerPoint presentation, and is available for immediate download.
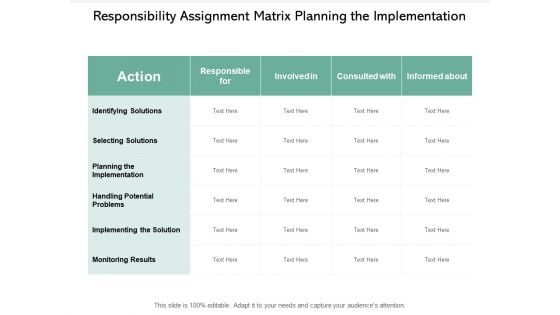
Responsibility Assignment Matrix Planning The Implementation Ppt PowerPoint Presentation Gallery Example Introduction
This is a responsibility assignment matrix planning the implementation ppt powerpoint presentation gallery example introduction. The topics discussed in this diagram are priority matrix, responsibility matrix, action matrix. This is a completely editable PowerPoint presentation, and is available for immediate download.
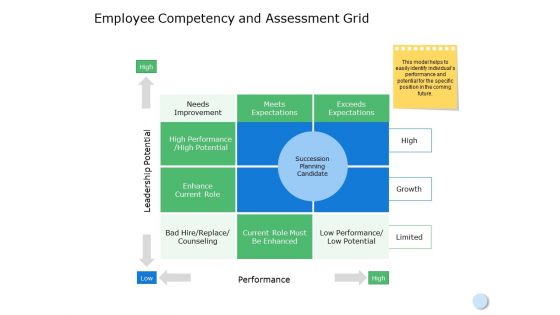
Employee Competency And Assessment Grid Ppt PowerPoint Presentation Infographic Template Clipart Images
This is a employee competency and assessment grid ppt powerpoint presentation infographic template clipart images. The topics discussed in this diagram are meets expectations, marketing, management, planning, strategy. This is a completely editable PowerPoint presentation, and is available for immediate download.
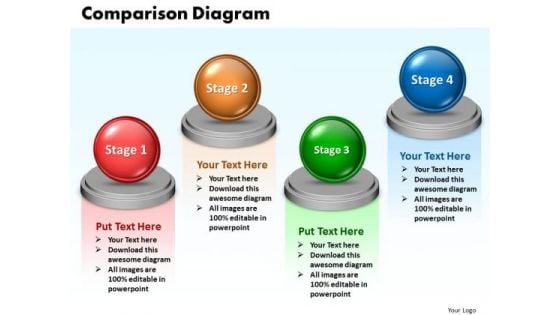
Ppt Comparison Network Diagram PowerPoint Template 4 Phase Templates
PPT comparison network diagram powerpoint template 4 phase Templates-This PowerPoint diagram slide shows four opposing views. You can use the This PowerPoint diagram slide to represent views from different functions on an issue.-PPT comparison network diagram powerpoint template 4 phase Templates-Abstract, Achievement, Business, Chart, Comparison, Concepts, Data, Descriptive, Design, Development, Diagram, Element, Figure, Finance, Financial, Graph, Graphic, Growth, Icon, Ideas, Improvement, Investment, Market, Money, Progress, Raise, Real, Report, Revenue, Sale, Shape, Sign, Silhouette, Stock, Success, Symbol, Technology Reveal the depth of your knowledge. Showcase your erudition on our Ppt Comparison Network Diagram PowerPoint Template 4 Phase Templates.
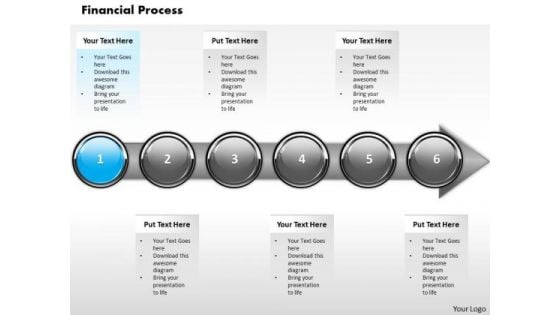
Ppt Sequential Demonstration Of Arrow Process Step 1 PowerPoint Templates
PPT sequential demonstration of arrow process step 1 PowerPoint Templates-With this pre-designed process arrows diagram you can visualize almost any type of concept, chronological process or steps of your strategies-PPT sequential demonstration of arrow process step 1 PowerPoint Templates-Abstract, Achievement, Aim, Arrow, Background, Business, Chart, Communication, Company, Competition, Concept, Design, Development, Diagram, Direction, Finance, Financial, Forecast, Forward, Goal, Graph, Graphic, Growth, Icon, Illustration, Increase, Investment, Leader, Leadership, Marketing, Motion, Moving, Orange, Path, Price, Process, Profit, Progress, Shape, Sign, Success, Symbol, Target, Team, Teamwork, Up, Upwards Accept accolades with our Ppt Sequential Demonstration Of Arrow Process Step 1 PowerPoint Templates. You will come out on top.
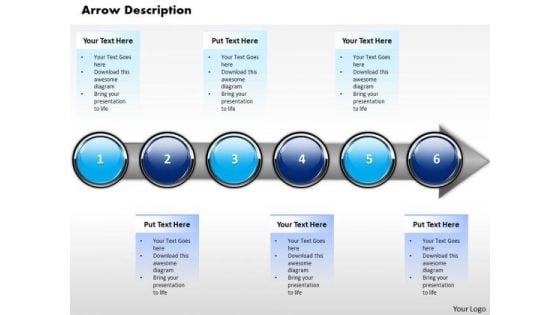
Ppt Horizontal Illustration Of Financial Process Using 6 State Diagram PowerPoint Templates
PPT horizontal illustration of financial process using 6 state diagram PowerPoint Templates-This diagram can be used in analyzing, designing, documenting or managing a process or program in various fields.-PPT horizontal illustration of financial process using 6 state diagram PowerPoint Templates-Abstract, Achievement, Aim, Arrow, Background, Business, Chart, Communication, Company, Competition, Concept, Design, Development, Diagram, Direction, Finance, Financial, Forecast, Forward, Goal, Graph, Graphic, Growth, Icon, Illustration, Increase, Investment, Leader, Leadership, Marketing, Motion, Moving, Orange, Path, Price, Process, Profit, Progress, Shape, Sign, Success, Symbol, Target, Team, Teamwork, Up, Upwards Spread awareness of digital tools. Whatever the divide our PT&s will bridge it.
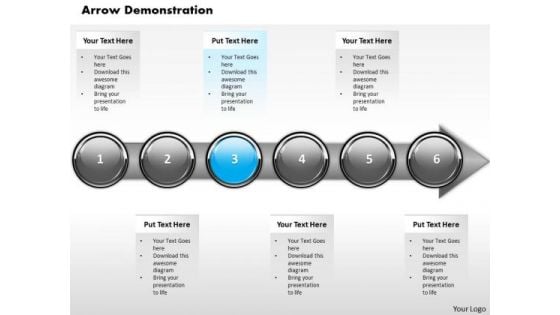
Ppt Homogeneous Demonstration Of Financial Process Using Stage 3 PowerPoint Templates
PPT homogeneous demonstration of financial process using stage 3 PowerPoint Templates-With this pre-designed process arrows diagram you can visualize almost any type of concept, chronological process or steps of your strategies.-PPT homogeneous demonstration of financial process using stage 3 PowerPoint Templates-Abstract, Achievement, Aim, Arrow, Background, Business, Chart, Communication, Company, Competition, Concept, Design, Development, Diagram, Direction, Finance, Financial, Forecast, Forward, Goal, Graph, Graphic, Growth, Icon, Illustration, Increase, Investment, Leader, Leadership, Marketing, Motion, Moving, Orange, Path, Price, Process, Profit, Progress, Shape, Sign, Success, Symbol, Target, Team, Teamwork, Up, Upwards Book you place at the top with our Ppt Homogeneous Demonstration Of Financial Process Using Stage 3 PowerPoint Templates. You will come out on top.
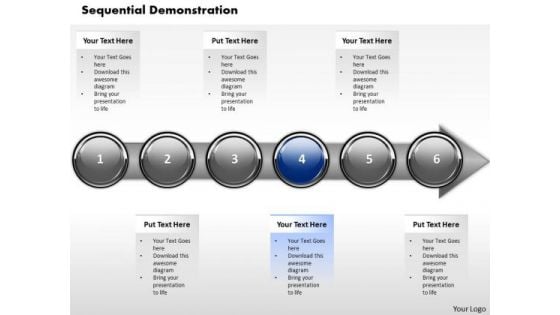
Ppt Horizontal Abstraction Of Financial Process Using Stage 4 PowerPoint Templates
PPT horizontal abstraction of financial process using stage 4 PowerPoint Templates-This diagram can be used in analyzing, designing, documenting or managing a process or program in various fields.-PPT horizontal abstraction of financial process using stage 4 PowerPoint Templates-Abstract, Achievement, Aim, Arrow, Background, Business, Chart, Communication, Company, Competition, Concept, Design, Development, Diagram, Direction, Finance, Financial, Forecast, Forward, Goal, Graph, Graphic, Growth, Icon, Illustration, Increase, Investment, Leader, Leadership, Marketing, Motion, Moving, Orange, Path, Price, Process, Profit, Progress, Shape, Sign, Success, Symbol, Target, Team, Teamwork, Up, Upwards Put in your every bit with our Ppt Horizontal Abstraction Of Financial Process Using Stage 4 PowerPoint Templates. They will give it their all.
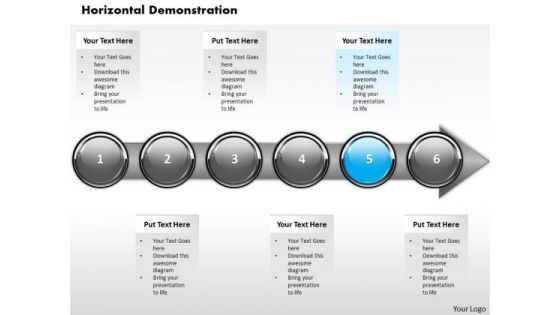
Ppt Consistent Demonstration Of Financial Process Using Stage 5 PowerPoint Templates
PPT consistent demonstration of financial process using stage 5 PowerPoint Templates-Highlight the key components of your entire financial process. Illustrate how each element flows seamlessly onto the next stage.-PPT consistent demonstration of financial process using stage 5 PowerPoint Templates-Abstract, Achievement, Aim, Arrow, Background, Business, Chart, Communication, Company, Competition, Concept, Design, Development, Diagram, Direction, Finance, Financial, Forecast, Forward, Goal, Graph, Graphic, Growth, Icon, Illustration, Increase, Investment, Leader, Leadership, Marketing, Motion, Moving, Orange, Path, Price, Process, Profit, Progress, Shape, Sign, Success, Symbol, Target, Team, Teamwork, Up, Upwards Crush your competition with our Ppt Consistent Demonstration Of Financial Process Using Stage 5 PowerPoint Templates. Just download, type and present.
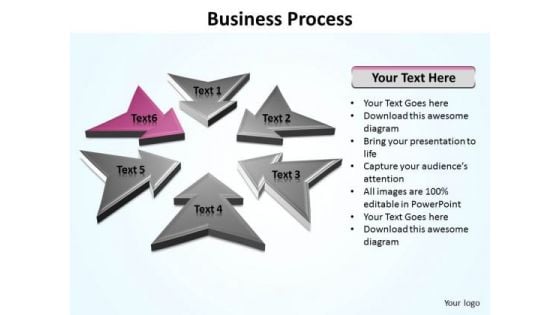
Ppt Direction Arrows Of World Business PowerPoint Templates Process Editable
PPT direction arrows of world business powerpoint templates process editable-Use this arrow diagram to make a brainstorming of the relevant factors that apply to you organization.Summarize with your own conclusions about information.-PPT direction arrows of world business powerpoint templates process editable-Abstract, Achievement, Aim, Arrow, Background, Business, Chart, Communication, Competition, Concept, Design, Direction, Development, Diagram, Direction, Finance, Financial, Forecast, Forward, Goal, Graph, Graphic, Growth, Icon, Illustration, Increase, Investment, Leader, Leadership, Design, Marketing, Price, Process, Profit, Progress, Progress, Shape, Sign, Success, Symbol, Target, Team, Teamwork With our Ppt Direction Arrows Of World Business PowerPoint Templates Process Editable you won't have to feel your way. They will strike a chord straightaway.
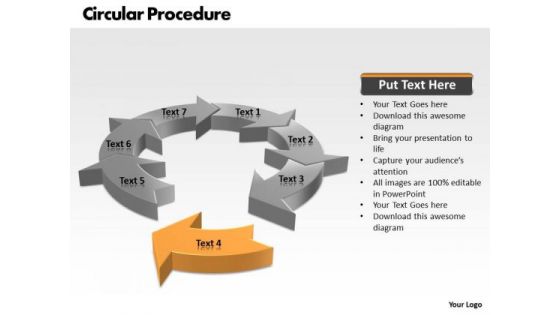
Ppt Layout Of PowerPoint Presentation Circular Procedure 7 Stage Templates
PPT layout of powerpoint presentation circular procedure 7 stage Templates-This PowerPoint Diagram represents controls and mechanisms. Use it to illustrate a stepwise process. This will increase the interest of the Audiences and thus will help them understand what you are trying to convey to them.-PPT layout of powerpoint presentation circular procedure 7 stage Templates-Arrow, Chart, Circular Procedure, Color, Colorful, Connect, Connection, Design, Diagram, Finance, Graphic, Group, Growth, Icon, Illustration, Marketing, Pieces, Process, Recycle, Recycling, Round, Set, Strategy, Symbol, Wheel Put in your every bit with our Ppt Layout Of PowerPoint Presentation Circular Procedure 7 Stage Templates. They will give it their all.
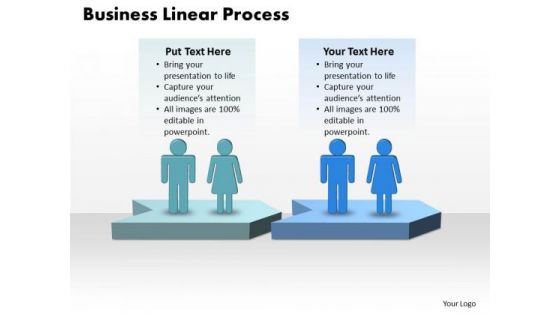
Ppt World Business Presentation Linear Process Diagram PowerPoint Templates
PPT world business presentation linear process diagram PowerPoint Templates-This Diagram is great for showing different departments in a company or different stages of a typical business process-PPT world business presentation linear process diagram PowerPoint Templates-Abstract, Achievement, Action, Arrows, Backgrounds, Business, Chart, Color, Competition, Computer, Concepts, Creative, Design, Different, Direction, Diversity, First, Forward, Graphics, Group, Growth, Icon, Ideas, Illustration, Isolated, Leader, Leadership, Line, Man, Motion, Moving, Pattern, People, Progress, Red, Render, Rendering, Shape, Sign, Solution, Strategy, Success, Symbol Economise on the time you have. Equip yourself with our Ppt World Business Presentation Linear Process Diagram PowerPoint Templates.
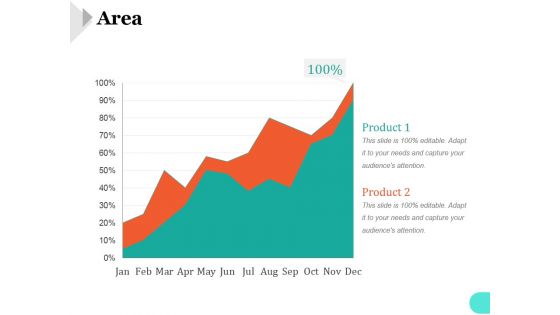
Area Ppt PowerPoint Presentation Themes
This is a area ppt powerpoint presentation themes. This is a two stage process. The stages in this process are area chart, management, growth, strategy, business.
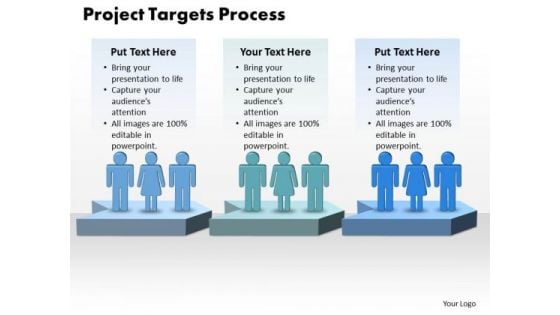
Ppt Project Targets Definition Process 3 Stages PowerPoint Templates
PPT project targets definition process 3 stages PowerPoint Templates-This Diagram is great for showing different departments in a company or different stages of a typical business process-PPT project targets definition process 3 stages PowerPoint Templates-Abstract, Achievement, Action, Arrows, Backgrounds, Business, Chart, Color, Competition, Computer, Concepts, Creative, Design, Different, Direction, Diversity, First, Forward, Graphics, Group, Growth, Icon, Ideas, Illustration, Isolated, Leader, Leadership, Line, Man, Motion, Moving, Pattern, People, Progress, Red, Render, Rendering, Shape, Sign, Solution, Strategy, Success, Symbol Acquire a feel for it all with our Ppt Project Targets Definition Process 3 Stages PowerPoint Templates. They put you in your comfort zone.
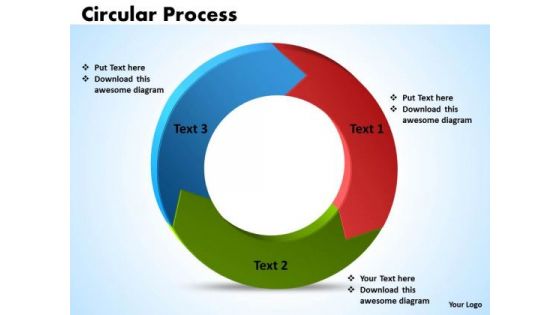
Ppt Circular PowerPoint Work Process Diagram 3 Phase Templates
PPT circular powerpoint work process diagram 3 phase Templates-This circular flow diagram might be used by a business organization to show how a specific series of exchanges of goods, services and payments make up the building blocks of a given economic system of interest.-PPT circular powerpoint work process diagram 3 phase Templates-Arrow, Chart, Circular, Color, Colorful, Connect, Connection, Design, Diagram, Finance, Graphic, Group, Growth, Icon, Illustration, Marketing, Pieces, Process, Recycle, Recycling, Round, Set, Strategy, Symbol, Wheel Set an example with your views. Place the bar with our Ppt Circular PowerPoint Work Process Diagram 3 Phase Templates.

 Home
Home