Heatmap Icon
Essential Phases To Simulate Data For Analysis Data Analytics SS V
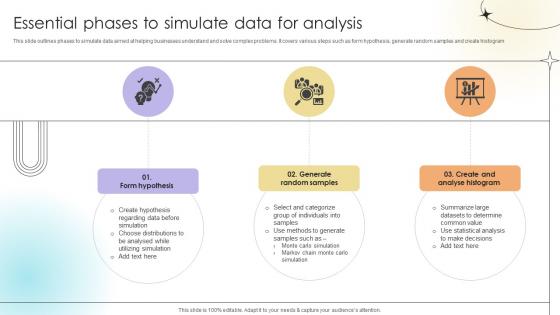
This slide outlines phases to simulate data aimed at helping businesses understand and solve complex problems. It covers various steps such as form hypothesis, generate random samples and create histogram.Here you can discover an assortment of the finest PowerPoint and Google Slides templates. With these templates, you can create presentations for a variety of purposes while simultaneously providing your audience with an eye-catching visual experience. Download Essential Phases To Simulate Data For Analysis Data Analytics SS V to deliver an impeccable presentation. These templates will make your job of preparing presentations much quicker, yet still, maintain a high level of quality. Slidegeeks has experienced researchers who prepare these templates and write high-quality content for you. Later on, you can personalize the content by editing the Essential Phases To Simulate Data For Analysis Data Analytics SS V. This slide outlines phases to simulate data aimed at helping businesses understand and solve complex problems. It covers various steps such as form hypothesis, generate random samples and create histogram.
Crowdsourcing Data Lifecycle Phases To Identify Risk Pictures Pdf
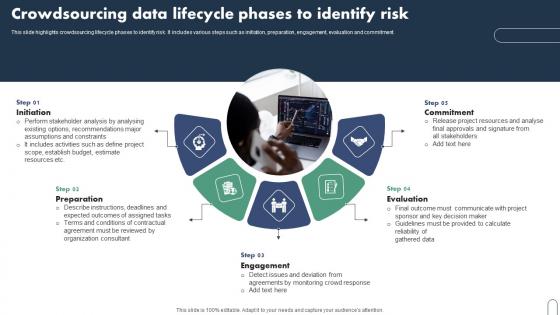
This slide highlights crowdsourcing lifecycle phases to identify risk. It includes various steps such as initiation, preparation, engagement, evaluation and commitment. Pitch your topic with ease and precision using this Crowdsourcing Data Lifecycle Phases To Identify Risk Pictures Pdf This layout presents information on Preparation, Engagement, Evaluation, Commitment It is also available for immediate download and adjustment. So, changes can be made in the color, design, graphics or any other component to create a unique layout. This slide highlights crowdsourcing lifecycle phases to identify risk. It includes various steps such as initiation, preparation, engagement, evaluation and commitment.
Risk Tracker Impact Ppt PowerPoint Presentation Outline Images
This is a risk tracker impact ppt powerpoint presentation outline images. This is a four stage process. The stages in this process are icons, management, strategy, analysis, marketing.
Customer Retention Impact Ppt PowerPoint Presentation Outline Slides
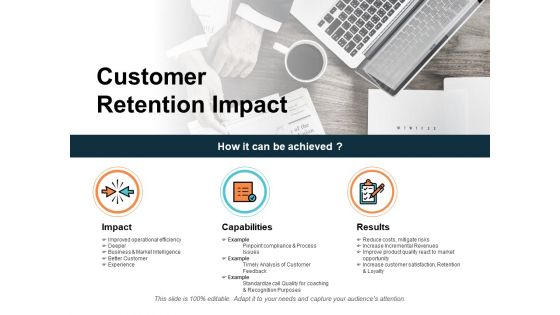
This is a customer retention impact ppt powerpoint presentation outline slides. This is a three stage process. The stages in this process are icons, management, strategy, analysis, marketing.
About Us Ppt PowerPoint Presentation Introduction
This is a about us ppt powerpoint presentation introduction. This is a four stage process. The stages in this process are business, marketing, management, icons, about us.
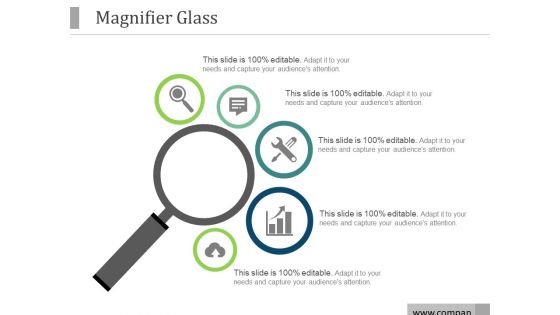
Magnifier Glass Ppt PowerPoint Presentation Ideas
This is a magnifier glass ppt powerpoint presentation ideas. This is a five stage process. The stages in this process are magnifier, icons, process, strategy, success.
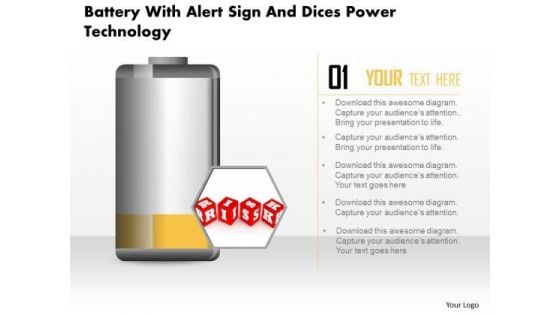
Business Diagram Battery With Alert Sign And Dices Power Technology PowerPoint Slide
This business diagram displays risk alert on battery icon. Use this diagram, in your presentations to display energy saving, battery and technology. Create professional presentations using this diagram slide.
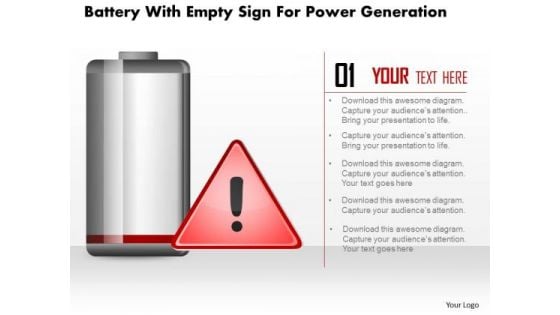
Business Diagram Battery With Empty Sign For Power Generation PowerPoint Slide
This business diagram displays empty sign alert on battery icon. Use this diagram, in your presentations to display energy saving, battery and technology. Create professional presentations using this diagram slide.

Threat Impact Management Plan Matrix Diagrams PDF
This slide covers the risk management matrix this prompts the team to identify risks, assess their potential impact, and devise mitigation strategies. It includes likelihood, metric, date , current value, etc. Presenting Threat Impact Management Plan Matrix Diagrams PDF to dispense important information. This template comprises eight stages. It also presents valuable insights into the topics including Metric, Action Plan, System. This is a completely customizable PowerPoint theme that can be put to use immediately. So, download it and address the topic impactfully.
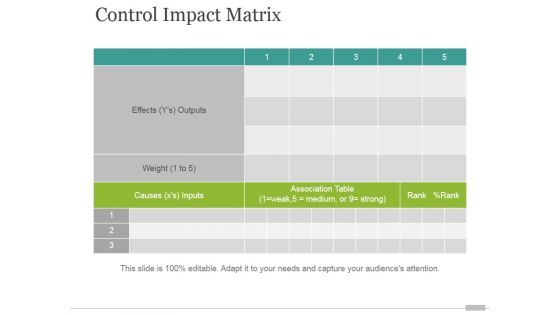
Control Impact Matrix Ppt PowerPoint Presentation Themes
This is a control impact matrix ppt powerpoint presentation themes. This is a five stage process. The stages in this process are effects, weight, causes inputs, association table, rank.
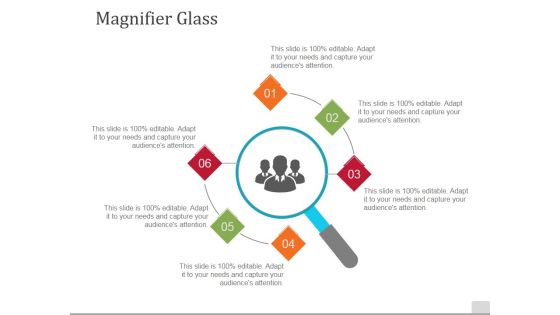
Magnifier Glass Ppt PowerPoint Presentation Infographic Template Sample
This is a magnifier glass ppt powerpoint presentation infographic template sample. This is a six stage process. The stages in this process are magnifier glass, icon, business, technology, marketing.
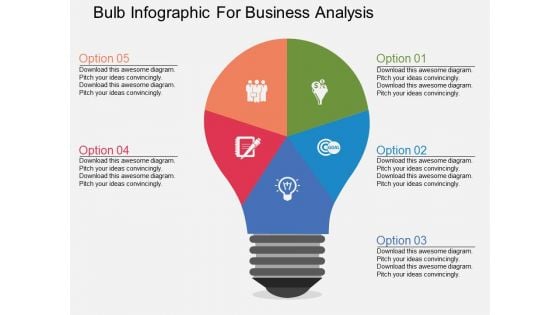
Bulb Infographic For Business Analysis Powerpoint Templates
This PowerPoint slide contains graphics of bulb diagram with icons. It helps to exhibit concepts of marketing strategy. Use this diagram to impart more clarity to data and to create more sound impact on viewers.
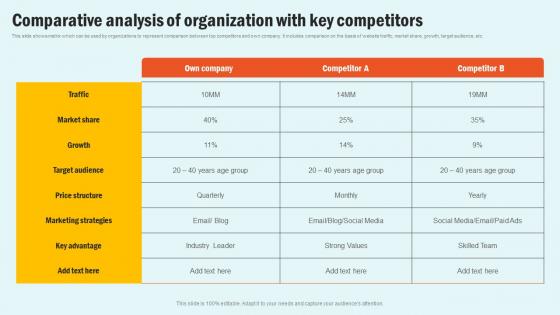
Comparative Analysis Organization Enhancing Website Performance With Search Engine Content Themes Pdf
This slide shows matrix which can be used by organizations to represent comparison between top competitors and own company. It includes comparison on the basis of website traffic, market share, growth, target audience, etc. Slidegeeks is here to make your presentations a breeze with Comparative Analysis Organization Enhancing Website Performance With Search Engine Content Themes Pdf With our easy to use and customizable templates, you can focus on delivering your ideas rather than worrying about formatting. With a variety of designs to choose from, you are sure to find one that suits your needs. And with animations and unique photos, illustrations, and fonts, you can make your presentation pop. So whether you are giving a sales pitch or presenting to the board, make sure to check out Slidegeeks first This slide shows matrix which can be used by organizations to represent comparison between top competitors and own company. It includes comparison on the basis of website traffic, market share, growth, target audience, etc.
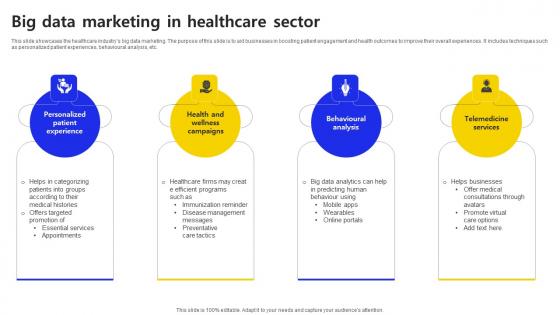
Big Data Marketing In Healthcare Sector Ppt Outline Themes PDF
This slide showcases the healthcare industrys big data marketing. The purpose of this slide is to aid businesses in boosting patient engagement and health outcomes to improve their overall experiences. It includes techniques such as personalized patient experiences, behavioural analysis, etc. Pitch your topic with ease and precision using this Big Data Marketing In Healthcare Sector Ppt Outline Themes PDF. This layout presents information on Techniques, Personalized Patient Experiences, Behavioural Analysis. It is also available for immediate download and adjustment. So, changes can be made in the color, design, graphics or any other component to create a unique layout. This slide showcases the healthcare industrys big data marketing. The purpose of this slide is to aid businesses in boosting patient engagement and health outcomes to improve their overall experiences. It includes techniques such as personalized patient experiences, behavioural analysis, etc.
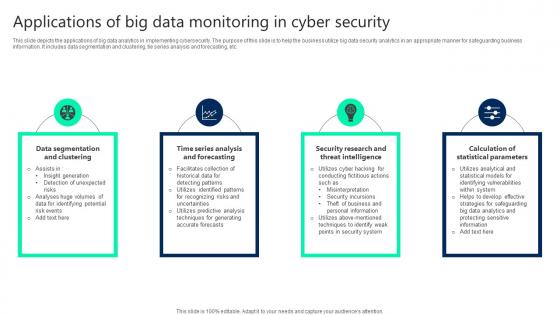
Applications Of Big Data Monitoring In Cyber Security Themes pdf
This slide depicts the applications of big data analytics in implementing cybersecurity. The purpose of this slide is to help the business utilize big data security analytics in an appropriate manner for safeguarding business information. It includes data segmentation and clustering, tie series analysis and forecasting, etc. Pitch your topic with ease and precision using this Applications Of Big Data Monitoring In Cyber Security Themes pdf. This layout presents information on Data Segmentation, Security Research, Threat Intelligence. It is also available for immediate download and adjustment. So, changes can be made in the color, design, graphics or any other component to create a unique layout. This slide depicts the applications of big data analytics in implementing cybersecurity. The purpose of this slide is to help the business utilize big data security analytics in an appropriate manner for safeguarding business information. It includes data segmentation and clustering, tie series analysis and forecasting, etc.

Impact Of Data Integration Process On Organizations Data Integration Strategies For Business
This slide discusses the effects of the data integration process in an organization. The purpose of this slide is to explain the impact of data integration in terms of decision-making, cost efficiency, time-saving, increasing productivity, customer satisfaction, and competitive advancement. Do you know about Slidesgeeks Impact Of Data Integration Process On Organizations Data Integration Strategies For Business These are perfect for delivering any kind od presentation. Using it, create PowerPoint presentations that communicate your ideas and engage audiences. Save time and effort by using our pre-designed presentation templates that are perfect for a wide range of topic. Our vast selection of designs covers a range of styles, from creative to business, and are all highly customizable and easy to edit. Download as a PowerPoint template or use them as Google Slides themes. This slide discusses the effects of the data integration process in an organization. The purpose of this slide is to explain the impact of data integration in terms of decision-making, cost efficiency, time-saving, increasing productivity, customer satisfaction, and competitive advancement.
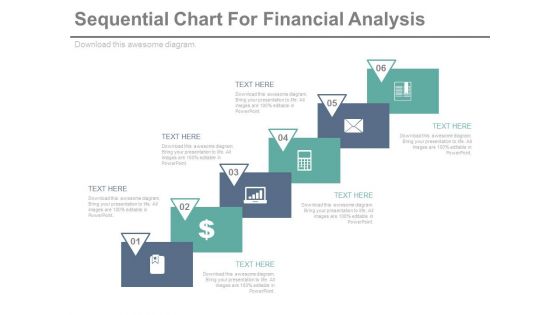
Sequential Steps Chart For Data Analysis Powerpoint Slides
This PowerPoint template has been designed sequential steps chart with icons. This PPT slide can be used to display corporate level financial strategy. You can download finance PowerPoint template to prepare awesome presentations.
Magnifying Glass Ppt PowerPoint Presentation Infographic Template Example Topics
This is a magnifying glass ppt powerpoint presentation infographic template example topics. This is a five stage process. The stages in this process are magnifying glass, icons, business, marketing, management.
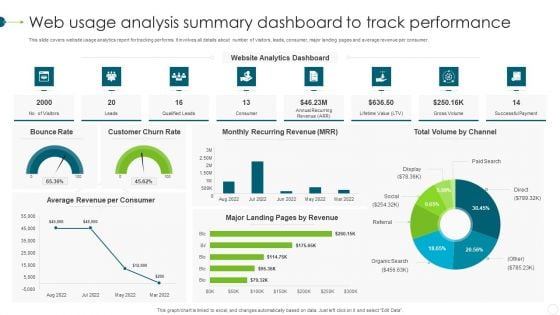
Web Usage Analysis Summary Dashboard To Track Performance Background PDF
This slide covers website usage analytics report for tracking performs. It involves all details about number of visitors, leads, consumer, major landing pages and average revenue per consumer. Showcasing this set of slides titled Web Usage Analysis Summary Dashboard To Track Performance Background PDF. The topics addressed in these templates are Customer Churn Rate, Bounce Rate, Monthly Recurring Revenue. All the content presented in this PPT design is completely editable. Download it and make adjustments in color, background, font etc. as per your unique business setting.
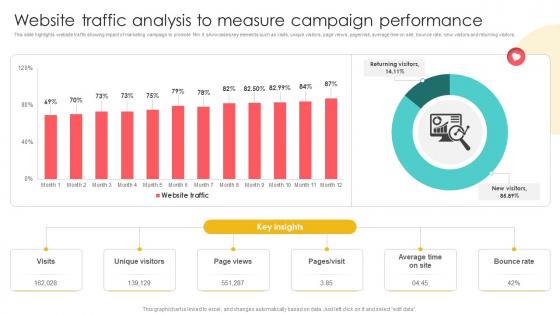
Marketing Channels For Movie Website Traffic Analysis To Measure Campaign Performance Strategy SS V
This slide highlights website traffic showing impact of marketing campaign to promote film. It showcases key elements such as visits, unique visitors, page views, page or visit, average time on site, bounce rate, new visitors and returning visitors. Are you searching for a Marketing Channels For Movie Website Traffic Analysis To Measure Campaign Performance Strategy SS V that is uncluttered, straightforward, and original Its easy to edit, and you can change the colors to suit your personal or business branding. For a presentation that expresses how much effort you have put in, this template is ideal With all of its features, including tables, diagrams, statistics, and lists, its perfect for a business plan presentation. Make your ideas more appealing with these professional slides. Download Marketing Channels For Movie Website Traffic Analysis To Measure Campaign Performance Strategy SS V from Slidegeeks today. This slide highlights website traffic showing impact of marketing campaign to promote film. It showcases key elements such as visits, unique visitors, page views, page or visit, average time on site, bounce rate, new visitors and returning visitors.
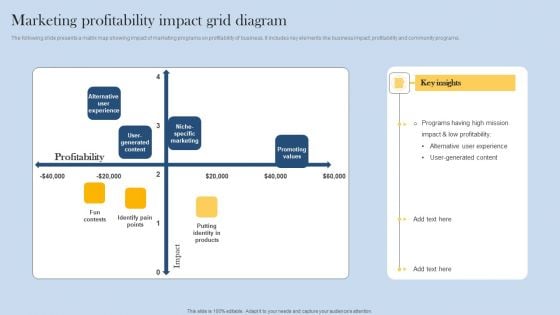
Marketing Profitability Impact Grid Diagram Ideas PDF
The following slide presents a matrix map showing impact of marketing programs on profitability of business. It includes key elements like business impact, profitability and community programs. Presenting Marketing Profitability Impact Grid Diagram Ideas PDF to dispense important information. This template comprises one stages. It also presents valuable insights into the topics including Profitability, Promoting Values, Niche Specific Marketing. This is a completely customizable PowerPoint theme that can be put to use immediately. So, download it and address the topic impactfully.
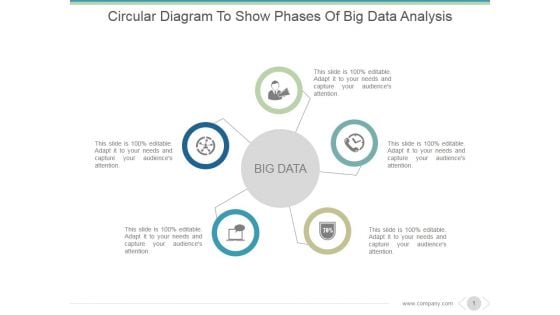
Circular Diagram To Show Phases Of Big Data Analysis Ppt PowerPoint Presentation Infographic Template
This is a circular diagram to show phases of big data analysis ppt powerpoint presentation infographic template. This is a five stage process. The stages in this process are big data, icons, management, strategy, business.
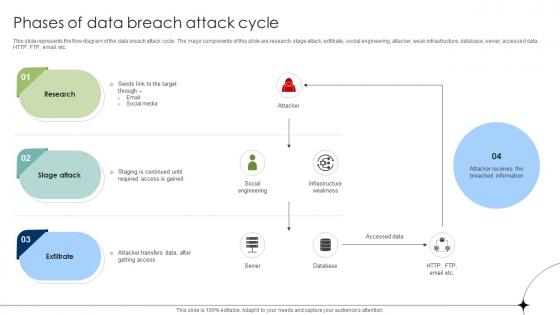
Phases Of Data Breach Attack Cycle Data Fortification Strengthening Defenses
This slide represents the flow diagram of the data breach attack cycle. The major components of this slide are research, stage attack, exfiltrate, social engineering, attacker, weak infrastructure, database, server, accessed data, HTTP, FTP, email, etc. Do you know about Slidesgeeks Phases Of Data Breach Attack Cycle Data Fortification Strengthening Defenses These are perfect for delivering any kind od presentation. Using it, create PowerPoint presentations that communicate your ideas and engage audiences. Save time and effort by using our pre-designed presentation templates that are perfect for a wide range of topic. Our vast selection of designs covers a range of styles, from creative to business, and are all highly customizable and easy to edit. Download as a PowerPoint template or use them as Google Slides themes. This slide represents the flow diagram of the data breach attack cycle. The major components of this slide are research, stage attack, exfiltrate, social engineering, attacker, weak infrastructure, database, server, accessed data, HTTP, FTP, email, etc.
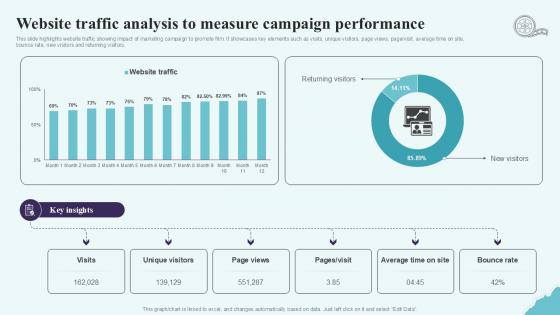
Website Traffic Analysis To Measure Strategic Plan To Increase Film Ppt Example Strategy SS V
This slide highlights website traffic showing impact of marketing campaign to promote film. It showcases key elements such as visits, unique visitors, page views, pageorvisit, average time on site, bounce rate, new visitors and returning visitors. Welcome to our selection of the Website Traffic Analysis To Measure Strategic Plan To Increase Film Ppt Example Strategy SS V. These are designed to help you showcase your creativity and bring your sphere to life. Planning and Innovation are essential for any business that is just starting out. This collection contains the designs that you need for your everyday presentations. All of our PowerPoints are 100Percent editable, so you can customize them to suit your needs. This multi-purpose template can be used in various situations. Grab these presentation templates today. This slide highlights website traffic showing impact of marketing campaign to promote film. It showcases key elements such as visits, unique visitors, page views, pageorvisit, average time on site, bounce rate, new visitors and returning visitors.
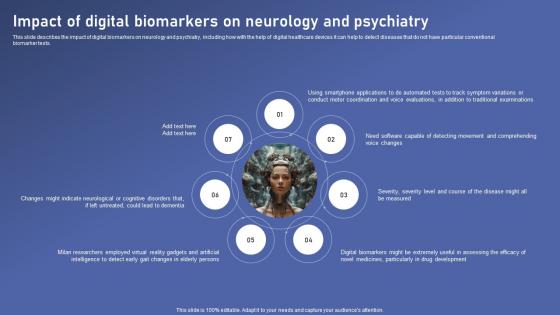
Impact Of Digital Biomarkers Biomedical Data Science And Health Informatics Slides Pdf
This slide describes the impact of digital biomarkers on neurology and psychiatry, including how with the help of digital healthcare devices it can help to detect diseases that do not have particular conventional biomarker tests. Retrieve professionally designed Impact Of Digital Biomarkers Biomedical Data Science And Health Informatics Slides Pdf to effectively convey your message and captivate your listeners. Save time by selecting pre made slideshows that are appropriate for various topics, from business to educational purposes. These themes come in many different styles, from creative to corporate, and all of them are easily adjustable and can be edited quickly. Access them as PowerPoint templates or as Google Slides themes. You do not have to go on a hunt for the perfect presentation because Slidegeeks got you covered from everywhere. This slide describes the impact of digital biomarkers on neurology and psychiatry, including how with the help of digital healthcare devices it can help to detect diseases that do not have particular conventional biomarker tests.
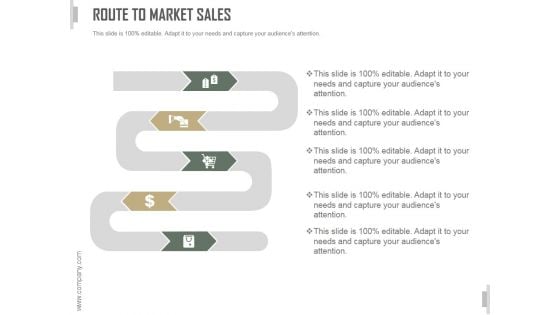
Route To Market Sales Ppt PowerPoint Presentation Show
This is a route to market sales ppt powerpoint presentation show. This is a five stage process. The stages in this process are business, strategy, marketing, analysis, zig zig, icons.
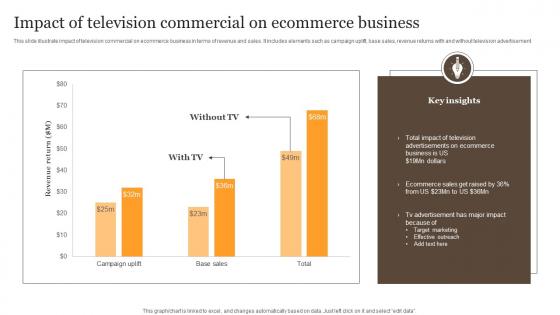
Impact Of Television Commercial On Ecommerce Business Diagrams Pdf
This slide illustrate impact of television commercial on ecommerce business in terms of revenue and sales. It includes elements such as campaign uplift, base sales, revenue returns with and without television advertisement Pitch your topic with ease and precision using this Impact Of Television Commercial On Ecommerce Business Diagrams Pdf. This layout presents information on Insights, Ecommerce, Business. It is also available for immediate download and adjustment. So, changes can be made in the color, design, graphics or any other component to create a unique layout. This slide illustrate impact of television commercial on ecommerce business in terms of revenue and sales. It includes elements such as campaign uplift, base sales, revenue returns with and without television advertisement
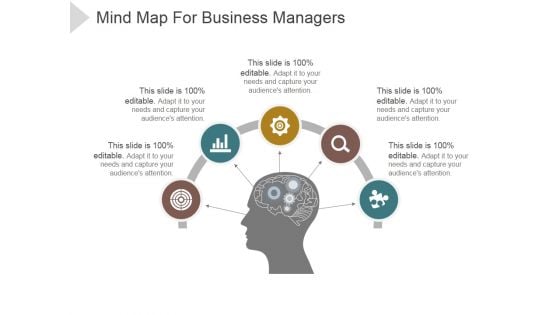
Mind Map For Business Managers Ppt PowerPoint Presentation Background Image
This is a mind map for business managers ppt powerpoint presentation background image. This is a five stage process. The stages in this process are mind, idea, icons, planning, business.
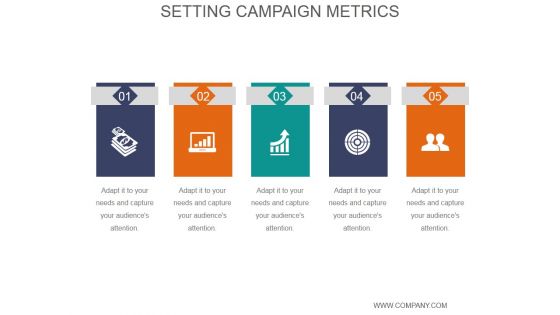
Setting Campaign Metrics Ppt PowerPoint Presentation Slide Download
This is a setting campaign metrics ppt powerpoint presentation slide download. This is a five stage process. The stages in this process are icons, process, strategy, business, marketing, management.
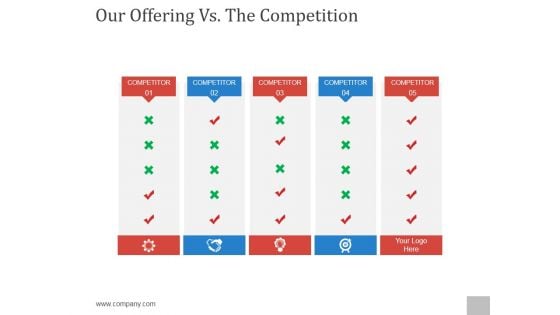
Our Offering Vs The Competition Ppt PowerPoint Presentation Images
This is a our offering vs the competition ppt powerpoint presentation images. This is a five stage process. The stages in this process are icon, tick, right, wrong, table.
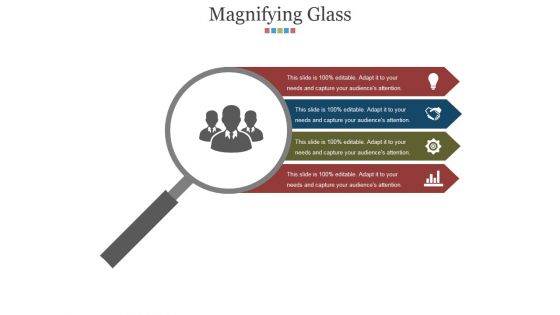
Magnifying Glass Ppt PowerPoint Presentation Model Designs Download
This is a magnifying glass ppt powerpoint presentation model designs download. This is a four stage process. The stages in this process are business, icons, magnifier glass, search, marketing.
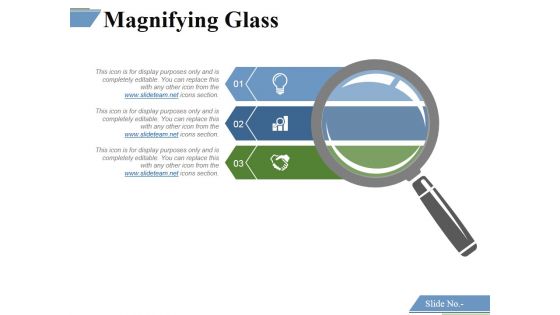
Magnifying Glass Ppt PowerPoint Presentation Outline Background Image
This is a magnifying glass ppt powerpoint presentation outline background image. This is a three stage process. The stages in this process are magnifying glass, icons, success, strategy, business.
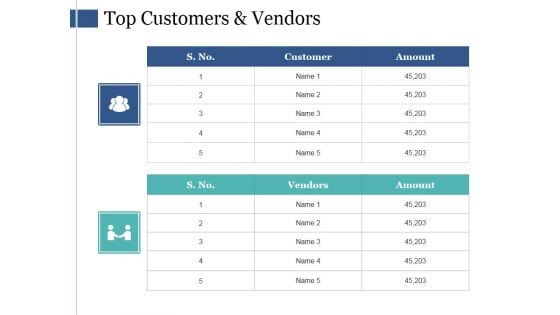
Top Customers And Vendors Ppt PowerPoint Presentation Ideas Designs
This is a top customers and vendors ppt powerpoint presentation ideas designs. This is a two stage process. The stages in this process are customer, vendors, amount, shape, icons.
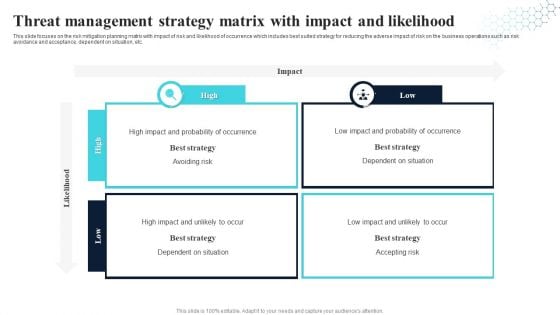
Threat Management Strategy Matrix With Impact And Likelihood Themes PDF
This slide focuses on the risk mitigation planning matrix with impact of risk and likelihood of occurrence which includes best suited strategy for reducing the adverse impact of risk on the business operations such as risk avoidance and acceptance, dependent on situation, etc. Presenting Threat Management Strategy Matrix With Impact And Likelihood Themes PDF to dispense important information. This template comprises four stages. It also presents valuable insights into the topics including High, Low, Best Strategy. This is a completely customizable PowerPoint theme that can be put to use immediately. So, download it and address the topic impactfully.
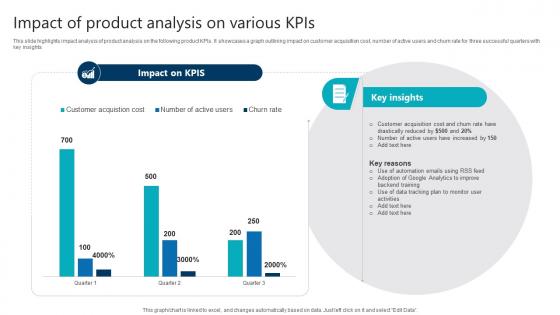
Impact Of Product Analysis On Various Kpis Product Analytics Implementation Data Analytics V
This slide highlights impact analysis of product analysis on the following product KPIs. It showcases a graph outlining impact on customer acquisition cost, number of active users and churn rate for three successful quarters with key insights Are you searching for a Impact Of Product Analysis On Various Kpis Product Analytics Implementation Data Analytics V that is uncluttered, straightforward, and original Its easy to edit, and you can change the colors to suit your personal or business branding. For a presentation that expresses how much effort you have put in, this template is ideal With all of its features, including tables, diagrams, statistics, and lists, its perfect for a business plan presentation. Make your ideas more appealing with these professional slides. Download Impact Of Product Analysis On Various Kpis Product Analytics Implementation Data Analytics V from Slidegeeks today. This slide highlights impact analysis of product analysis on the following product KPIs. It showcases a graph outlining impact on customer acquisition cost, number of active users and churn rate for three successful quarters with key insights
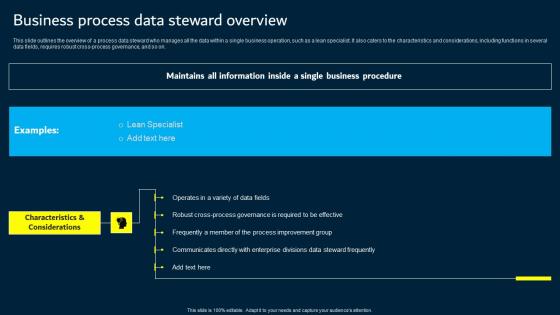
Business Process Data Steward Overview Data Custodianship Themes Pdf
This slide outlines the overview of a process data steward who manages all the data within a single business operation, such as a lean specialist. It also caters to the characteristics and considerations, including functions in several data fields, requires robust cross process governance, and so on. This Business Process Data Steward Overview Data Custodianship Themes Pdf is perfect for any presentation, be it in front of clients or colleagues. It is a versatile and stylish solution for organizing your meetings. The Business Process Data Steward Overview Data Custodianship Themes Pdf features a modern design for your presentation meetings. The adjustable and customizable slides provide unlimited possibilities for acing up your presentation. Slidegeeks has done all the homework before launching the product for you. So, do not wait, grab the presentation templates today This slide outlines the overview of a process data steward who manages all the data within a single business operation, such as a lean specialist. It also caters to the characteristics and considerations, including functions in several data fields, requires robust cross process governance, and so on.
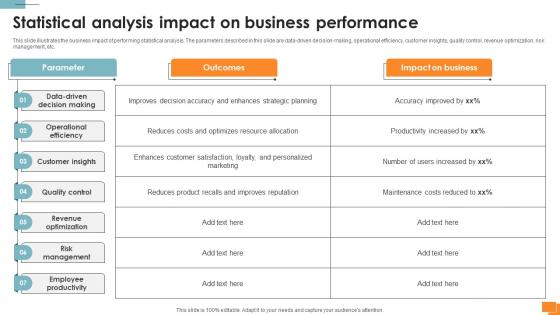
Statistical Tools For Evidence Statistical Analysis Impact On Business Performance
This slide illustrates the business impact of performing statistical analysis. The parameters described in this slide are data-driven decision-making, operational efficiency, customer insights, quality control, revenue optimization, risk management, etc. Do you know about Slidesgeeks Statistical Tools For Evidence Statistical Analysis Impact On Business Performance These are perfect for delivering any kind od presentation. Using it, create PowerPoint presentations that communicate your ideas and engage audiences. Save time and effort by using our pre-designed presentation templates that are perfect for a wide range of topic. Our vast selection of designs covers a range of styles, from creative to business, and are all highly customizable and easy to edit. Download as a PowerPoint template or use them as Google Slides themes. This slide illustrates the business impact of performing statistical analysis. The parameters described in this slide are data-driven decision-making, operational efficiency, customer insights, quality control, revenue optimization, risk management, etc.
Customer Focus In Tqm Ppt PowerPoint Presentation Portfolio Graphic Images
This is a Customer Focus In Tqm Ppt PowerPoint Presentation Portfolio Graphic Images. This is a six stage process. The stages in this process are business, icons, marketing, strategy, analysis.
Magnifying Glass Employee Value Proposition Ppt PowerPoint Presentation Layouts Graphics Template
This is a magnifying glass employee value proposition ppt powerpoint presentation layouts graphics template. This is a four stage process. The stages in this process are business, management, strategy, analysis, icons.
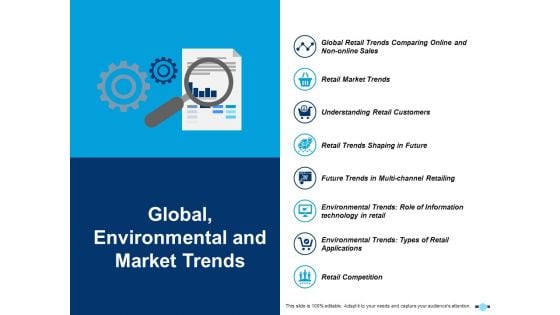
Global Environmental And Market Trends Retail Market Trends Ppt PowerPoint Presentation Styles Information
This is a global environmental and market trends retail market trends ppt powerpoint presentation styles information. This is a eight stage process. The stages in this process are icons, management, strategy, analysis, marketing.

Magnifying Glass Testing Ppt PowerPoint Presentation Infographics Layout Ideas
This is a magnifying glass testing ppt powerpoint presentation infographics layout ideas. This is a five stage process. The stages in this process are technology, icons, strategy, analysis, marketing.
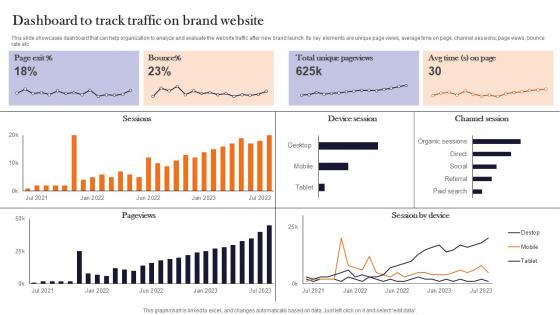
Dashboard To Track Traffic On Brand Website Product Advertising And Positioning Diagrams Pdf
This slide showcases dashboard that can help organization to analyze and evaluate the website traffic after new brand launch. Its key elements are unique page views, average time on page, channel sessions, page views, bounce rate etc. Are you in need of a template that can accommodate all of your creative concepts This one is crafted professionally and can be altered to fit any style. Use it with Google Slides or PowerPoint. Include striking photographs, symbols, depictions, and other visuals. Fill, move around, or remove text boxes as desired. Test out color palettes and font mixtures. Edit and save your work, or work with colleagues. Download Dashboard To Track Traffic On Brand Website Product Advertising And Positioning Diagrams Pdf and observe how to make your presentation outstanding. Give an impeccable presentation to your group and make your presentation unforgettable. This slide showcases dashboard that can help organization to analyze and evaluate the website traffic after new brand launch. Its key elements are unique page views, average time on page, channel sessions, page views, bounce rate etc.
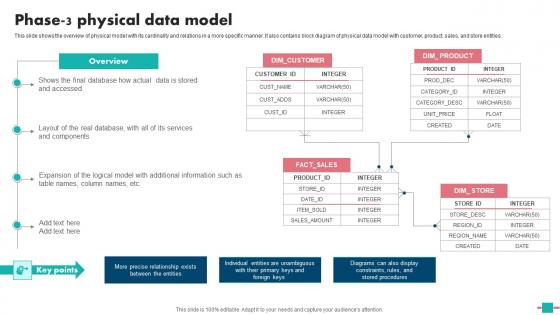
Database Modeling Phase 3 Physical Data Model Graphics Pdf
This slide shows the overview of physical model with its cardinality and relations in a more specific manner. It also contains block diagram of physical data model with customer, product, sales, and store entities. Make sure to capture your audiences attention in your business displays with our gratis customizable Database Modeling Phase 3 Physical Data Model Graphics Pdf. These are great for business strategies, office conferences, capital raising or task suggestions. If you desire to acquire more customers for your tech business and ensure they stay satisfied, create your own sales presentation with these plain slides. This slide shows the overview of physical model with its cardinality and relations in a more specific manner. It also contains block diagram of physical data model with customer, product, sales, and store entities.
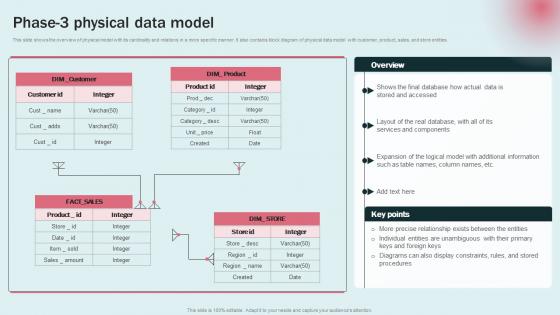
Phase 3 Physical Data Model Data Modeling Approaches For Modern Analytics Pictures Pdf
This slide shows the overview of physical model with its cardinality and relations in a more specific manner. It also contains block diagram of physical data model with customer, product, sales, and store entities. qExplore a selection of the finest Phase 3 Physical Data Model Data Modeling Approaches For Modern Analytics Pictures Pdf here. With a plethora of professionally designed and pre made slide templates, you can quickly and easily find the right one for your upcoming presentation. You can use our Phase 3 Physical Data Model Data Modeling Approaches For Modern Analytics Pictures Pdf to effectively convey your message to a wider audience. Slidegeeks has done a lot of research before preparing these presentation templates. The content can be personalized and the slides are highly editable. Grab templates today from Slidegeeks. This slide shows the overview of physical model with its cardinality and relations in a more specific manner. It also contains block diagram of physical data model with customer, product, sales, and store entities.
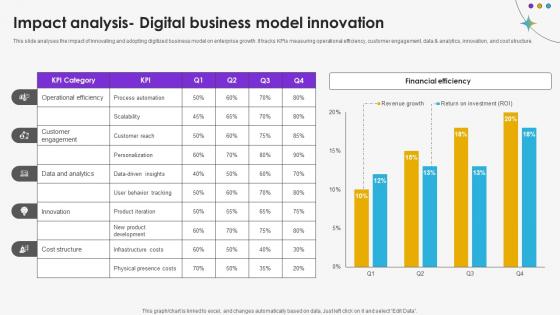
Impact Analysis Digital Business Model Innovation DT SS V
This slide analyses the impact of innovating and adopting digitized business model on enterprise growth. It tracks KPIs measuring operational efficiency, customer engagement, data and analytics, innovation, and cost structure.Do you have an important presentation coming up Are you looking for something that will make your presentation stand out from the rest Look no further than Impact Analysis Digital Business Model Innovation DT SS V. With our professional designs, you can trust that your presentation will pop and make delivering it a smooth process. And with Slidegeeks, you can trust that your presentation will be unique and memorable. So why wait Grab Impact Analysis Digital Business Model Innovation DT SS V today and make your presentation stand out from the rest. This slide analyses the impact of innovating and adopting digitized business model on enterprise growth. It tracks KPIs measuring operational efficiency, customer engagement, data and analytics, innovation, and cost structure.
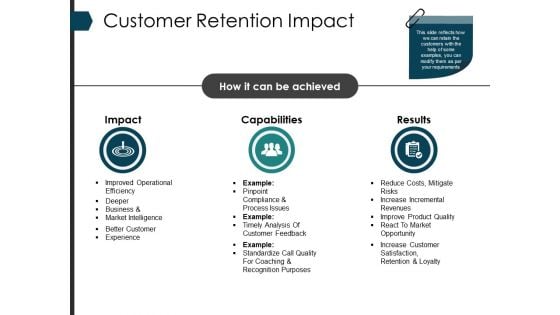
Customer Retention Impact Ppt PowerPoint Presentation Pictures Slide Download
This is a customer retention impact ppt powerpoint presentation pictures slide download. This is a three stage process. The stages in this process are impact, capabilities, results, business, icons.
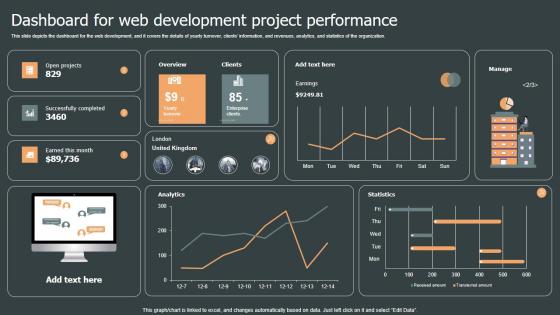
Dashboard For Web Development Role Web Designing User Engagement Topics PDF
This slide depicts the dashboard for the web development, and it covers the details of yearly turnover, clients information, and revenues, analytics, and statistics of the organization. There are so many reasons you need a Dashboard For Web Development Role Web Designing User Engagement Topics PDF. The first reason is you can not spend time making everything from scratch, Thus, Slidegeeks has made presentation templates for you too. You can easily download these templates from our website easily. This slide depicts the dashboard for the web development, and it covers the details of yearly turnover, clients information, and revenues, analytics, and statistics of the organization.
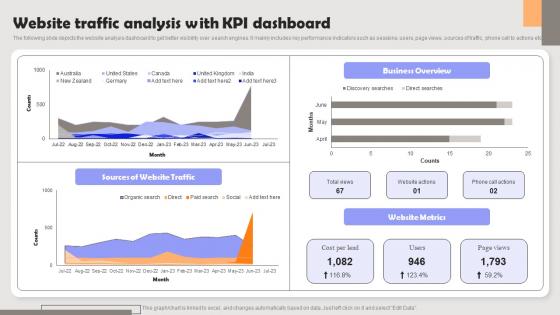
Improving PPC Campaign Results Website Traffic Analysis With KPI Formats Pdf
The following slide depicts the website analysis dashboard to get better visibility over search engines. It mainly includes key performance indicators such as sessions, users, page views, sources of traffic, phone call to actions etc. Create an editable Improving PPC Campaign Results Website Traffic Analysis With KPI Formats Pdf that communicates your idea and engages your audience. Whether you are presenting a business or an educational presentation, pre-designed presentation templates help save time. Improving PPC Campaign Results Website Traffic Analysis With KPI Formats Pdf is highly customizable and very easy to edit, covering many different styles from creative to business presentations. Slidegeeks has creative team members who have crafted amazing templates. So, go and get them without any delay. The following slide depicts the website analysis dashboard to get better visibility over search engines. It mainly includes key performance indicators such as sessions, users, page views, sources of traffic, phone call to actions etc.
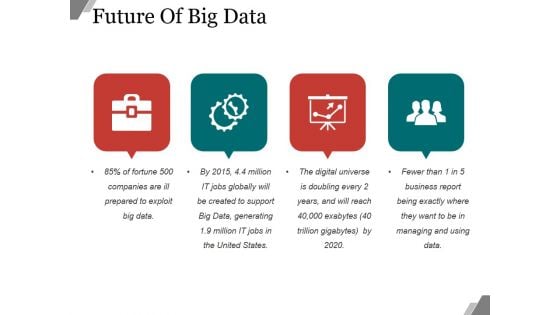
Future Of Big Data Ppt PowerPoint Presentation Model
This is a future of big data ppt powerpoint presentation model. This is a four stage process. The stages in this process are icons, business, marketing, technology, big data.
Magnifying Glass For Business Research Ppt PowerPoint Presentation Styles
This is a magnifying glass for business research ppt powerpoint presentation styles. This is a five stage process. The stages in this process are gears, technology, icons, search, magnify.
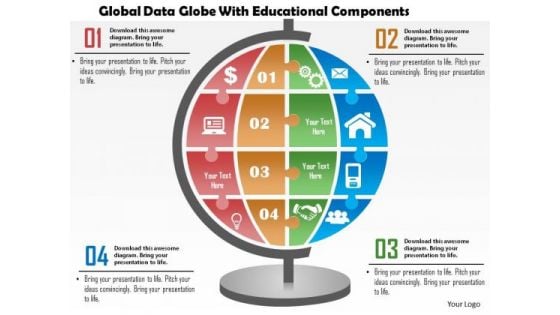
Business Diagram Global Data Globe With Educational Components Presentation Template
This business diagram has been designed with graphic of globe with icons. Use our diagram slide to organize data and to display data analysis. This diagram is suitable for global business and marketing related presentations.
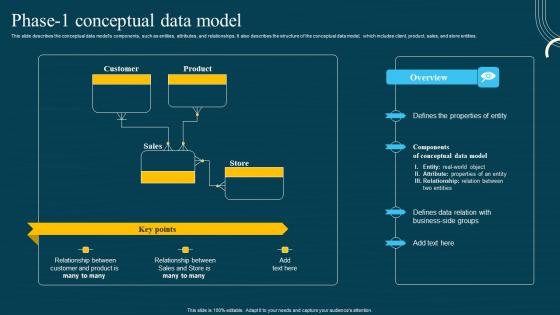
Database Modeling Structures Phase 1 Conceptual Data Model Information Pdf
This slide describes the conceptual data models components, such as entities, attributes, and relationships. It also describes the structure of the conceptual data model, which includes client, product, sales, and store entities. Find a pre-designed and impeccable Database Modeling Structures Phase 1 Conceptual Data Model Information Pdf. The templates can ace your presentation without additional effort. You can download these easy-to-edit presentation templates to make your presentation stand out from others. So, what are you waiting for Download the template from Slidegeeks today and give a unique touch to your presentation. This slide describes the conceptual data models components, such as entities, attributes, and relationships. It also describes the structure of the conceptual data model, which includes client, product, sales, and store entities.
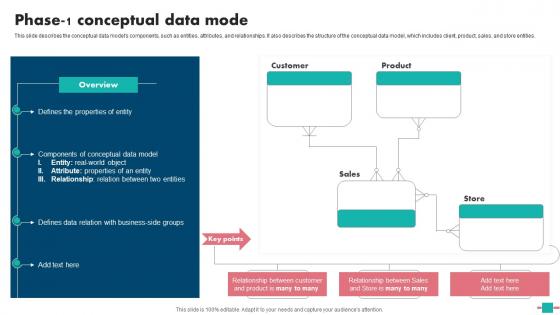
Database Modeling Phase 1 Conceptual Data Mode Formats Pdf
This slide describes the conceptual data models components, such as entities, attributes, and relationships. It also describes the structure of the conceptual data model, which includes client, product, sales, and store entities. Are you in need of a template that can accommodate all of your creative concepts This one is crafted professionally and can be altered to fit any style. Use it with Google Slides or PowerPoint. Include striking photographs, symbols, depictions, and other visuals. Fill, move around, or remove text boxes as desired. Test out color palettes and font mixtures. Edit and save your work, or work with colleagues. Download Database Modeling Phase 1 Conceptual Data Mode Formats Pdf and observe how to make your presentation outstanding. Give an impeccable presentation to your group and make your presentation unforgettable. This slide describes the conceptual data models components, such as entities, attributes, and relationships. It also describes the structure of the conceptual data model, which includes client, product, sales, and store entities.
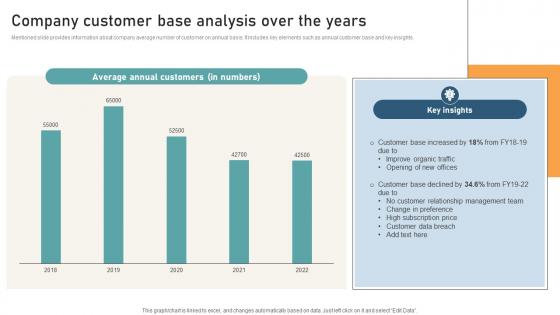
Comprehensive Guide For Website Company Customer Base Analysis Over The Years
Mentioned slide provides information about company average number of customer on annual basis. It includes key elements such as annual customer base and key insights. If your project calls for a presentation, then Slidegeeks is your go-to partner because we have professionally designed, easy-to-edit templates that are perfect for any presentation. After downloading, you can easily edit Comprehensive Guide For Website Company Customer Base Analysis Over The Years and make the changes accordingly. You can rearrange slides or fill them with different images. Check out all the handy templates Mentioned slide provides information about company average number of customer on annual basis. It includes key elements such as annual customer base and key insights.

Cloud Computing Project Analysis Diagram Powerpoint Template
Our above PPT slide contains graphics of cloud with technology icons. This PowerPoint template may be used for project related to cloud computing. Use this diagram to impart more clarity to data and to create more sound impact on viewers.
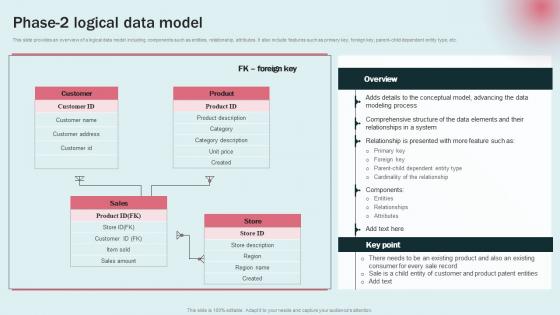
Phase 2 Logical Data Model Data Modeling Approaches For Modern Analytics Elements Pdf
This slide provides an overview of a logical data model including components such as entities, relationship, attributes. It also include features such as primary key, foreign key, parent child dependent entity type, etc. Welcome to our selection of the Phase 2 Logical Data Model Data Modeling Approaches For Modern Analytics Elements Pdf. These are designed to help you showcase your creativity and bring your sphere to life. Planning and Innovation are essential for any business that is just starting out. This collection contains the designs that you need for your everyday presentations. All of our PowerPoints are 100 percent editable, so you can customize them to suit your needs. This multi purpose template can be used in various situations. Grab these presentation templates today This slide provides an overview of a logical data model including components such as entities, relationship, attributes. It also include features such as primary key, foreign key, parent child dependent entity type, etc.

Marketers Guide To Data Analysis Optimization Introduction To Website Landing Page Analytics To Increase Portrait PDF
This slide covers an overview of web landing page analysis. It also includes steps for analyzing landing page performance, such as creating a tempting offer or launching a new website page, creating a campaign, analyzing data, and making changes to enhance performance. Retrieve professionally designed Marketers Guide To Data Analysis Optimization Introduction To Website Landing Page Analytics To Increase Portrait PDF to effectively convey your message and captivate your listeners. Save time by selecting pre made slideshows that are appropriate for various topics, from business to educational purposes. These themes come in many different styles, from creative to corporate, and all of them are easily adjustable and can be edited quickly. Access them as PowerPoint templates or as Google Slides themes. You do not have to go on a hunt for the perfect presentation because Slidegeeks got you covered from everywhere.

Risk Matrix Chart With Likelihood And Impact Ppt Layouts PDF
Persuade your audience using this risk matrix chart with likelihood and impact ppt layouts pdf. This PPT design covers three stages, thus making it a great tool to use. It also caters to a variety of topics including risk matrix chart with likelihood and impact. Download this PPT design now to present a convincing pitch that not only emphasizes the topic but also showcases your presentation skills.
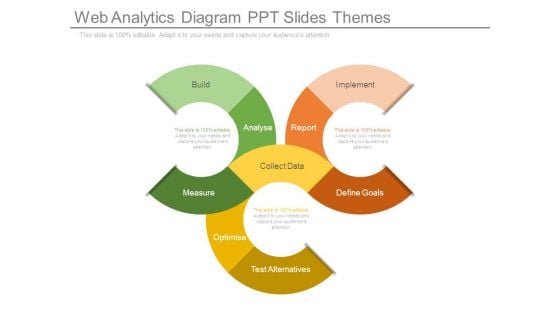
Web Analytics Diagram Ppt Slides Themes
This is a web analytics diagram ppt slides themes. This is a three stage process. The stages in this process are build, analyse, measure, test alternatives, optimise, collect data, define goals, report, implement.
Personal Data Visualization On Computer Screen Ppt PowerPoint Presentation Show Layout Ideas
Presenting this set of slides with name personal data visualization on computer screen ppt powerpoint presentation show layout ideas. This is a one stage process. The stages in this process are data visualization icon, research analysis, business focus. This is a completely editable PowerPoint presentation and is available for immediate download. Download now and impress your audience.


 Continue with Email

 Home
Home


