Heatmap Icon
Dashboard To Track Traffic Maximizing Sales Via Online Brand Marketing Strategies Portrait Pdf
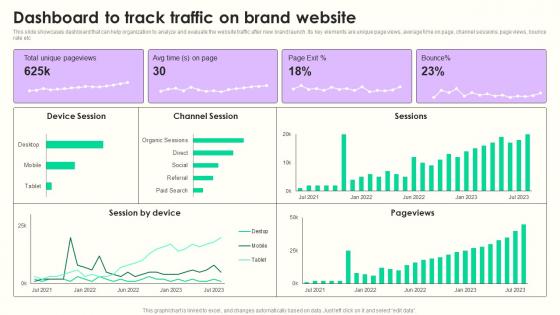
This slide showcases dashboard that can help organization to analyze and evaluate the website traffic after new brand launch. Its key elements are unique page views, average time on page, channel sessions, page views, bounce rate etc Boost your pitch with our creative Dashboard To Track Traffic Maximizing Sales Via Online Brand Marketing Strategies Portrait Pdf. Deliver an awe inspiring pitch that will mesmerize everyone. Using these presentation templates you will surely catch everyones attention. You can browse the ppts collection on our website. We have researchers who are experts at creating the right content for the templates. So you do not have to invest time in any additional work. Just grab the template now and use them. This slide showcases dashboard that can help organization to analyze and evaluate the website traffic after new brand launch. Its key elements are unique page views, average time on page, channel sessions, page views, bounce rate etc
Effective Real Time Marketing Principles Real Time Website Traffic Analysis Dashboard Graphics Pdf
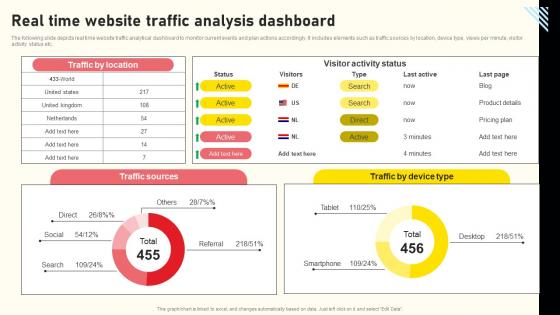
The following slide depicts real time website traffic analytical dashboard to monitor current events and plan actions accordingly. It includes elements such as traffic sources by location, device type, views per minute, visitor activity status etc. Present like a pro with Effective Real Time Marketing Principles Real Time Website Traffic Analysis Dashboard Graphics Pdf Create beautiful presentations together with your team, using our easy-to-use presentation slides. Share your ideas in real-time and make changes on the fly by downloading our templates. So whether you are in the office, on the go, or in a remote location, you can stay in sync with your team and present your ideas with confidence. With Slidegeeks presentation got a whole lot easier. Grab these presentations today. The following slide depicts real time website traffic analytical dashboard to monitor current events and plan actions accordingly. It includes elements such as traffic sources by location, device type, views per minute, visitor activity status etc.
Data Warehousing And Performing Basket Analysis In Ecommerce Websites AI SS V
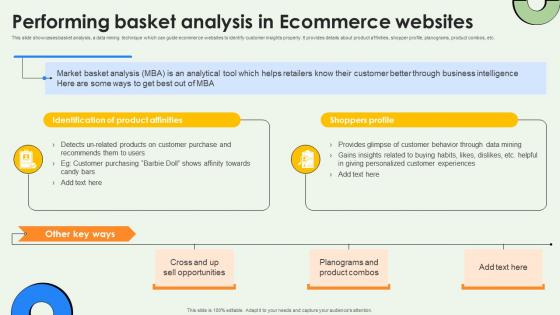
This slide showcases basket analysis, a data mining technique which can guide ecommerce websites to identify customer insights properly. It provides details about product affinities, shopper profile, planograms, product combos, etc. If you are looking for a format to display your unique thoughts, then the professionally designed Data Warehousing And Performing Basket Analysis In Ecommerce Websites AI SS V is the one for you. You can use it as a Google Slides template or a PowerPoint template. Incorporate impressive visuals, symbols, images, and other charts. Modify or reorganize the text boxes as you desire. Experiment with shade schemes and font pairings. Alter, share or cooperate with other people on your work. Download Data Warehousing And Performing Basket Analysis In Ecommerce Websites AI SS V and find out how to give a successful presentation. Present a perfect display to your team and make your presentation unforgettable. This slide showcases basket analysis, a data mining technique which can guide ecommerce websites to identify customer insights properly. It provides details about product affinities, shopper profile, planograms, product combos, etc.
Website Seo Analysis In One Page Summary Ppt Pdf Document

Ideal Home Page Of Real Estate Company Website Strategic Real Estate Diagrams Pdf
The following slide outlines ideal web page Home page of real estate company. Information covered in this slide is related to techniques for creating an effective home page such as clear message, attention-grabbing visuals, call-to-action CTA, and posting high quality content. Formulating a presentation can take up a lot of effort and time, so the content and message should always be the primary focus. The visuals of the PowerPoint can enhance the presenters message, so our Ideal Home Page Of Real Estate Company Website Strategic Real Estate Diagrams Pdf was created to help save time. Instead of worrying about the design, the presenter can concentrate on the message while our designers work on creating the ideal templates for whatever situation is needed. Slidegeeks has experts for everything from amazing designs to valuable content, we have put everything into Ideal Home Page Of Real Estate Company Website Strategic Real Estate Diagrams Pdf The following slide outlines ideal web page Home page of real estate company. Information covered in this slide is related to techniques for creating an effective home page such as clear message, attention-grabbing visuals, call-to-action CTA, and posting high quality content.
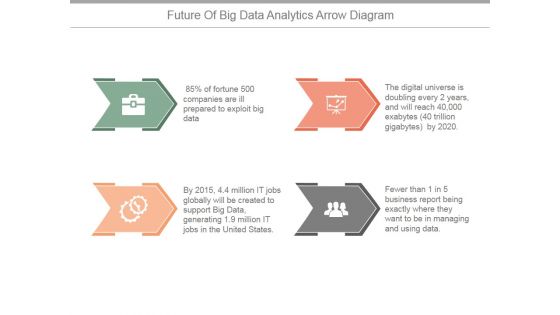
Future Of Big Data Analytics Arrow Diagram Ppt PowerPoint Presentation Summary
This is a future of big data analytics arrow diagram ppt powerpoint presentation summary. This is a four stage process. The stages in this process are big data, process, business, marketing, icons.
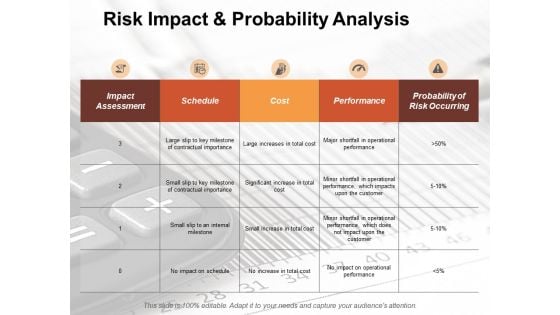
Risk Impact And Probability Analysis Risk Estimator Ppt PowerPoint Presentation File Design Inspiration
This is a risk impact and probability analysis risk estimator ppt powerpoint presentation file design inspiration. This is a five stage process. The stages in this process are business, management, strategy, analysis, icons.
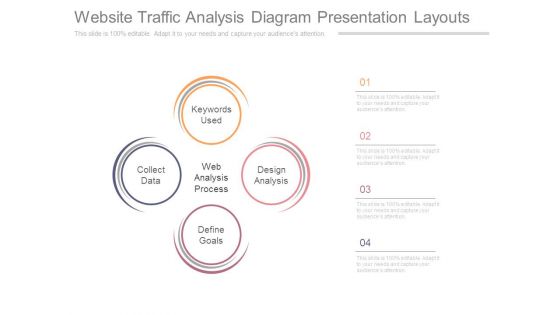
Website Traffic Analysis Diagram Presentation Layouts
This is a website traffic analysis diagram presentation layouts. This is a four stage process. The stages in this process are keywords used, design analysis, define goals, collect data, web analysis process.
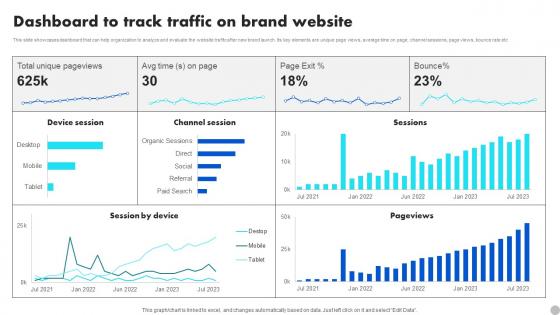
Dashboard To Track Traffic On Brand Website Brand Diversification Approach Rules Pdf
This slide showcases dashboard that can help organization to analyze and evaluate the website traffic after new brand launch. Its key elements are unique page views, average time on page, channel sessions, page views, bounce rate etc. Are you in need of a template that can accommodate all of your creative concepts This one is crafted professionally and can be altered to fit any style. Use it with Google Slides or PowerPoint. Include striking photographs, symbols, depictions, and other visuals. Fill, move around, or remove text boxes as desired. Test out color palettes and font mixtures. Edit and save your work, or work with colleagues. Download Dashboard To Track Traffic On Brand Website Brand Diversification Approach Rules Pdf and observe how to make your presentation outstanding. Give an impeccable presentation to your group and make your presentation unforgettable. This slide showcases dashboard that can help organization to analyze and evaluate the website traffic after new brand launch. Its key elements are unique page views, average time on page, channel sessions, page views, bounce rate etc.
Dashboard To Track Traffic On Brand Website Maximizing Revenue Using Professional Pdf
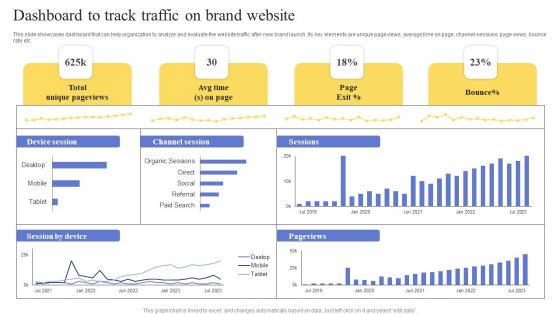
This slide showcases dashboard that can help organization to analyze and evaluate the website traffic after new brand launch. Its key elements are unique page views, average time on page, channel sessions, page views, bounce rate etc. Are you in need of a template that can accommodate all of your creative concepts This one is crafted professionally and can be altered to fit any style. Use it with Google Slides or PowerPoint. Include striking photographs, symbols, depictions, and other visuals. Fill, move around, or remove text boxes as desired. Test out color palettes and font mixtures. Edit and save your work, or work with colleagues. Download Dashboard To Track Traffic On Brand Website Maximizing Revenue Using Professional Pdf and observe how to make your presentation outstanding. Give an impeccable presentation to your group and make your presentation unforgettable. This slide showcases dashboard that can help organization to analyze and evaluate the website traffic after new brand launch. Its key elements are unique page views, average time on page, channel sessions, page views, bounce rate etc.
Dashboard To Track Traffic On Brand Website Strategic Marketing Plan Structure PDF
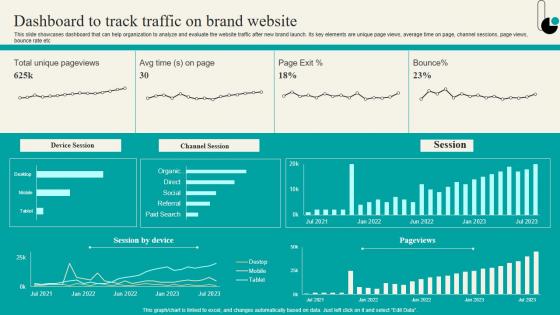
This slide showcases dashboard that can help organization to analyze and evaluate the website traffic after new brand launch. Its key elements are unique page views, average time on page, channel sessions, page views, bounce rate etc. Are you in need of a template that can accommodate all of your creative concepts This one is crafted professionally and can be altered to fit any style. Use it with Google Slides or PowerPoint. Include striking photographs, symbols, depictions, and other visuals. Fill, move around, or remove text boxes as desired. Test out color palettes and font mixtures. Edit and save your work, or work with colleagues. Download Dashboard To Track Traffic On Brand Website Strategic Marketing Plan Structure PDF and observe how to make your presentation outstanding. Give an impeccable presentation to your group and make your presentation unforgettable. This slide showcases dashboard that can help organization to analyze and evaluate the website traffic after new brand launch. Its key elements are unique page views, average time on page, channel sessions, page views, bounce rate etc.
Dashboard To Track Traffic On Brand Website Launching New Product Brand Sample Pdf
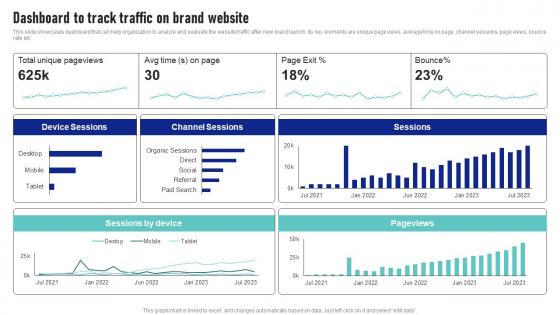
This slide showcases dashboard that can help organization to analyze and evaluate the website traffic after new brand launch. Its key elements are unique page views, average time on page, channel sessions, page views, bounce rate etc Are you in need of a template that can accommodate all of your creative concepts This one is crafted professionally and can be altered to fit any style. Use it with Google Slides or PowerPoint. Include striking photographs, symbols, depictions, and other visuals. Fill, move around, or remove text boxes as desired. Test out color palettes and font mixtures. Edit and save your work, or work with colleagues. Download Dashboard To Track Traffic On Brand Website Launching New Product Brand Sample Pdf and observe how to make your presentation outstanding. Give an impeccable presentation to your group and make your presentation unforgettable. This slide showcases dashboard that can help organization to analyze and evaluate the website traffic after new brand launch. Its key elements are unique page views, average time on page, channel sessions, page views, bounce rate etc

Stakeholder Mapping Strategy With Project Impact Impact Shareholder Decisions With Stakeholder Administration Themes PDF
This slide covers the stakeholder mapping strategy after identification of the key stakeholders such as collaboration, maintaining confidence, keeping informed, monitoring and responds. Do you know about Slidesgeeks Stakeholder Mapping Strategy With Project Impact Impact Shareholder Decisions With Stakeholder Administration Themes PDF These are perfect for delivering any kind od presentation. Using it, create PowerPoint presentations that communicate your ideas and engage audiences. Save time and effort by using our pre-designed presentation templates that are perfect for a wide range of topic. Our vast selection of designs covers a range of styles, from creative to business, and are all highly customizable and easy to edit. Download as a PowerPoint template or use them as Google Slides themes.
Covid 19 Threat Matrix Impact And Management Themes PDF
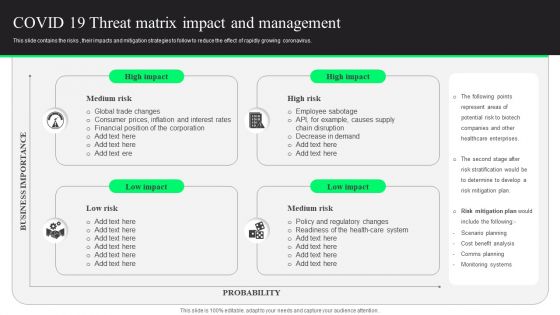
This slide contains the risks , their impacts and mitigation strategies to follow to reduce the effect of rapidly growing coronavirus. Presenting Covid 19 Threat Matrix Impact And Management Themes PDF to dispense important information. This template comprises four stages. It also presents valuable insights into the topics including Medium Risk, High Risk, Low Risk. This is a completely customizable PowerPoint theme that can be put to use immediately. So, download it and address the topic impactfully.
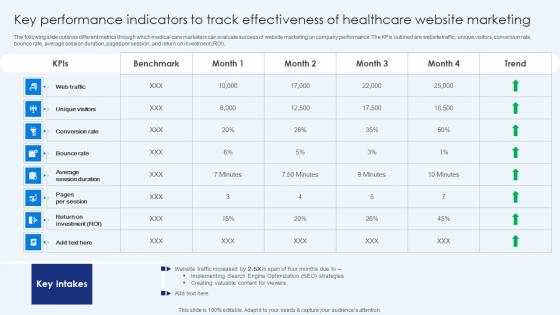
Key Performance Indicators To Track Effectiveness Healthcare Promotion Portrait Pdf
The following slide outlines different metrics through which medical care marketers can evaluate success of website marketing on company performance. The KPIs outlined are website traffic, unique visitors, conversion rate, bounce rate, average session duration, pages per session, and return on investment ROI. Are you searching for a Key Performance Indicators To Track Effectiveness Healthcare Promotion Portrait Pdf that is uncluttered, straightforward, and original Its easy to edit, and you can change the colors to suit your personal or business branding. For a presentation that expresses how much effort you have put in, this template is ideal With all of its features, including tables, diagrams, statistics, and lists, its perfect for a business plan presentation. Make your ideas more appealing with these professional slides. Download Key Performance Indicators To Track Effectiveness Healthcare Promotion Portrait Pdffrom Slidegeeks today. The following slide outlines different metrics through which medical care marketers can evaluate success of website marketing on company performance. The KPIs outlined are website traffic, unique visitors, conversion rate, bounce rate, average session duration, pages per session, and return on investment ROI.
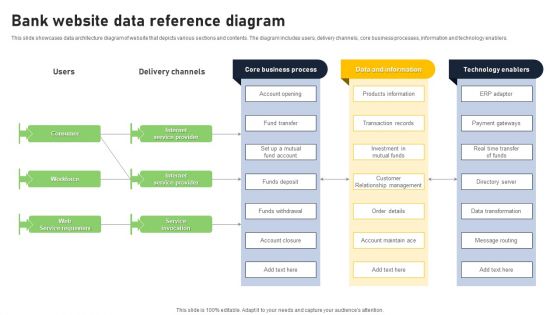
Bank Website Data Reference Diagram Mockup PDF
This slide showcases data architecture diagram of website that depicts various sections and contents. The diagram includes users, delivery channels, core business processes, information and technology enablers. Showcasing this set of slides titled Bank Website Data Reference Diagram Mockup PDF. The topics addressed in these templates are Core Business Process, Data Information, Technology Enablers. All the content presented in this PPT design is completely editable. Download it and make adjustments in color, background, font etc. as per your unique business setting.
Tracking The Improvements Buzz Marketing Techniques For Engaging Rules Pdf
This slide showcases the KPIs that would help the business organization to evaluate buzz marketing campaigns improvements. It includes social media followers, YouTube subscribers, Facebook engagement and page impressions, page likes, etc. If you are looking for a format to display your unique thoughts, then the professionally designed Tracking The Improvements Buzz Marketing Techniques For Engaging Rules Pdf is the one for you. You can use it as a Google Slides template or a PowerPoint template. Incorporate impressive visuals, symbols, images, and other charts. Modify or reorganize the text boxes as you desire. Experiment with shade schemes and font pairings. Alter, share or cooperate with other people on your work. Download Tracking The Improvements Buzz Marketing Techniques For Engaging Rules Pdf and find out how to give a successful presentation. Present a perfect display to your team and make your presentation unforgettable. This slide showcases the KPIs that would help the business organization to evaluate buzz marketing campaigns improvements. It includes social media followers, YouTube subscribers, Facebook engagement and page impressions, page likes, etc.
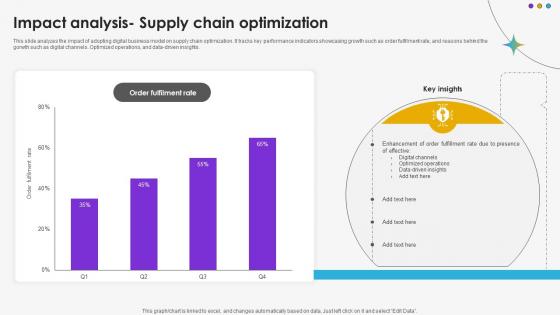
Impact Analysis Supply Chain Optimization DT SS V
This slide analyzes the impact of adopting digital business model on supply chain optimization. It tracks key performance indicators showcasing growth such as order fulfilment rate, and reasons behind the gorwth such as digital channels. Optimized operations, and data-driven insights.Whether you have daily or monthly meetings, a brilliant presentation is necessary. Impact Analysis Supply Chain Optimization DT SS V can be your best option for delivering a presentation. Represent everything in detail using Impact Analysis Supply Chain Optimization DT SS V and make yourself stand out in meetings. The template is versatile and follows a structure that will cater to your requirements. All the templates prepared by Slidegeeks are easy to download and edit. Our research experts have taken care of the corporate themes as well. So, give it a try and see the results. This slide analyzes the impact of adopting digital business model on supply chain optimization. It tracks key performance indicators showcasing growth such as order fulfilment rate, and reasons behind the gorwth such as digital channels. Optimized operations, and data-driven insights.
Online Tracking Optimize Website Marketing Intelligence Guide Data Gathering Introduction Pdf
The following slide provides overview of performance indicators for online tracking to manage and optimize user behavior on website. It highlights metrics such as web conversions, users, top landing pages, bounce rate, conversion rate, page, sessions and goals value. Presenting this PowerPoint presentation, titled Online Tracking Optimize Website Marketing Intelligence Guide Data Gathering Introduction Pdf, with topics curated by our researchers after extensive research. This editable presentation is available for immediate download and provides attractive features when used. Download now and captivate your audience. Presenting this Online Tracking Optimize Website Marketing Intelligence Guide Data Gathering Introduction Pdf. Our researchers have carefully researched and created these slides with all aspects taken into consideration. This is a completely customizable Online Tracking Optimize Website Marketing Intelligence Guide Data Gathering Introduction Pdf that is available for immediate downloading. Download now and make an impact on your audience. Highlight the attractive features available with our PPTs. The following slide provides overview of performance indicators for online tracking to manage and optimize user behavior on website. It highlights metrics such as web conversions, users, top landing pages, bounce rate, conversion rate, page, sessions and goals value.
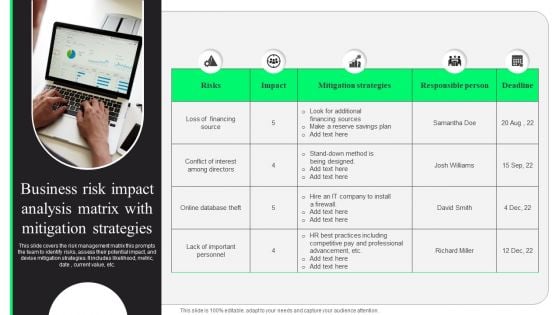
Business Risk Impact Analysis Matrix With Mitigation Strategies Structure PDF
This slide covers the risk management matrix this prompts the team to identify risks, assess their potential impact, and devise mitigation strategies. It includes likelihood, metric, date , current value, etc. Presenting Business Risk Impact Analysis Matrix With Mitigation Strategies Structure PDF to dispense important information. This template comprises five stages. It also presents valuable insights into the topics including Financing Source, Mitigation Strategies, Plan. This is a completely customizable PowerPoint theme that can be put to use immediately. So, download it and address the topic impactfully.
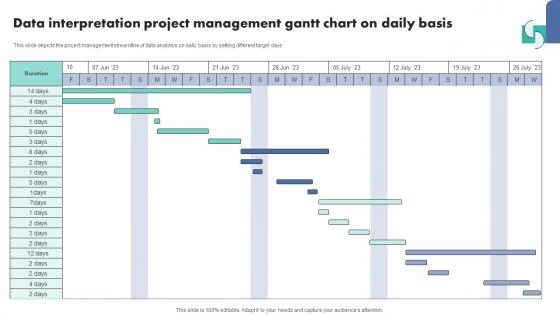
Data Interpretation Project Management Gantt Chart On Daily Basis Template Pdf
Showcasing this set of slides titled Data Interpretation Project Management Gantt Chart On Daily Basis Template Pdf The topics addressed in these templates are Data Interpretation Icon, Measure Business Growth All the content presented in this PPT design is completely editable. Download it and make adjustments in color, background, font etc. as per your unique business setting. Our Data Interpretation Project Management Gantt Chart On Daily Basis Template Pdf are topically designed to provide an attractive backdrop to any subject. Use them to look like a presentation pro.
Website Performance Tracking Sales Performance Enhancement Ideas Pdf
The following slide showcases a dashboard to track and measure website performance. It includes key elements such as visits, average session duration, bounce rate, page views, goal conversion, visits by week, traffic sources, top channels by conversions, etc. Boost your pitch with our creative Website Performance Tracking Sales Performance Enhancement Ideas Pdf. Deliver an awe inspiring pitch that will mesmerize everyone. Using these presentation templates you will surely catch everyones attention. You can browse the ppts collection on our website. We have researchers who are experts at creating the right content for the templates. So you do not have to invest time in any additional work. Just grab the template now and use them. The following slide showcases a dashboard to track and measure website performance. It includes key elements such as visits, average session duration, bounce rate, page views, goal conversion, visits by week, traffic sources, top channels by conversions, etc.
Performance Enhancement Plan Website Performance Tracking And Monitoring Professional Pdf
The following slide showcases a dashboard to track and measure website performance. It includes key elements such as visits, average session duration, bounce rate, page views, goal conversion, visits by week, traffic sources, top channels by conversions, etc. Find a pre-designed and impeccable Performance Enhancement Plan Website Performance Tracking And Monitoring Professional Pdf. The templates can ace your presentation without additional effort. You can download these easy-to-edit presentation templates to make your presentation stand out from others. So, what are you waiting for Download the template from Slidegeeks today and give a unique touch to your presentation. The following slide showcases a dashboard to track and measure website performance. It includes key elements such as visits, average session duration, bounce rate, page views, goal conversion, visits by week, traffic sources, top channels by conversions, etc.
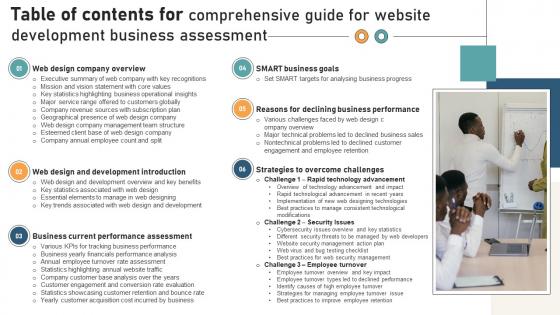
Table Of Contents For Comprehensive Guide For Website Development Business Assessment
Are you searching for a Table Of Contents For Comprehensive Guide For Website Development Business Assessment that is uncluttered, straightforward, and original Its easy to edit, and you can change the colors to suit your personal or business branding. For a presentation that expresses how much effort you have put in, this template is ideal With all of its features, including tables, diagrams, statistics, and lists, its perfect for a business plan presentation. Make your ideas more appealing with these professional slides. Download Table Of Contents For Comprehensive Guide For Website Development Business Assessment from Slidegeeks today. Our Table Of Contents For Comprehensive Guide For Website Development Business Assessment are topically designed to provide an attractive backdrop to any subject. Use them to look like a presentation pro.
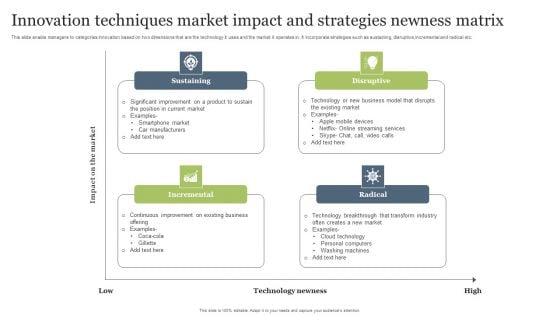
Innovation Techniques Market Impact And Strategies Newness Matrix Rules PDF
This slide enable managers to categories innovation based on two dimensions that are the technology it uses and the market it operates in. It incorporate strategies such as sustaining, disruptive,incremental and radical etc. Persuade your audience using this Innovation Techniques Market Impact And Strategies Newness Matrix Rules PDF. This PPT design covers four stages, thus making it a great tool to use. It also caters to a variety of topics including Sustaining, Disruptive, Radical. Download this PPT design now to present a convincing pitch that not only emphasizes the topic but also showcases your presentation skills.
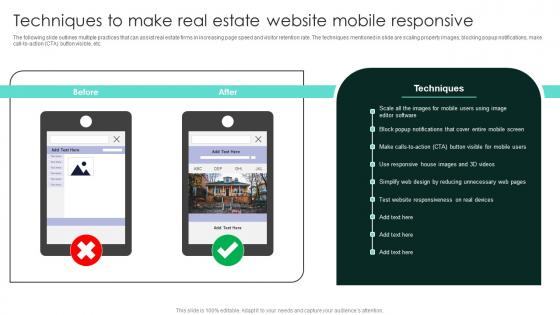
Techniques To Make Real Estate Website Mobile Responsive Strategic Real Estate Infographics Pdf
The following slide outlines multiple practices that can assist real estate firms in increasing page speed and visitor retention rate. The techniques mentioned in slide are scaling property images, blocking popup notifications, make call-to-action CTA button visible, etc. Retrieve professionally designed Techniques To Make Real Estate Website Mobile Responsive Strategic Real Estate Infographics Pdf to effectively convey your message and captivate your listeners. Save time by selecting pre-made slideshows that are appropriate for various topics, from business to educational purposes. These themes come in many different styles, from creative to corporate, and all of them are easily adjustable and can be edited quickly. Access them as PowerPoint templates or as Google Slides themes. You do not have to go on a hunt for the perfect presentation because Slidegeeks got you covered from everywhere. The following slide outlines multiple practices that can assist real estate firms in increasing page speed and visitor retention rate. The techniques mentioned in slide are scaling property images, blocking popup notifications, make call-to-action CTA button visible, etc.
Website Performance Tracking And Monitoring Implementing Strategies To Improve Structure Pdf
The following slide showcases a dashboard to track and measure website performance. It includes key elements such as visits, average session duration, bounce rate, page views, goal conversion, visits by week, traffic sources,top channels by conversions, etc.If your project calls for a presentation, then Slidegeeks is your go-to partner because we have professionally designed, easy-to-edit templates that are perfect for any presentation. After downloading, you can easily edit Website Performance Tracking And Monitoring Implementing Strategies To Improve Structure Pdf and make the changes accordingly. You can rearrange slides or fill them with different images. Check out all the handy templates The following slide showcases a dashboard to track and measure website performance. It includes key elements such as visits, average session duration, bounce rate, page views, goal conversion, visits by week, traffic sources,top channels by conversions, etc.
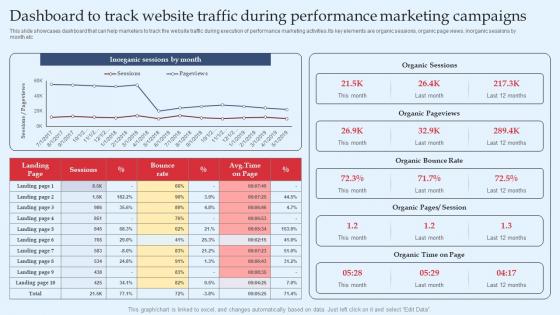
Strategic Performance Marketing Campaign Dashboard To Track Website Traffic During Clipart Pdf
This slide showcases dashboard that can help marketers to track the website traffic during execution of performance marketing activities.Its key elements are organic sessions, organic page views, inorganic sessions by month etc. Make sure to capture your audiences attention in your business displays with our gratis customizable Strategic Performance Marketing Campaign Dashboard To Track Website Traffic During Clipart Pdf. These are great for business strategies, office conferences, capital raising or task suggestions. If you desire to acquire more customers for your tech business and ensure they stay satisfied, create your own sales presentation with these plain slides. This slide showcases dashboard that can help marketers to track the website traffic during execution of performance marketing activities.Its key elements are organic sessions, organic page views, inorganic sessions by month etc.
Lead Generation Dashboard For Tracking Various Techniques For Managing Slides PDF
This slide covers the KPI dashboard for tracking lead conversion rates. It includes metrics such as visitors, average session rate, per visit, bounce rate, page views, etc. Welcome to our selection of the Lead Generation Dashboard For Tracking Various Techniques For Managing Slides PDF. These are designed to help you showcase your creativity and bring your sphere to life. Planning and Innovation are essential for any business that is just starting out. This collection contains the designs that you need for your everyday presentations. All of our PowerPoints are 100 percent editable, so you can customize them to suit your needs. This multi-purpose template can be used in various situations. Grab these presentation templates today This slide covers the KPI dashboard for tracking lead conversion rates. It includes metrics such as visitors, average session rate, per visit, bounce rate, page views, etc.
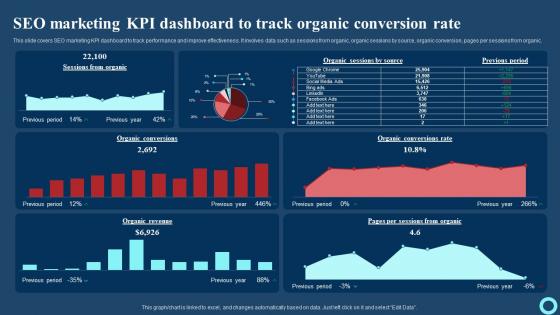
Seo Marketing KPI Dashboard To Track Organic Conversion Rate Effective Strategies To Enhance Download Pdf
This slide covers SEO marketing KPI dashboard to track performance and improve effectiveness. It involves data such as sessions from organic, organic sessions by source, organic conversion, pages per sessions from organic. The Seo Marketing KPI Dashboard To Track Organic Conversion Rate Effective Strategies To Enhance Download Pdf is a compilation of the most recent design trends as a series of slides. It is suitable for any subject or industry presentation, containing attractive visuals and photo spots for businesses to clearly express their messages. This template contains a variety of slides for the user to input data, such as structures to contrast two elements, bullet points, and slides for written information. Slidegeeks is prepared to create an impression. This slide covers SEO marketing KPI dashboard to track performance and improve effectiveness. It involves data such as sessions from organic, organic sessions by source, organic conversion, pages per sessions from organic.
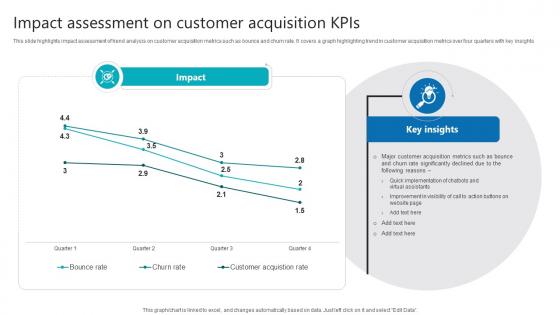
Impact Assessment On Customer Acquisition Kpis Product Analytics Implementation Data Analytics V
This slide highlights impact assessment of trend analysis on customer acquisition metrics such as bounce and churn rate. It covers a graph highlighting trend in customer acquisition metrics over four quarters with key insights The Impact Assessment On Customer Acquisition Kpis Product Analytics Implementation Data Analytics V is a compilation of the most recent design trends as a series of slides. It is suitable for any subject or industry presentation, containing attractive visuals and photo spots for businesses to clearly express their messages. This template contains a variety of slides for the user to input data, such as structures to contrast two elements, bullet points, and slides for written information. Slidegeeks is prepared to create an impression. This slide highlights impact assessment of trend analysis on customer acquisition metrics such as bounce and churn rate. It covers a graph highlighting trend in customer acquisition metrics over four quarters with key insights
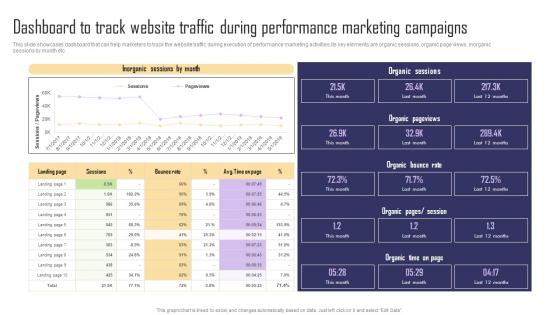
Dashboard To Track Website Traffic During Performance Paid Internet Marketing Strategy Guidelines Pdf
This slide showcases dashboard that can help marketers to track the website traffic during execution of performance marketing activities.Its key elements are organic sessions, organic page views, inorganic sessions by month etc. Whether you have daily or monthly meetings, a brilliant presentation is necessary. Dashboard To Track Website Traffic During Performance Paid Internet Marketing Strategy Guidelines Pdf can be your best option for delivering a presentation. Represent everything in detail using Dashboard To Track Website Traffic During Performance Paid Internet Marketing Strategy Guidelines Pdf and make yourself stand out in meetings. The template is versatile and follows a structure that will cater to your requirements. All the templates prepared by Slidegeeks are easy to download and edit. Our research experts have taken care of the corporate themes as well. So, give it a try and see the results. This slide showcases dashboard that can help marketers to track the website traffic during execution of performance marketing activities.Its key elements are organic sessions, organic page views, inorganic sessions by month etc.
KPI Dashboard Tracking Seo Major Promotional Analytics Future Trends Guidelines Pdf
This slide covers the KPI dashboard for analyzing SEO metrics such as authority score, organic traffic, organic keywords, paid keywords, ref. Domains, site audit, link building tool, organic traffic, on page SEO checker, backlink audit, etc. Are you searching for a KPI Dashboard Tracking Seo Major Promotional Analytics Future Trends Guidelines Pdf that is uncluttered, straightforward, and original Its easy to edit, and you can change the colors to suit your personal or business branding. For a presentation that expresses how much effort you have put in, this template is ideal With all of its features, including tables, diagrams, statistics, and lists, its perfect for a business plan presentation. Make your ideas more appealing with these professional slides. Download KPI Dashboard Tracking Seo Major Promotional Analytics Future Trends Guidelines Pdf from Slidegeeks today. This slide covers the KPI dashboard for analyzing SEO metrics such as authority score, organic traffic, organic keywords, paid keywords, ref. Domains, site audit, link building tool, organic traffic, on page SEO checker, backlink audit, etc.
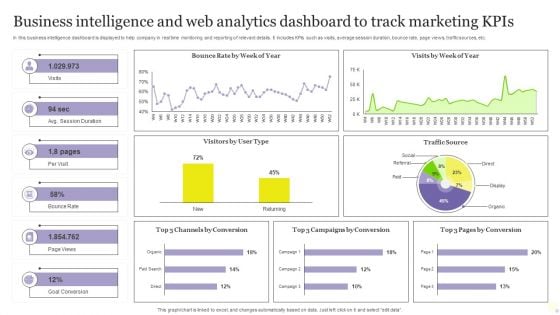
Business Intelligence And Web Analytics Dashboard To Track Marketing Kpis Inspiration PDF
In this business intelligence dashboard is displayed to help company in real time monitoring and reporting of relevant details. It includes KPIs such as visits, average session duration, bounce rate, page views, traffic sources, etc. Showcasing this set of slides titled Business Intelligence And Web Analytics Dashboard To Track Marketing Kpis Inspiration PDF. The topics addressed in these templates are Goal Conversion, Track Marketing Kpis, Web Analytics Dashboard. All the content presented in this PPT design is completely editable. Download it and make adjustments in color, background, font etc. as per your unique business setting.
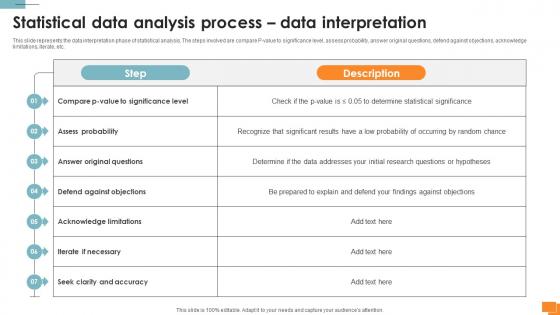
A133 Statistical Tools For Evidence Statistical Data Analysis Process Data Interpretation
This slide represents the data interpretation phase of statistical analysis. The steps involved are compare P-value to significance level, assess probability, answer original questions, defend against objections, acknowledge limitations, iterate, etc. Boost your pitch with our creative A133 Statistical Tools For Evidence Statistical Data Analysis Process Data Interpretation. Deliver an awe-inspiring pitch that will mesmerize everyone. Using these presentation templates you will surely catch everyones attention. You can browse the ppts collection on our website. We have researchers who are experts at creating the right content for the templates. So you do not have to invest time in any additional work. Just grab the template now and use them. This slide represents the data interpretation phase of statistical analysis. The steps involved are compare P-value to significance level, assess probability, answer original questions, defend against objections, acknowledge limitations, iterate, etc.
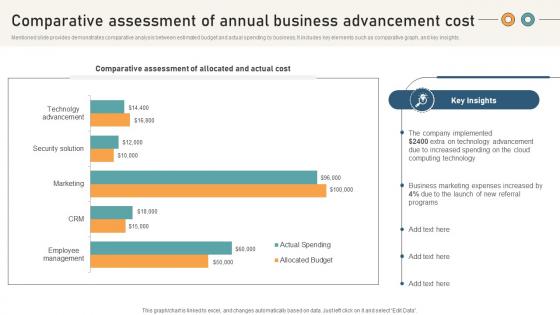
Comprehensive Guide For Website Comparative Assessment Of Annual Business Advancement
Mentioned slide provides demonstrates comparative analysis between estimated budget and actual spending by business. It includes key elements such as comparative graph, and key insights. If you are looking for a format to display your unique thoughts, then the professionally designed Comprehensive Guide For Website Comparative Assessment Of Annual Business Advancement is the one for you. You can use it as a Google Slides template or a PowerPoint template. Incorporate impressive visuals, symbols, images, and other charts. Modify or reorganize the text boxes as you desire. Experiment with shade schemes and font pairings. Alter, share or cooperate with other people on your work. Download Comprehensive Guide For Website Comparative Assessment Of Annual Business Advancement and find out how to give a successful presentation. Present a perfect display to your team and make your presentation unforgettable. Mentioned slide provides demonstrates comparative analysis between estimated budget and actual spending by business. It includes key elements such as comparative graph, and key insights.
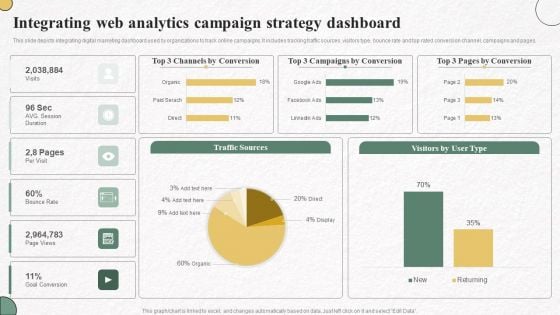
Integrating Web Analytics Campaign Strategy Dashboard Information PDF
This slide depicts integrating digital marketing dashboard used by organizations to track online campaigns. It includes tracking traffic sources, visitors type, bounce rate and top rated conversion channel, campaigns and pages. Showcasing this set of slides titled Integrating Web Analytics Campaign Strategy Dashboard Information PDF. The topics addressed in these templates are Channels By Conversion, Campaigns By Conversion, Pages By Conversion. All the content presented in this PPT design is completely editable. Download it and make adjustments in color, background, font etc. as per your unique business setting.
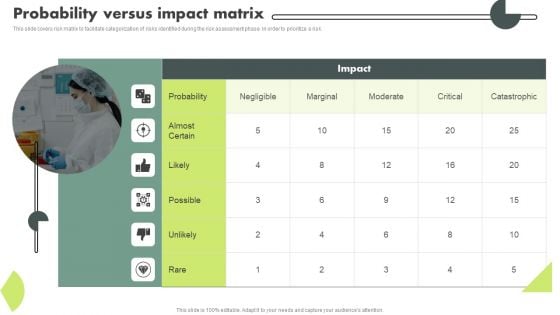
Operational Quality Assurance Probability Versus Impact Matrix Structure PDF
This slide covers risk matrix to facilitate categorization of risks identified during the risk assessment phase. In order to prioritize a risk. Get a simple yet stunning designed Operational Quality Assurance Probability Versus Impact Matrix Structure PDF. It is the best one to establish the tone in your meetings. It is an excellent way to make your presentations highly effective. So, download this PPT today from Slidegeeks and see the positive impacts. Our easy to edit Operational Quality Assurance Probability Versus Impact Matrix Structure PDF can be your go to option for all upcoming conferences and meetings. So, what are you waiting for Grab this template today.
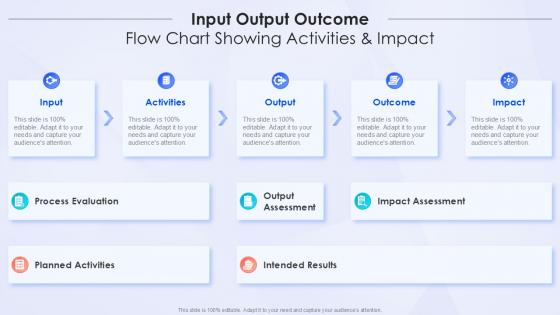
Input Output Outcome Flow Chart Showing Activities And Impact
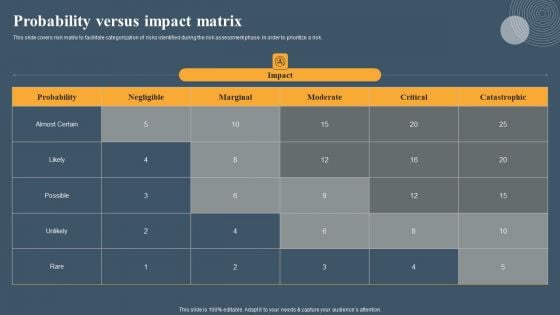
Risk Based Methodology Probability Versus Impact Matrix Topics PDF
This slide covers risk matrix to facilitate categorization of risks identified during the risk assessment phase. In order to prioritize a risk. Make sure to capture your audiences attention in your business displays with our gratis customizable Risk Based Methodology Probability Versus Impact Matrix Topics PDF. These are great for business strategies, office conferences, capital raising or task suggestions. If you desire to acquire more customers for your tech business and ensure they stay satisfied, create your own sales presentation with these plain slides.
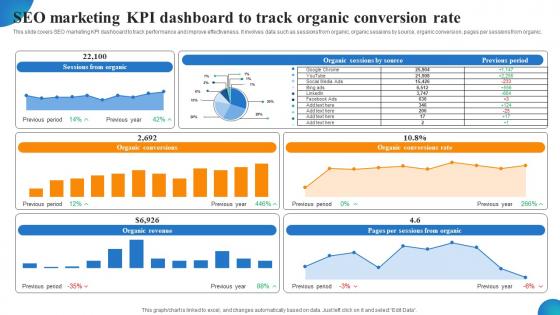
Seo Marketing KPI Dashboard To Track Organic Conversion Rate MDSS For Enhanced Template Pdf
This slide covers SEO marketing KPI dashboard to track performance and improve effectiveness. It involves data such as sessions from organic, organic sessions by source, organic conversion, pages per sessions from organic. Here you can discover an assortment of the finest PowerPoint and Google Slides templates. With these templates, you can create presentations for a variety of purposes while simultaneously providing your audience with an eye-catching visual experience. Download Seo Marketing KPI Dashboard To Track Organic Conversion Rate MDSS For Enhanced Template Pdf to deliver an impeccable presentation. These templates will make your job of preparing presentations much quicker, yet still, maintain a high level of quality. Slidegeeks has experienced researchers who prepare these templates and write high-quality content for you. Later on, you can personalize the content by editing the Seo Marketing KPI Dashboard To Track Organic Conversion Rate MDSS For Enhanced Template Pdf This slide covers SEO marketing KPI dashboard to track performance and improve effectiveness. It involves data such as sessions from organic, organic sessions by source, organic conversion, pages per sessions from organic.
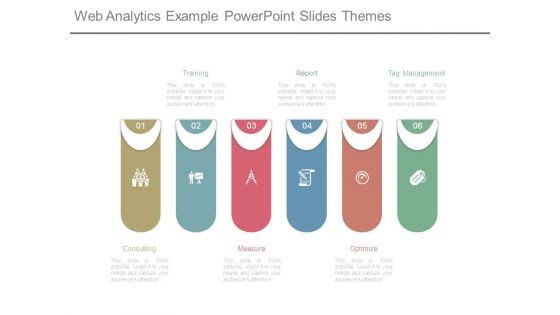
Web Analytics Example Powerpoint Slides Themes
This is a web analytics example powerpoint slides themes. This is a six stage process. The stages in this process are consulting, training, measure, report, optimize, tag management.
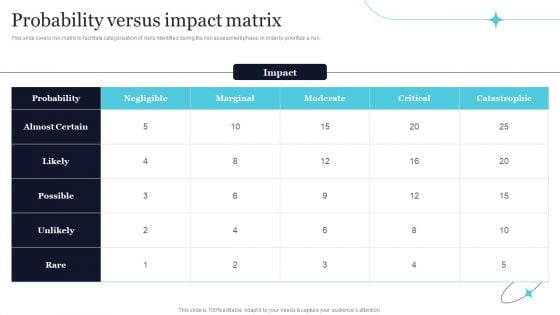
Quality Evaluation Probability Versus Impact Matrix Ideas PDF
This slide covers risk matrix to facilitate categorization of risks identified during the risk assessment phase. In order to prioritize a risk. The Quality Evaluation Probability Versus Impact Matrix Ideas PDF is a compilation of the most recent design trends as a series of slides. It is suitable for any subject or industry presentation, containing attractive visuals and photo spots for businesses to clearly express their messages. This template contains a variety of slides for the user to input data, such as structures to contrast two elements, bullet points, and slides for written information. Slidegeeks is prepared to create an impression.
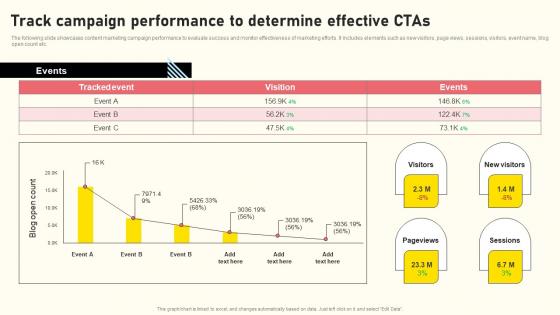
Effective Real Time Marketing Principles Track Campaign Performance To Determine Microsoft Pdf
The following slide showcases content marketing campaign performance to evaluate success and monitor effectiveness of marketing efforts. It includes elements such as new visitors, page views, sessions, visitors, event name, blog open count etc. Do you have an important presentation coming up Are you looking for something that will make your presentation stand out from the rest Look no further than Effective Real Time Marketing Principles Track Campaign Performance To Determine Microsoft Pdf. With our professional designs, you can trust that your presentation will pop and make delivering it a smooth process. And with Slidegeeks, you can trust that your presentation will be unique and memorable. So why wait Grab Effective Real Time Marketing Principles Track Campaign Performance To Determine Microsoft Pdf today and make your presentation stand out from the rest The following slide showcases content marketing campaign performance to evaluate success and monitor effectiveness of marketing efforts. It includes elements such as new visitors, page views, sessions, visitors, event name, blog open count etc.
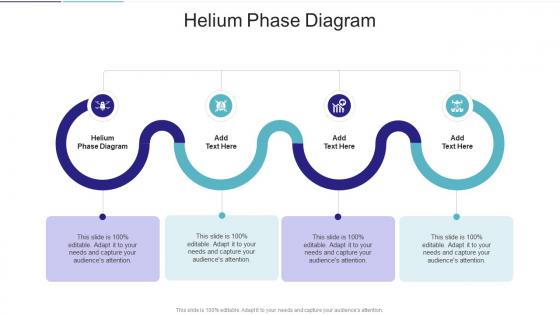
Helium Phase Diagram In Powerpoint And Google Slides Cpb
Presenting our innovatively designed set of slides titled Helium Phase Diagram In Powerpoint And Google Slides Cpb. This completely editable PowerPoint graphic exhibits Helium Phase Diagram that will help you convey the message impactfully. It can be accessed with Google Slides and is available in both standard screen and widescreen aspect ratios. Apart from this, you can download this well structured PowerPoint template design in different formats like PDF, JPG, and PNG. So, click the download button now to gain full access to this PPT design. Our Helium Phase Diagram In Powerpoint And Google Slides Cpb are topically designed to provide an attractive backdrop to any subject. Use them to look like a presentation pro.
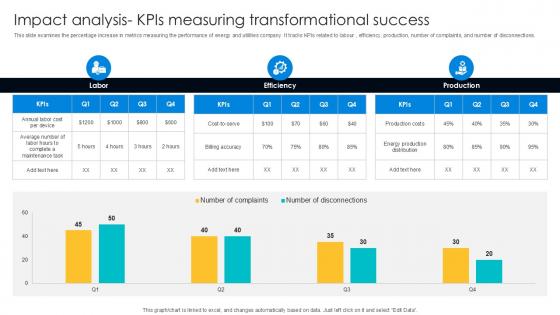
Impact Analysis KPIs Measuring Digital Transformation Journey PPT Presentation DT SS V
This slide examines the percentage increase in metrics measuring the performance of energy and utilities company. It tracks KPIs related to labour , efficiency, production, number of complaints, and number of disconnections. The Impact Analysis KPIs Measuring Digital Transformation Journey PPT Presentation DT SS V is a compilation of the most recent design trends as a series of slides. It is suitable for any subject or industry presentation, containing attractive visuals and photo spots for businesses to clearly express their messages. This template contains a variety of slides for the user to input data, such as structures to contrast two elements, bullet points, and slides for written information. Slidegeeks is prepared to create an impression. This slide examines the percentage increase in metrics measuring the performance of energy and utilities company. It tracks KPIs related to labour , efficiency, production, number of complaints, and number of disconnections.
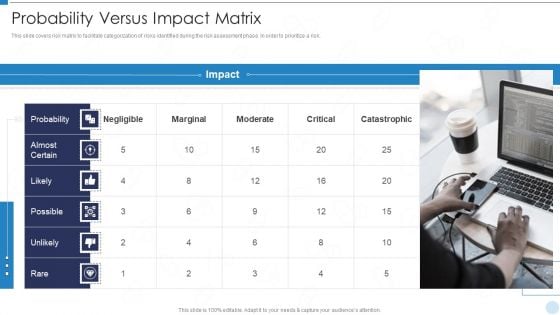
QRM Probability Versus Impact Matrix Ppt Summary Images PDF
This slide covers risk matrix to facilitate categorization of risks identified during the risk assessment phase. In order to prioritize a risk. This is a QRM Probability Versus Impact Matrix Ppt Summary Images PDF template with various stages. Focus and dispense information on one stages using this creative set, that comes with editable features. It contains large content boxes to add your information on topics like Probability, Marginal, Catastrophic. You can also showcase facts, figures, and other relevant content using this PPT layout. Grab it now.
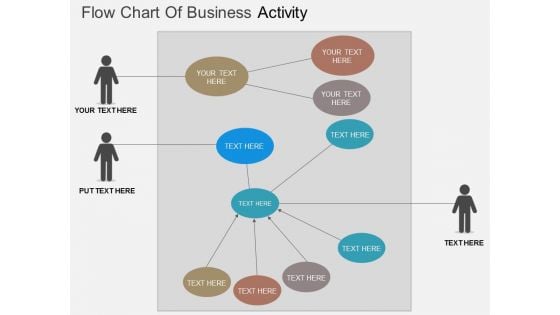
Flow Chart Of Business Activity Powerpoint Template
This PowerPoint slide contains graphics of five text boxes with icons. This diagram is designed to make impressive presentations on various business processes. This professional slide helps in making an instant impact on viewers.
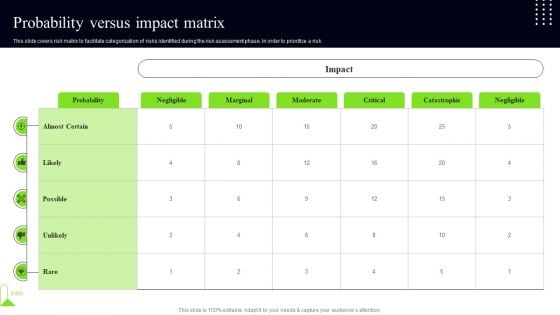
Quality Assessment Probability Versus Impact Matrix Template PDF
This slide covers risk matrix to facilitate categorization of risks identified during the risk assessment phase. In order to prioritize a risk. Coming up with a presentation necessitates that the majority of the effort goes into the content and the message you intend to convey. The visuals of a PowerPoint presentation can only be effective if it supplements and supports the story that is being told. Keeping this in mind our experts created Quality Assessment Probability Versus Impact Matrix Template PDF to reduce the time that goes into designing the presentation. This way, you can concentrate on the message while our designers take care of providing you with the right template for the situation.
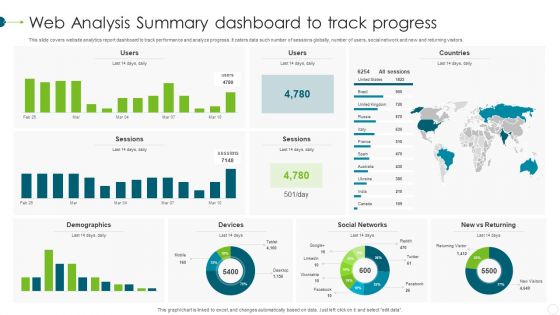
Web Analysis Summary Dashboard To Track Progress Elements PDF
This slide covers website analytics report dashboard to track performance and analyze progress. It caters data such number of sessions globally, number of users, social network and new and returning visitors. Showcasing this set of slides titled Web Analysis Summary Dashboard To Track Progress Elements PDF. The topics addressed in these templates are Demographics, Devices, Social Networks. All the content presented in this PPT design is completely editable. Download it and make adjustments in color, background, font etc. as per your unique business setting.
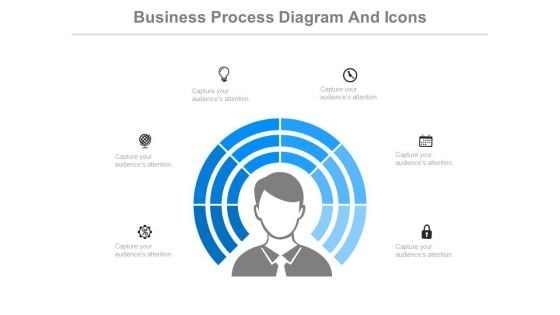
Human Thinking Business Process Diagram Powerpoint Slides
Our above PPT slide contains circles around human mind with icons. This PowerPoint template helps to display thinking process, business strategy and analysis. Use this diagram to impart more clarity to subject and to create more sound impact on viewers.
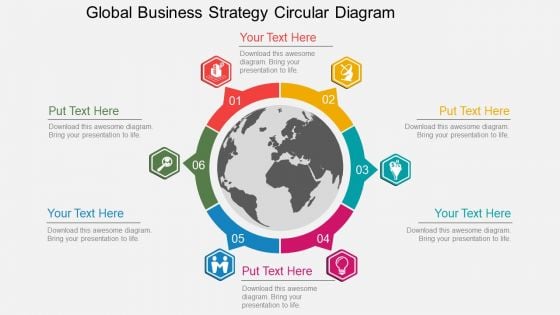
Global Business Strategy Circular Diagram Powerpoint Template
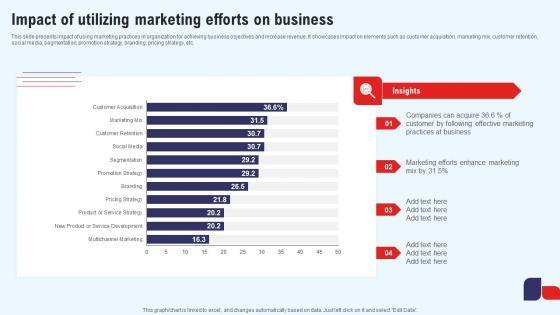
Efficient Marketing Process For Business Impact Of Utilizing Marketing Efforts On Business Themes Pdf
This slide presents impact of using marketing practices in organization for achieving business objectives and increase revenue. It showcases impact on elements such as customer acquisition, marketing mix, customer retention, social media, segmentation, promotion strategy, branding, pricing strategy, etc. If your project calls for a presentation, then Slidegeeks is your go-to partner because we have professionally designed, easy-to-edit templates that are perfect for any presentation. After downloading, you can easily edit Efficient Marketing Process For Business Impact Of Utilizing Marketing Efforts On Business Themes Pdf and make the changes accordingly. You can rearrange slides or fill them with different images. Check out all the handy templates This slide presents impact of using marketing practices in organization for achieving business objectives and increase revenue. It showcases impact on elements such as customer acquisition, marketing mix, customer retention, social media, segmentation, promotion strategy, branding, pricing strategy, etc.
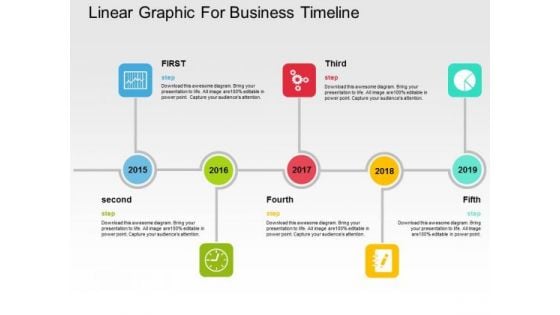
Linear Graphic For Business Timeline PowerPoint Templates
This slide has been designed with linear graphic with icons. This PowerPoint diagram is suitable to present business timeline and planning. This professional slide helps in making an instant impact on viewers.
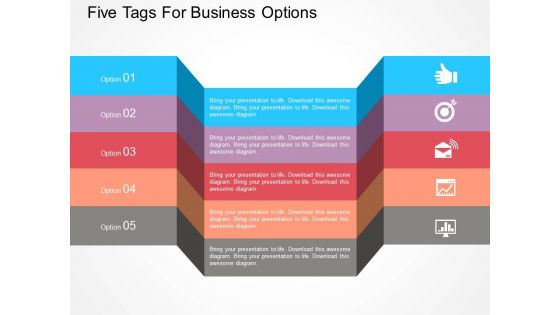
Five Tags For Business Options Powerpoint Template
This PowerPoint slide contains graphics of five tags with icons. This diagram is designed to make impressive presentations on various business processes. This professional slide helps in making an instant impact on viewers.

Risk Prioritization Impact Assessment Matrix Risk Prioritization Download PDF
This slide provides an overview of the probability impact matrix to prioritize potential threats. The matrix includes scores that help to determine the risk level which is high, moderate and low. If you are looking for a format to display your unique thoughts, then the professionally designed Risk Prioritization Impact Assessment Matrix Risk Prioritization Download PDF is the one for you. You can use it as a Google Slides template or a PowerPoint template. Incorporate impressive visuals, symbols, images, and other charts. Modify or reorganize the text boxes as you desire. Experiment with shade schemes and font pairings. Alter, share or cooperate with other people on your work. Download Risk Prioritization Impact Assessment Matrix Risk Prioritization Download PDF and find out how to give a successful presentation. Present a perfect display to your team and make your presentation unforgettable.

Risk Impact And Probability Chart Ppt PowerPoint Presentation Inspiration Background
Presenting this set of slides with name risk impact and probability chart ppt powerpoint presentation inspiration background. This is a four stage process. The stages in this process are contingency risks, major risks, minor risks, high incidence risks. This is a completely editable PowerPoint presentation and is available for immediate download. Download now and impress your audience.
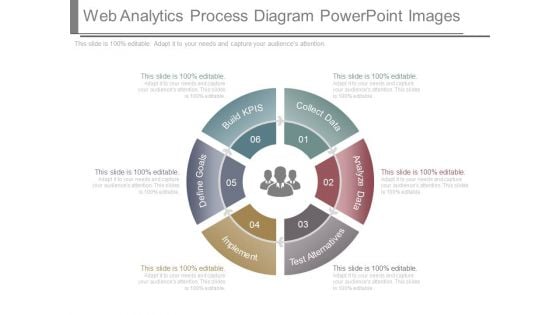
Web Analytics Process Diagram Powerpoint Images
This is a web analytics process diagram powerpoint images. This is a six stage process. The stages in this process are build kpis, define goals, implement, test alternatives, analyze data, collect data.
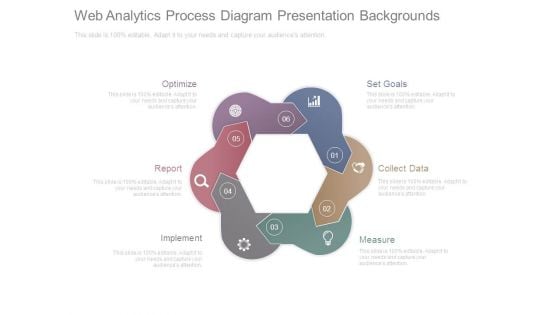
Web Analytics Process Diagram Presentation Backgrounds
This is a web analytics process diagram presentation backgrounds. This is a six stage process. The stages in this process are optimize, report, implement, measure, collect data, set goals.
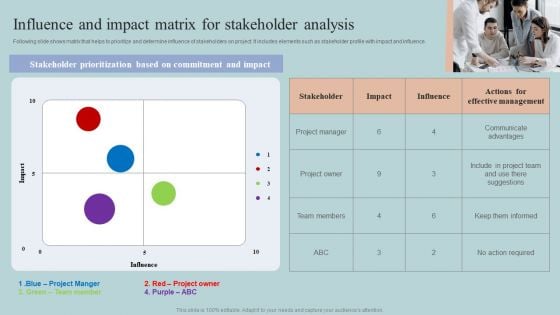
Influence And Impact Matrix For Stakeholder Analysis Elements PDF
Following slide shows matrix that helps to prioritize and determine influence of stakeholders on project. It includes elements such as stakeholder profile with impact and influence. If you are looking for a format to display your unique thoughts, then the professionally designed Influence And Impact Matrix For Stakeholder Analysis Elements PDF is the one for you. You can use it as a Google Slides template or a PowerPoint template. Incorporate impressive visuals, symbols, images, and other charts. Modify or reorganize the text boxes as you desire. Experiment with shade schemes and font pairings. Alter, share or cooperate with other people on your work. Download Influence And Impact Matrix For Stakeholder Analysis Elements PDF and find out how to give a successful presentation. Present a perfect display to your team and make your presentation unforgettable.


 Continue with Email

 Home
Home


