Heatmap Icon
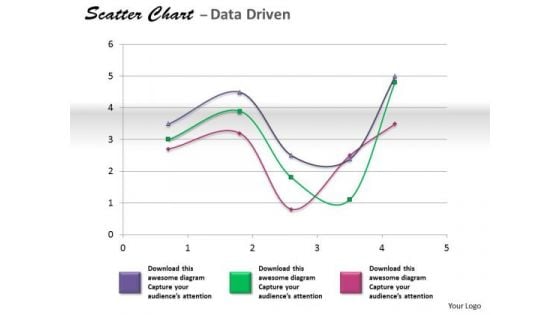
Financial Data Analysis Coordinate With Scatter Chart PowerPoint Templates
Get The Doers Into Action. Activate Them With Our financial data analysis coordinate with scatter chart Powerpoint Templates .
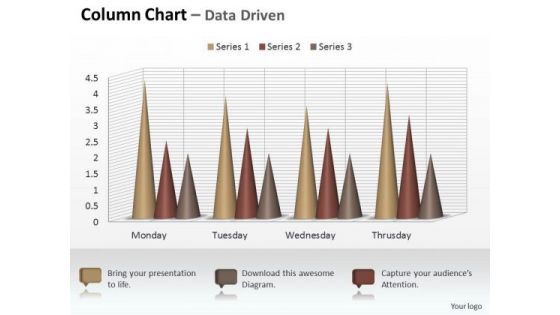
Marketing Data Analysis 3d Sets Of Column Chart PowerPoint Templates
Your Listeners Will Never Doodle. Our marketing data analysis 3d sets of column chart Powerpoint Templates Will Hold Their Concentration.
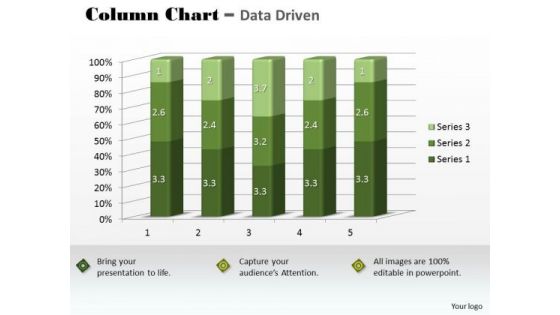
Marketing Data Analysis 3d Statistical Quality Control Chart PowerPoint Templates
Our marketing data analysis 3d statistical quality control chart Powerpoint Templates Abhor Doodling. They Never Let The Interest Flag.
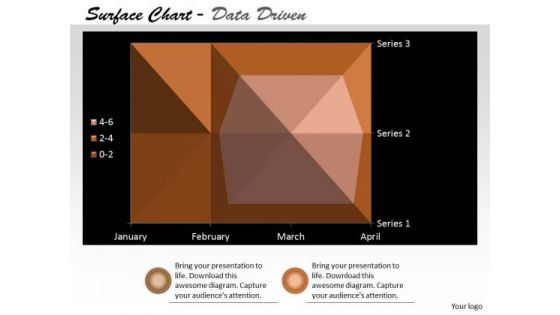
Multivariate Data Analysis Surface Chart Plots Trends PowerPoint Templates
Our multivariate data analysis surface chart plots trends Powerpoint Templates Heighten Concentration. Your Audience Will Be On The Edge.
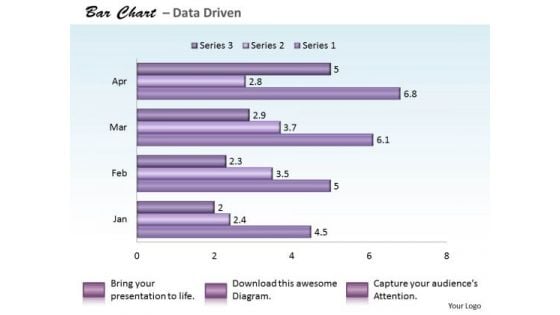
Quantitative Data Analysis Bar Chart For PowerPoint Templates
Reduce The Drag With Our quantitative data analysis bar chart for Powerpoint Templates . Give More Lift To Your Thoughts.

Data Analysis Techniques 3d Effective Display Chart PowerPoint Templates
Dribble Away With Our data analysis techniques 3d effective display chart Powerpoint Templates . Score A Goal With Your Ideas.
Marketing Success Metrics Website Landing Page Kpi Tracking Dashboard Elements PDF
This slide covers a dashboard for analysing the metrics of the website landing page. It includes kpis such as conversions, conversion rate, sessions, bounce rate, engagement sickness, etc. From laying roadmaps to briefing everything in detail, our templates are perfect for you. You can set the stage with your presentation slides. All you have to do is download these easy-to-edit and customizable templates. Marketing Success Metrics Website Landing Page Kpi Tracking Dashboard Elements PDF will help you deliver an outstanding performance that everyone would remember and praise you for. Do download this presentation today.
Online Marketing Analytics To Enhance Business Growth Website Landing Page KPI Tracking Dashboard Sample PDF
This slide covers a dashboard for analyzing the metrics of the website landing page. It includes KPIs such as conversions, conversion rate, sessions, bounce rate, engagement sickness, etc. If your project calls for a presentation, then Slidegeeks is your go to partner because we have professionally designed, easy to edit templates that are perfect for any presentation. After downloading, you can easily edit Online Marketing Analytics To Enhance Business Growth Website Landing Page KPI Tracking Dashboard Sample PDF and make the changes accordingly. You can rearrange slides or fill them with different images. Check out all the handy templates

Business Diagram Four Pie Chart For Data Driven Result Analysis Of Business PowerPoint Slide
This business diagram displays graphic of pie charts in shape of flasks. This business slide is suitable to present and compare business data. Use this diagram to build professional presentations for your viewers.
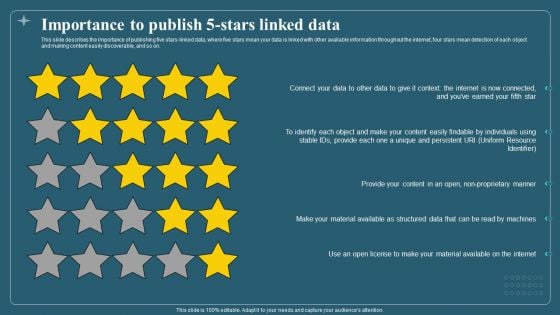
Associated Data IT Importance To Publish 5 Stars Linked Data Template PDF
This slide describes the importance of publishing five stars linked data, where five stars mean your data is linked with other available information throughout the internet, four stars mean detection of each object and making content easily discoverable, and so on. Deliver an awe inspiring pitch with this creative Associated Data IT Importance To Publish 5 Stars Linked Data Template PDF bundle. Topics like Uniform Resource, Internet, Material can be discussed with this completely editable template. It is available for immediate download depending on the needs and requirements of the user.

Business Diagram Data Driven Bar Graph And Pie Chart For Analysis PowerPoint Slide
This PowerPoint template displays technology gadgets with various business charts. Use this diagram slide, in your presentations to make business reports for statistical analysis. You may use this diagram to impart professional appearance to your presentations.
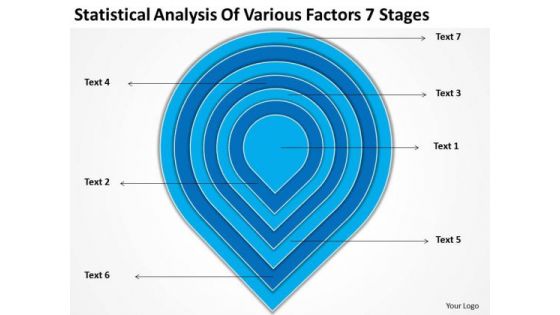
Analysis Of Various Factors 7 Stages Ppt Business Plan Example PowerPoint Templates
We present our analysis of various factors 7 stages ppt business plan example PowerPoint templates.Present our Process and Flows PowerPoint Templates because It can be used to Set your controls for the heart of the sun. Our PowerPoint Templates and Slides will be the propellant to get you there. Download and present our Business PowerPoint Templates because You have the co-ordinates for your destination of success. Let our PowerPoint Templates and Slides map out your journey. Present our Marketing PowerPoint Templates because It is Aesthetically crafted by artistic young minds. Our PowerPoint Templates and Slides are designed to display your dexterity. Use our Flow Charts PowerPoint Templates because Our PowerPoint Templates and Slides will effectively help you save your valuable time. They are readymade to fit into any presentation structure. Present our Shapes PowerPoint Templates because Our PowerPoint Templates and Slides offer you the widest possible range of options.Use these PowerPoint slides for presentations relating to Graphic, chart, pyramid, diagram, info, vector, round, bar, business, icon, button, website, demographic, document, sign, infochart, visual,presentation, glossy, bright, symbol, internet, circle, orange, data, element, abstract, graph, illustration, economic, pie, visualization, collection, rating,design, growth, set, infographic, banner, information, statistic, marketing. The prominent colors used in the PowerPoint template are Blue, Blue light, White. Pilot your journey with our Analysis Of Various Factors 7 Stages Ppt Business Plan Example PowerPoint Templates. Download without worries with our money back guaranteee.

Business Data Analysis Chart For Case Studies PowerPoint Templates
Get Out Of The Dock With Our business data analysis chart for case studies Powerpoint Templates. Your Mind Will Be Set Free.
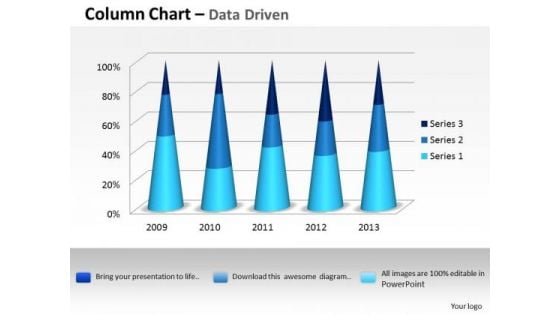
Data Analysis Excel 3d Process Variation Column Chart PowerPoint Templates
Put In A Dollop Of Our data analysis excel 3d process variation column chart Powerpoint Templates. Give Your Thoughts A Distinctive Flavor.
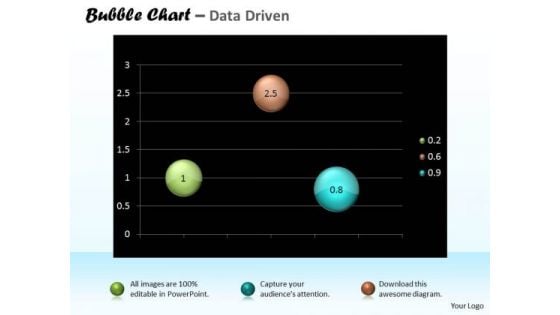
Data Analysis Excel Bubble Chart For Business Tasks PowerPoint Templates
Doll Up Your Thoughts With Our data analysis excel bubble chart for business tasks Powerpoint Templates. They Will Make A Pretty Picture.
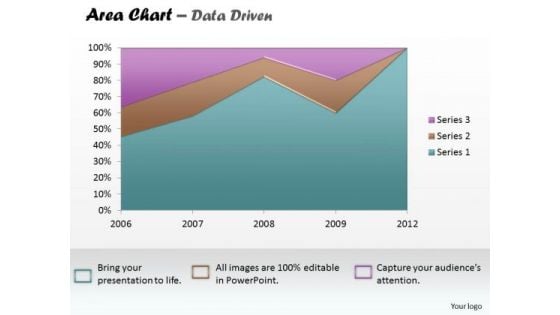
Data Analysis Excel Business Reporting Area Chart PowerPoint Templates
Establish The Dominance Of Your Ideas. Our data analysis excel business reporting area chart Powerpoint Templates Will Put Them On Top.
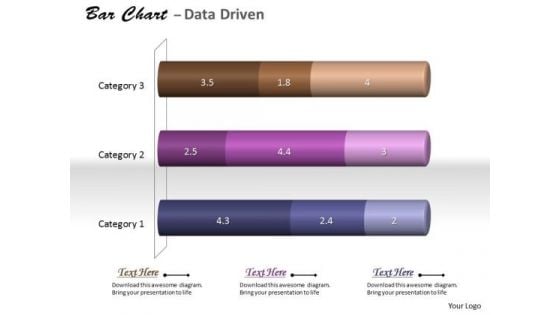
Data Analysis In Excel 3d Classification Of Chart PowerPoint Templates
With Our data analysis in excel 3d classification of chart Powerpoint Templates You Will Be Doubly Sure. They Possess That Stamp Of Authority.
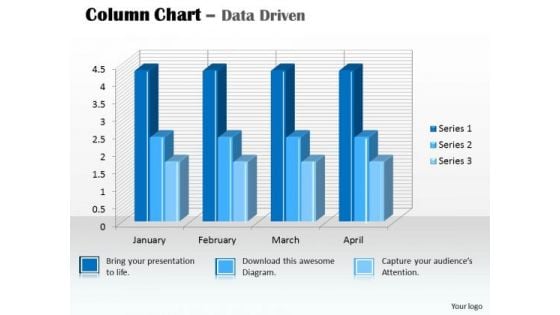
Data Analysis In Excel 3d Column Chart For PowerPoint Templates
Our data analysis in excel 3d column chart for Powerpoint Templates And Your Ideas Make A Great Doubles Pair. Play The Net With Assured Hands.
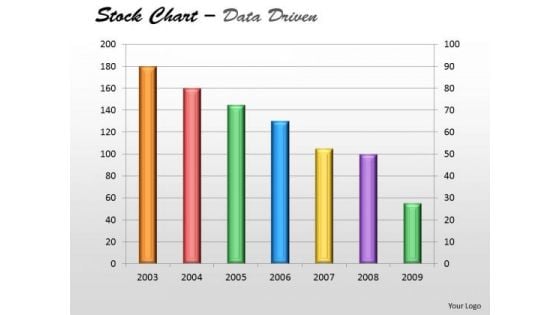
Data Analysis In Excel Of Stock Chart PowerPoint Templates
Plan Your Storyboard With Our data analysis in excel of stock chart Powerpoint Templates . Give An Outline To The Solutions You Have.
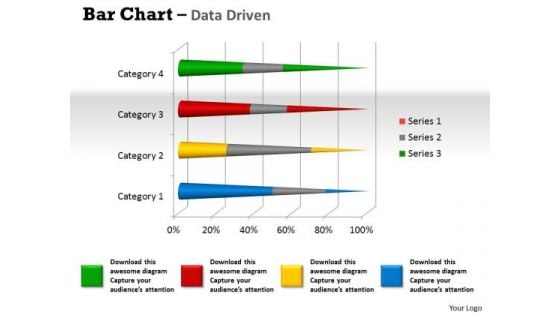
Data Analysis Programs 3d Bar Chart To Dispaly PowerPoint Templates
Lower The Drawbridge With Our data analysis programs 3d bar chart to dispaly Powerpoint Templates . Capture The Minds Of Your Audience.
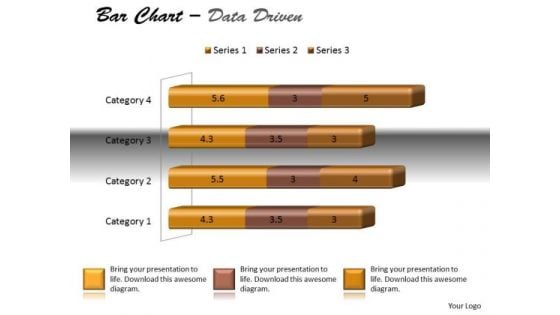
Data Analysis Techniques 3d Bar Chart For Modification PowerPoint Templates
Dreams Generate Thoughts, Thoughts Generate Ideas. Give Them Life With Our data analysis techniques 3d bar chart for modification Powerpoint Templates .
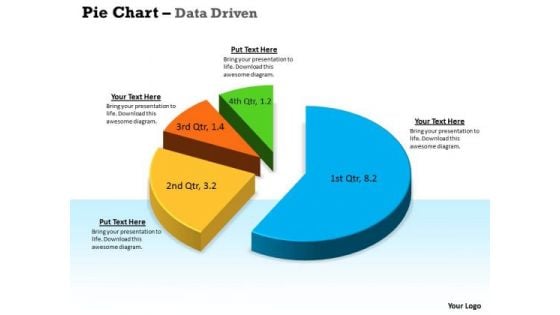
Data Analysis Techniques 3d In Segments Pie Chart PowerPoint Templates
Drink To The Success Of Your Campaign. Our data analysis techniques 3d in segments pie chart Powerpoint Templates Will Raise A Toast.
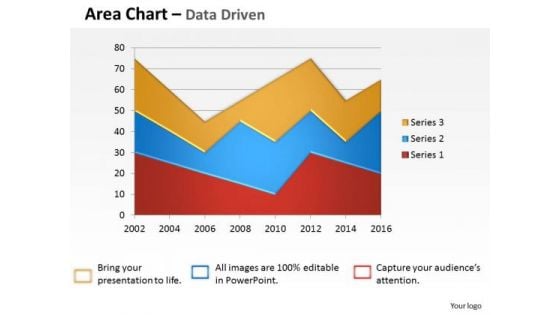
Data Analysis Template Driven Visualization Area Chart PowerPoint Slides Templates
Draw On The Energy Of Our data analysis template driven visualization area chart powerpoint slides Templates . Your Thoughts Will Perk Up.
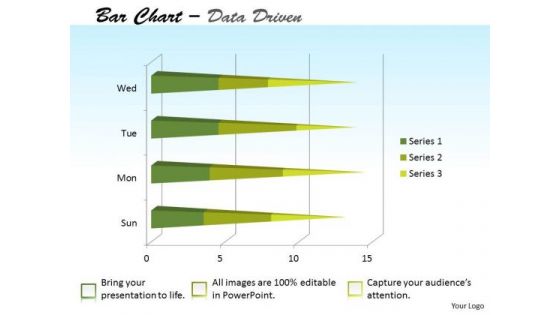
Data Analysis Template Forex Market Bar Chart PowerPoint Templates
Attract A Crowd With Our data analysis template forex market bar chart Powerpoint Templates . They Will Drop It All And Come To Hear You.
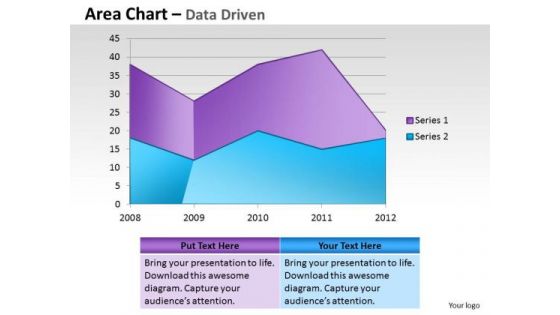
Financial Data Analysis Area Chart For Showing Trends PowerPoint Templates
Document Your Views On Our financial data analysis area chart for showing trends Powerpoint Templates . They Will Create A Strong Impression.
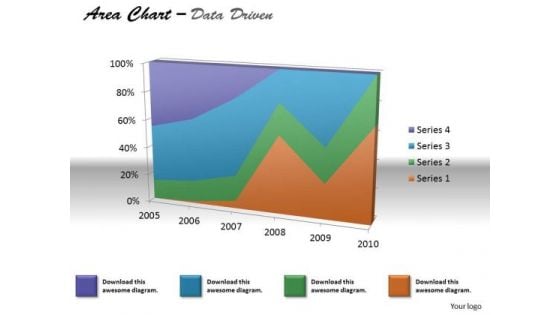
Financial Data Analysis Area Chart For Various Values PowerPoint Templates
Document The Process On Our financial data analysis area chart for various values Powerpoint Templates . Make A Record Of Every Detail.
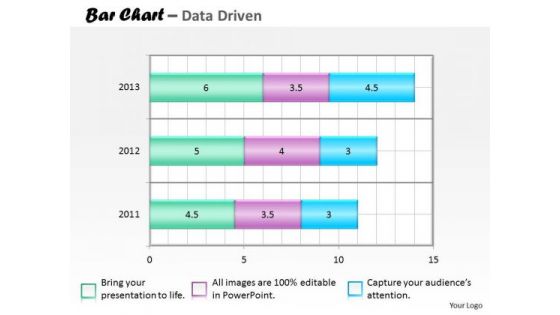
Financial Data Analysis Bar Chart For Collection Of PowerPoint Templates
Our financial data analysis bar chart for collection of Powerpoint Templates Team Are A Dogged Lot. They Keep At It Till They Get It Right.
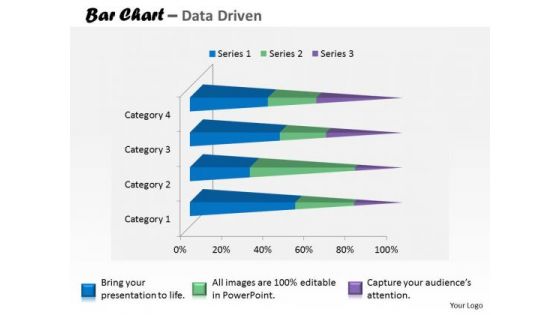
Financial Data Analysis Currency Trading Bar Chart PowerPoint Templates
Put In A Dollop Of Our financial data analysis currency trading bar chart Powerpoint Templates . Give Your Thoughts A Distinctive Flavor.
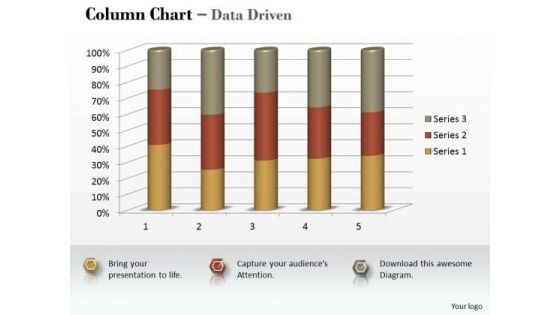
Marketing Data Analysis 3d Statistical Process Column Chart PowerPoint Templates
Be A Donor Of Great Ideas. Display Your Charity On Our marketing data analysis 3d statistical process column chart Powerpoint Templates .
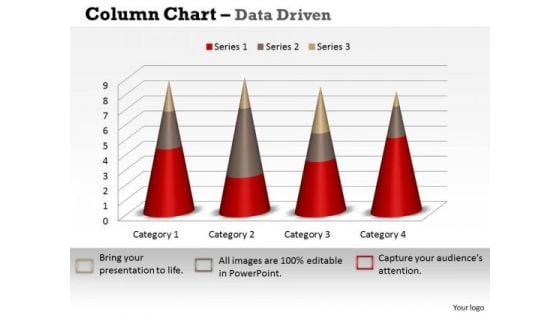
Marketing Data Analysis 3d Statistical Process Control Chart PowerPoint Templates
Open Up Doors That Lead To Success. Our marketing data analysis 3d statistical process control chart Powerpoint Templates Provide The Handles.

Microsoft Excel Data Analysis Bar Chart To Handle PowerPoint Templates
Our microsoft excel data analysis bar chart to handle Powerpoint Templates And Your Ideas Make A Great Doubles Pair. Play The Net With Assured Hands.
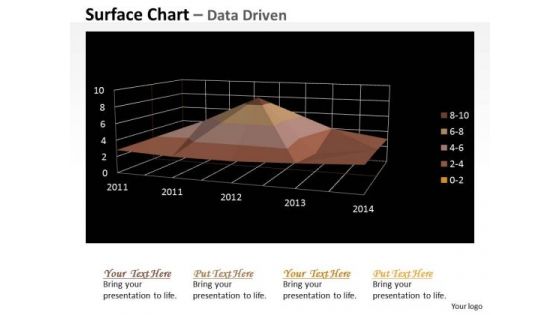
Multivariate Data Analysis Numeric Values Surface Chart PowerPoint Templates
Your Grasp Of Economics Is Well Known. Help Your Audience Comprehend Issues With Our multivariate data analysis numeric values surface chart Powerpoint Templates .
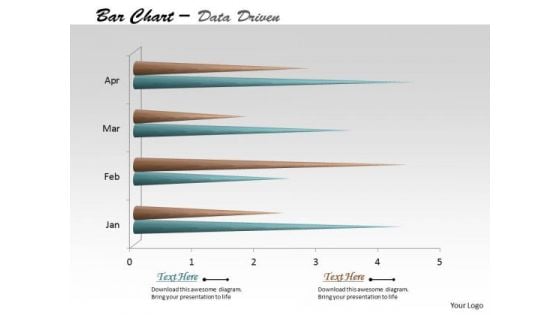
Multivariate Data Analysis Time Based Bar Chart PowerPoint Templates
Edit Your Work With Our multivariate data analysis time based bar chart Powerpoint Templates . They Will Help You Give The Final Form.
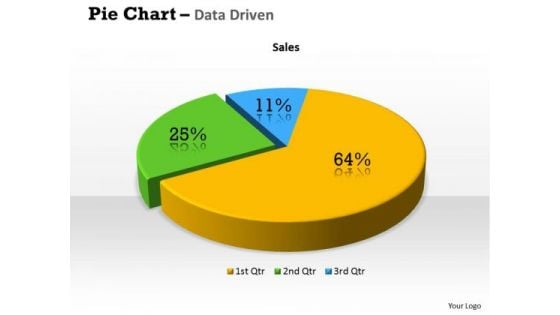
Quantitative Data Analysis 3d Percentage Ratio Pie Chart PowerPoint Templates
Plan Your Storyboard With Our quantitative data analysis 3d percentage ratio pie chart Powerpoint Templates . Give An Outline To The Solutions You Have.
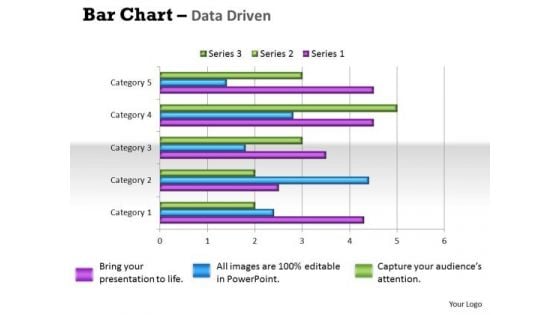
Quantitative Data Analysis Bar Chart For Different Categories PowerPoint Templates
Make Some Dough With Our quantitative data analysis bar chart for different categories Powerpoint Templates . Your Assets Will Rise Significantly.
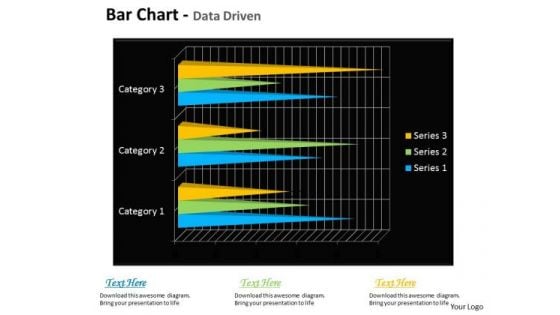
Quantitative Data Analysis Bar Chart For Financial Markets PowerPoint Templates
Draft It Out On Our quantitative data analysis bar chart for financial markets Powerpoint Templates . Give The Final Touches With Your Ideas.
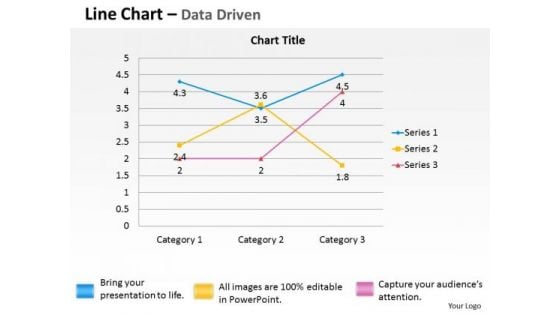
Quantitative Data Analysis Driven Economic Line Chart PowerPoint Slides Templates
Break The Deadlock With Our quantitative data analysis driven economic line chart powerpoint slides Templates . Let The Words Start To Flow.
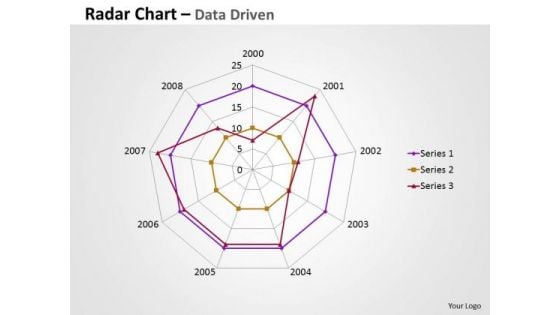
Business Data Analysis Chart Comparing Multiple Entities PowerPoint Templates
Analyze Ailments On Our business data analysis chart comparing multiple entities Powerpoint Templates. Bring Out The Thinking Doctor In You. Dock Your Thoughts With Our Financial Analysis . They Will Launch Them Into Orbit.
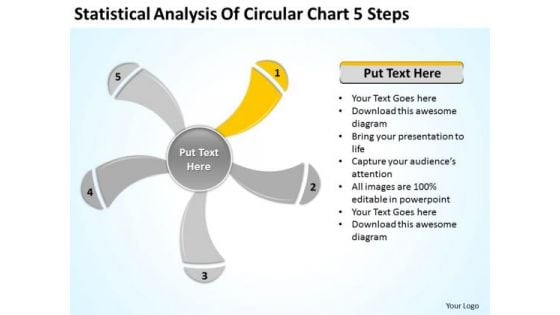
Statistical Analysis Of Circular Chart 5 Steps Ppt Business Plan PowerPoint Slides
We present our statistical analysis of circular chart 5 steps ppt business plan PowerPoint Slides.Download and present our Business PowerPoint Templates because Timeline crunches are a fact of life. Meet all deadlines using our PowerPoint Templates and Slides. Present our Signs PowerPoint Templates because You can Zap them with our PowerPoint Templates and Slides. See them reel under the impact. Use our Shapes PowerPoint Templates because It can Bubble and burst with your ideas. Download our Metaphors-Visual Concepts PowerPoint Templates because You can Create a matrix with our PowerPoint Templates and Slides. Feel the strength of your ideas click into place. Present our Process and Flows PowerPoint Templates because Our PowerPoint Templates and Slides has conjured up a web of all you need with the help of our great team. Use them to string together your glistening ideas.Use these PowerPoint slides for presentations relating to graphically, graphic, vector, layout, business, computation, sign, infochart, visual, symbol, template, diagram, calculations, sector, data, revenue, schedule, element, analysis, drawing, report, technology, contour, classification, graph, modern, illustration, icon, comparison, object, chart, collection, science, color, growth, composition, professional, set, education, math, profits, information, symmetry, statistic, structure, infographics, button. The prominent colors used in the PowerPoint template are Yellow, Gray, White. Use our Statistical Analysis Of Circular Chart 5 Steps Ppt Business Plan PowerPoint Slides to brainstorm. You will be amazed at the ideas that emerge.
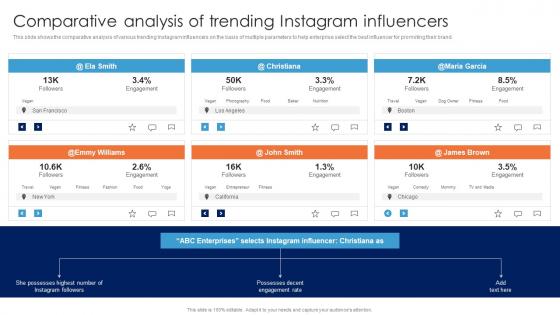
Comparative Analysis Of Trending Instagram Guide For Data Driven Advertising Themes Pdf
This slide shows the comparative analysis of various trending Instagram influencers on the basis of multiple parameters to help enterprise select the best influencer for promoting their brand.This modern and well-arranged Comparative Analysis Of Trending Instagram Guide For Data Driven Advertising Themes Pdf provides lots of creative possibilities. It is very simple to customize and edit with the Powerpoint Software. Just drag and drop your pictures into the shapes. All facets of this template can be edited with Powerpoint no extra software is necessary. Add your own material, put your images in the places assigned for them, adjust the colors, and then you can show your slides to the world, with an animated slide included. This slide shows the comparative analysis of various trending Instagram influencers on the basis of multiple parameters to help enterprise select the best influencer for promoting their brand.
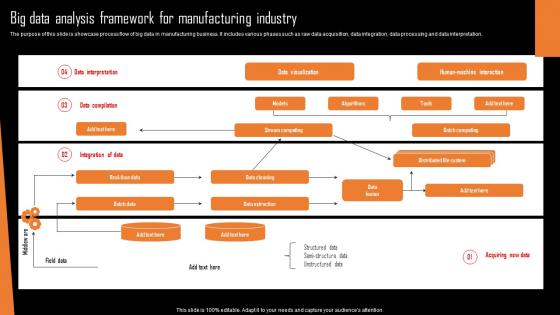
Big Data Analysis Framework For Manufacturing Industry Background Pdf
The purpose of this slide is showcase process flow of big data in manufacturing business. It includes various phases such as raw data acquisition, data integration, data processing and data interpretation.Showcasing this set of slides titled Big Data Analysis Framework For Manufacturing Industry Background Pdf The topics addressed in these templates are Data Visualization, Data Extraction, Data Cleaning All the content presented in this PPT design is completely editable. Download it and make adjustments in color, background, font etc. as per your unique business setting. The purpose of this slide is showcase process flow of big data in manufacturing business. It includes various phases such as raw data acquisition, data integration, data processing and data interpretation.
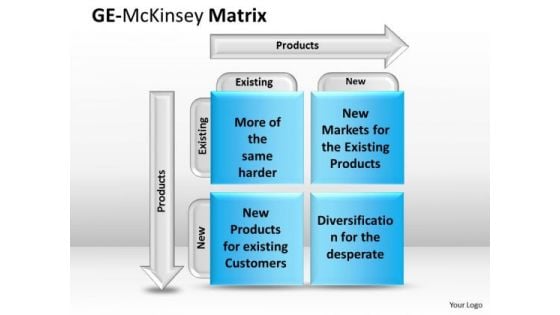
Sales Diagram Ge Mckinsey Ornament Business Finance Strategy Development
Double The Impact With Our Sales Diagram GE McKinsey Ornament Business Finance Strategy Development Powerpoint Templates. Your Thoughts Will Have An Imposing Effect.
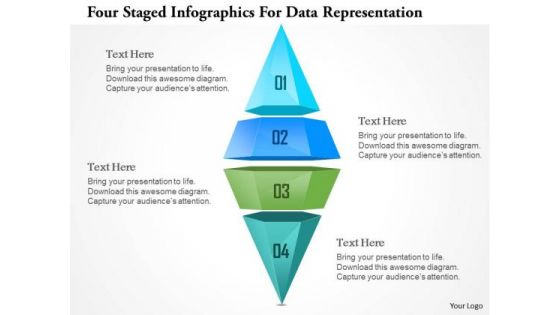
Busines Diagram Four Staged Ingographics For Data Representation Ppt Template
This business diagram has been designed with graphic of four staged info graphics. This info graphic can be used for data representation. Deliver amazing presentations to mesmerize your audience.
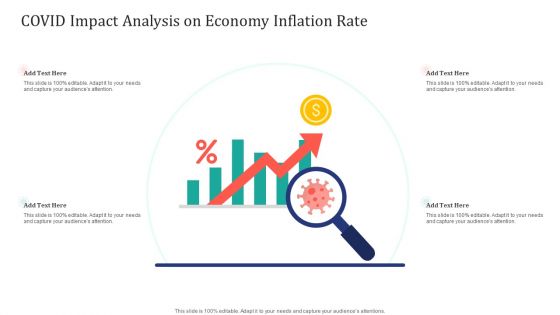
COVID Impact Analysis On Economy Inflation Rate Ppt Portfolio Slide PDF
Presenting COVID Impact Analysis On Economy Inflation Rate Ppt Portfolio Slide PDF to dispense important information. This template comprises one stages. It also presents valuable insights into the topics including COVID Impact Analysis, Economy Inflation Rate. This is a completely customizable PowerPoint theme that can be put to use immediately. So, download it and address the topic impactfully.
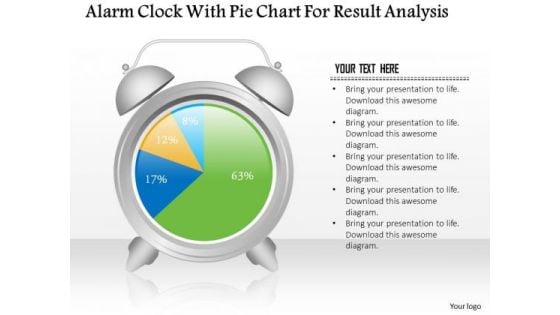
Business Diagram Alarm Clock With Pie Chart For Result Analysis PowerPoint Slide
This business slide displays alarm clock with pie chart. This diagram is a data visualization tool that gives you a simple way to present statistical information. This slide helps your audience examine and interpret the data you present.
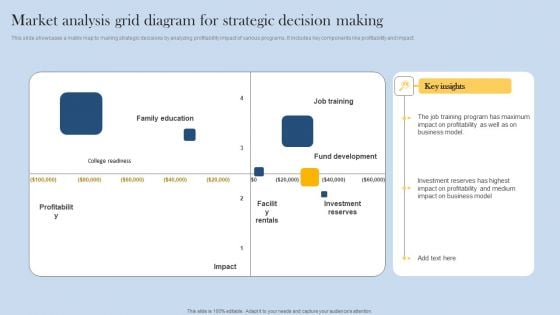
Market Analysis Grid Diagram For Strategic Decision Making Themes PDF
This slide showcases a matrix map to making strategic decisions by analyzing profitability impact of various programs. It includes key components like profitability and impact. Presenting Market Analysis Grid Diagram For Strategic Decision Making Themes PDF to dispense important information. This template comprises one stages. It also presents valuable insights into the topics including Family Education, Fund Development, Job Training. This is a completely customizable PowerPoint theme that can be put to use immediately. So, download it and address the topic impactfully.
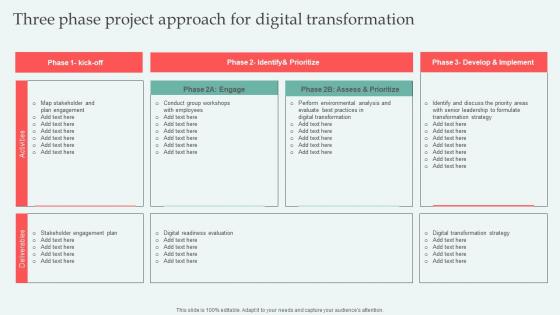
Three Phase Project Approach Digital Approaches To Increase Business Growth Guidelines Pdf
Presenting this PowerPoint presentation, titled Three Phase Project Approach Digital Approaches To Increase Business Growth Guidelines Pdf, with topics curated by our researchers after extensive research. This editable presentation is available for immediate download and provides attractive features when used. Download now and captivate your audience. Presenting this Three Phase Project Approach Digital Approaches To Increase Business Growth Guidelines Pdf. Our researchers have carefully researched and created these slides with all aspects taken into consideration. This is a completely customizable Three Phase Project Approach Digital Approaches To Increase Business Growth Guidelines Pdf that is available for immediate downloading. Download now and make an impact on your audience. Highlight the attractive features available with our PPTs. Our Three Phase Project Approach Digital Approaches To Increase Business Growth Guidelines Pdf are topically designed to provide an attractive backdrop to any subject. Use them to look like a presentation pro.
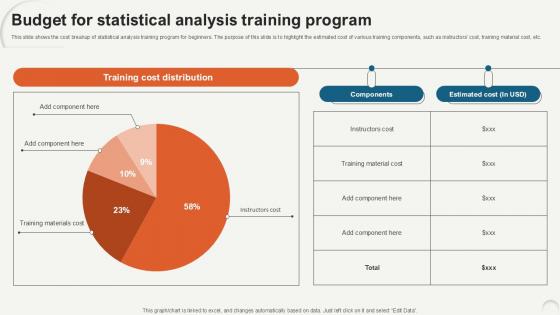
Budget For Statistical Data Analytics For Informed Decision Ppt Slide
This slide shows the cost breakup of statistical analysis training program for beginners. The purpose of this slide is to highlight the estimated cost of various training components, such as instructors cost, training material cost, etc. Do you have to make sure that everyone on your team knows about any specific topic I yes, then you should give Budget For Statistical Data Analytics For Informed Decision Ppt Slide a try. Our experts have put a lot of knowledge and effort into creating this impeccable Budget For Statistical Data Analytics For Informed Decision Ppt Slide. You can use this template for your upcoming presentations, as the slides are perfect to represent even the tiniest detail. You can download these templates from the Slidegeeks website and these are easy to edit. So grab these today This slide shows the cost breakup of statistical analysis training program for beginners. The purpose of this slide is to highlight the estimated cost of various training components, such as instructors cost, training material cost, etc.
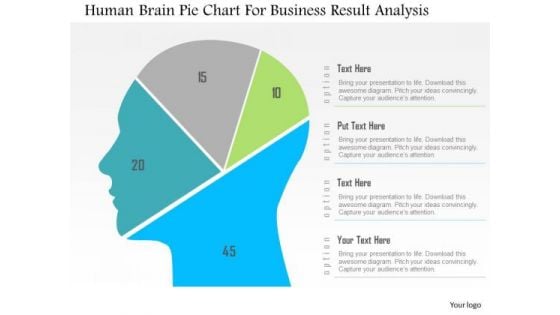
Business Diagram Human Brain Pie Chart For Business Result Analysis PowerPoint Slide
This diagram displays human face graphic divided into sections. This section can be used for data display. Use this diagram to build professional presentations for your viewers.
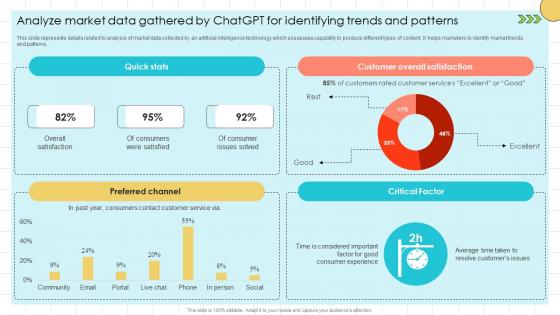
Chat GPT Prompts For Market Analyze Market Data Gathered By ChatGPT SS V
This slide represents details related to analysis of market data collected by an artificial intelligence technology which possesses capability to produce different types of content. It helps marketers to identify market trends and patterns. Do you have to make sure that everyone on your team knows about any specific topic I yes, then you should give Chat GPT Prompts For Market Analyze Market Data Gathered By ChatGPT SS V a try. Our experts have put a lot of knowledge and effort into creating this impeccable Chat GPT Prompts For Market Analyze Market Data Gathered By ChatGPT SS V. You can use this template for your upcoming presentations, as the slides are perfect to represent even the tiniest detail. You can download these templates from the Slidegeeks website and these are easy to edit. So grab these today This slide represents details related to analysis of market data collected by an artificial intelligence technology which possesses capability to produce different types of content. It helps marketers to identify market trends and patterns.
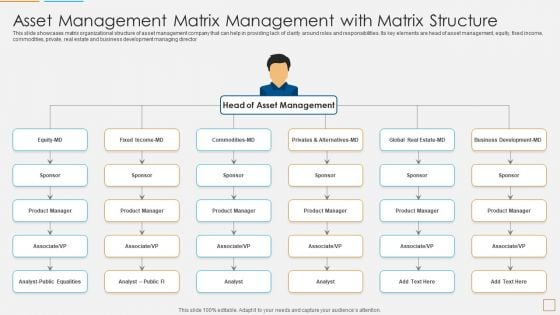
Asset Management Matrix Management With Matrix Structure Introduction PDF
This slide showcases matrix organizational structure of asset management company that can help in providing lack of clarity around roles and responsibilities. Its key elements are head of asset management, equity, fixed income, commodities, private, real estate and business development managing director Presenting asset management matrix management with matrix structure introduction pdf to dispense important information. This template comprises five stages. It also presents valuable insights into the topics including product manager, analyst public equalities, fixed income md, privates and alternatives md. This is a completely customizable PowerPoint theme that can be put to use immediately. So, download it and address the topic impactfully.
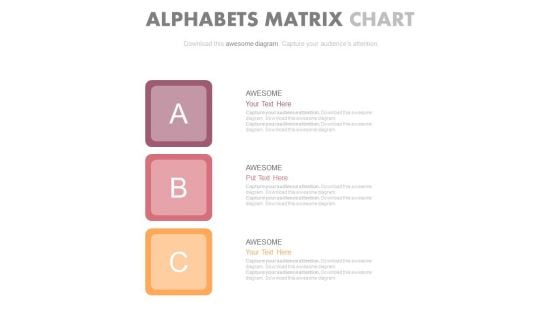
Abc Steps Chart For Data Analysis Powerpoint Slides
Our above PPT slide contains graphics of ABC steps chart. This business diagram helps to depict business information for strategic management. Use this diagram to impart more clarity to data and to create more sound impact on viewers.
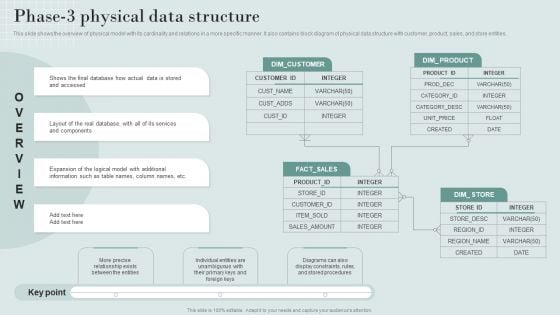
Data Structure IT Phase 3 Physical Data Structure Designs PDF
The Data Structure IT Phase 3 Physical Data Structure Designs PDF is a compilation of the most recent design trends as a series of slides. It is suitable for any subject or industry presentation, containing attractive visuals and photo spots for businesses to clearly express their messages. This template contains a variety of slides for the user to input data, such as structures to contrast two elements, bullet points, and slides for written information. Slidegeeks is prepared to create an impression.
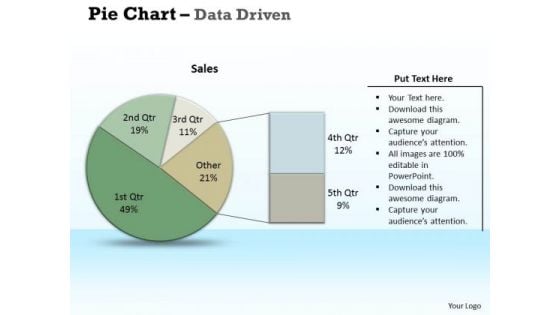
Examples Of Data Analysis Market Driven Pie Chart Research PowerPoint Slides Templates
Chalk It Up With Our examples of data analysis market driven pie chart research powerpoint slides Templates . Add To The Credits Of Your Ideas.

Data Structure IT Phase 2 Logical Data Structure Professional PDF
The best PPT templates are a great way to save time, energy, and resources. Slidegeeks have 100 percent editable powerpoint slides making them incredibly versatile. With these quality presentation templates, you can create a captivating and memorable presentation by combining visually appealing slides and effectively communicating your message. Download Data Structure IT Phase 2 Logical Data Structure Professional PDF from Slidegeeks and deliver a wonderful presentation.
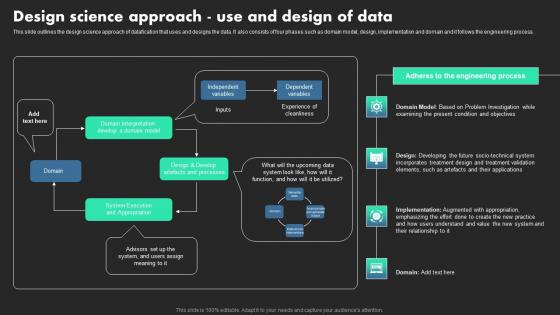
Design Science Approach Use And Design Of Data Ethical Dimensions Of Datafication Brochure Pdf
This slide outlines the design science approach of datafication that uses and designs the data. It also consists of four phases such as domain model, design, implementation and domain and it follows the engineering process. Coming up with a presentation necessitates that the majority of the effort goes into the content and the message you intend to convey. The visuals of a PowerPoint presentation can only be effective if it supplements and supports the story that is being told. Keeping this in mind our experts created Design Science Approach Use And Design Of Data Ethical Dimensions Of Datafication Brochure Pdf to reduce the time that goes into designing the presentation. This way, you can concentrate on the message while our designers take care of providing you with the right template for the situation. This slide outlines the design science approach of datafication that uses and designs the data. It also consists of four phases such as domain model, design, implementation and domain and it follows the engineering process.
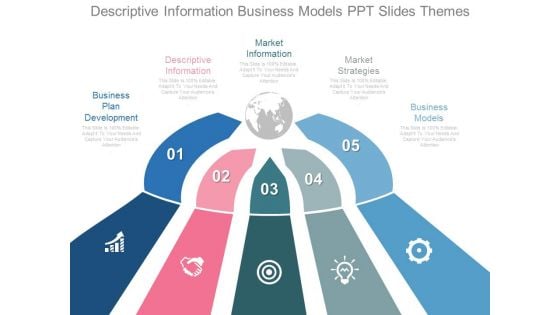
Descriptive Information Business Models Ppt Slides Themes
This is a descriptive information business models ppt slides themes. This is a five stage process. The stages in this process are globe, marketing, geographical.
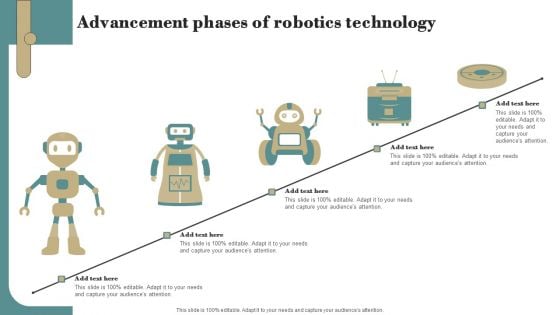
Advancement Phases Of Robotics Technology Mockup PDF
Presenting Advancement Phases Of Robotics Technology Mockup PDF to dispense important information. This template comprises five stages. It also presents valuable insights into the topics including Advancement Phases, Robotics Technology. This is a completely customizable PowerPoint theme that can be put to use immediately. So, download it and address the topic impactfully.
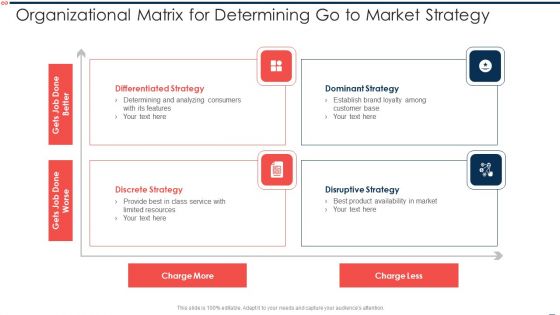
Organizational Matrix For Determining Go To Market Strategy Themes PDF
Presenting organizational matrix for determining go to market strategy themes pdf to dispense important information. This template comprises four stages. It also presents valuable insights into the topics including differentiated strategy, dominant strategy, disruptive strategy. This is a completely customizable PowerPoint theme that can be put to use immediately. So, download it and address the topic impactfully.
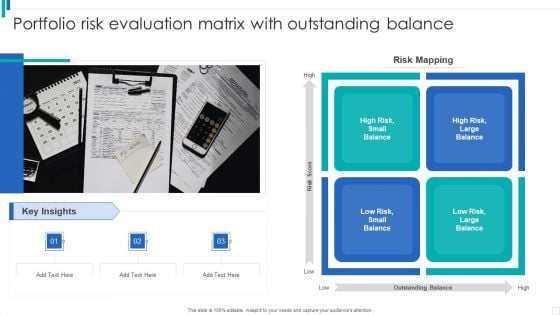
Portfolio Risk Evaluation Matrix With Outstanding Balance Themes PDF
Presenting Portfolio Risk Evaluation Matrix With Outstanding Balance Themes PDF to dispense important information. This template comprises four stages. It also presents valuable insights into the topics including Low Risk, High Risk, Outstanding Balance. This is a completely customizable PowerPoint theme that can be put to use immediately. So, download it and address the topic impactfully.


 Continue with Email

 Home
Home


