Heatmap Icon
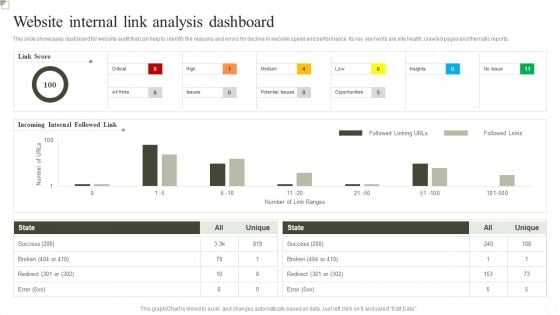
Website Internal Link Analysis Dashboard Ppt Inspiration Outline PDF
This slide showcases dashboard for website Analysis that can help to identify the reasons and errors for decline in website speed and performance. Its key elements are site health, crawled pages and thematic reports. Pitch your topic with ease and precision using this Website Internal Link Analysis Dashboard Ppt Inspiration Outline PDF. This layout presents information on Success, Incoming Internal Followed Link, Link Score. It is also available for immediate download and adjustment. So, changes can be made in the color, design, graphics or any other component to create a unique layout.
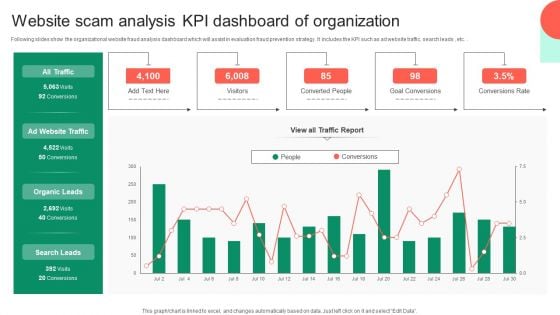
Website Scam Analysis KPI Dashboard Of Organization Sample PDF
Following slides show the organizational website fraud analysis dashboard which will assist in evaluation fraud prevention strategy. It includes the KPI such as ad website traffic, search leads , etc. Showcasing this set of slides titled Website Scam Analysis KPI Dashboard Of Organization Sample PDF. The topics addressed in these templates are Goal Conversions, Conversions Rate, Organic Leads. All the content presented in this PPT design is completely editable. Download it and make adjustments in color, background, font etc. as per your unique business setting.
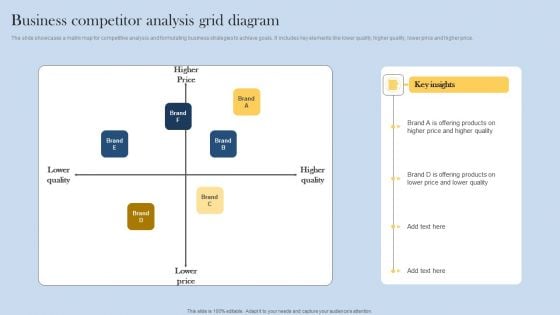
Business Competitor Analysis Grid Diagram Graphics PDF
The slide showcases a matrix map for competitive analysis and formulating business strategies to achieve goals. It includes key elements like lower quality, higher quality, lower price and higher price. Presenting Business Competitor Analysis Grid Diagram Graphics PDF to dispense important information. This template comprises one stages. It also presents valuable insights into the topics including Offering Products, Business Competitor, Analysis Grid Diagram. This is a completely customizable PowerPoint theme that can be put to use immediately. So, download it and address the topic impactfully.
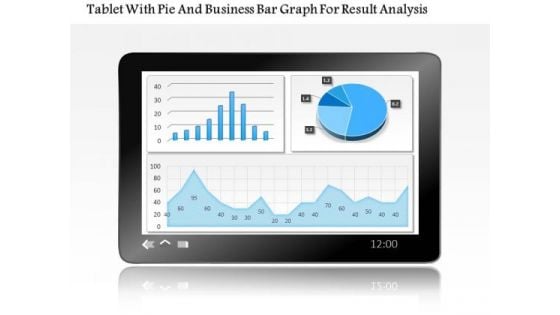
Business Diagram Tablet With Pie And Business Bar Graph For Result Analysis PowerPoint Slide
This PowerPoint template displays technology gadgets with various business charts. Use this diagram slide, in your presentations to make business reports for statistical analysis. You may use this diagram to impart professional appearance to your presentations.
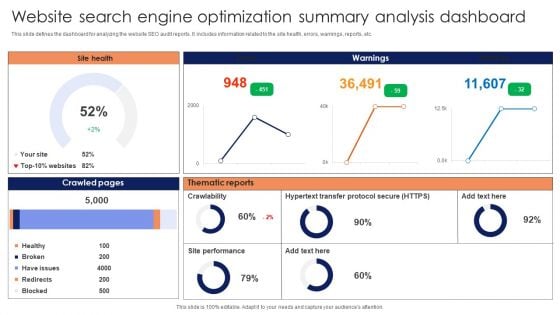
Website Search Engine Optimization Summary Analysis Dashboard Infographics PDF
This slide defines the dashboard for analyzing the website SEO audit reports. It includes information related to the site health, errors, warnings, reports, etc. Showcasing this set of slides titled Website Search Engine Optimization Summary Analysis Dashboard Infographics PDF. The topics addressed in these templates are Crawled Pages, Thematic Reports, Site Health, Warnings. All the content presented in this PPT design is completely editable. Download it and make adjustments in color, background, font etc. as per your unique business setting.
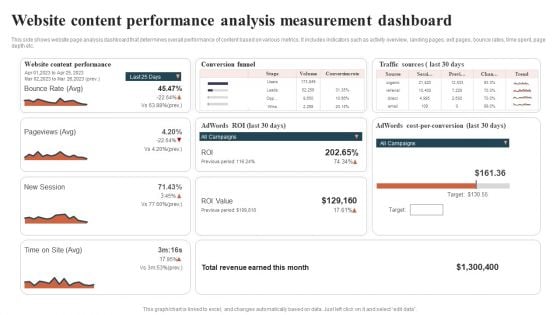
Website Content Performance Analysis Measurement Dashboard Guidelines PDF
This side shows website page analysis dashboard that determines overall performance of content based on various metrics. It includes indicators such as activity overview, landing pages, exit pages, bounce rates, time spent, page depth etc. Showcasing this set of slides titled Website Content Performance Analysis Measurement Dashboard Guidelines PDF. The topics addressed in these templates are Conversion Funnel, Traffic Sources, Total Revenue. All the content presented in this PPT design is completely editable. Download it and make adjustments in color, background, font etc. as per your unique business setting.
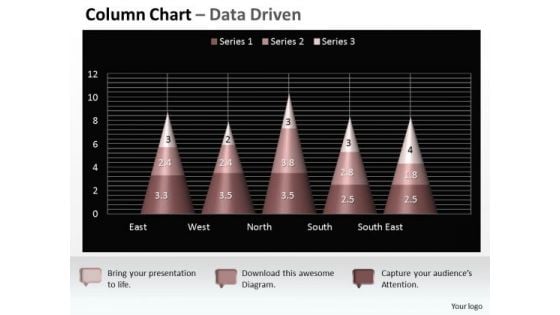
Data Analysis On Excel 3d Chart Shows Interrelated Sets Of PowerPoint Templates
Put Them On The Same Page With Our data analysis on excel 3d chart shows interrelated sets of Powerpoint Templates . Your Team Will Sing From The Same Sheet.
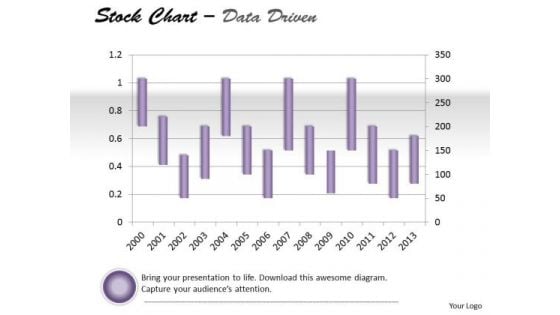
Data Analysis On Excel Driven Stock Chart For Market History PowerPoint Slides Templates
Draw Out The Best In You With Our data analysis on excel driven stock chart for market history powerpoint slides Templates . Let Your Inner Brilliance Come To The Surface.
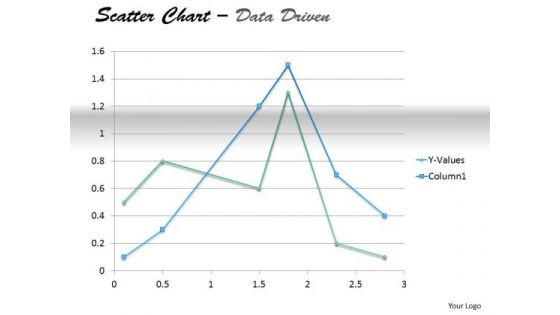
Examples Of Data Analysis Market Driven Present In Scatter Chart PowerPoint Slides Templates
Your Thoughts Will Take To Our examples of data analysis market driven present in scatter chart powerpoint slides Templates Like A Duck To Water. They Develop A Binding Affinity.
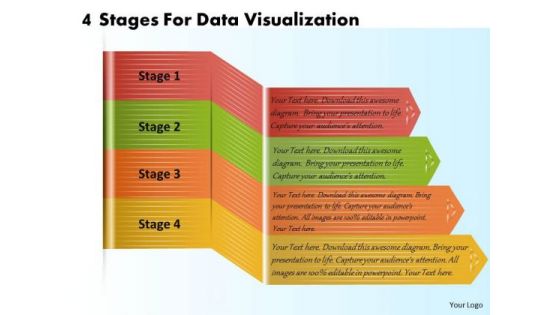
Business Plan And Strategy 4 Stages For Data Visualization Strategic Planning Template Ppt Slide
Your Listeners Will Never Doodle. Our business plan and strategy 4 stages for data visualization strategic planning template ppt slide Powerpoint Templates Will Hold Their Concentration. Do The One Thing With Your Thoughts. Uphold Custom With Our Process and Flows Powerpoint Templates.
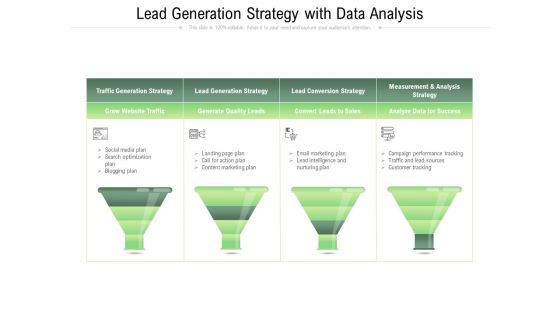
Lead Generation Strategy With Data Analysis Ppt PowerPoint Presentation Gallery Example PDF
Presenting lead generation strategy with data analysis ppt powerpoint presentation gallery example pdf to dispense important information. This template comprises four stages. It also presents valuable insights into the topics including grow, website, traffic. This is a completely customizable PowerPoint theme that can be put to use immediately. So, download it and address the topic impactfully.
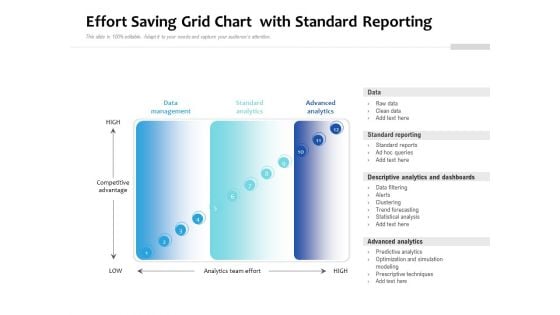
Effort Saving Grid Chart With Standard Reporting Ppt PowerPoint Presentation Layouts Graphics PDF
Presenting effort saving grid chart with standard reporting ppt powerpoint presentation layouts graphics pdf to dispense important information. This template comprises twelve stages. It also presents valuable insights into the topics including data management, standard analytics, advanced analytics. This is a completely customizable PowerPoint theme that can be put to use immediately. So, download it and address the topic impactfully.
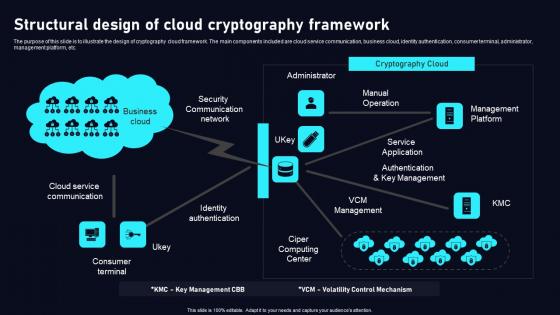
Structural Design Of Cloud Cryptography Cloud Data Security Using Cryptography Themes Pdf
The purpose of this slide is to illustrate the design of cryptography cloud framework. The main components included are cloud service communication, business cloud, identity authentication, consumer terminal, administrator, management platform, etc. If your project calls for a presentation, then Slidegeeks is your go to partner because we have professionally designed, easy to edit templates that are perfect for any presentation. After downloading, you can easily edit Structural Design Of Cloud Cryptography Cloud Data Security Using Cryptography Themes Pdf and make the changes accordingly. You can rearrange slides or fill them with different images. Check out all the handy templates The purpose of this slide is to illustrate the design of cryptography cloud framework. The main components included are cloud service communication, business cloud, identity authentication, consumer terminal, administrator, management platform, etc.
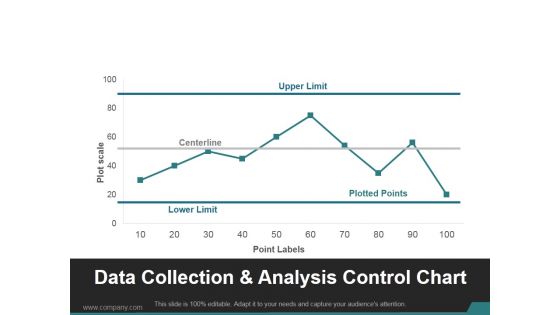
Data Collection And Analysis Control Chart Ppt PowerPoint Presentation Visuals
This is a data collection and analysis control chart ppt powerpoint presentation visuals. This is a ten stage process. The stages in this process are upper limit, centerline, lower limit, plotted points.
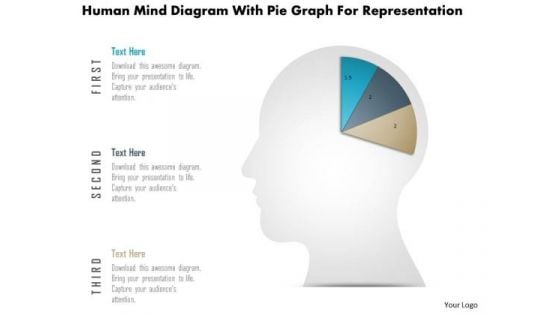
Business Diagram Human Mind Diagram With Pie Graph For Representation PowerPoint Slide
This diagram displays human face graphic divided into sections. This section can be used for data display. Use this diagram to build professional presentations for your viewers.
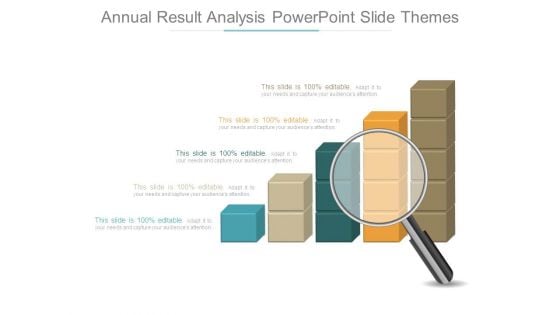
Annual Result Analysis Powerpoint Slide Themes
This is a annual result analysis powerpoint slide themes. This is a five stage process. The stages in this process are business, process, presentation, strategy, analysis.
Mobile With Analytics Chart Ppt PowerPoint Presentation Layouts Graphics
This is a mobile with analytics chart ppt powerpoint presentation layouts graphics. This is a four stage process. The stages in this process are mobile analytics, mobile tracking, mobile web analytics.
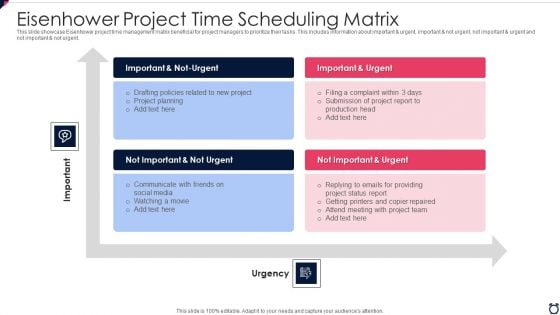
Eisenhower Project Time Scheduling Matrix Slides PDF
This slide showcase Eisenhower project time management matrix beneficial for project managers to prioritize their tasks. This includes information about important and urgent, important and not urgent, not important and urgent and not important and not urgent. Presenting eisenhower project time scheduling matrix slides pdf to dispense important information. This template comprises four stages. It also presents valuable insights into the topics including communicate, social media, planning. This is a completely customizable PowerPoint theme that can be put to use immediately. So, download it and address the topic impactfully.
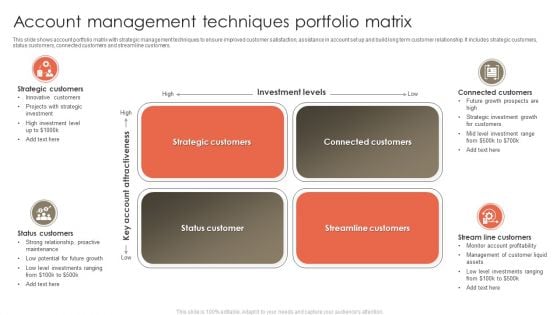
Account Management Techniques Portfolio Matrix Demonstration PDF
This slide shows account portfolio matrix with strategic management techniques to ensure improved customer satisfaction, assistance in account set up and build long term customer relationship. It includes strategic customers, status customers, connected customers and stream line customers.Presenting Account Management Techniques Portfolio Matrix Demonstration PDF to dispense important information. This template comprises four stages. It also presents valuable insights into the topics including Strategic Customers, Connected Customers, Status Customer. This is a completely customizable PowerPoint theme that can be put to use immediately. So, download it and address the topic impactfully.
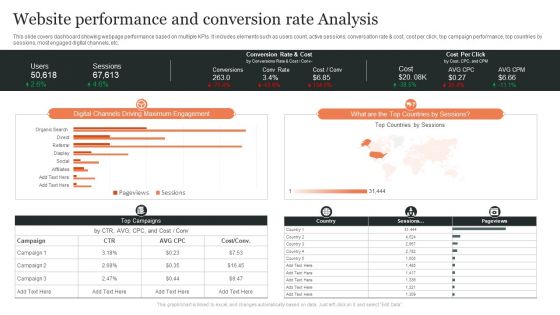
Website Performance And Conversion Rate Analysis Ppt Slides Inspiration PDF
This slide covers dashboard showing webpage performance based on multiple KPIs. It includes elements such as users count, active sessions, conversation rate and cost, cost per click, top campaign performance, top countries by sessions, most engaged digital channels, etc. Showcasing this set of slides titled Website Performance And Conversion Rate Analysis Ppt Slides Inspiration PDF. The topics addressed in these templates are Digital Channels, Driving Maximum, Engagement. All the content presented in this PPT design is completely editable. Download it and make adjustments in color, background, font etc. as per your unique business setting.
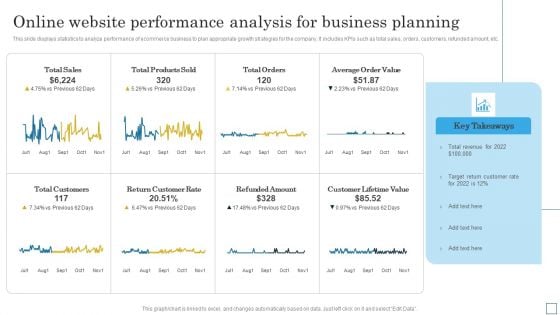
Online Website Performance Analysis For Business Planning Slides PDF
This slide displays statistics to analyze performance of ecommerce business to plan appropriate growth strategies for the company. It includes KPIs such as total sales, orders, customers, refunded amount, etc. Pitch your topic with ease and precision using this Online Website Performance Analysis For Business Planning Slides PDF. This layout presents information on Revenue, Customer Rate, Target. It is also available for immediate download and adjustment. So, changes can be made in the color, design, graphics or any other component to create a unique layout.
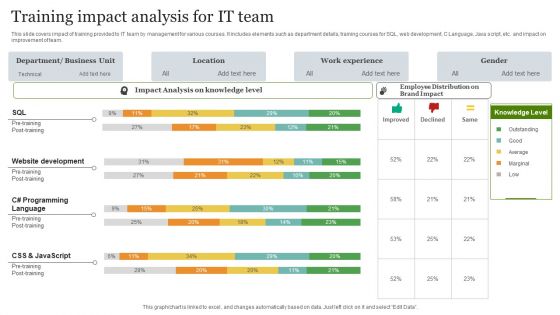
Training Impact Analysis For It Team Inspiration PDF
This slide covers impact of training provided to IT team by management for various courses. It includes elements such as department details, training courses for SQL, web development, C Language, Java script, etc. and impact on improvement of team. Showcasing this set of slides titled Training Impact Analysis For It Team Inspiration PDF. The topics addressed in these templates are Website Development, Analysis, Location. All the content presented in this PPT design is completely editable. Download it and make adjustments in color, background, font etc. as per your unique business setting.
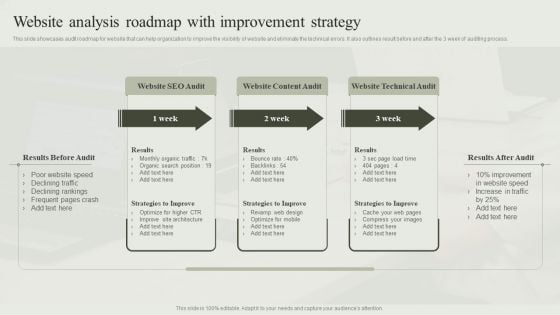
Website Analysis Roadmap With Improvement Strategy Ppt Gallery Good PDF
This slide showcases audit roadmap for website that can help organization to improve the visibility of website and eliminate the technical errors. It also outlines result before and after the 3 week of auditing process. Presenting Website Analysis Roadmap With Improvement Strategy Ppt Gallery Good PDF to dispense important information. This template comprises three stages. It also presents valuable insights into the topics including Website SEO Audit, Website Content Audit, Website Technical Audit. This is a completely customizable PowerPoint theme that can be put to use immediately. So, download it and address the topic impactfully.
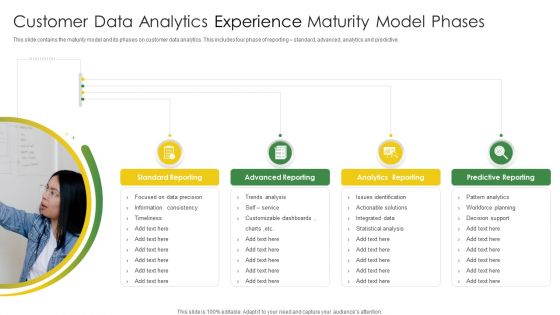
Customer Data Analytics Experience Maturity Model Phases Download PDF
This slide contains the maturity model and its phases on customer data analytics. This includes four phase of reporting standard, advanced, analytics and predictive. Presenting Customer Data Analytics Experience Maturity Model Phases Download PDF to dispense important information. This template comprises four stages. It also presents valuable insights into the topics including Advanced Reporting, Analytics Reporting, Predictive Reporting, Standard Reporting. This is a completely customizable PowerPoint theme that can be put to use immediately. So, download it and address the topic impactfully.
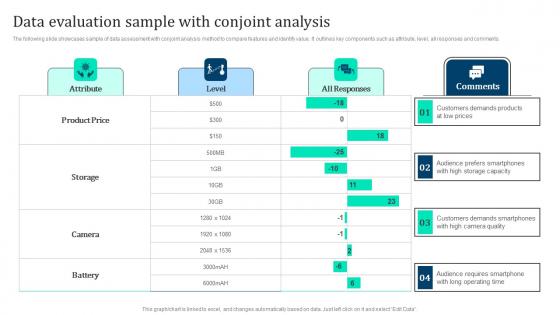
Data Evaluation Sample With Conjoint Marketing Intelligence Guide Data Gathering Sample Pdf
The following slide showcases sample of data assessment with conjoint analysis method to compare features and identify value. It outlines key components such as attribute, level, all responses and comments. Slidegeeks is here to make your presentations a breeze with Data Evaluation Sample With Conjoint Marketing Intelligence Guide Data Gathering Sample Pdf With our easy to use and customizable templates, you can focus on delivering your ideas rather than worrying about formatting. With a variety of designs to choose from, you are sure to find one that suits your needs. And with animations and unique photos, illustrations, and fonts, you can make your presentation pop. So whether you are giving a sales pitch or presenting to the board, make sure to check out Slidegeeks first The following slide showcases sample of data assessment with conjoint analysis method to compare features and identify value. It outlines key components such as attribute, level, all responses and comments.

Business Diagram Three Staged Pencil Diagram For Graph Formation PowerPoint Slide
This business diagram displays set of pencils. This Power Point template has been designed to compare and present business data. Download this diagram to represent stages of business growth.

Trend Line Technical Analysis Powerpoint Themes
This is a trend line technical analysis powerpoint themes. This is a five stage process. The stages in this process are complex systems, statistical modeling, uncertainty, lateral thinking, mathematical analysis.
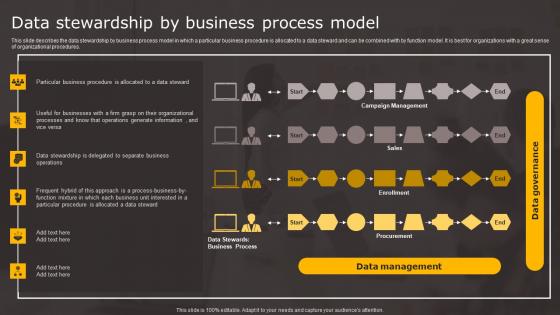
Data Stewardship By Business Data Stewardship In Business Processes Diagrams Pdf
This slide describes the data stewardship by business process model in which a particular business procedure is allocated to a data steward and can be combined with by function model. It is best for organizations with a great sense of organizational procedures. If your project calls for a presentation, then Slidegeeks is your go to partner because we have professionally designed, easy to edit templates that are perfect for any presentation. After downloading, you can easily edit Data Stewardship By Business Data Stewardship In Business Processes Diagrams Pdf and make the changes accordingly. You can rearrange slides or fill them with different images. Check out all the handy templates This slide describes the data stewardship by business process model in which a particular business procedure is allocated to a data steward and can be combined with by function model. It is best for organizations with a great sense of organizational procedures.
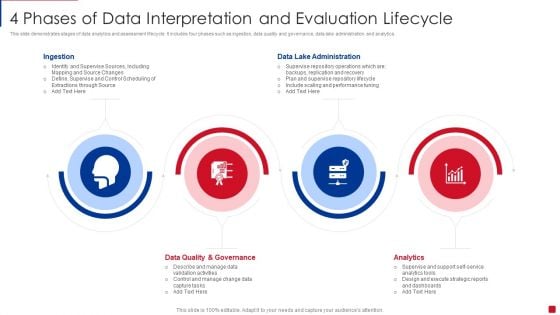
4 Phases Of Data Interpretation And Evaluation Lifecycle Guidelines PDF
This slide demonstrates stages of data analytics and assessment lifecycle. It includes four phases such as ingestion, data quality and governance, data lake administration and analytics. Presenting 4 Phases Of Data Interpretation And Evaluation Lifecycle Guidelines PDF to dispense important information. This template comprises four stages. It also presents valuable insights into the topics including Ingestion, Data Quality And Governance, Analytics. This is a completely customizable PowerPoint theme that can be put to use immediately. So, download it and address the topic impactfully.
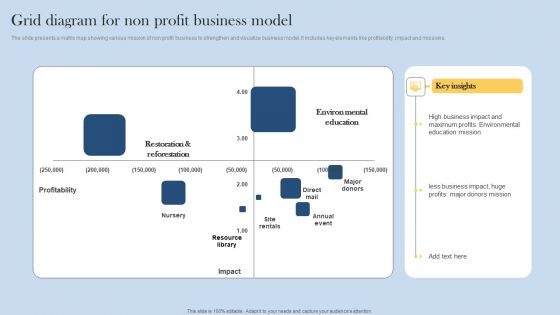
Grid Diagram For Non Profit Business Model Introduction PDF
The slide presents a matrix map showing various mission of non profit business to strengthen and visualize business model. It includes key elements like profitability, impact and missions. Presenting Grid Diagram For Non Profit Business Model Introduction PDF to dispense important information. This template comprises one stages. It also presents valuable insights into the topics including Restoration Reforestation, Environ Mental Education, Resource Library. This is a completely customizable PowerPoint theme that can be put to use immediately. So, download it and address the topic impactfully.
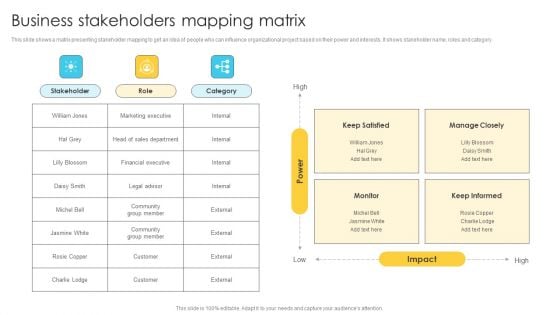
Business Stakeholders Mapping Matrix Clipart PDF
This slide shows a matrix presenting stakeholder mapping to get an idea of people who can influence organizational project based on their power and interests. It shows stakeholder name, roles and category.Presenting Business Stakeholders Mapping Matrix Clipart PDF to dispense important information. This template comprises one stage. It also presents valuable insights into the topics including Involve decision, making process, Highly experienced. This is a completely customizable PowerPoint theme that can be put to use immediately. So, download it and address the topic impactfully.
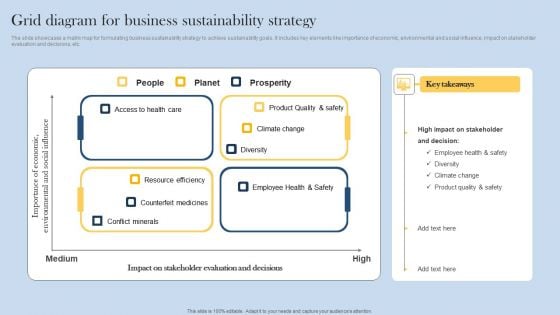
Grid Diagram For Business Sustainability Strategy Structure PDF
The slide showcases a matrix map for formulating business sustainability strategy to achieve sustainability goals. It includes key elements like importance of economic, environmental and social influence, impact on stakeholder evaluation and decisions, etc. Presenting Grid Diagram For Business Sustainability Strategy Structure PDF to dispense important information. This template comprises four stages. It also presents valuable insights into the topics including Employee Health Safety, Diversity, Climate Change. This is a completely customizable PowerPoint theme that can be put to use immediately. So, download it and address the topic impactfully.
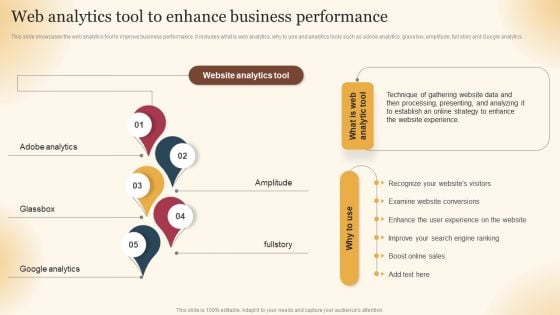
Qualified Traffic Generation Through Search Engines Web Analytics Tool To Enhance Business Performance Microsoft PDF
This slide showcases the web analytics tool to improve business performance. It includes what is web analytics, why to use and analytics tools such as adobe analytics, glassbox, amplitude, full story and Google analytics. If you are looking for a format to display your unique thoughts, then the professionally designed Qualified Traffic Generation Through Search Engines Web Analytics Tool To Enhance Business Performance Microsoft PDF is the one for you. You can use it as a Google Slides template or a PowerPoint template. Incorporate impressive visuals, symbols, images, and other charts. Modify or reorganize the text boxes as you desire. Experiment with shade schemes and font pairings. Alter, share or cooperate with other people on your work. Download Qualified Traffic Generation Through Search Engines Web Analytics Tool To Enhance Business Performance Microsoft PDF and find out how to give a successful presentation. Present a perfect display to your team and make your presentation unforgettable.
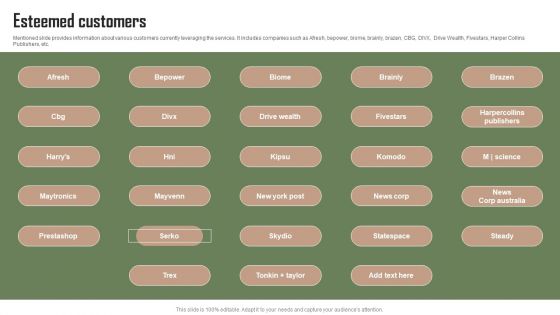
Data Automation Solution Investor Funding Presentation Esteemed Customers Themes PDF
Mentioned slide provides information about various customers currently leveraging the services. It includes companies such as Afresh, bepower, biome, brainly, brazen, CBG, DIVX, Drive Wealth, Fivestars, Harper Collins Publishers, etc. Do you have to make sure that everyone on your team knows about any specific topic I yes, then you should give Data Automation Solution Investor Funding Presentation Esteemed Customers Themes PDF a try. Our experts have put a lot of knowledge and effort into creating this impeccable Data Automation Solution Investor Funding Presentation Esteemed Customers Themes PDF. You can use this template for your upcoming presentations, as the slides are perfect to represent even the tiniest detail. You can download these templates from the Slidegeeks website and these are easy to edit. So grab these today.
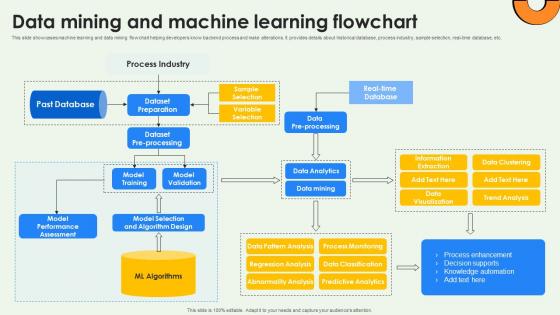
Data Warehousing And Data Mining And Machine Learning Flowchart AI SS V
This slide showcases machine learning and data mining flowchart helping developers know backend process and make alterations. It provides details about historical database, process industry, sample selection, real-time database, etc. Presenting this PowerPoint presentation, titled Data Warehousing And Data Mining And Machine Learning Flowchart AI SS V, with topics curated by our researchers after extensive research. This editable presentation is available for immediate download and provides attractive features when used. Download now and captivate your audience. Presenting this Data Warehousing And Data Mining And Machine Learning Flowchart AI SS V. Our researchers have carefully researched and created these slides with all aspects taken into consideration. This is a completely customizable Data Warehousing And Data Mining And Machine Learning Flowchart AI SS V that is available for immediate downloading. Download now and make an impact on your audience. Highlight the attractive features available with our PPTs. This slide showcases machine learning and data mining flowchart helping developers know backend process and make alterations. It provides details about historical database, process industry, sample selection, real-time database, etc.
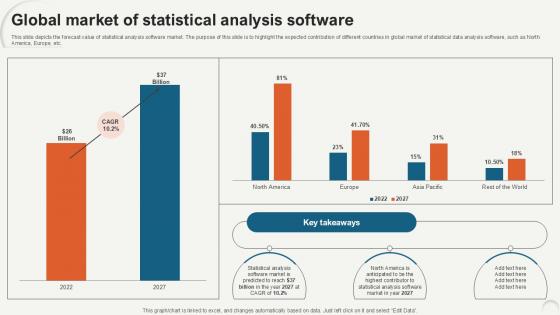
Global Market Of Statistical Data Analytics For Informed Decision Ppt PowerPoint
This slide depicts the forecast value of statistical analysis software market. The purpose of this slide is to highlight the expected contribution of different countries in global market of statistical data analysis software, such as North America, Europe, etc. Are you in need of a template that can accommodate all of your creative concepts This one is crafted professionally and can be altered to fit any style. Use it with Google Slides or PowerPoint. Include striking photographs, symbols, depictions, and other visuals. Fill, move around, or remove text boxes as desired. Test out color palettes and font mixtures. Edit and save your work, or work with colleagues. Download Global Market Of Statistical Data Analytics For Informed Decision Ppt PowerPoint and observe how to make your presentation outstanding. Give an impeccable presentation to your group and make your presentation unforgettable. This slide depicts the forecast value of statistical analysis software market. The purpose of this slide is to highlight the expected contribution of different countries in global market of statistical data analysis software, such as North America, Europe, etc.
Marketers Guide To Data Analysis Optimization Tracking Social Media Content Reach For Better Campaign Results Themes PDF
This slide covers an overview of social media content reach to identify the number of people who see your content, either ads or posts. It also includes improvement strategies such as producing high-quality content, increasing the number of images, etc. There are so many reasons you need a Marketers Guide To Data Analysis Optimization Tracking Social Media Content Reach For Better Campaign Results Themes PDF. The first reason is you cannot spend time making everything from scratch, Thus, Slidegeeks has made presentation templates for you too. You can easily download these templates from our website easily.

Segmentation Of Global Prescriptive Analytics Market Data Analytics SS V
This slide provides an overview of market segmentation of prescriptive analytics at a global level. It covers segmentation analysis based on region, data type, component and deployment with key takeaways.Take your projects to the next level with our ultimate collection of Segmentation Of Global Prescriptive Analytics Market Data Analytics SS V. Slidegeeks has designed a range of layouts that are perfect for representing task or activity duration, keeping track of all your deadlines at a glance. Tailor these designs to your exact needs and give them a truly corporate look with your own brand colors they will make your projects stand out from the rest This slide provides an overview of market segmentation of prescriptive analytics at a global level. It covers segmentation analysis based on region, data type, component and deployment with key takeaways.
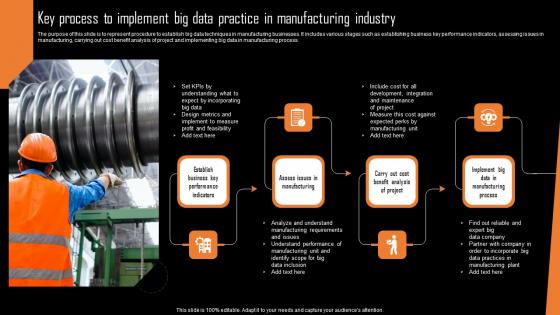
Key Process To Implement Big Data Practice In Manufacturing Industry Diagrams Pdf
The purpose of this slide is to represent procedure to establish big data techniques in manufacturing businesses. It includes various stages such as establishing business key performance indicators, assessing issues in manufacturing, carrying out cost benefit analysis of project and implementing big data in manufacturing process.Showcasing this set of slides titled Key Process To Implement Big Data Practice In Manufacturing Industry Diagrams Pdf The topics addressed in these templates are Expect Incorporating, Understand Performance, Manufacturing Plant All the content presented in this PPT design is completely editable. Download it and make adjustments in color, background, font etc. as per your unique business setting. The purpose of this slide is to represent procedure to establish big data techniques in manufacturing businesses. It includes various stages such as establishing business key performance indicators, assessing issues in manufacturing, carrying out cost benefit analysis of project and implementing big data in manufacturing process.
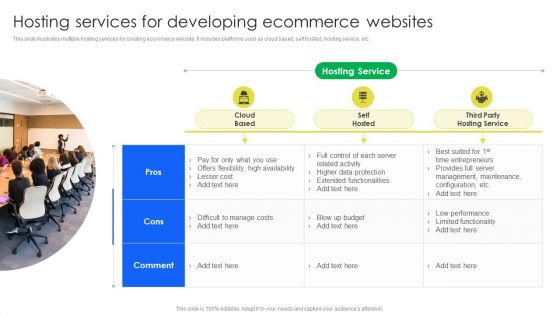
Hosting Services For Developing Ecommerce Websites Themes PDF
This slide illustrates multiple hosting services for creating ecommerce website. It includes platforms such as cloud based, self hosted, hosting service, etc. Presenting Hosting Services For Developing Ecommerce Websites Themes PDF to dispense important information. This template comprises Three stages. It also presents valuable insights into the topics including Cloud Based, Self Hosted, Third Party Hosting Service. This is a completely customizable PowerPoint theme that can be put to use immediately. So, download it and address the topic impactfully.
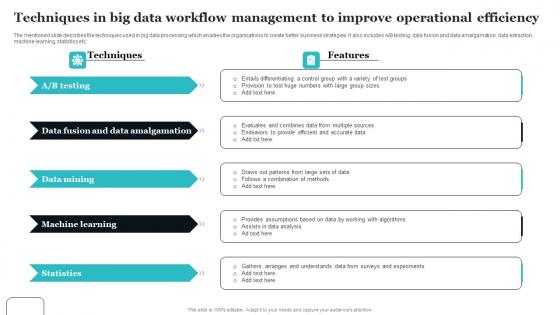
Techniques In Big Data Workflow Management To Improve Operational Efficiency Diagrams Pdf
The mentioned slide describes the techniques used in big data processing which enables the organizations to create better business strategies. It also includes A or B testing, data fusion and data amalgamation, data extraction, machine learning, statistics etc. Pitch your topic with ease and precision using this Techniques In Big Data Workflow Management To Improve Operational Efficiency Diagrams Pdf This layout presents information on Data Fusion, Data Amalgamation, Machine Learning It is also available for immediate download and adjustment. So, changes can be made in the color, design, graphics or any other component to create a unique layout. The mentioned slide describes the techniques used in big data processing which enables the organizations to create better business strategies. It also includes A or B testing, data fusion and data amalgamation, data extraction, machine learning, statistics etc.
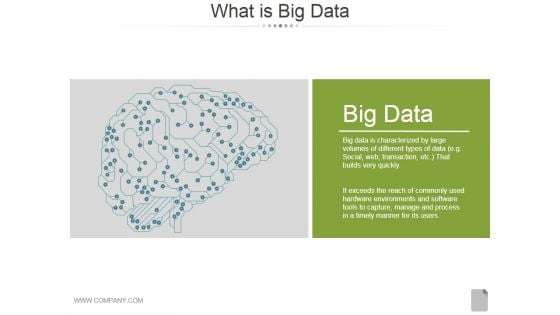
What Is Big Data Ppt PowerPoint Presentation Diagrams
This is a what is big data ppt powerpoint presentation diagrams. This is a one stage process. The stages in this process are big data, business, analysis, management, marketing.
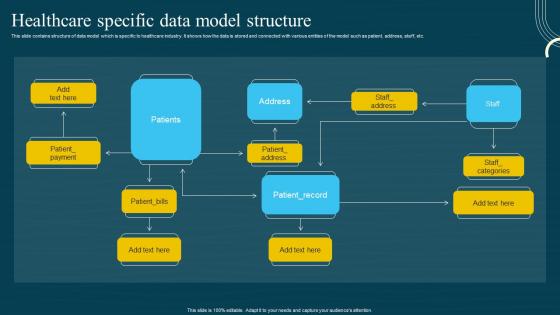
Database Modeling Structures Healthcare Specific Data Model Structure Demonstration Pdf
This slide contains structure of data model which is specific to healthcare industry. It shows how the data is stored and connected with various entities of the model such as patient, address, staff, etc. This Database Modeling Structures Healthcare Specific Data Model Structure Demonstration Pdf is perfect for any presentation, be it in front of clients or colleagues. It is a versatile and stylish solution for organizing your meetings. The Database Modeling Structures Healthcare Specific Data Model Structure Demonstration Pdf features a modern design for your presentation meetings. The adjustable and customizable slides provide unlimited possibilities for acing up your presentation. Slidegeeks has done all the homework before launching the product for you. So, do not wait, grab the presentation templates today This slide contains structure of data model which is specific to healthcare industry. It shows how the data is stored and connected with various entities of the model such as patient, address, staff, etc.
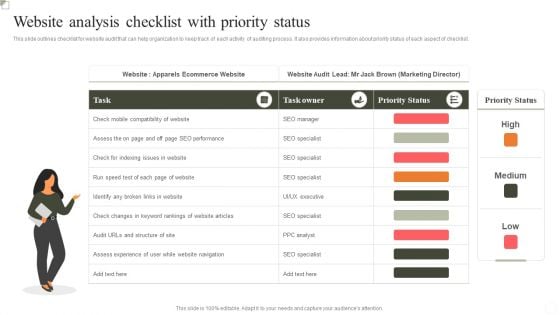
Website Analysis Checklist With Priority Status Ppt Layouts Examples PDF
This slide outlines checklist for website audit that can help organization to keep track of each activity of auditing process. It also provides information about priority status of each aspect of checklist. Presenting Website Analysis Checklist With Priority Status Ppt Layouts Examples PDF to dispense important information. This template comprises three stages. It also presents valuable insights into the topics including Priority Status, High, Medium, Low. This is a completely customizable PowerPoint theme that can be put to use immediately. So, download it and address the topic impactfully.
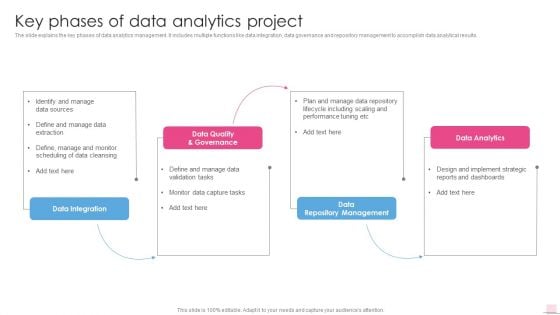
Key Phases Of Data Analytics Project Business Analysis Modification Toolkit Diagrams PDF
The slide explains the key phases of data analytics management. It includes multiple functions like data integration, data governance and repository management to accomplish data analytical results.Deliver and pitch your topic in the best possible manner with this Key Phases Of Data Analytics Project Business Analysis Modification Toolkit Diagrams PDF. Use them to share invaluable insights on Data Quality Governance, Performance Tuning, Including Scaling and impress your audience. This template can be altered and modified as per your expectations. So, grab it now.
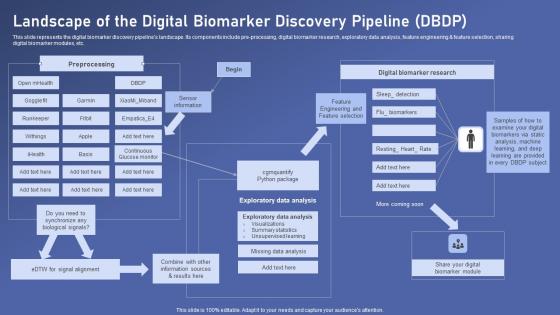
Landscape Of The Digital Biomarker Biomedical Data Science And Health Informatics Diagrams Pdf
This slide represents the digital biomarker discovery pipelines landscape. Its components include pre processing, digital biomarker research, exploratory data analysis, feature engineering and feature selection, sharing digital biomarker modules, etc. This Landscape Of The Digital Biomarker Biomedical Data Science And Health Informatics Diagrams Pdf from Slidegeeks makes it easy to present information on your topic with precision. It provides customization options, so you can make changes to the colors, design, graphics, or any other component to create a unique layout. It is also available for immediate download, so you can begin using it right away. Slidegeeks has done good research to ensure that you have everything you need to make your presentation stand out. Make a name out there for a brilliant performance. This slide represents the digital biomarker discovery pipelines landscape. Its components include pre processing, digital biomarker research, exploratory data analysis, feature engineering and feature selection, sharing digital biomarker modules, etc.
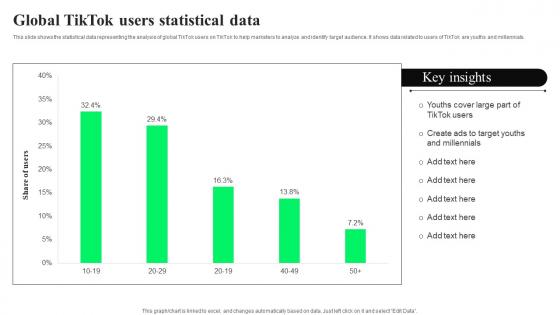
Global TikTok Users Statistical Data TikTok Advertising Strategies To Provide Effective Background Pdf
This slide shows the statistical data representing the analysis of global TikTok users on TikTok to help marketers to analyze and identify target audience. It shows data related to users of TikTok are youths and millennials. If your project calls for a presentation, then Slidegeeks is your go to partner because we have professionally designed, easy to edit templates that are perfect for any presentation. After downloading, you can easily edit Global TikTok Users Statistical Data TikTok Advertising Strategies To Provide Effective Background Pdf and make the changes accordingly. You can rearrange slides or fill them with different images. Check out all the handy templates This slide shows the statistical data representing the analysis of global TikTok users on TikTok to help marketers to analyze and identify target audience. It shows data related to users of TikTok are youths and millennials.
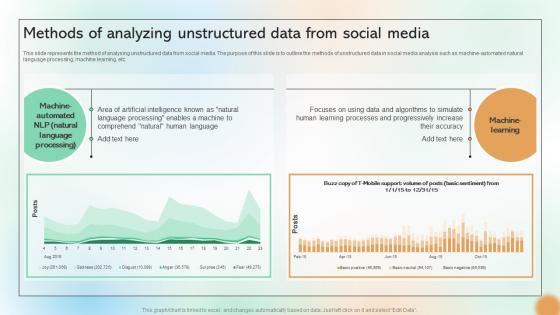
Methods Of Analyzing Unstructured Data From Social Media Cracking The Code Of Social Media
This slide represents the method of analysing unstructured data from social media. The purpose of this slide is to outline the methods of unstructured data in social media analysis such as machine automated natural language processing, machine learning, etc. Want to ace your presentation in front of a live audience Our Methods Of Analyzing Unstructured Data From Social Media Cracking The Code Of Social Media can help you do that by engaging all the users towards you. Slidegeeks experts have put their efforts and expertise into creating these impeccable powerpoint presentations so that you can communicate your ideas clearly. Moreover, all the templates are customizable, and easy-to-edit and downloadable. Use these for both personal and commercial use. This slide represents the method of analysing unstructured data from social media. The purpose of this slide is to outline the methods of unstructured data in social media analysis such as machine automated natural language processing, machine learning, etc.

Agenda For Zero Trust Network Access Ppt Diagram Graph Charts
Do you have to make sure that everyone on your team knows about any specific topic I yes, then you should give Agenda For Zero Trust Network Access Ppt Diagram Graph Charts a try. Our experts have put a lot of knowledge and effort into creating this impeccable Agenda For Zero Trust Network Access Ppt Diagram Graph Charts. You can use this template for your upcoming presentations, as the slides are perfect to represent even the tiniest detail. You can download these templates from the Slidegeeks website and these are easy to edit. So grab these today Our Agenda For Zero Trust Network Access Ppt Diagram Graph Charts are topically designed to provide an attractive backdrop to any subject. Use them to look like a presentation pro.

Business Data Analysis Media Themes PDF
This is a business data analysis media themes pdf template with various stages. Focus and dispense information on one stage using this creative set, that comes with editable features. It contains large content boxes to add your information on topics like media is the most popular source of big data, as it provides valuable insights on consumer preferences and changing trends, media includes social media and interactive platforms, like google, facebook, twitter, youtube, instagram. You can also showcase facts, figures, and other relevant content using this PPT layout. Grab it now.
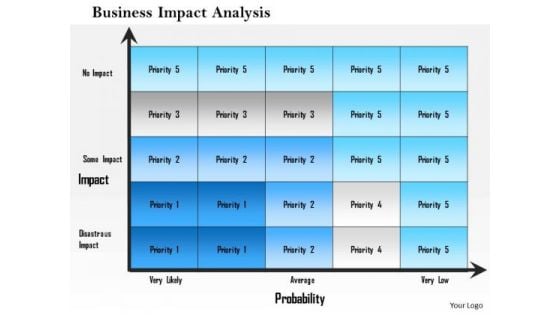
Business Framework Business Impact Analysis PowerPoint Presentation
This business framework displays two dimensional for business impact analysis. This editable slide contains steps for business impact analysis. This is an excellent diagram to impress your audiences.

Impacts Of Technology Diagram Powerpoint Slide Themes
This is a impacts of technology diagram powerpoint slide themes. This is a four stage process. The stages in this process are marketing capabilities, customer experiences, technology platforms, information science.
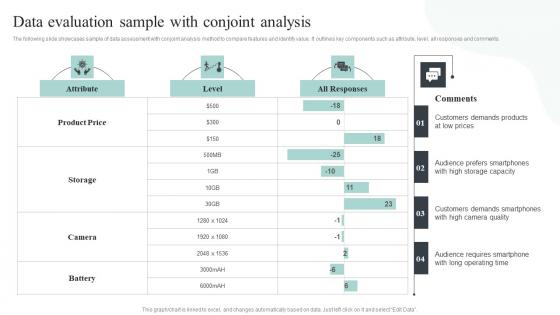
Competitive Intelligence Guide To Determine Market Data Evaluation Sample With Conjoint Information Pdf
The following slide showcases sample of data assessment with conjoint analysis method to compare features and identify value. It outlines key components such as attribute, level, all responses and comments. From laying roadmaps to briefing everything in detail, our templates are perfect for you. You can set the stage with your presentation slides. All you have to do is download these easy-to-edit and customizable templates. Competitive Intelligence Guide To Determine Market Data Evaluation Sample With Conjoint Information Pdf will help you deliver an outstanding performance that everyone would remember and praise you for. Do download this presentation today. The following slide showcases sample of data assessment with conjoint analysis method to compare features and identify value. It outlines key components such as attribute, level, all responses and comments.
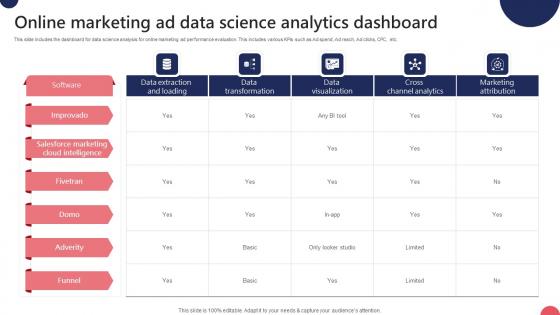
Online Marketing Ad Data Science Analytics Dashboard Ppt Inspiration Guidelines Pdf
This slide includes the dashboard for data science analysis for online marketing ad performance evaluation. This includes various KPIs such as Ad spend, Ad reach, Ad clicks, CPC, etc. Pitch your topic with ease and precision using this Online Marketing Ad Data Science Analytics Dashboard Ppt Inspiration Guidelines Pdf. This layout presents information on Ad Spend, Cost Per Thousand, Cost Per Click. It is also available for immediate download and adjustment. So, changes can be made in the color, design, graphics or any other component to create a unique layout. This slide includes the dashboard for data science analysis for online marketing ad performance evaluation. This includes various KPIs such as Ad spend, Ad reach, Ad clicks, CPC, etc.
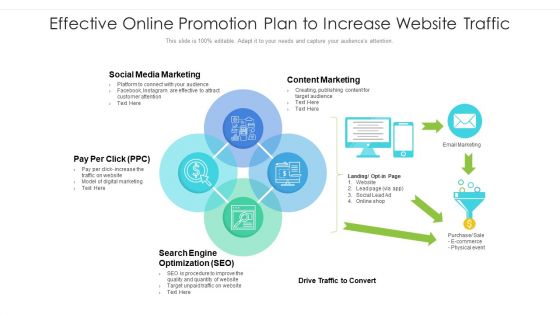
Effective Online Promotion Plan To Increase Website Traffic Ppt Infographics PDF
Presenting effective online promotion plan to increase website traffic ppt infographics pdf to dispense important information. This template comprises four stages. It also presents valuable insights into the topics including marketing, optimization, promotion. This is a completely customizable PowerPoint theme that can be put to use immediately. So, download it and address the topic impactfully.

Business Diagram Three Heads With Pie For Data Driven Technology PowerPoint Slide
This business diagram displays three human faces with pie charts. This Power Point template has been designed to compare and present business data. You may use this diagram to impart professional appearance to your presentations.
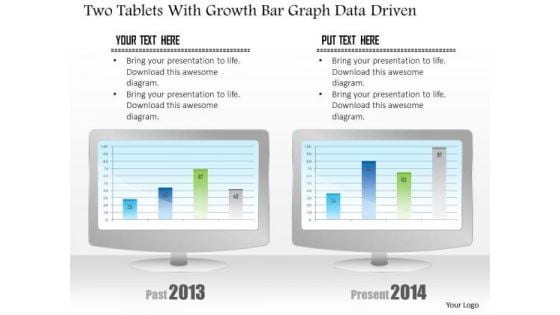
Business Diagram Two Tablets With Growth Bar Graph Data Driven PowerPoint Slide
This business diagram has been designed with comparative charts on tablets. This slide suitable for data representation. You can also use this slide to present business reports and information. Use this diagram to present your views in a wonderful manner.
Online Marketing Analytics To Enhance Business Growth Kpi Dashboard For Tracking SEO Analytics Themes PDF
This slide covers the KPI dashboard for analyzing SEO metrics such as authority score, organic traffic, organic keywords, paid keywords, ref. Domains, site audit, link-building tool, organic traffic, on-page SEO checker, backlink audit, etc. Get a simple yet stunning designed Online Marketing Analytics To Enhance Business Growth Kpi Dashboard For Tracking SEO Analytics Themes PDF. It is the best one to establish the tone in your meetings. It is an excellent way to make your presentations highly effective. So, download this PPT today from Slidegeeks and see the positive impacts. Our easy to edit Online Marketing Analytics To Enhance Business Growth Kpi Dashboard For Tracking SEO Analytics Themes PDF can be your go to option for all upcoming conferences and meetings. So, what are you waiting for Grab this template today.
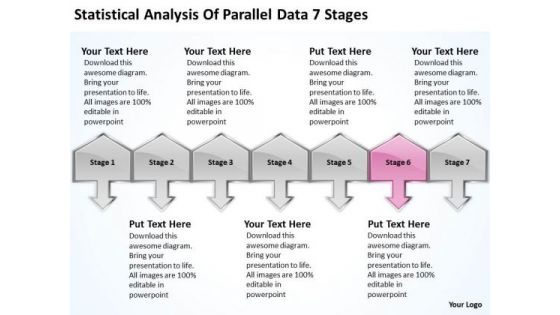
Statistical Analysis Of Parallel Data 7 Stages Business Planning Guide PowerPoint Slides
We present our statistical analysis of parallel data 7 stages business planning guide PowerPoint Slides.Download our Communication PowerPoint Templates because the mind is always whirring with new ideas. Use our Business PowerPoint Templates because watch the excitement levels rise as they realise their worth. Download our Arrows PowerPoint Templates because you know Coincidentally it will always point to the top. Use our Success PowerPoint Templates because they represent the proress in our lives. Use our Symbol PowerPoint Templates because with the help of our Slides you can Illustrate how each element flows seamlessly onto the next stage.Use these PowerPoint slides for presentations relating to 3d, Achievement, Action, Aim, Arrows, Black, Business, Color, Communication, Competition, Concept, Connection, Creative, Design, Different, Direction, Element, First, Forward, Graph, Graphic, Group, Growth, Higher, Icon, Illustration, Image, Isolated, Leader, Leadership, Line, Menu, Motion, Orange, Progress, Series, Seven, Sign, Slew, Solution, Success, Swerve, Symbol, Team, Teamwork, Turn, Up. The prominent colors used in the PowerPoint template are Pink, Gray, Black. Customers tell us our statistical analysis of parallel data 7 stages business planning guide PowerPoint Slides are Graceful. Use our Black PowerPoint templates and PPT Slides are Attractive. PowerPoint presentation experts tell us our statistical analysis of parallel data 7 stages business planning guide PowerPoint Slides are Nice. People tell us our Business PowerPoint templates and PPT Slides are Glamorous. We assure you our statistical analysis of parallel data 7 stages business planning guide PowerPoint Slides are Flirty. People tell us our Color PowerPoint templates and PPT Slides are Great. Scale mountains with our Statistical Analysis Of Parallel Data 7 Stages Business Planning Guide PowerPoint Slides. You will come out on top.
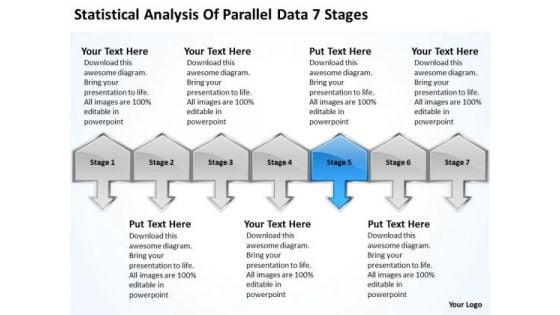
Statistical Analysis Of Parallel Data 7 Stages Fashion Business Plan PowerPoint Slides
We present our statistical analysis of parallel data 7 stages fashion business plan PowerPoint Slides.Download our Communication PowerPoint Templates because there is a key aspect to be emphasised. Present our Business PowerPoint Templates because watch the excitement levels rise as they realise their worth. Download our Arrows PowerPoint Templates because our PowerPoint templates designed for your ideas to sell. Download our Success PowerPoint Templates because your quest has taken you well onto the path of success. Download our Symbol PowerPoint Templates because they will Amplify your basic corporate concept and forefront the benefits of overlapping processes to arrive at common goals.Use these PowerPoint slides for presentations relating to 3d, Achievement, Action, Aim, Arrows, Black, Business, Color, Communication, Competition, Concept, Connection, Creative, Design, Different, Direction, Element, First, Forward, Graph, Graphic, Group, Growth, Higher, Icon, Illustration, Image, Isolated, Leader, Leadership, Line, Menu, Motion, Orange, Progress, Series, Seven, Sign, Slew, Solution, Success, Swerve, Symbol, Team, Teamwork, Turn, Up. The prominent colors used in the PowerPoint template are Blue, Gray, Black. Customers tell us our statistical analysis of parallel data 7 stages fashion business plan PowerPoint Slides are Awesome. Use our Business PowerPoint templates and PPT Slides will get their audience's attention. PowerPoint presentation experts tell us our statistical analysis of parallel data 7 stages fashion business plan PowerPoint Slides are Awesome. People tell us our Aim PowerPoint templates and PPT Slides are Sparkling. We assure you our statistical analysis of parallel data 7 stages fashion business plan PowerPoint Slides are Royal. People tell us our Black PowerPoint templates and PPT Slides are Detailed. Make your mark with our Statistical Analysis Of Parallel Data 7 Stages Fashion Business Plan PowerPoint Slides. You will be at the top of your game.


 Continue with Email

 Home
Home


