Heatmap Icon
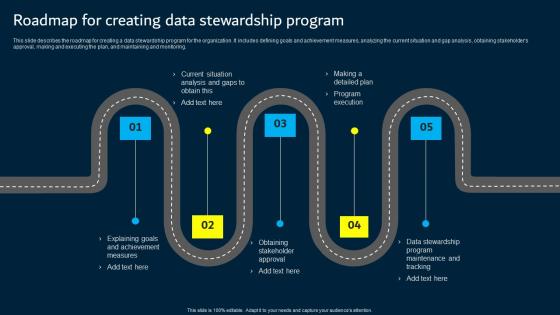
Roadmap For Creating Data Stewardship Program Data Custodianship Introduction Pdf
This slide describes the roadmap for creating a data stewardship program for the organization. It includes defining goals and achievement measures, analyzing the current situation and gap analysis, obtaining stakeholder s approval, making and executing the plan, and maintaining and monitoring. Are you searching for a Roadmap For Creating Data Stewardship Program Data Custodianship Introduction Pdf that is uncluttered, straightforward, and original Its easy to edit, and you can change the colors to suit your personal or business branding. For a presentation that expresses how much effort you have put in, this template is ideal With all of its features, including tables, diagrams, statistics, and lists, its perfect for a business plan presentation. Make your ideas more appealing with these professional slides. Download Roadmap For Creating Data Stewardship Program Data Custodianship Introduction Pdf from Slidegeeks today. This slide describes the roadmap for creating a data stewardship program for the organization. It includes defining goals and achievement measures, analyzing the current situation and gap analysis, obtaining stakeholder s approval, making and executing the plan, and maintaining and monitoring.
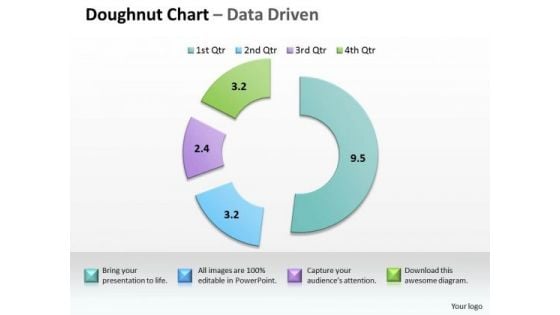
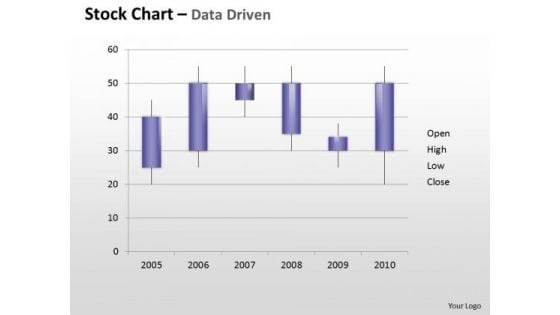
Data Analysis In Excel Completion Project Management PowerPoint Templates
Touch Base With Our data analysis in excel completion project management Powerpoint Templates . Review Your Growth With Your Audience.
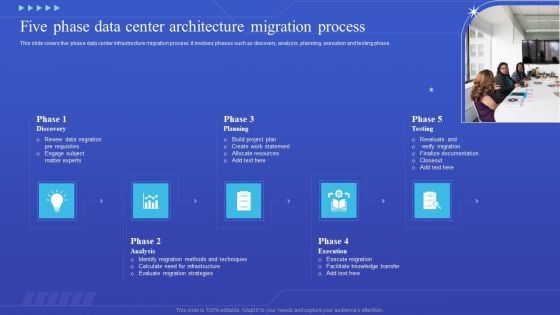
Five Phase Data Center Architecture Migration Process Demonstration PDF
This slide covers five phase data center infrastructure migration process .It involves phases such as discovery, analysis, planning, execution and testing phase. Presenting Five Phase Data Center Architecture Migration Process Demonstration PDF to dispense important information. This template comprises five stages. It also presents valuable insights into the topics including Discovery, Planning, Analysis. This is a completely customizable PowerPoint theme that can be put to use immediately. So, download it and address the topic impactfully.
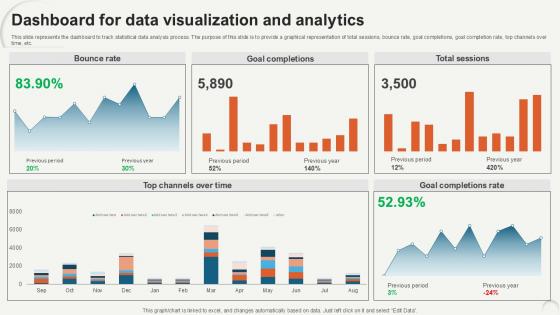
Dashboard For Data Visualization Data Analytics For Informed Decision Ppt Sample
This slide represents the dashboard to track statistical data analysis process. The purpose of this slide is to provide a graphical representation of total sessions, bounce rate, goal completions, goal completion rate, top channels over time, etc. Do you have an important presentation coming up Are you looking for something that will make your presentation stand out from the rest Look no further than Dashboard For Data Visualization Data Analytics For Informed Decision Ppt Sample. With our professional designs, you can trust that your presentation will pop and make delivering it a smooth process. And with Slidegeeks, you can trust that your presentation will be unique and memorable. So why wait Grab Dashboard For Data Visualization Data Analytics For Informed Decision Ppt Sample today and make your presentation stand out from the rest This slide represents the dashboard to track statistical data analysis process. The purpose of this slide is to provide a graphical representation of total sessions, bounce rate, goal completions, goal completion rate, top channels over time, etc.

Data Analysis Excel Bar Graph To Compare PowerPoint Templates
Get The Domestics Right With Our data analysis excel bar graph to compare Powerpoint Templates. Create The Base For Thoughts To Grow.
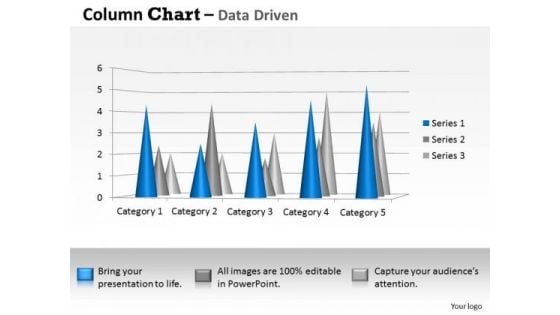
Data Analysis Techniques 3d Distribution Of In Sets PowerPoint Templates
Your Thoughts Will Be The Main Course. Provide The Dressing With Our data analysis techniques 3d distribution of in sets Powerpoint Templates .
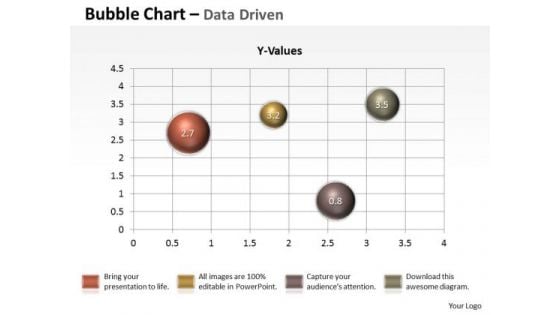
Data Analysis Techniques 3d Graphical Presentation Of PowerPoint Templates
Our data analysis techniques 3d graphical presentation of Powerpoint Templates Will Follow The Drill. They Accomplish The Task Assigned To Them.
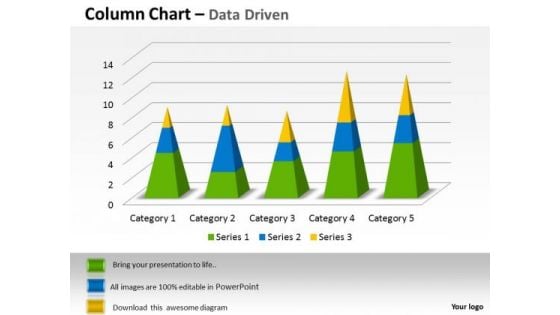
Examples Of Data Analysis Market 3d Categories Sets PowerPoint Templates
Our examples of data analysis market 3d categories sets Powerpoint Templates Give Your Thoughts Their Due. They Project Them With Full Intensity.
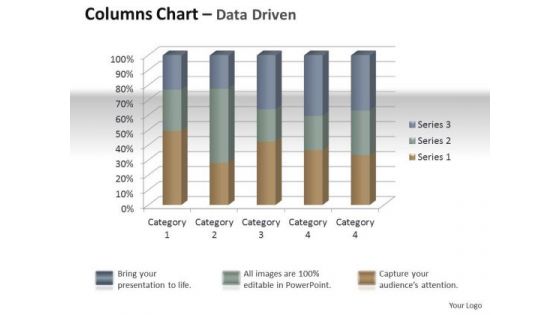
Marketing Data Analysis 3d Quality Control Of Units PowerPoint Templates
Establish Your Dominion With Our marketing data analysis 3d quality control of units Powerpoint Templates . Rule The Stage With Your Thoughts.
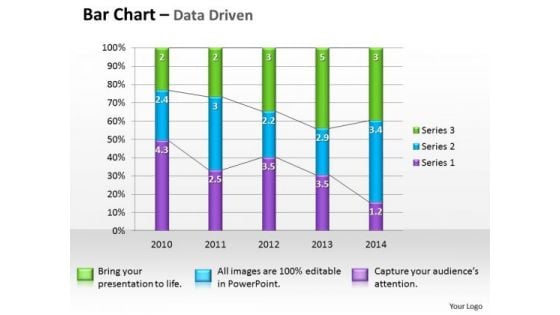
Microsoft Excel Data Analysis Bar Graph PowerPoint Templates
Double The Impact With Our microsoft excel data analysis bar graph Powerpoint Templates . Your Thoughts Will Have An Imposing Effect.
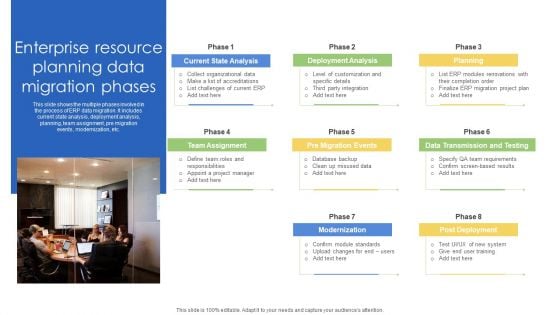
Enterprise Resource Planning Data Migration Phases Ppt Styles Demonstration PDF
This slide shows the multiple phases involved in the process of ERP data migration. It includes current state analysis, deployment analysis, planning, team assignment, pre migration events, modernization, etc. Presenting Enterprise Resource Planning Data Migration Phases Ppt Styles Demonstration PDF to dispense important information. This template comprises eight stages. It also presents valuable insights into the topics including Current State Analysis, Deployment Analysis, Planning, Team Assignment. This is a completely customizable PowerPoint theme that can be put to use immediately. So, download it and address the topic impactfully.
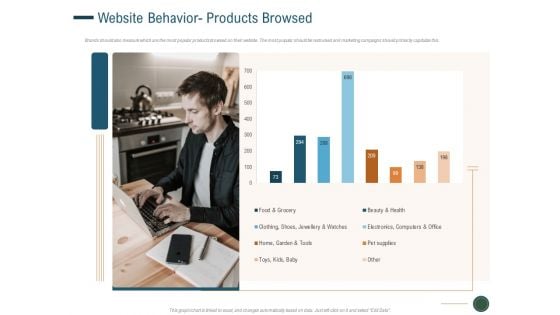
Enhance Profit Client Journey Analysis Website Behavior Products Browsed Themes PDF
Brands should also measure which are the most popular products browsed on their website. The most popular should be restocked and marketing campaigns should primarily capitalize this. Deliver an awe-inspiring pitch with this creative enhance profit client journey analysis website behavior products browsed themes pdf bundle. Topics like food and grocery, beauty and health, pet supplies can be discussed with this completely editable template. It is available for immediate download depending on the needs and requirements of the user.

Quantitative Data Analysis Methods Diagram Powerpoint Slide
This is a quantitative data analysis methods diagram powerpoint slide. This is a three stage process. The stages in this process are organizing data, presenting data, data analysis.
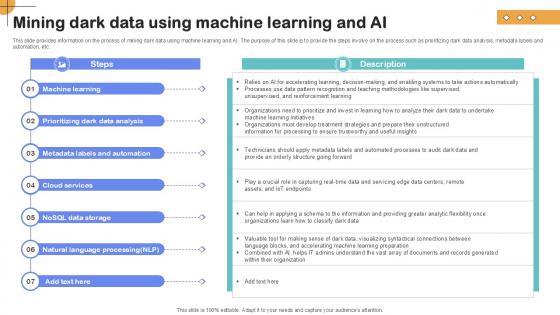
Mining Dark Data Using Machine Importance Of Unstructured Data Ppt PowerPoint
This slide provides information on the process of mining dark data using machine learning and AI. The purpose of this slide is to provide the steps involve on the process such as prioritizing dark data analysis, metadata labels and automation, etc.Retrieve professionally designed Mining Dark Data Using Machine Importance Of Unstructured Data Ppt PowerPoint to effectively convey your message and captivate your listeners. Save time by selecting pre-made slideshows that are appropriate for various topics, from business to educational purposes. These themes come in many different styles, from creative to corporate, and all of them are easily adjustable and can be edited quickly. Access them as PowerPoint templates or as Google Slides themes. You do not have to go on a hunt for the perfect presentation because Slidegeeks got you covered from everywhere. This slide provides information on the process of mining dark data using machine learning and AI. The purpose of this slide is to provide the steps involve on the process such as prioritizing dark data analysis, metadata labels and automation, etc.
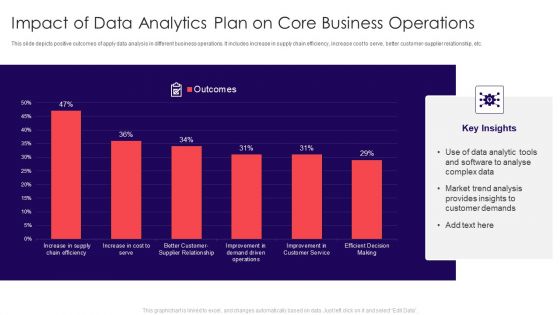
Impact Of Data Analytics Plan On Core Business Operations Summary PDF
This slide depicts positive outcomes of apply data analysis in different business operations. It includes increase in supply chain efficiency, increase cost to serve, better customer-supplier relationship, etc. Showcasing this set of slides titled Impact Of Data Analytics Plan On Core Business Operations Summary PDF. The topics addressed in these templates are Customer Demands, Market Trend Analysis, Complex Data. All the content presented in this PPT design is completely editable. Download it and make adjustments in color, background, font etc. as per your unique business setting.
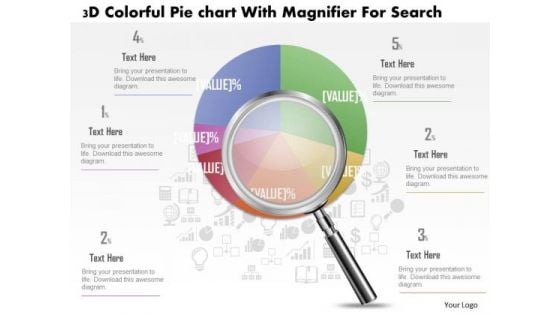
Business Diagram 3d Colorful Pie Graph With Magnifier Data Search PowerPoint Slide
This business slide displays 3d colorful pie graph with magnifier. This diagram is a data visualization tool that gives you a simple way to present statistical information. This slide helps your audience examine and interpret the data you present.
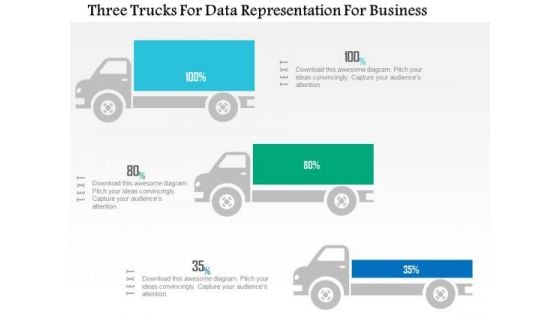
Business Diagram Three Trucks For Data Representation For Business PowerPoint Slide
This business diagram displays three trucks graphic. This diagram contains trucks for percentage value growth. Use this diagram to display business growth over a period of time.
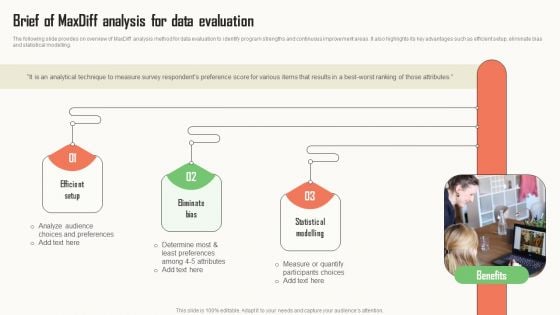
Strategic Market Insight Implementation Guide Brief Of Maxdiff Analysis For Data Evaluation Themes PDF
The following slide provides on overview of MaxDiff analysis method for data evaluation to identify program strengths and continuous improvement areas. It also highlights its key advantages such as efficient setup, eliminate bias and statistical modelling. Do you have to make sure that everyone on your team knows about any specific topic I yes, then you should give Strategic Market Insight Implementation Guide Brief Of Maxdiff Analysis For Data Evaluation Themes PDF a try. Our experts have put a lot of knowledge and effort into creating this impeccable Strategic Market Insight Implementation Guide Brief Of Maxdiff Analysis For Data Evaluation Themes PDF. You can use this template for your upcoming presentations, as the slides are perfect to represent even the tiniest detail. You can download these templates from the Slidegeeks website and these are easy to edit. So grab these today.
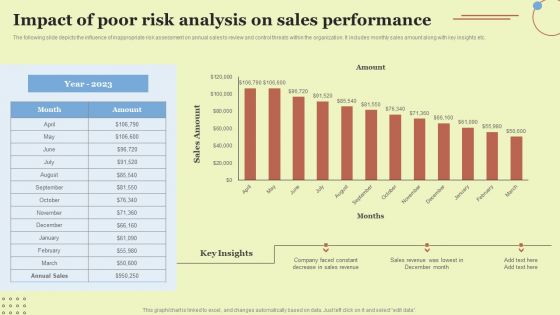
Impact Of Poor Risk Analysis On Sales Performance Introduction PDF
The following slide depicts the influence of inappropriate risk assessment on annual sales to review and control threats within the organization. It includes monthly sales amount along with key insights etc. Do you have to make sure that everyone on your team knows about any specific topic I yes, then you should give Impact Of Poor Risk Analysis On Sales Performance Introduction PDF a try. Our experts have put a lot of knowledge and effort into creating this impeccable Impact Of Poor Risk Analysis On Sales Performance Introduction PDF. You can use this template for your upcoming presentations, as the slides are perfect to represent even the tiniest detail. You can download these templates from the Slidegeeks website and these are easy to edit. So grab these today.
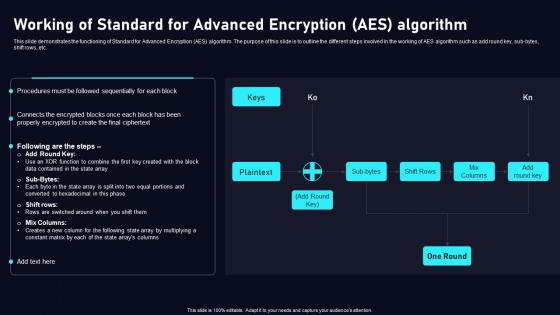
Working Of Standard For Advanced Cloud Data Security Using Cryptography Diagrams Pdf
This slide demonstrates the functioning of Standard for Advanced Encryption AES algorithm. The purpose of this slide is to outline the different steps involved in the working of AES algorithm such as add round key, sub bytes, shift rows, etc. Create an editableWorking Of Standard For Advanced Cloud Data Security Using Cryptography Diagrams Pdf that communicates your idea and engages your audience. Whether you are presenting a business or an educational presentation, pre designed presentation templates help save timeWorking Of Standard For Advanced Cloud Data Security Using Cryptography Diagrams Pdf is highly customizable and very easy to edit, covering many different styles from creative to business presentations. Slidegeeks has creative team members who have crafted amazing templates. So, go and get them without any delay. This slide demonstrates the functioning of Standard for Advanced Encryption AES algorithm. The purpose of this slide is to outline the different steps involved in the working of AES algorithm such as add round key, sub bytes, shift rows, etc.
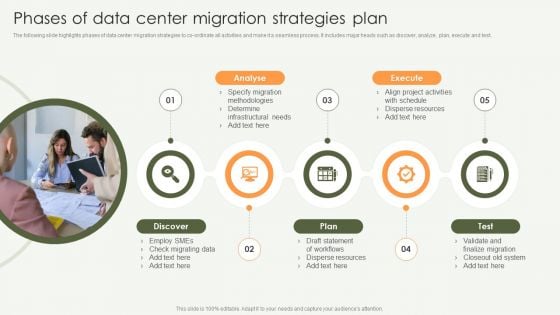
Phases Of Data Center Migration Strategies Plan Download PDF
The following slide highlights phases of data center migration strategies to co ordinate all activities and make it a seamless process. It includes major heads such as discover, analyze, plan, execute and test. Presenting Phases Of Data Center Migration Strategies Plan Download PDF to dispense important information. This template comprises five stages. It also presents valuable insights into the topics including Analyse, Execute, Plan. This is a completely customizable PowerPoint theme that can be put to use immediately. So, download it and address the topic impactfully.
Business Diagram Flask And Test Tubes For Data Driven PowerPoint Slide
This data driven diagram has been designed with flask and test tubes. Download this diagram to give your presentations more effective look. It helps in clearly conveying your message to clients and audience.

Data Analysis In Excel 3d Column Chart To Represent Information PowerPoint Templates
Rake In The Dough With
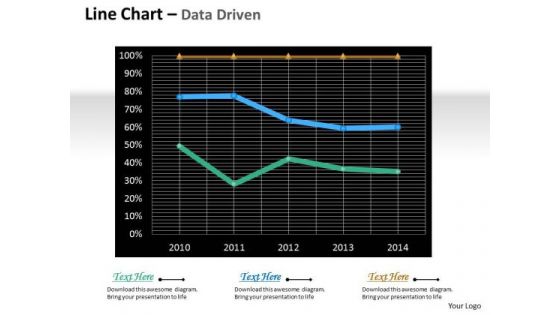
Multivariate Data Analysis Driven Line Chart For Market Survey PowerPoint Slides Templates
Rake In The Dough With
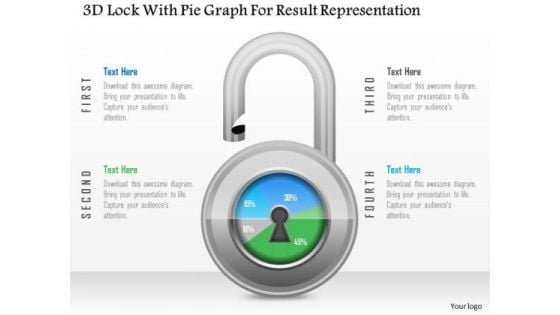
Business Diagram 3d Lock With Pie Graph For Result Representation PowerPoint Slide
This Power Point diagram has been crafted with pie chart in shape of lock. It contains diagram of lock pie chart to compare and present data in an effective manner. Use this diagram to build professional presentations for your viewers.
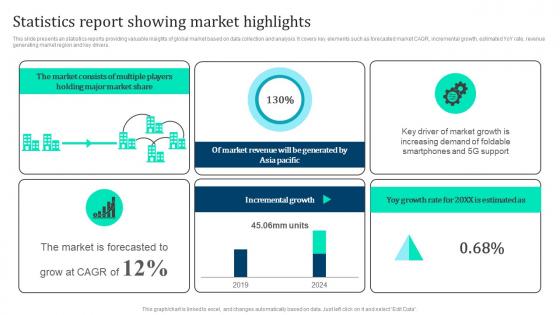
Statistics Report Showing Marketing Intelligence Guide Data Gathering Slides Pdf
This slide presents an statistics reports providing valuable insights of global market based on data collection and analysis. It covers key elements such as forecasted market CAGR, incremental growth, estimated YoY rate, revenue generating market region and key drivers. Get a simple yet stunning designed Statistics Report Showing Marketing Intelligence Guide Data Gathering Slides Pdf. It is the best one to establish the tone in your meetings. It is an excellent way to make your presentations highly effective. So, download this PPT today from Slidegeeks and see the positive impacts. Our easy to edit Statistics Report Showing Marketing Intelligence Guide Data Gathering Slides Pdf can be your go to option for all upcoming conferences and meetings. So, what are you waiting for Grab this template today. This slide presents an statistics reports providing valuable insights of global market based on data collection and analysis. It covers key elements such as forecasted market CAGR, incremental growth, estimated YoY rate, revenue generating market region and key drivers.

Data Ethics Canvas Overview Responsible Technology Governance Manual Designs Pdf
This slide provides information regarding data ethics canvas as a responsible tech approach that focuses on data sharing and utilization by team. The approach is utilized during project initiation phase by technical professionals and diverse group. Present like a pro with Data Ethics Canvas Overview Responsible Technology Governance Manual Designs Pdf Create beautiful presentations together with your team, using our easy to use presentation slides. Share your ideas in real time and make changes on the fly by downloading our templates. So whether you are in the office, on the go, or in a remote location, you can stay in sync with your team and present your ideas with confidence. With Slidegeeks presentation got a whole lot easier. Grab these presentations today. This slide provides information regarding data ethics canvas as a responsible tech approach that focuses on data sharing and utilization by team. The approach is utilized during project initiation phase by technical professionals and diverse group.
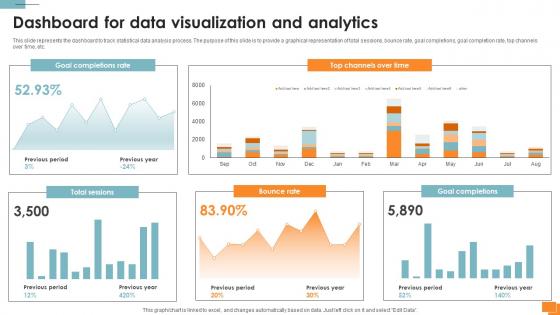
Statistical Tools For Evidence Dashboard For Data Visualization And Analytics
This slide represents the dashboard to track statistical data analysis process. The purpose of this slide is to provide a graphical representation of total sessions, bounce rate, goal completions, goal completion rate, top channels over time, etc. Are you in need of a template that can accommodate all of your creative concepts This one is crafted professionally and can be altered to fit any style. Use it with Google Slides or PowerPoint. Include striking photographs, symbols, depictions, and other visuals. Fill, move around, or remove text boxes as desired. Test out color palettes and font mixtures. Edit and save your work, or work with colleagues. Download Statistical Tools For Evidence Dashboard For Data Visualization And Analytics and observe how to make your presentation outstanding. Give an impeccable presentation to your group and make your presentation unforgettable. This slide represents the dashboard to track statistical data analysis process. The purpose of this slide is to provide a graphical representation of total sessions, bounce rate, goal completions, goal completion rate, top channels over time, etc.
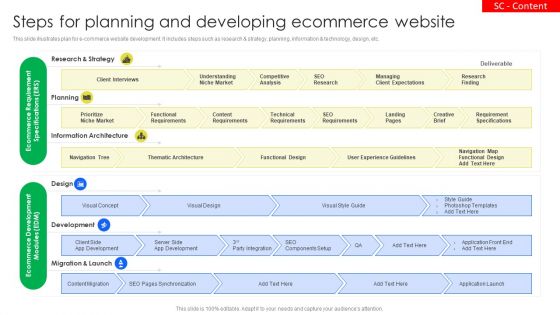
Steps For Planning And Developing Ecommerce Website Themes PDF
This slide illustrates plan for e commerce website development. It includes steps such as research and strategy, planning, information and technology, design, etc. Showcasing this set of slides titled Steps For Planning And Developing Ecommerce Website Themes PDF. The topics addressed in these templates are Research And Strategy, Information Architecture, Development. All the content presented in this PPT design is completely editable. Download it and make adjustments in color, background, font etc. as per your unique business setting.
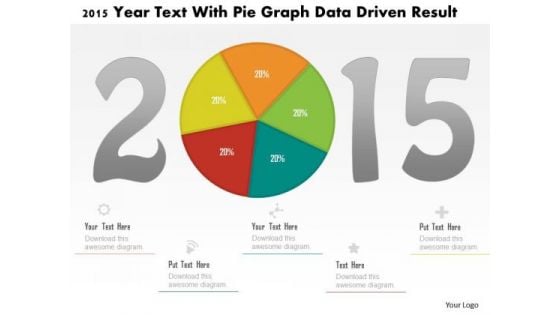
Business Diagram 2015 Year Text With Pie Graph Data Driven Result PowerPoint Slide
This business diagram displays 2015 year numbers with pie chart. This diagram is suitable to display business strategy for year 2015. Download this professional slide to present information in an attractive manner
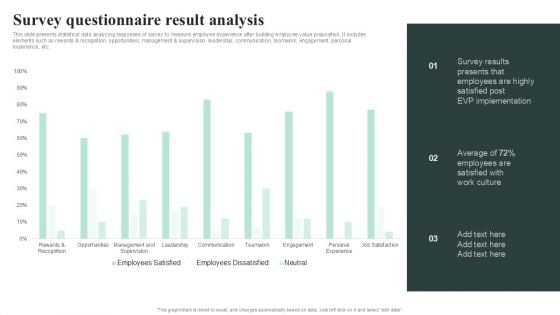
Survey Questionnaire Result Analysis Demonstration PDF
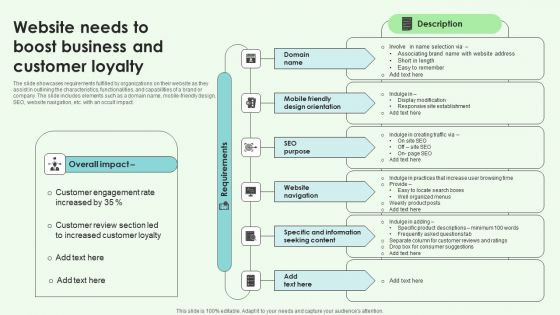
Website Needs To Boost Business And Customer Loyalty Structure PDF
The slide showcases requirements fulfilled by organizations on their website as they assist in outlining the characteristics, functionalities, and capabilities of a brand or company. The slide includes elements such as a domain name, mobile-friendly design, SEO, website navigation, etc. with an occult impact. Presenting Website Needs To Boost Business And Customer Loyalty Structure PDF to dispense important information. This template comprises six stages. It also presents valuable insights into the topics including Website Navigation, Information Seeking Content, SEO Purpose. This is a completely customizable PowerPoint theme that can be put to use immediately. So, download it and address the topic impactfully.
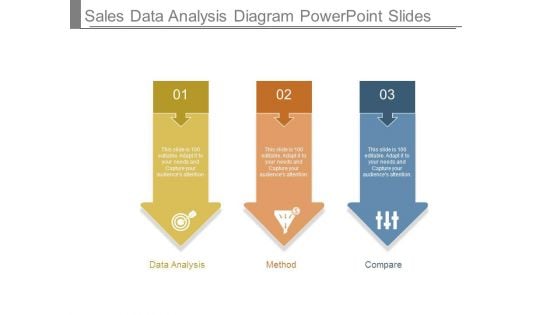
Sales Data Analysis Diagram Powerpoint Slides
This is a sales data analysis diagram powerpoint slides. This is a three stage process. The stages in this process are data analysis, method, compare.
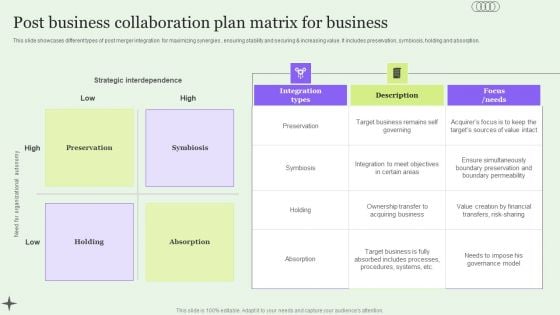
Post Business Collaboration Plan Matrix For Business Elements PDF
This slide showcases different types of post merger integration for maximizing synergies , ensuring stability and securing and increasing value. It includes preservation, symbiosis, holding and absorption. Presenting Post Business Collaboration Plan Matrix For Business Elements PDF to dispense important information. This template comprises four stages. It also presents valuable insights into the topics including Preservation, Symbiosis, Holding, Absorption. This is a completely customizable PowerPoint theme that can be put to use immediately. So, download it and address the topic impactfully.
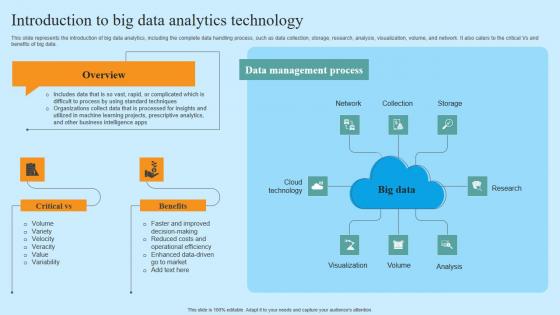
Introduction To Big Data Analytics Technology Hyper Automation Solutions Designs Pdf
This slide represents the introduction of big data analytics, including the complete data handling process, such as data collection, storage, research, analysis, visualization, volume, and network. It also caters to the critical Vs and benefits of big data. Retrieve professionally designed Introduction To Big Data Analytics Technology Hyper Automation Solutions Designs Pdf to effectively convey your message and captivate your listeners. Save time by selecting pre-made slideshows that are appropriate for various topics, from business to educational purposes. These themes come in many different styles, from creative to corporate, and all of them are easily adjustable and can be edited quickly. Access them as PowerPoint templates or as Google Slides themes. You do not have to go on a hunt for the perfect presentation because Slidegeeks got you covered from everywhere. This slide represents the introduction of big data analytics, including the complete data handling process, such as data collection, storage, research, analysis, visualization, volume, and network. It also caters to the critical Vs and benefits of big data.

Developing Data Collection Plan DMAIC Methodology To Maintain PPT Template
This slide shows introduction of measure phase in six sigma process improvement to measure quality performance of current workflow. It includes description and major goals, etc. Do you have an important presentation coming up Are you looking for something that will make your presentation stand out from the rest Look no further than Developing Data Collection Plan DMAIC Methodology To Maintain PPT Template. With our professional designs, you can trust that your presentation will pop and make delivering it a smooth process. And with Slidegeeks, you can trust that your presentation will be unique and memorable. So why wait Grab Developing Data Collection Plan DMAIC Methodology To Maintain PPT Template today and make your presentation stand out from the rest This slide shows introduction of measure phase in six sigma process improvement to measure quality performance of current workflow. It includes description and major goals, etc.
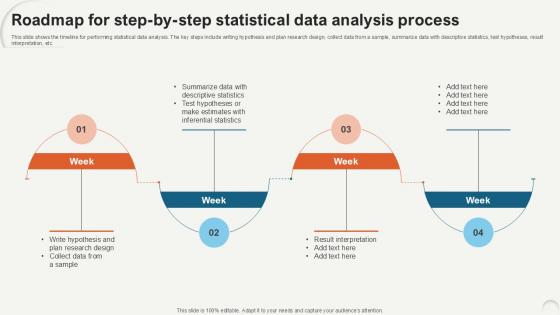
Roadmap For Step By Step Statistical Data Analytics For Informed Decision Ppt PowerPoint
This slide shows the timeline for performing statistical data analysis. The key steps include writing hypothesis and plan research design, collect data from a sample, summarize data with descriptive statistics, test hypotheses, result interpretation, etc. Retrieve professionally designed Roadmap For Step By Step Statistical Data Analytics For Informed Decision Ppt PowerPoint to effectively convey your message and captivate your listeners. Save time by selecting pre-made slideshows that are appropriate for various topics, from business to educational purposes. These themes come in many different styles, from creative to corporate, and all of them are easily adjustable and can be edited quickly. Access them as PowerPoint templates or as Google Slides themes. You do not have to go on a hunt for the perfect presentation because Slidegeeks got you covered from everywhere. This slide shows the timeline for performing statistical data analysis. The key steps include writing hypothesis and plan research design, collect data from a sample, summarize data with descriptive statistics, test hypotheses, result interpretation, etc.

Overview Cybersecurity And Data Protection In Digital Transformation DT SS V
This slide presents an overview into the landscape of cybersecurity and data protection with its advantages. It also presents a survey analysis on share of SMEs that have implemented essential and basic IT security initiatives.Find highly impressive Overview Cybersecurity And Data Protection In Digital Transformation DT SS V on Slidegeeks to deliver a meaningful presentation. You can save an ample amount of time using these presentation templates. No need to worry to prepare everything from scratch because Slidegeeks experts have already done a huge research and work for you. You need to download Overview Cybersecurity And Data Protection In Digital Transformation DT SS V for your upcoming presentation. All the presentation templates are 100 percent editable and you can change the color and personalize the content accordingly. Download now This slide presents an overview into the landscape of cybersecurity and data protection with its advantages. It also presents a survey analysis on share of SMEs that have implemented essential and basic IT security initiatives.
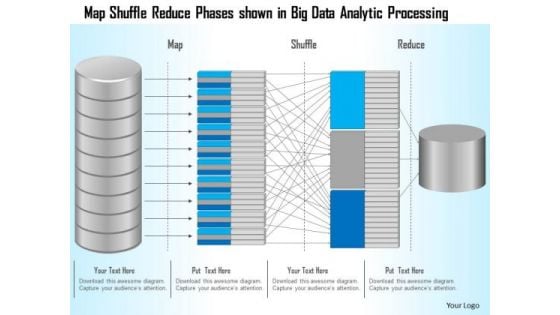
Business Diagram Map Shuffle Reduce Phases Shown In Big Data Analytic Processing Ppt Slide
This technology slide has been designed with graphic of map and data text. This diagram helps to depict concept of data analysis and processing. Use this diagram slide for computer technology related presentations.
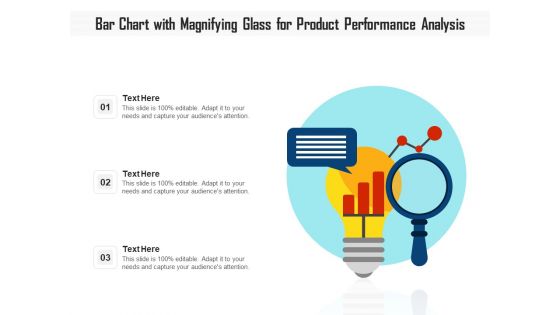
Bar Chart With Magnifying Glass For Product Performance Analysis Ppt PowerPoint Presentation Gallery Example File PDF
Presenting bar chart with magnifying glass for product performance analysis ppt powerpoint presentation gallery example file pdf to dispense important information. This template comprises three stages. It also presents valuable insights into the topics including bar chart with magnifying glass for product performance analysis. This is a completely customizable PowerPoint theme that can be put to use immediately. So, download it and address the topic impactfully.
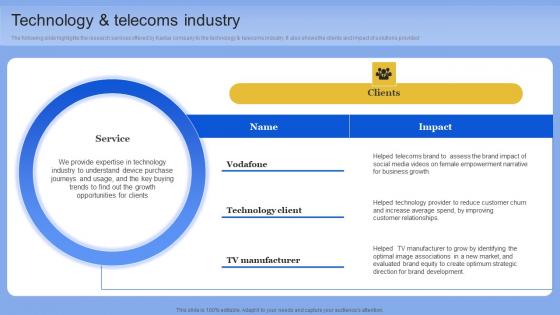
Technology And Telecoms Industry Data Analytics Company Outline Rules PDF
The following slide highlights the research services offered by Kantar company to the technology and telecoms industry. It also shows the clients and impact of solutions provided. Do you know about Slidesgeeks Technology And Telecoms Industry Data Analytics Company Outline Rules PDF These are perfect for delivering any kind od presentation. Using it, create PowerPoint presentations that communicate your ideas and engage audiences. Save time and effort by using our pre-designed presentation templates that are perfect for a wide range of topic. Our vast selection of designs covers a range of styles, from creative to business, and are all highly customizable and easy to edit. Download as a PowerPoint template or use them as Google Slides themes. The following slide highlights the research services offered by Kantar company to the technology and telecoms industry. It also shows the clients and impact of solutions provided

Data Integration Process Implementation Roadmap Data Integration Strategies For Business
This slide highlights the project roadmap to implement a data integration plan in an organization. The purpose of this slide is to showcase the different phases of the data integration implementation plan, such as planning and preparation, implementation and testing, etc. Crafting an eye-catching presentation has never been more straightforward. Let your presentation shine with this tasteful yet straightforward Data Integration Process Implementation Roadmap Data Integration Strategies For Business template. It offers a minimalistic and classy look that is great for making a statement. The colors have been employed intelligently to add a bit of playfulness while still remaining professional. Construct the ideal Data Integration Process Implementation Roadmap Data Integration Strategies For Business that effortlessly grabs the attention of your audience Begin now and be certain to wow your customers This slide highlights the project roadmap to implement a data integration plan in an organization. The purpose of this slide is to showcase the different phases of the data integration implementation plan, such as planning and preparation, implementation and testing, etc.
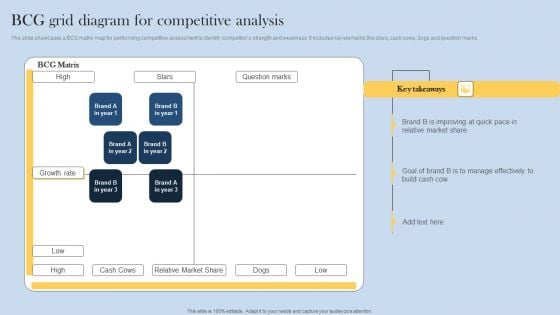
BCG Grid Diagram For Competitive Analysis Microsoft PDF
The slide showcases a BCG matrix map for performing competitive assessment to identify competitors strength and weakness. It includes key elements like stars, cash cows, dogs and question marks. Presenting BCG Grid Diagram For Competitive Analysis Microsoft PDF to dispense important information. This template comprises one stages. It also presents valuable insights into the topics including Improving At Quick Pace, Manage Effectively, Relative Market. This is a completely customizable PowerPoint theme that can be put to use immediately. So, download it and address the topic impactfully.
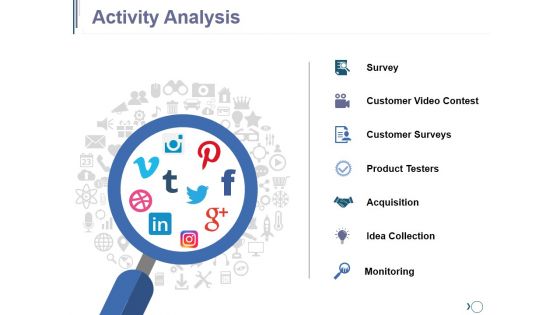
Activity Analysis Ppt PowerPoint Presentation Diagram Images
This is a activity analysis ppt powerpoint presentation diagram images. This is a one stage process. The stages in this process are survey, customer video contest, customer surveys, product testers, acquisition, idea collection.
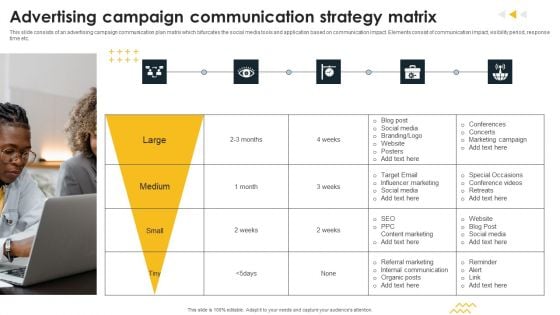
Advertising Campaign Communication Strategy Matrix Clipart PDF
This slide consists of an advertising campaign communication plan matrix which bifurcates the social media tools and application based on communication impact. Elements consist of communication impact, visibility period, response time etc. Presenting Advertising Campaign Communication Strategy Matrix Clipart PDF to dispense important information. This template comprises one stages. It also presents valuable insights into the topics including Large, Medium, Small. This is a completely customizable PowerPoint theme that can be put to use immediately. So, download it and address the topic impactfully.
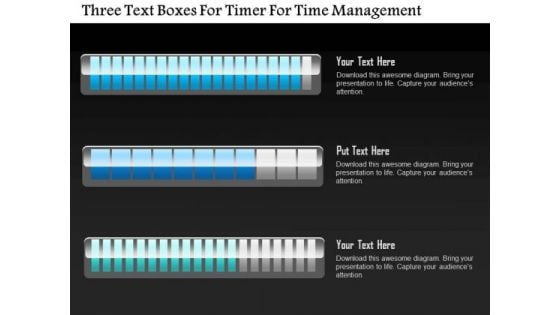
Business Diagram Three Text Boxes For Timer For Time Management PowerPoint Slide
This business diagram displays three text boxes. This diagram contains text boxes for data representation. Use this diagram to display business process workflows in any presentations.
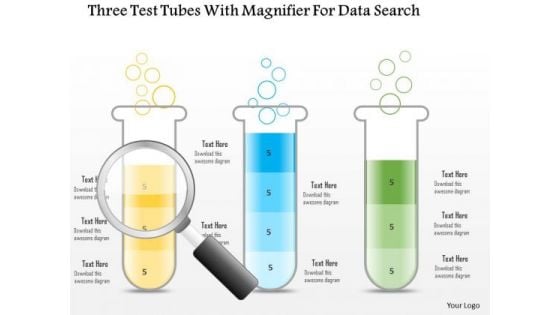
Business Diagram Three Test Tubes With Magnifier For Data Search PowerPoint Slide
This business diagram displays three test tubes with magnifying glass. This diagram is suitable to depict flow of business activities or steps. Download this professional slide to present information in an attractive manner.

Big Data Cycle For Analysis Diagram Slides
This is a big data cycle for analysis diagram slides. This is a five stage process. The stages in this process are massive data, new management needs, new final result, new hard and software, new analysis possibilities.
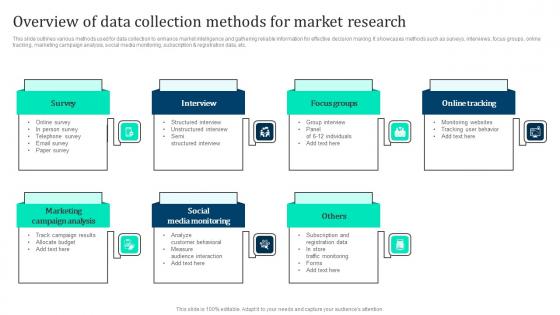
Overview Of Data Collection Methods Marketing Intelligence Guide Data Gathering Diagrams Pdf
This slide outlines various methods used for data collection to enhance market intelligence and gathering reliable information for effective decision making. It showcases methods such as surveys, interviews, focus groups, online tracking, marketing campaign analysis, social media monitoring, subscription and registration data, etc. Take your projects to the next level with our ultimate collection of Overview Of Data Collection Methods Marketing Intelligence Guide Data Gathering Diagrams Pdf. Slidegeeks has designed a range of layouts that are perfect for representing task or activity duration, keeping track of all your deadlines at a glance. Tailor these designs to your exact needs and give them a truly corporate look with your own brand colors they will make your projects stand out from the rest This slide outlines various methods used for data collection to enhance market intelligence and gathering reliable information for effective decision making. It showcases methods such as surveys, interviews, focus groups, online tracking, marketing campaign analysis, social media monitoring, subscription and registration data, etc.
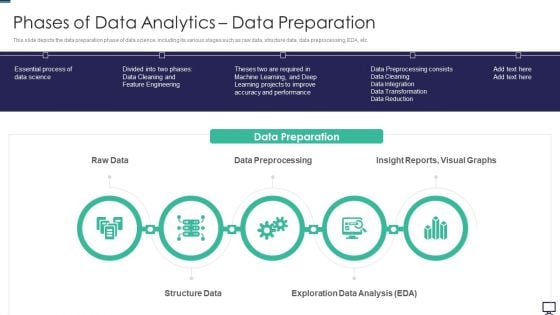
Phases Of Data Analytics Data Preparation Ppt Summary Clipart PDF
This slide depicts the data preparation phase of data science, including its various stages such as raw data, structure data, data preprocessing, EDA, etc. Presenting phases of data analytics data preparation ppt summary clipart pdf to provide visual cues and insights. Share and navigate important information on five stages that need your due attention. This template can be used to pitch topics like data preprocessing, structure data, exploration data analysis. In addtion, this PPT design contains high resolution images, graphics, etc, that are easily editable and available for immediate download.
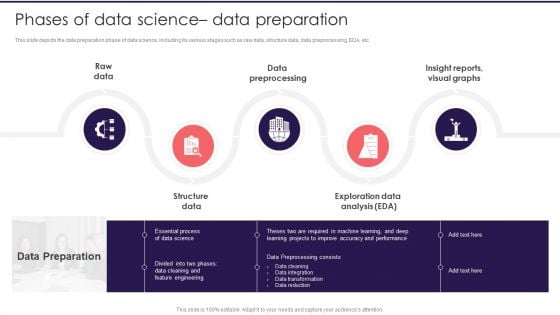
Information Studies Phases Of Data Science Data Preparation Elements PDF
This slide depicts the data preparation phase of data science, including its various stages such as raw data, structure data, data preprocessing, EDA, etc. This is a Information Studies Phases Of Data Science Data Preparation Elements PDF template with various stages. Focus and dispense information on five stages using this creative set, that comes with editable features. It contains large content boxes to add your information on topics like Raw Data, Data Preprocessing, Exploration Data Analysis. You can also showcase facts, figures, and other relevant content using this PPT layout. Grab it now.
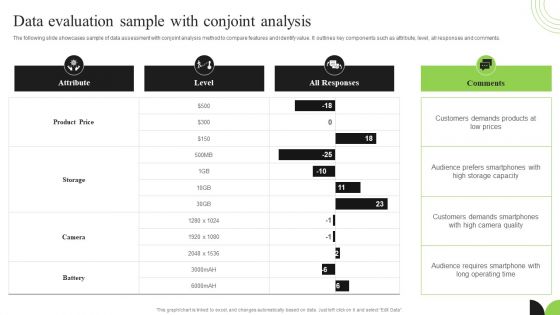
Guidebook For Executing Business Market Intelligence Data Evaluation Sample With Conjoint Analysis Ideas PDF
The following slide showcases sample of data assessment with conjoint analysis method to compare features and identify value. It outlines key components such as attribute, level, all responses and comments. Boost your pitch with our creative Guidebook For Executing Business Market Intelligence Data Evaluation Sample With Conjoint Analysis Ideas PDF. Deliver an awe inspiring pitch that will mesmerize everyone. Using these presentation templates you will surely catch everyones attention. You can browse the ppts collection on our website. We have researchers who are experts at creating the right content for the templates. So you do not have to invest time in any additional work. Just grab the template now and use them.
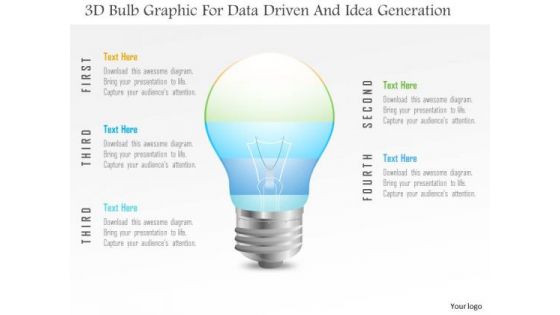
Business Diagram 3d Bulb Graphic For Data Driven And Idea Generation PowerPoint Slide
This Power Point template has been designed with 3d bulb graphic. Use this slide to represent technology idea and strategy concepts. Download this diagram for your business presentations and get exclusive comments on your efforts.

Quarterly Strategy Roadmap For Data Analysis Integration To Business Themes
Presenting our innovatively-structured quarterly strategy roadmap for data analysis integration to business themes Template. Showcase your roadmap process in different formats like PDF, PNG, and JPG by clicking the download button below. This PPT design is available in both Standard Screen and Widescreen aspect ratios. It can also be easily personalized and presented with modified font size, font type, color, and shapes to measure your progress in a clear way.
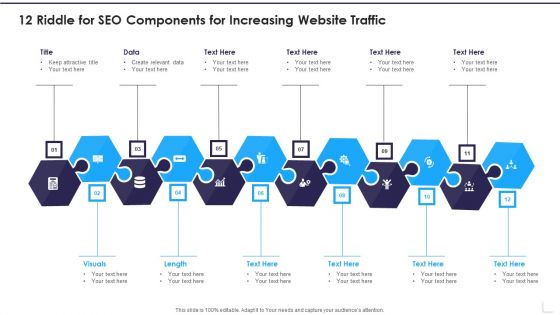
12 Riddle For SEO Components For Increasing Website Traffic Infographics PDF
Presenting 12 Riddle For SEO Components For Increasing Website Traffic Infographics PDF to dispense important information. This template comprises tweleve stages. It also presents valuable insights into the topics including Visuals, Data, Length. This is a completely customizable PowerPoint theme that can be put to use immediately. So, download it and address the topic impactfully.
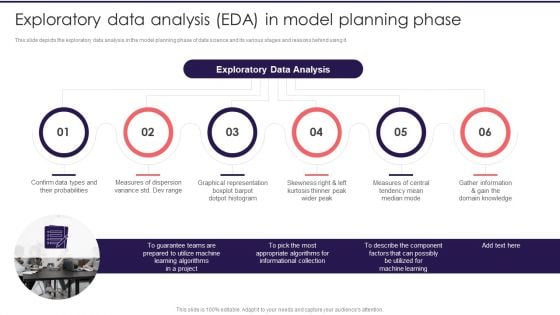
Information Studies Exploratory Data Analysis EDA In Model Planning Phase Diagrams PDF
This slide depicts the exploratory data analysis in the model planning phase of data science and its various stages and reasons behind using it. This is a Information Studies Exploratory Data Analysis EDA In Model Planning Phase Diagrams PDF template with various stages. Focus and dispense information on six stages using this creative set, that comes with editable features. It contains large content boxes to add your information on topics like Graphical Representation, Measures Of Dispersion, Probabilities. You can also showcase facts, figures, and other relevant content using this PPT layout. Grab it now.
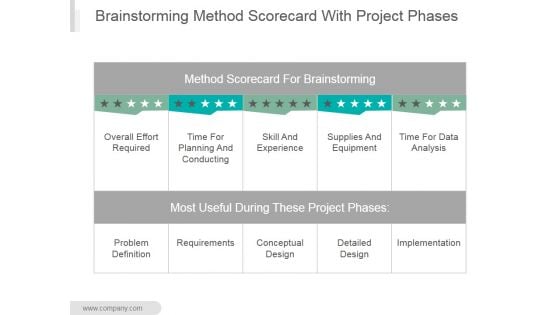
Brainstorming Method Scorecard With Project Phases Ppt PowerPoint Presentation Sample
This is a brainstorming method scorecard with project phases ppt powerpoint presentation sample. This is a five stage process. The stages in this process are method scorecard for brainstorming, overall effort required, time for planning and conducting, skill and experience, supplies and equipment, time for data analysis.
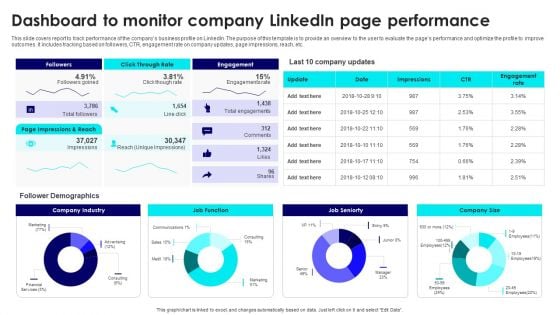
Dashboard To Monitor Company Linkedin Page Performance Portrait PDF
This slide covers report to track performance of the companys business profile on LinkedIn. The purpose of this template is to provide an overview to the user to evaluate the pages performance and optimize the profile to improve outcomes. It includes tracking based on followers, CTR, engagement rate on company updates, page impressions, reach, etc. Create an editable Dashboard To Monitor Company Linkedin Page Performance Portrait PDF that communicates your idea and engages your audience. Whether you are presenting a business or an educational presentation, pre designed presentation templates help save time. Dashboard To Monitor Company Linkedin Page Performance Portrait PDF is highly customizable and very easy to edit, covering many different styles from creative to business presentations. Slidegeeks has creative team members who have crafted amazing templates. So, go and get them without any delay.
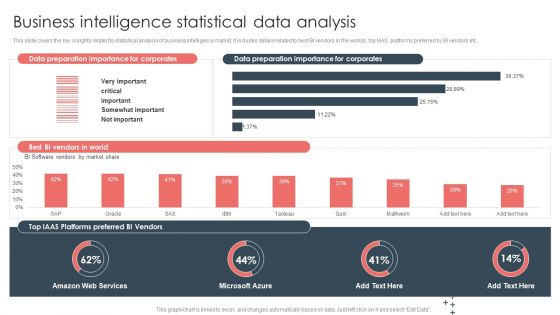
Overview Of BI For Enhanced Decision Making Business Intelligence Statistical Data Analysis Guidelines PDF
This slide covers the key insights related to statistical analysis of business intelligence market. It includes details related to best BI vendors in the worlds, top IAAS platforms preferred by BI vendors etc. There are so many reasons you need a Overview Of BI For Enhanced Decision Making Business Intelligence Statistical Data Analysis Guidelines PDF. The first reason is you cannot spend time making everything from scratch, Thus, Slidegeeks has made presentation templates for you too. You can easily download these templates from our website easily.


 Continue with Email

 Home
Home


