Hierarchy Chart Organizational
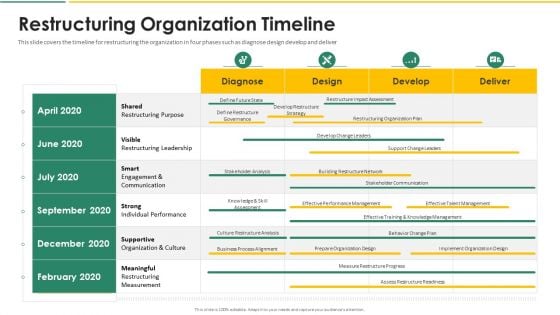
Organization Chart And Corporate Model Transformation Restructuring Organization Timeline Professional PDF
This slide covers the organizational restructuring strategies such as downsizing, starburst, verticalization, de-layering and business process reengineering. It also covers measures for the strategies, its description and comments. Deliver an awe inspiring pitch with this creative organization chart and corporate model transformation restructuring organization timeline professional pdf bundle. Topics like downsizing, starburst, verticalization, de layering, business process reengineering can be discussed with this completely editable template. It is available for immediate download depending on the needs and requirements of the user.
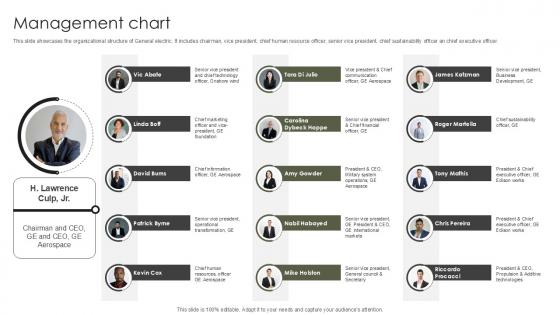
Management Chart Military Aircraft Engine Manufacturing PPT Presentation CP SS V
This slide showcases the organizational structure of General electric. It includes chairman, vice president, chief human resource officer, senior vice president, chief sustainability officer an chief executive officer. The Management Chart Military Aircraft Engine Manufacturing PPT Presentation CP SS V is a compilation of the most recent design trends as a series of slides. It is suitable for any subject or industry presentation, containing attractive visuals and photo spots for businesses to clearly express their messages. This template contains a variety of slides for the user to input data, such as structures to contrast two elements, bullet points, and slides for written information. Slidegeeks is prepared to create an impression. This slide showcases the organizational structure of General electric. It includes chairman, vice president, chief human resource officer, senior vice president, chief sustainability officer an chief executive officer.

Management Chart Global Energy Company Profile PPT Sample CP SS V
This slide showcases the organizational structure of General electric. It includes chairman, vice president, chief human resource officer, senior vice president, chief sustainability officer an chief executive officer. The Management Chart Global Energy Company Profile PPT Sample CP SS V is a compilation of the most recent design trends as a series of slides. It is suitable for any subject or industry presentation, containing attractive visuals and photo spots for businesses to clearly express their messages. This template contains a variety of slides for the user to input data, such as structures to contrast two elements, bullet points, and slides for written information. Slidegeeks is prepared to create an impression. This slide showcases the organizational structure of General electric. It includes chairman, vice president, chief human resource officer, senior vice president, chief sustainability officer an chief executive officer.
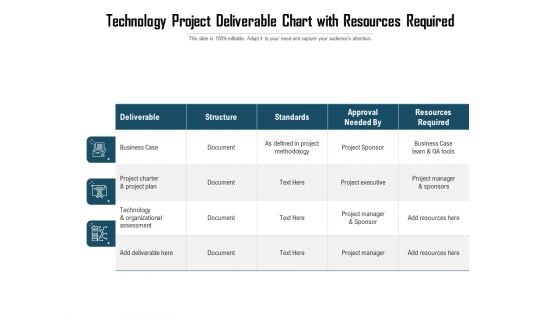
Technology Project Deliverable Chart With Resources Required Ppt PowerPoint Presentation Infographics Structure PDF
Showcasing this set of slides titled technology project deliverable chart with resources required ppt powerpoint presentation infographics structure pdf. The topics addressed in these templates are business case, project charter and project plan, technology and organizational assessment, resources required. All the content presented in this PPT design is completely editable. Download it and make adjustments in color, background, font etc. as per your unique business setting.
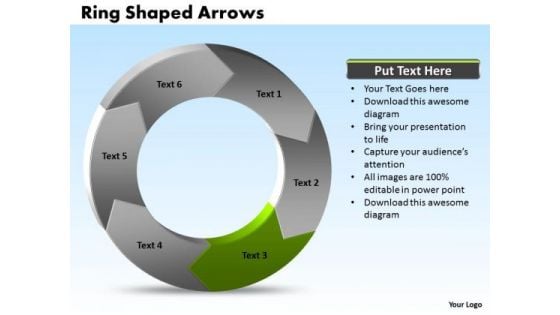
Ppt Power Point Org Chart Shaped Arrows 6 Segments PowerPoint Templates
PPT power point org chart shaped arrows 6 segments PowerPoint Templates-This Organizational chart makes information accessible throughout the organization with a collective, visible view of critical data from different perspectives and providing the tools to upcoming business scenarios and plan for change.-PPT power point org chart shaped arrows 6 segments PowerPoint Templates-Abstract, Around, Arrow, Arrow Circles, Chart, Circle, Circular, Circular Arrows, Circular Flow, Circulation, Cycle, Cyclic, Direction, Element, Flow, Icon, Illustration, Isolated, Motion, Movement, Refresh, Ring, Rotation, Round, Section, Set, Shape, Sign, Symbol Cash in on a bargain with our Ppt Power Point Org Chart Shaped Arrows 6 Segments PowerPoint Templates. Dont pass up this opportunity to shine.
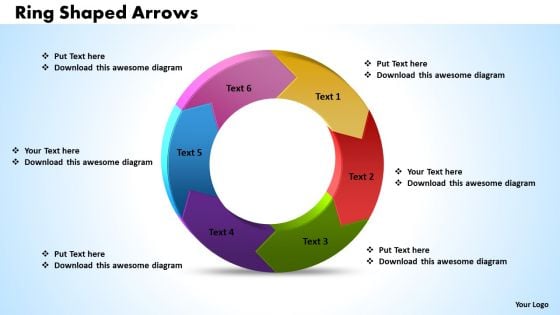
Ppt Power Point Org Chart Shaped Curved Arrows PowerPoint 2010 6 Parts Templates
PPT power point org chart shaped curved arrows powerpoint 2010 6 parts Templates- The above template contains a graphic of Organizational chart that makes employees more productive, helping them understand company strategy and structure.-PPT power point org chart shaped curved arrows powerpoint 2010 6 parts Templates-Abstract, Around, Arrow, Arrow Circles, Chart, Circle, Circular, Circular Arrows, Circular Flow, Circulation, Cycle, Cyclic, Direction, Element, Flow, Icon, Illustration, Isolated, Motion, Movement, Refresh, Ring, Rotation, Round, Section, Set, Shape, Sign, Symbol See your audience react before your very eyes. Our Ppt Power Point Org Chart Shaped Curved Arrows PowerPoint 2010 6 Parts Templates extract positive delight.
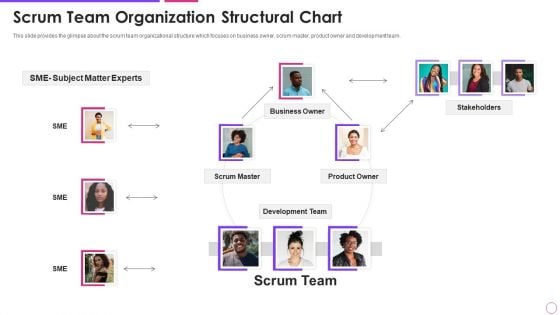
Scrum Team Organization Structural Chart Agile Project Management Framework Background PDF
This slide provides the glimpse about the scrum team organizational structure which focuses on business owner, scrum master, product owner and development team. This is a scrum team organization structural chart agile project management framework background pdf template with various stages. Focus and dispense information on one stages using this creative set, that comes with editable features. It contains large content boxes to add your information on topics like business owner, product owner, development team. You can also showcase facts, figures, and other relevant content using this PPT layout. Grab it now.
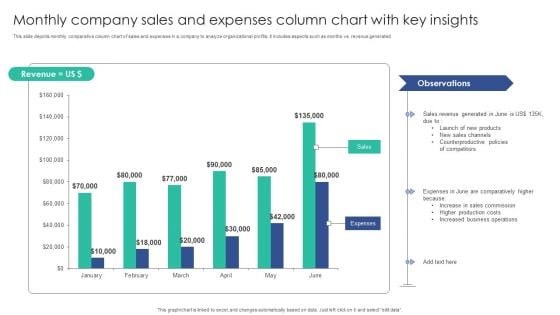
Monthly Company Sales And Expenses Column Chart With Key Insights Mockup PDF
This slide depicts monthly comparative column chart of sales and expenses in a company to analyze organizational profits. It includes aspects such as months vs. revenue generatedPitch your topic with ease and precision using this Monthly Company Sales And Expenses Column Chart With Key Insights Mockup PDF. This layout presents information on Sales Channels, Counterproductive Policies, Sales Commission. It is also available for immediate download and adjustment. So, changes can be made in the color, design, graphics or any other component to create a unique layout.
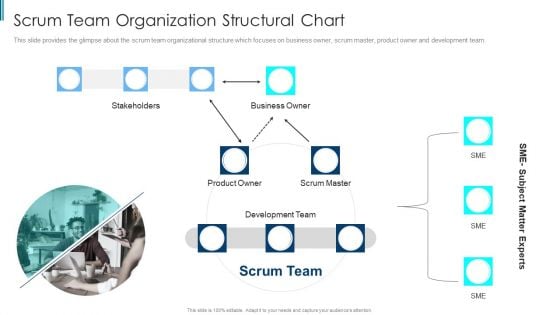
Scrum Staff Organization Map IT Scrum Team Organization Structural Chart Elements PDF
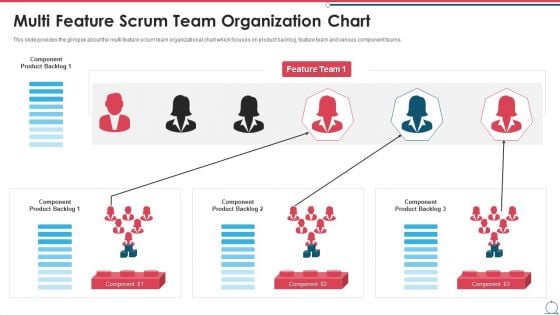
Building An Agile Development Scrum Team Multi Feature Scrum Team Organization Chart Summary PDF
This slide provides the glimpse about the multi feature scrum team organizational chart which focuses on product backlog, feature team and various component teams. This is a building an agile development scrum team multi feature scrum team organization chart summary pdf template with various stages. Focus and dispense information on three stages using this creative set, that comes with editable features. It contains large content boxes to add your information on topics like multi feature scrum team organization chart. You can also showcase facts, figures, and other relevant content using this PPT layout. Grab it now.
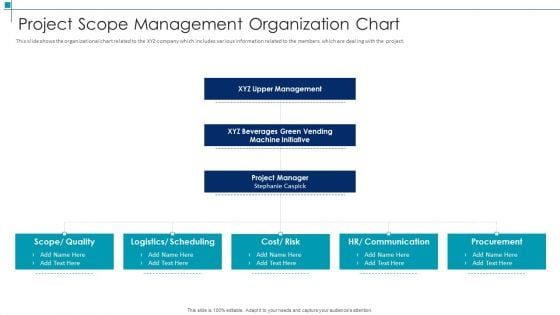
Project Scope Management Deliverables Project Scope Management Organization Chart Formats PDF
This slide shows the organizational chart related to the XYZ company which includes various information related to the members which are dealing with the project. Presenting project scope management deliverables project scope management organization chart formats pdf to provide visual cues and insights. Share and navigate important information on three stages that need your due attention. This template can be used to pitch topics like quality, scheduling, risk, cost, communication. In addtion, this PPT design contains high resolution images, graphics, etc, that are easily editable and available for immediate download.
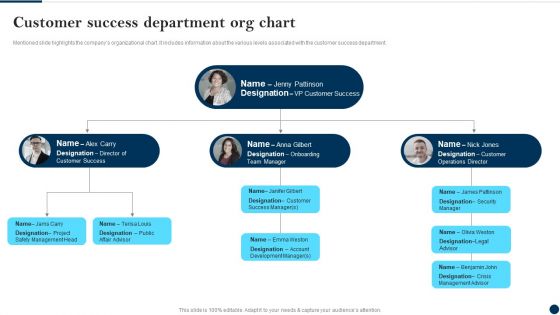
Customer Success Department Org Chart Client Success Best Practices Guide Diagrams PDF
Mentioned slide highlights the companys organizational chart. It includes information about the various levels associated with the customer success department.Slidegeeks has constructed Customer Success Department Org Chart Client Success Best Practices Guide Diagrams PDF after conducting extensive research and examination. These presentation templates are constantly being generated and modified based on user preferences and critiques from editors. Here, you will find the most attractive templates for a range of purposes while taking into account ratings and remarks from users regarding the content. This is an excellent jumping-off point to explore our content and will give new users an insight into our top-notch PowerPoint Templates.
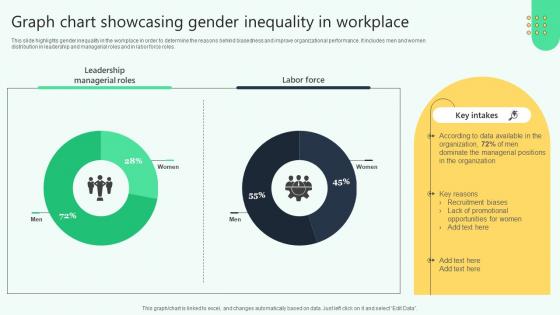
Graph Chart Showcasing Gender Inequality In Workplace Analysing Hr Data For Effective Decision Making
This slide highlights gender inequality in the workplace in order to determine the reasons behind biasedness and improve organizational performance. It includes men and women distribution in leadership and managerial roles and in labor force roles. This Graph Chart Showcasing Gender Inequality In Workplace Analysing Hr Data For Effective Decision Making is perfect for any presentation, be it in front of clients or colleagues. It is a versatile and stylish solution for organizing your meetings. The Graph Chart Showcasing Gender Inequality In Workplace Analysing Hr Data For Effective Decision Making features a modern design for your presentation meetings. The adjustable and customizable slides provide unlimited possibilities for acing up your presentation. Slidegeeks has done all the homework before launching the product for you. So, do not wait, grab the presentation templates today This slide highlights gender inequality in the workplace in order to determine the reasons behind biasedness and improve organizational performance. It includes men and women distribution in leadership and managerial roles and in labor force roles.
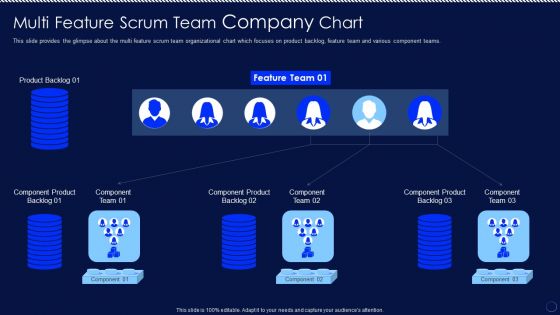
Multi Feature Scrum Team Company Chart Ppt PowerPoint Presentation File Show PDF
This slide provides the glimpse about the multi feature scrum team organizational chart which focuses on product backlog, feature team and various component teams. Create an editable Multi Feature Scrum Team Company Chart Ppt PowerPoint Presentation File Show PDF that communicates your idea and engages your audience. Whether you are presenting a business or an educational presentation, pre designed presentation templates help save time. Multi Feature Scrum Team Company Chart Ppt PowerPoint Presentation File Show PDF is highly customizable and very easy to edit, covering many different styles from creative to business presentations. Slidegeeks has creative team members who have crafted amazing templates. So, go and get them without any delay.
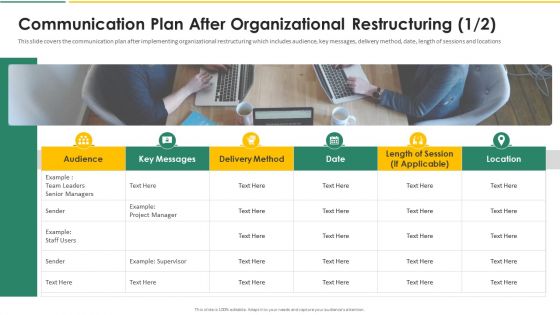
Organization Chart And Corporate Model Transformation Communication Plan After Ideas PDF
This slide covers the communication plan after implementing organizational restructuring which includes audience, key messages, delivery method, date, length of sessions and locations. Presenting organization chart and corporate model transformation communication plan after ideas pdf to provide visual cues and insights. Share and navigate important information on six stages that need your due attention. This template can be used to pitch topics like audience, key messages, delivery method, date, length of sessions, locations. In addtion, this PPT design contains high resolution images, graphics, etc, that are easily editable and available for immediate download.
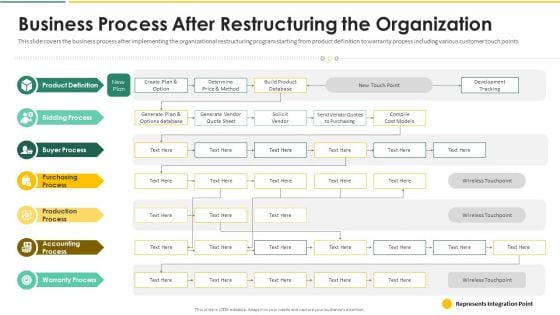
Organization Chart And Corporate Model Transformation Business Process After Restructuring Brochure PDF
This slide covers the business process after implementing the organizational restructuring program starting from product definition to warranty process including various customer touch points. This is a organization chart and corporate model transformation business process after restructuring brochure pdf template with various stages. Focus and dispense information on seven stages using this creative set, that comes with editable features. It contains large content boxes to add your information on topics like warranty process, accounting process, production process, purchasing process, buyer process. You can also showcase facts, figures, and other relevant content using this PPT layout. Grab it now.
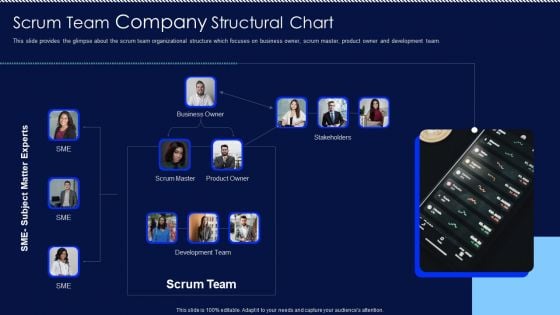
Scrum Team Company Structural Chart Ppt PowerPoint Presentation File Infographic Template PDF
This slide provides the glimpse about the scrum team organizational structure which focuses on business owner, scrum master, product owner and development team. From laying roadmaps to briefing everything in detail, our templates are perfect for you. You can set the stage with your presentation slides. All you have to do is download these easy to edit and customizable templates. Scrum Team Company Structural Chart Ppt PowerPoint Presentation File Infographic Template PDF will help you deliver an outstanding performance that everyone would remember and praise you for. Do download this presentation today.
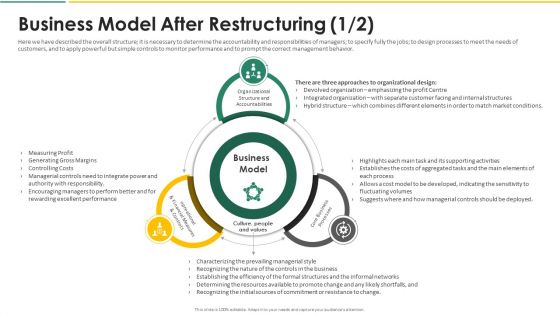
Organization Chart And Corporate Model Transformation Business Model After Information PDF
Here we have described the overall structure it is necessary to determine the accountability and responsibilities of managers to specify fully the jobs to design processes to meet the needs of customers, and to apply powerful but simple controls to monitor performance and to prompt the correct management behavior. This is a organization chart and corporate model transformation business model after information pdf template with various stages. Focus and dispense information on three stages using this creative set, that comes with editable features. It contains large content boxes to add your information on topics like organizational structure and accountabilities, opreational and financial measures and controls, core business processes. You can also showcase facts, figures, and other relevant content using this PPT layout. Grab it now.
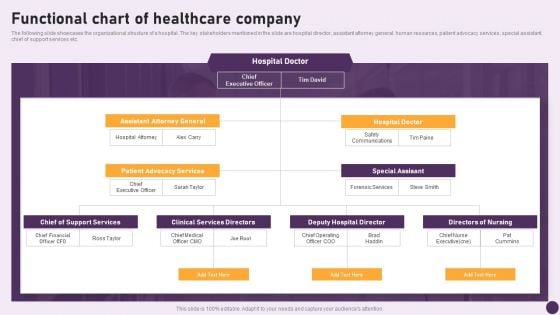
Guide To Healthcare Services Administration Functional Chart Of Healthcare Company Information PDF
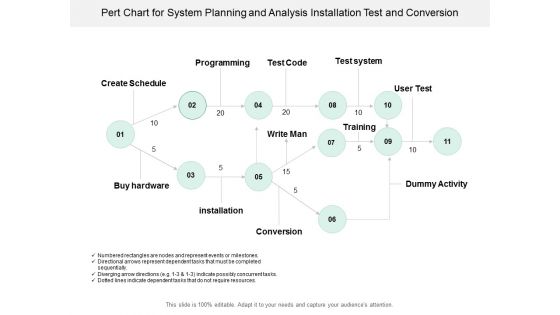
Pert Chart For System Planning And Analysis Installation Test And Conversion Ppt Powerpoint Presentation Pictures Graphics Tutorials
This is a pert chart for system planning and analysis installation test and conversion ppt powerpoint presentation pictures graphics tutorials. This is a eleven stage process. The stages in this process are pert chart, program evaluation and review technique, pert graph.
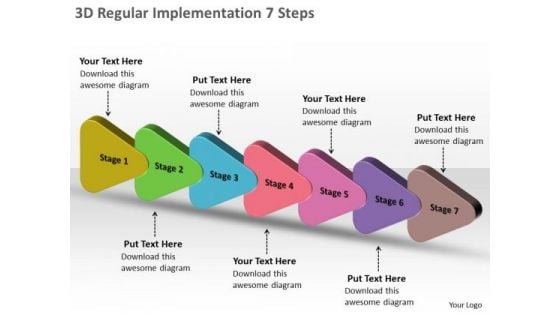
3d Regular Implementation 7 Steps Flow Chart In Business PowerPoint Slides
We present our 3d regular implementation 7 steps flow chart in business PowerPoint Slides. Use our Arrows PowerPoint Templates because, are the symbols of human growth. Use our Business PowerPoint Templates because, Marketing Strategy Business Template:- Maximizing sales of your product is the intended destination. Use our Symbol PowerPoint Templates because; educate your listeners on the means to keep it ticking over. Use our Success PowerPoint Templates because; Draw on its universal impact to highlight the similarities with your organizational structure and plans. Use our Shapes PowerPoint Templates because, Bullet-point your thoughts and ideas to profitably accomplish every step of every stage along the way. Use these PowerPoint slides for presentations relating to Abstract, Arrows, Blank, Business, Chart, Circle, Circular, Circulation, Concept, Conceptual, Converging, Design, Diagram, Empty, Executive, Idea, Illustration, Management, Model, Numbers, Organization, Outwards, Pointing, Procedure, Process, Relationship, Resource, Sequence, Sequential, Strata. The prominent colors used in the PowerPoint template are Green, Blue, and Pink You are a renowned exponent of your trade. Ply your line with our 3d Regular Implementation 7 Steps Flow Chart In Business PowerPoint Slides.
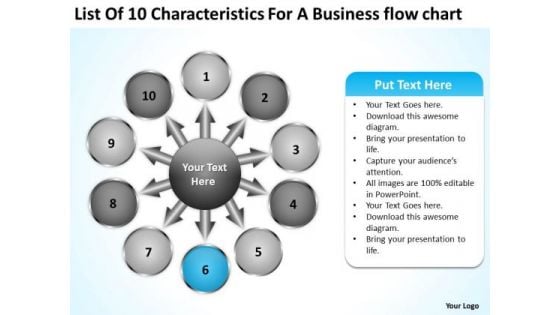
List Of 10 Characteristics For Business Flow Chart Business Gear PowerPoint Slides
We present our list of 10 characteristics for business flow chart business Gear PowerPoint Slides.Download and present our Ring Charts PowerPoint Templates because it have all to represent to your viewers. Present our Flow charts PowerPoint Templates because it Draws the universal impact to highlight the similarities with your organizational structure and plans. Present our Arrows PowerPoint Templates because this helps you to put all your brilliant views to your audience. Use our Circle charts PowerPoint Templates because you can Enlighten them with your brilliant understanding of mental health. Use our Process and Flows PowerPoint Templates because health of the determines the quality of our lives.Use these PowerPoint slides for presentations relating to Access, arrow,business, circle, color,colorful, concept, connection, corporate,creative, cycle, dark, design, different,element, empty, vector, five, four,frame, graphic, green, group, idea,illustration, message, numbers, order,part, presentation, process, purple, red,shape, solution, special, speech,strategy, symbol. The prominent colors used in the PowerPoint template are Blue, White, Black. People tell us our list of 10 characteristics for business flow chart business Gear PowerPoint Slides are Luxurious. Customers tell us our concept PowerPoint templates and PPT Slides are Functional. Professionals tell us our list of 10 characteristics for business flow chart business Gear PowerPoint Slides are Reminiscent. Presenters tell us our corporate PowerPoint templates and PPT Slides look good visually. Use our list of 10 characteristics for business flow chart business Gear PowerPoint Slides are Fantastic. Presenters tell us our business PowerPoint templates and PPT Slides are Gorgeous. Run the show with our List Of 10 Characteristics For Business Flow Chart Business Gear PowerPoint Slides. You will come out on top.
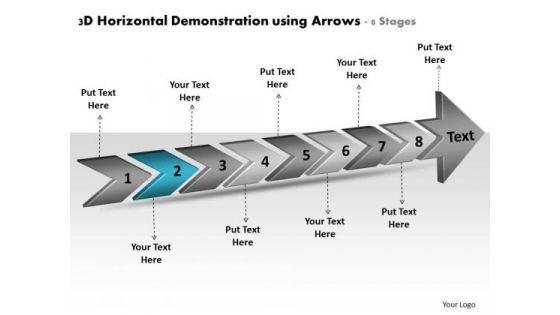
3d Horizontal Demonstration Using Arrows 8 Stages Business Plan Flow Chart PowerPoint Slides
We present our 3d horizontal demonstration using arrows 8 stages business plan flow chart PowerPoint Slides. Use our Marketing PowerPoint Templates because, you have a great plan to put the pieces together, getting all the various contributors to gel for a successful completion. Use our Shapes PowerPoint Templates because, Use our to enthuse your colleagues. Use our Business PowerPoint Templates because; Draw on its universal impact to highlight the similarities with your organizational structure and plans. Use our Process and Flows PowerPoint Templates because, and watch them strengthen your companys sinews. Use our Arrows PowerPoint Templates because, the pyramid is a symbol of the desire to reach the top in a steady manner. Use these PowerPoint slides for presentations relating to 3d, abstract, around, arrows, blue, border, business, center, circle, circular, concept, connections, copy, curve, cycle, directions, distribution, illustration, management, middle, objects, pieces, plan, pointing, process, recycle, rounded, shadows, space, system. The prominent colors used in the PowerPoint template are Blue navy, Black, Gray Mend fences with our 3d Horizontal Demonstration Using Arrows 8 Stages Business Plan Flow Chart PowerPoint Slides. You will be at the top of your game.
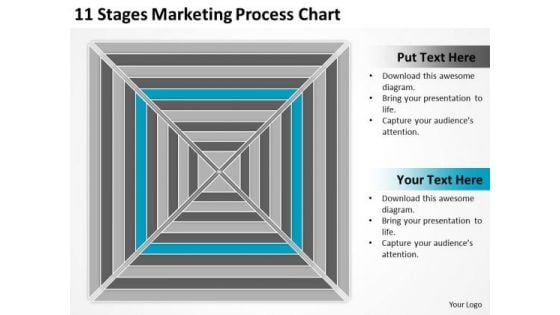
11 Stages Marketing Process Chart Ppt Components Of Business Plan PowerPoint Slides
We present our 11 stages marketing process chart ppt components of business plan PowerPoint Slides.Download and present our Flow Charts PowerPoint Templates because Our PowerPoint Templates and Slides will embellish your thoughts. See them provide the desired motivation to your team. Download our Process and Flows PowerPoint Templates because Our PowerPoint Templates and Slides will let your words and thoughts hit bullseye everytime. Download our Business PowerPoint Templates because Our PowerPoint Templates and Slides will provide you a launch platform. Give a lift off to your ideas and send them into orbit. Download our Shapes PowerPoint Templates because Our PowerPoint Templates and Slides will let you meet your Deadlines. Download and present our Marketing PowerPoint Templates because These PowerPoint Templates and Slides will give the updraft to your ideas. See them soar to great heights with ease.Use these PowerPoint slides for presentations relating to Chart, flow, process, workflow, review, square, corporation, corporate, business, plan, hierarchy, glossy, compliance, diagram, graphic, marketing, development, graph, modern, illustration, icon, assess, clipart, stages, executive, design, clip, set, organization, infographic,levels, organize, art, implement, work, eleven. The prominent colors used in the PowerPoint template are White, Blue, Gray. With our 11 Stages Marketing Process Chart Ppt Components Of Business Plan PowerPoint Slides you will feel free. They drastically cut down the burden on you.
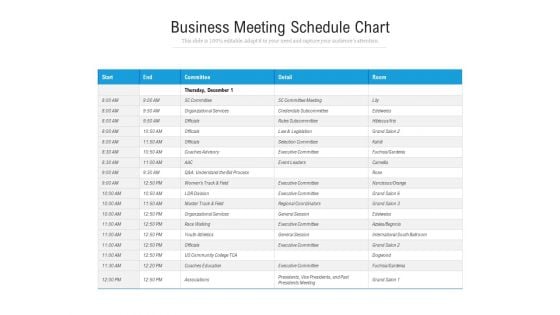
Business Meeting Schedule Chart Ppt PowerPoint Presentation File Master Slide PDF
Showcasing this set of slides titled business meeting schedule chart ppt powerpoint presentation file master slide pdf. The topics addressed in these templates are organizational, services, process. All the content presented in this PPT design is completely editable. Download it and make adjustments in color, background, font etc. as per your unique business setting.
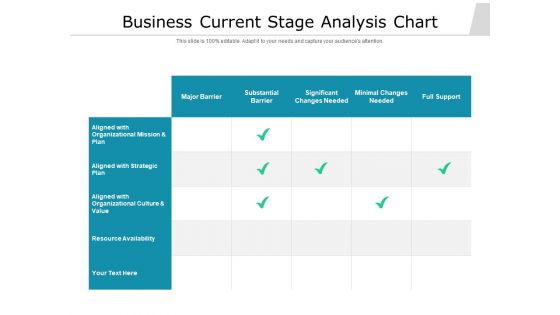
Business Current Stage Analysis Chart Ppt PowerPoint Presentation Gallery Gridlines PDF
Pitch your topic with ease and precision using this business current stage analysis chart ppt powerpoint presentation gallery gridlines pdf. This layout presents information on substantial barrier, resource availability, organizational, aligned with strategic plan. It is also available for immediate download and adjustment. So, changes can be made in the color, design, graphics or any other component to create a unique layout.
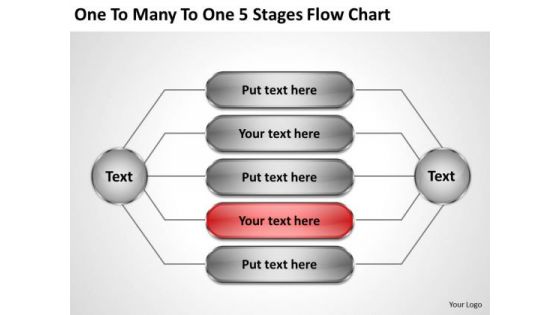
Business Marketing Strategy To Many 5 Stages Flow Chart Ppt Consultant
We present our business marketing strategy to many 5 stages flow chart ppt consultant.Present our Flow Charts PowerPoint Templates because Our PowerPoint Templates and Slides will help you be quick off the draw. Just enter your specific text and see your points hit home. Use our Shapes PowerPoint Templates because Our PowerPoint Templates and Slides will give good value for money. They also have respect for the value of your time. Download our Success PowerPoint Templates because It can be used to Set your controls for the heart of the sun. Our PowerPoint Templates and Slides will be the propellant to get you there. Present our Finance PowerPoint Templates because You are working at that stage with an air of royalty. Let our PowerPoint Templates and Slides be the jewels in your crown. Use our Marketing PowerPoint Templates because Our PowerPoint Templates and Slides are the chords of your song. String them along and provide the lilt to your views.Use these PowerPoint slides for presentations relating to Arrangement, arrow, box, business, chart, circle, company,connection, copyspace, corporation, diagram, diamond,enterprise, flow, flowchart, job, level, link, linked,management, manager, network, office, organization, organizational, organize,position, post, pyramid, rectangle, relation, relationship, reporting, resources,shape, sign, square, structure, symbolic, teamwork, workflow. The prominent colors used in the PowerPoint template are Red, Black, Gray. Spice up the discourse with our Business Marketing Strategy To Many 5 Stages Flow Chart Ppt Consultant. Strengthen the flavour of your thoughts.
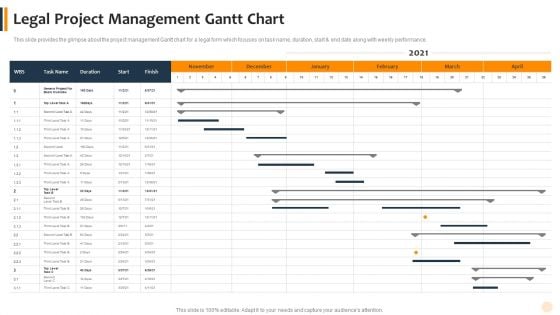
Agile Technique To Lawful Pitch And Proposals IT Legal Project Management Gantt Chart Slides PDF
Design a highly optimized project management report using this well-researched agile technique to lawful pitch and proposals it legal project management gantt chart slides pdf. This layout can be used to present the professional details of a task or activity. Showcase the activities allocated to the business executives with this Gantt Chart PowerPoint theme. List down the column tasks in various timeframes and allocate time for each. In addition, also monitor the actual time and make comparisons to interpret the final progress using this innovative Gantt Chart Template. Showcase the work breakdown structure to attract your audience. Download and share it using Google Slides, if it suits your requirement.
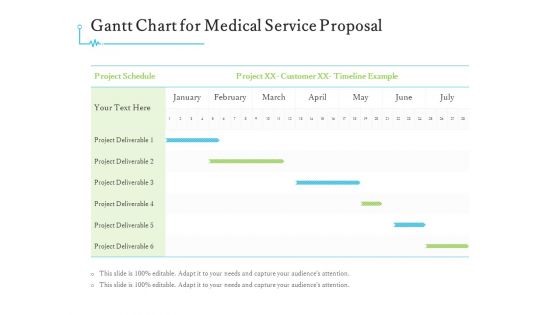
Medical And Healthcare Related Gantt Chart For Medical Service Proposal Ppt Introduction PDF
Introducing our medical and healthcare related gantt chart for medical service proposal ppt introduction pdf that is designed to showcase some of the vital components that will help you create timelines, roadmaps, and project plans. In addition, also communicate your project durations, milestones, tasks, subtasks, dependencies, and other attributes using this well-structured medical and healthcare related gantt chart for medical service proposal ppt introduction pdf template. You can also exhibit preeminence against time by deploying this easily adaptable slide to your business presentation. Our experts have designed this template in such a way that it is sure to impress your audience. Thus, download it and steer your project meetings, meetups, and conferences.
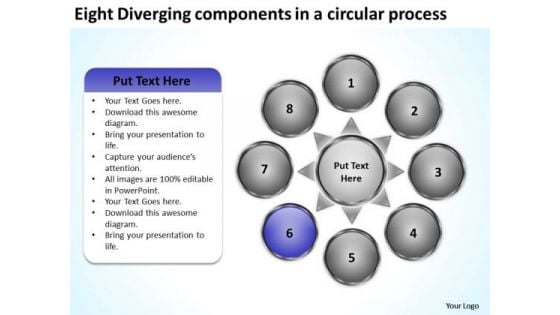
Eight Diverging Components A Circular Process Circular Pie Chart PowerPoint Slides
We present our eight diverging components a circular process Circular Pie Chart PowerPoint Slides.Use our Business PowerPoint Templates because you can Flutter your wings and enchant the world. Impress them with the innate attractiveness of your thoughts and words. Use our Circle Charts PowerPoint Templates because you are the star of your enlightened team. Download and present our Arrows PowerPoint Templates because the key criteria for necessary infrastructure are at your finger tips. Radiate this knowledge to the group and see their eyes light up. Use our Shapes PowerPoint Templates because the structure of our templates allows you to effectively highlight the key issues concerning the growth of your business. Use our Flow charts PowerPoint Templates because this template contains the material to highlight the key issues of your presentation.Use these PowerPoint slides for presentations relating to Arrows, blank, business, central, centralized, chart, circle, circular, circulation concept, conceptual, converging, design, diagram, empty, executive, icon, idea illustration, management, map, mapping, moa, model, numbers, organization outwards, pointing, procedure, process, radial, radiating, relationship, resource sequence, sequential, seven, square, strategy, template. The prominent colors used in the PowerPoint template are Blue, Gray, White. Presenters tell us our eight diverging components a circular process Circular Pie Chart PowerPoint Slides are Breathtaking. Presenters tell us our business PowerPoint templates and PPT Slides have awesome images to get your point across. PowerPoint presentation experts tell us our eight diverging components a circular process Circular Pie Chart PowerPoint Slides are Adorable. We assure you our chart PowerPoint templates and PPT Slides are Excellent. Customers tell us our eight diverging components a circular process Circular Pie Chart PowerPoint Slides are Fabulous. People tell us our chart PowerPoint templates and PPT Slides are effectively colour coded to prioritise your plans They automatically highlight the sequence of events you desire. Supervise your team with our Eight Diverging Components A Circular Process Circular Pie Chart PowerPoint Slides. Download without worries with our money back guaranteee.
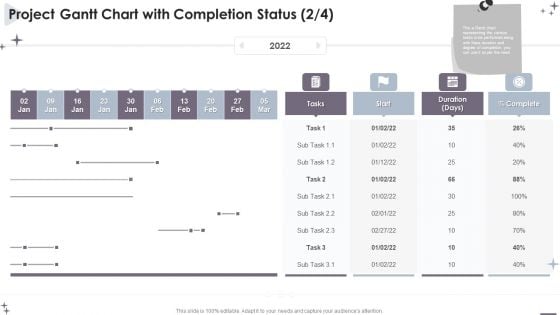
Project Administration Bundle Project Gantt Chart With Completion Status Designs PDF
Introducing our Project Administration Bundle Project Gantt Chart With Completion Status Designs PDF that is designed to showcase some of the vital components that will help you create timelines, roadmaps, and project plans. In addition, also communicate your project durations, milestones, tasks, subtasks, dependencies, and other attributes using this well structured Project Administration Bundle Project Gantt Chart With Completion Status Designs PDF template. You can also exhibit preeminence against time by deploying this easily adaptable slide to your business presentation. Our experts have designed this template in such a way that it is sure to impress your audience. Thus, download it and steer your project meetings, meetups, and conferences.
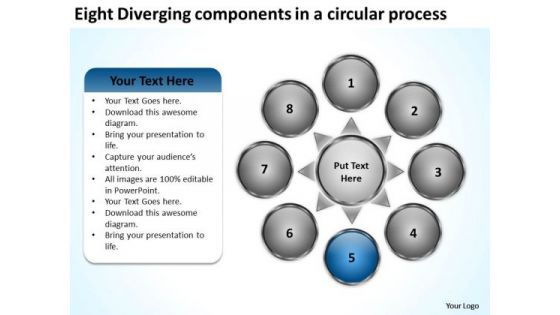
Eight Diverging Components A Circular Process Business Pie Chart PowerPoint Slides
We present our eight diverging components a circular process business Pie Chart PowerPoint Slides.Present our Business PowerPoint Templates because everybody knows The world over it is a priority for many. Along with it there are so many oppurtunities waiting to be utilised. Download and present our Circle Charts PowerPoint Templates because our ready backdrops leave a lasting impression. Present our Arrows PowerPoint Templates because you can Show them how to churn out fresh ideas. Use our Shapes PowerPoint Templates because watching them will strengthen your companys sinews. Use our Flow charts PowerPoint Templates because you can get advantage to prioritise your ideas.Use these PowerPoint slides for presentations relating to Arrows, blank, business, central, centralized, chart, circle, circular, circulation concept, conceptual, converging, design, diagram, empty, executive, icon, idea illustration, management, map, mapping, moa, model, numbers, organization outwards, pointing, procedure, process, radial, radiating, relationship, resource sequence, sequential, seven, square, strategy, template. The prominent colors used in the PowerPoint template are Blue, Gray, White. Presenters tell us our eight diverging components a circular process business Pie Chart PowerPoint Slides are Efficacious. Presenters tell us our centralized PowerPoint templates and PPT Slides are Handsome. PowerPoint presentation experts tell us our eight diverging components a circular process business Pie Chart PowerPoint Slides are Awesome. We assure you our business PowerPoint templates and PPT Slides are Delightful. Customers tell us our eight diverging components a circular process business Pie Chart PowerPoint Slides are Functional. People tell us our central PowerPoint templates and PPT Slides are Delightful. Equip your thoughts with our Eight Diverging Components A Circular Process Business Pie Chart PowerPoint Slides. They will prove a worthwhile accessory.
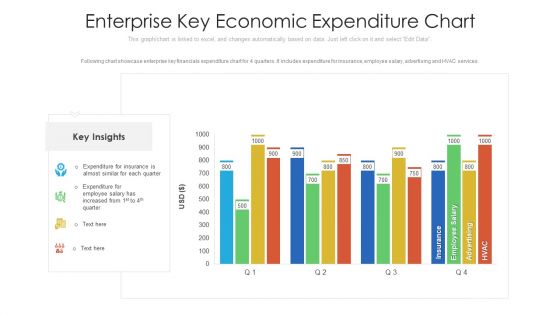
Enterprise Key Economic Expenditure Chart Ppt PowerPoint Presentation File Designs Download PDF
Following chart showcase enterprise key financials expenditure chart for 4 quarters. It includes expenditure for insurance, employee salary, advertising and HVAC services. Pitch your topic with ease and precision using this enterprise key economic expenditure chart ppt powerpoint presentation file designs download pdf. This layout presents information on enterprise key economic expenditure chart. It is also available for immediate download and adjustment. So, changes can be made in the color, design, graphics or any other component to create a unique layout.
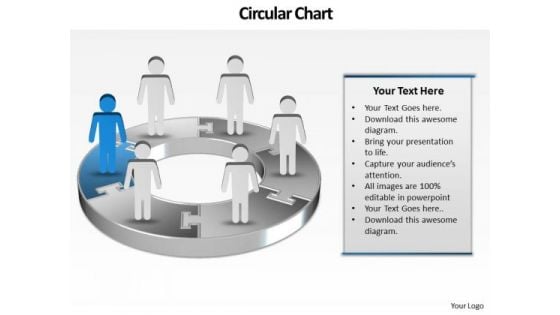
Ppt Display Of 3d Pie Org Chart PowerPoint 2010 With Standing Busines Men Templates
PPT display of 3d pie org chart powerpoint 2010 with standing busines men Templates-This is a professional-look process steps diagram. This Process steps diagram is widely used to show sequence of actions. Use this linear process diagram to emphasize direction of movement and interconnections of stages in a flow. It is useful to explain components involved as well as the factors included in Process. -PPT display of 3d pie org chart powerpoint 2010 with standing busines men Templates-Adult, Art, Background, Business, Career, Chart, Communication, Concept, Conference, Corporate, Creative, Design, Economy, Executive, Finance, Group, Growth, Idea, Illustration, Leadership, Meeting, New, Occupation, Office, People, Person, Progress, Silhouette, Space, Speaking, Standing, Success Fend off any challenge with our Ppt Display Of 3d Pie Org Chart PowerPoint 2010 With Standing Busines Men Templates. They provide a firm defense.
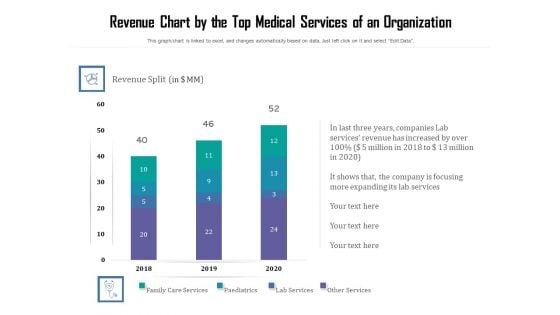
Revenue Chart By The Top Medical Services Of An Organization Ppt PowerPoint Presentation File Slide PDF
Pitch your topic with ease and precision using this revenue chart by the top medical services of an organization ppt powerpoint presentation file slide pdf. This layout presents information on revenue chart by the top medical services of an organization. It is also available for immediate download and adjustment. So, changes can be made in the color, design, graphics or any other component to create a unique layout.
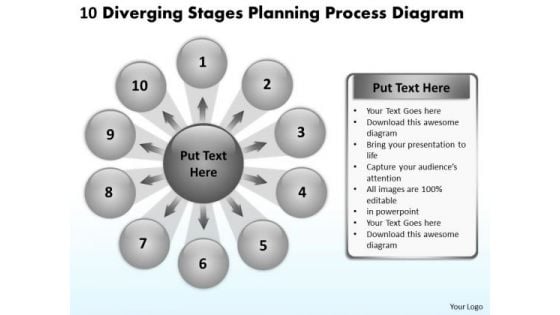
10 Diverging Stages Planning Process Diagram Ppt Circular Flow Spoke Chart PowerPoint Slides
We present our 10 diverging stages planning process diagram ppt Circular Flow Spoke Chart PowerPoint Slides.Download and present our Arrows PowerPoint Templates because individual components well researched and understood in their place. Download and present our Flow charts PowerPoint Templates because the foundation stones of many a life. Use our Business PowerPoint Templates because you have secured a name for yourself in the domestic market. Now the time is right to spread your reach to other countries. Present our Process and Flows PowerPoint Templates because you can see In any endeavour people matter most. Download and present our Circle charts PowerPoint Templates because you can blaze a brilliant trail from point to point.Use these PowerPoint slides for presentations relating to Business, catalog, chart, circle, concept, conceptual, conference, connection, corporate, description, design, development, diagram, goal, graphic, idea, illustration, item, management, marketing, mind, mind map, model, navigation, organization, parts, plans, presentation, process, reports, solutions, strategy, success, target. The prominent colors used in the PowerPoint template are Yellow, Black, Gray. You can be sure our 10 diverging stages planning process diagram ppt Circular Flow Spoke Chart PowerPoint Slides are Versatile. Presenters tell us our corporate PowerPoint templates and PPT Slides are effectively colour coded to prioritise your plans They automatically highlight the sequence of events you desire. We assure you our 10 diverging stages planning process diagram ppt Circular Flow Spoke Chart PowerPoint Slides are Chic. Customers tell us our connection PowerPoint templates and PPT Slides are Spiffy. Presenters tell us our 10 diverging stages planning process diagram ppt Circular Flow Spoke Chart PowerPoint Slides will impress their bosses and teams. You can be sure our conference PowerPoint templates and PPT Slides are Fun. Cross the chasm with our 10 Diverging Stages Planning Process Diagram Ppt Circular Flow Spoke Chart PowerPoint Slides. You will come out on top.
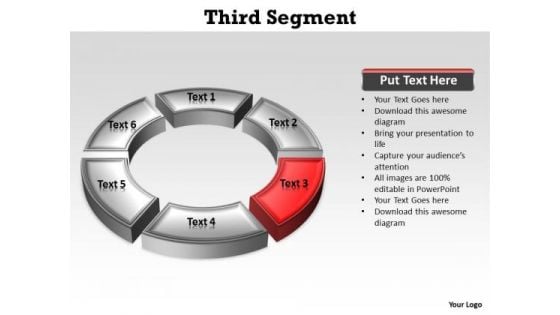
Ppt Red Quadrant On Circular Free Pie PowerPoint Template Chart Ks2 Templates
PPT red quadrant on circular free pie powerpoint template chart ks2 Templates-Use this layout to define the outcome and the multiple possibilities in a way that is used in calculation of probabilities, genetics and strategic reasoning. This chart visualize the of process steps, reoccurrences and components or of your company structure or product features.-PPT red quadrant on circular free pie powerpoint template chart ks2 Templates-3 arrow, art, background, business, chart, circle, clip, colorful, design, diagram, flow, fourth, graph, graphic, half, icon, illustration, management, point, process, progress, project, round, segment, set, slide, stage, successful business, third, transparent Increase efficiency with our Ppt Red Quadrant On Circular Free Pie PowerPoint Template Chart Ks2 Templates. Download without worries with our money back guaranteee.
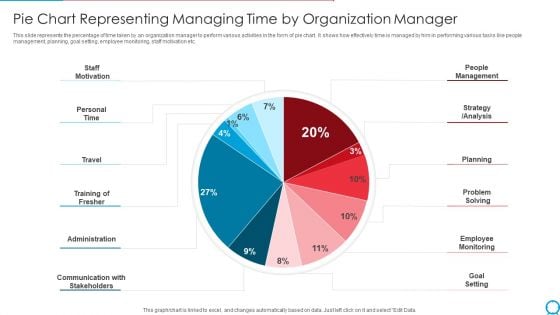
Pie Chart Representing Managing Time By Organization Manager Ppt PowerPoint Presentation Gallery Template PDF
This slide represents the percentage of time taken by an organization manager to perform various activities in the form of pie chart. It shows how effectively time is managed by him in performing various tasks like people management, planning, goal setting, employee monitoring, staff motivation etc. Pitch your topic with ease and precision using this pie chart representing managing time by organization manager ppt powerpoint presentation gallery template pdf. This layout presents information on staff motivation, personal time, travel training of fresher, administration. It is also available for immediate download and adjustment. So, changes can be made in the color, design, graphics or any other component to create a unique layout.
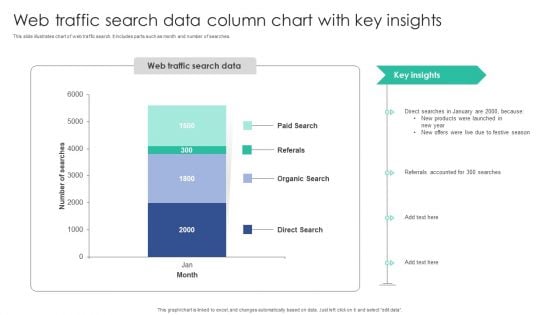
Web Traffic Search Data Column Chart With Key Insights Inspiration PDF
This slide illustrates chart of web traffic search. It includes parts such as month and number of searches.Pitch your topic with ease and precision using this Web Traffic Search Data Column Chart With Key Insights Inspiration PDF. This layout presents information on Organic Search, Referrals Accounted, Products Launched. It is also available for immediate download and adjustment. So, changes can be made in the color, design, graphics or any other component to create a unique layout.
Annual Two Product Performance Analysis Chart Ppt PowerPoint Presentation Icon Design Templates PDF
Pitch your topic with ease and precision using this annual two product performance analysis chart ppt powerpoint presentation icon design templates pdf. This layout presents information on annual, two product performance, analysis chart. It is also available for immediate download and adjustment. So, changes can be made in the color, design, graphics or any other component to create a unique layout.
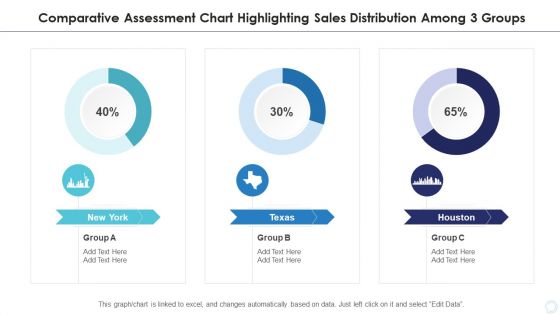
Comparative Assessment Chart Highlighting Sales Distribution Among 3 Groups Designs PDF
Pitch your topic with ease and precision using this comparative assessment chart highlighting sales distribution among 3 groups designs pdf. This layout presents information on comparative assessment chart highlighting sales distribution among 3 groups. It is also available for immediate download and adjustment. So, changes can be made in the color, design, graphics or any other component to create a unique layout.
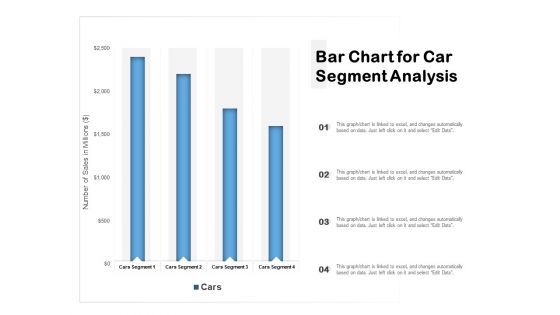
Bar Chart For Car Segment Analysis Ppt PowerPoint Presentation Show Templates PDF
Pitch your topic with ease and precision using this bar chart for car segment analysis ppt powerpoint presentation show templates pdf. This layout presents information on bar chart for car segment analysis. It is also available for immediate download and adjustment. So, changes can be made in the color, design, graphics or any other component to create a unique layout.

Horizontal Bar Chart Representing Consumer Review On Three Scale Ppt Gallery Diagrams PDF
Pitch your topic with ease and precision using this horizontal bar chart representing consumer review on three scale ppt gallery diagrams pdf. This layout presents information on horizontal bar chart representing consumer review on three scale. It is also available for immediate download and adjustment. So, changes can be made in the color, design, graphics or any other component to create a unique layout.
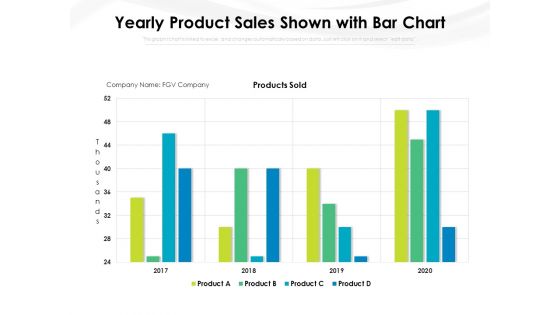
Yearly Product Sales Shown With Bar Chart Ppt PowerPoint Presentation File Gridlines PDF
Pitch your topic with ease and precision using this yearly product sales shown with bar chart ppt powerpoint presentation file gridlines pdf. This layout presents information on yearly product sales shown with bar chart. It is also available for immediate download and adjustment. So, changes can be made in the color, design, graphics or any other component to create a unique layout.
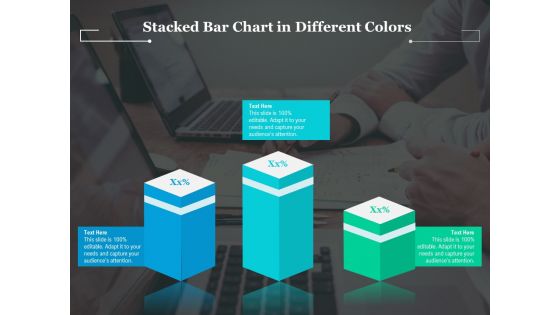
Stacked Bar Chart In Different Colors Ppt PowerPoint Presentation Gallery Maker PDF
Pitch your topic with ease and precision using this stacked bar chart in different colors ppt powerpoint presentation gallery maker pdf. This layout presents information on stacked bar chart in different colors. It is also available for immediate download and adjustment. So, changes can be made in the color, design, graphics or any other component to create a unique layout.
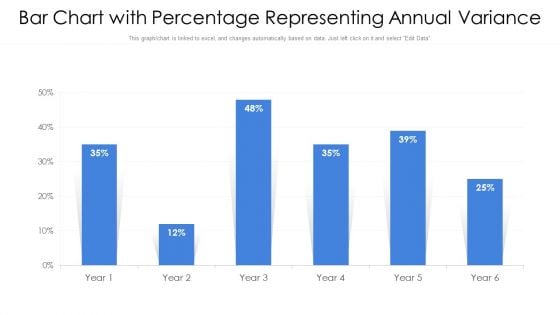
Bar Chart With Percentage Representing Annual Variance Ppt PowerPoint Presentation Gallery Portfolio PDF
Pitch your topic with ease and precision using this bar chart with percentage representing annual variance ppt powerpoint presentation gallery portfolio pdf. This layout presents information on bar chart with percentage representing annual variance. It is also available for immediate download and adjustment. So, changes can be made in the color, design, graphics or any other component to create a unique layout.

Bar Chart With Percentage Representing Inventory Ppt PowerPoint Presentation File Outfit PDF
Pitch your topic with ease and precision using this bar chart with percentage representing inventory ppt powerpoint presentation file outfit pdf. This layout presents information on bar chart with percentage representing inventory. It is also available for immediate download and adjustment. So, changes can be made in the color, design, graphics or any other component to create a unique layout.
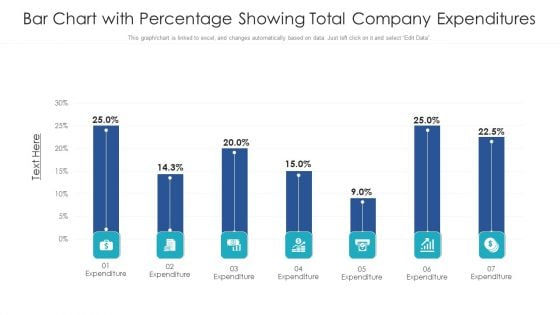
Bar Chart With Percentage Showing Total Company Expenditures Ppt PowerPoint Presentation File Background PDF
Pitch your topic with ease and precision using this bar chart with percentage showing total company expenditures ppt powerpoint presentation file background pdf. This layout presents information on bar chart with percentage showing total company expenditures. It is also available for immediate download and adjustment. So, changes can be made in the color, design, graphics or any other component to create a unique layout.
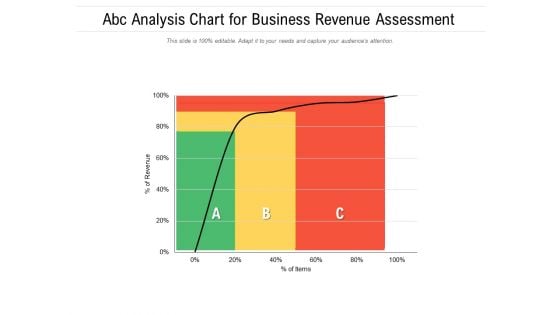
ABC Analysis Chart For Business Revenue Assessment Ppt PowerPoint Presentation Model Template PDF
Pitch your topic with ease and precision using this abc analysis chart for business revenue assessment ppt powerpoint presentation model template pdf. This layout presents information on abc analysis chart for business revenue assessment. It is also available for immediate download and adjustment. So, changes can be made in the color, design, graphics or any other component to create a unique layout.
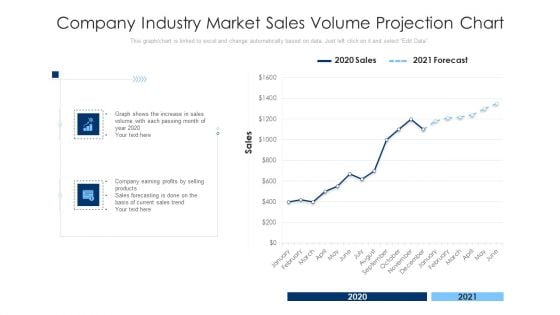
Company Industry Market Sales Volume Projection Chart Ppt PowerPoint Presentation Infographic Template Clipart PDF
Pitch your topic with ease and precision using this company industry market sales volume projection chart ppt powerpoint presentation infographic template clipart pdf. This layout presents information on company industry market sales volume projection chart. It is also available for immediate download and adjustment. So, changes can be made in the color, design, graphics or any other component to create a unique layout.
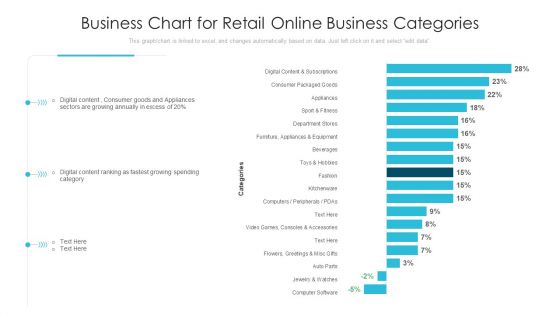
Business Chart For Retail Online Business Categories Ppt PowerPoint Presentation Infographics Diagrams PDF
Pitch your topic with ease and precision using this business chart for retail online business categories ppt powerpoint presentation infographics diagrams pdf. This layout presents information on business chart for retail online business categories. It is also available for immediate download and adjustment. So, changes can be made in the color, design, graphics or any other component to create a unique layout.
Business Statistic Chart With Expansion And Reduction Icon Ppt Visual Aids Ideas PDF
Pitch your topic with ease and precision using this business statistic chart with expansion and reduction icon ppt visual aids ideas pdf. This layout presents information on business statistic chart with expansion and reduction icon. It is also available for immediate download and adjustment. So, changes can be made in the color, design, graphics or any other component to create a unique layout.
Line Chart Showing Four Products Performance Ppt PowerPoint Presentation Icon Slideshow PDF
Pitch your topic with ease and precision using this line chart showing four products performance ppt powerpoint presentation icon slideshow pdf. This layout presents information on line chart showing four products performance. It is also available for immediate download and adjustment. So, changes can be made in the color, design, graphics or any other component to create a unique layout.
Pie Chart Showing Online Business Sales Analysis Ppt PowerPoint Presentation File Icons PDF
Pitch your topic with ease and precision using this pie chart showing online business sales analysis ppt powerpoint presentation file icons pdf. This layout presents information on pie chart showing online business sales analysis. It is also available for immediate download and adjustment. So, changes can be made in the color, design, graphics or any other component to create a unique layout.
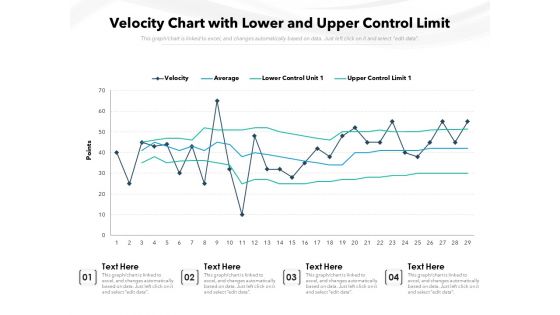
Velocity Chart With Lower And Upper Control Limit Ppt PowerPoint Presentation Gallery Infographics PDF
Pitch your topic with ease and precision using this velocity chart with lower and upper control limit ppt powerpoint presentation gallery infographics pdf. This layout presents information on velocity chart with lower and upper control limit. It is also available for immediate download and adjustment. So, changes can be made in the color, design, graphics or any other component to create a unique layout.
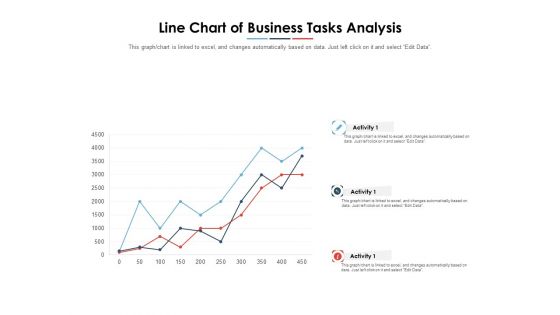
Line Chart Of Business Tasks Analysis Ppt PowerPoint Presentation Layouts Skills PDF
Pitch your topic with ease and precision using this line chart of business tasks analysis ppt powerpoint presentation layouts skills pdf. This layout presents information on line chart of business tasks analysis. It is also available for immediate download and adjustment. So, changes can be made in the color, design, graphics or any other component to create a unique layout.
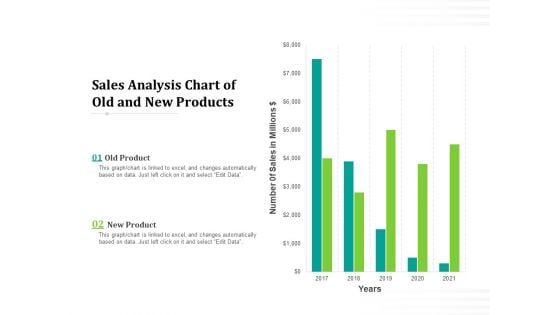
Sales Analysis Chart Of Old And New Products Ppt PowerPoint Presentation Professional Influencers PDF
Pitch your topic with ease and precision using this sales analysis chart of old and new products ppt powerpoint presentation professional influencers pdf. This layout presents information on sales analysis chart of old and new products. It is also available for immediate download and adjustment. So, changes can be made in the color, design, graphics or any other component to create a unique layout.
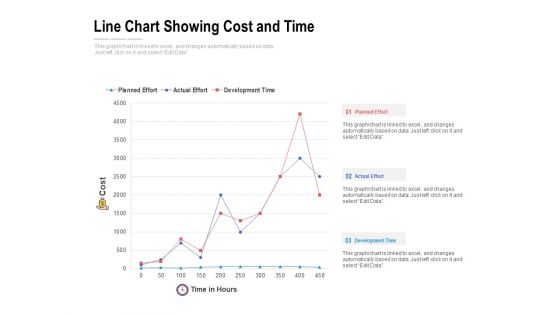
Line Chart Showing Cost And Time Ppt PowerPoint Presentation File Example Topics PDF
Pitch your topic with ease and precision using this line chart showing cost and time ppt powerpoint presentation file example topics pdf. This layout presents information on line chart showing cost and time. It is also available for immediate download and adjustment. So, changes can be made in the color, design, graphics or any other component to create a unique layout.
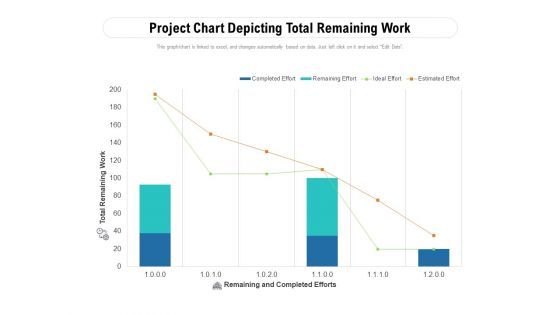
Project Chart Depicting Total Remaining Work Ppt PowerPoint Presentation File Slides PDF
Pitch your topic with ease and precision using this project chart depicting total remaining work ppt powerpoint presentation file slides pdf. This layout presents information on project chart depicting total remaining work. It is also available for immediate download and adjustment. So, changes can be made in the color, design, graphics or any other component to create a unique layout.
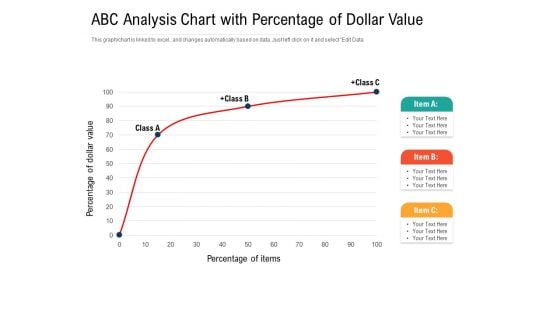
ABC Analysis Chart With Percentage Of Dollar Value Ppt PowerPoint Presentation Gallery Portfolio PDF
Pitch your topic with ease and precision using this abc analysis chart with percentage of dollar value ppt powerpoint presentation gallery portfolio pdf. This layout presents information on abc analysis chart with percentage of dollar value. It is also available for immediate download and adjustment. So, changes can be made in the color, design, graphics or any other component to create a unique layout.


 Continue with Email

 Home
Home


