Hierarchy Chart Organizational

Sales Monthly Trends Analysis Chart Ppt Powerpoint Presentation Gallery Objects Pdf
Pitch your topic with ease and precision using this sales monthly trends analysis chart ppt powerpoint presentation gallery objects pdf. This layout presents information on sales monthly trends analysis chart. It is also available for immediate download and adjustment. So, changes can be made in the color, design, graphics or any other component to create a unique layout.
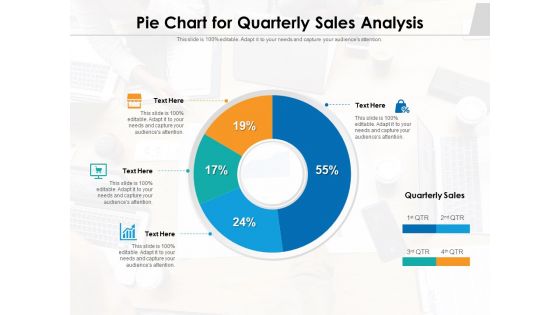
Pie Chart For Quarterly Sales Analysis Ppt PowerPoint Presentation File Outfit PDF
Pitch your topic with ease and precision using this pie chart for quarterly sales analysis ppt powerpoint presentation file outfit pdf. This layout presents information on pie chart for quarterly sales analysis. It is also available for immediate download and adjustment. So, changes can be made in the color, design, graphics or any other component to create a unique layout.

Pie Chart For Regional Analysis Ppt PowerPoint Presentation Gallery Example PDF
Pitch your topic with ease and precision using this pie chart for regional analysis ppt powerpoint presentation gallery example pdf. This layout presents information on pie chart for regional analysis. It is also available for immediate download and adjustment. So, changes can be made in the color, design, graphics or any other component to create a unique layout.
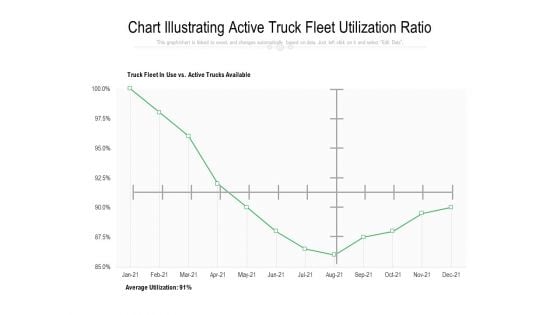
Chart Illustrating Active Truck Fleet Utilization Ratio Ppt PowerPoint Presentation Styles Graphics Pictures PDF
Pitch your topic with ease and precision using this chart illustrating active truck fleet utilization ratio ppt powerpoint presentation styles graphics pictures pdf. This layout presents information on chart illustrating active truck fleet utilization ratio. It is also available for immediate download and adjustment. So, changes can be made in the color, design, graphics or any other component to create a unique layout.

Two Products Comparison Stacked Chart Ppt PowerPoint Presentation Gallery Structure PDF
Pitch your topic with ease and precision using this two products comparison stacked chart ppt powerpoint presentation gallery structure pdf. This layout presents information on two products comparison stacked chart. It is also available for immediate download and adjustment. So, changes can be made in the color, design, graphics or any other component to create a unique layout.
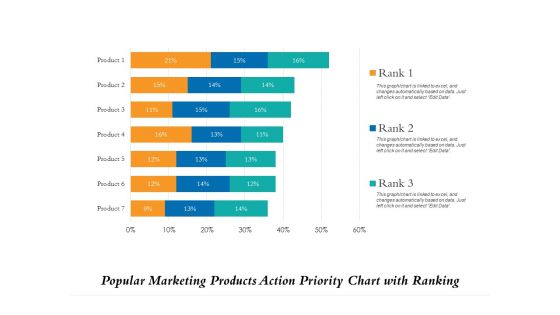
Popular Marketing Products Action Priority Chart With Ranking Ppt PowerPoint Presentation File Demonstration PDF
Pitch your topic with ease and precision using this popular marketing products action priority chart with ranking ppt powerpoint presentation file demonstration pdf. This layout presents information on popular marketing products action priority chart with ranking. It is also available for immediate download and adjustment. So, changes can be made in the color, design, graphics or any other component to create a unique layout.
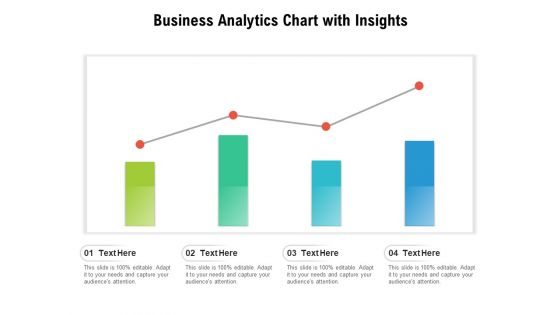
Business Analytics Chart With Insights Ppt PowerPoint Presentation Slides Guidelines PDF
Pitch your topic with ease and precision using this business analytics chart with insights ppt powerpoint presentation slides guidelines pdf. This layout presents information on business analytics chart with insights. It is also available for immediate download and adjustment. So, changes can be made in the color, design, graphics or any other component to create a unique layout.
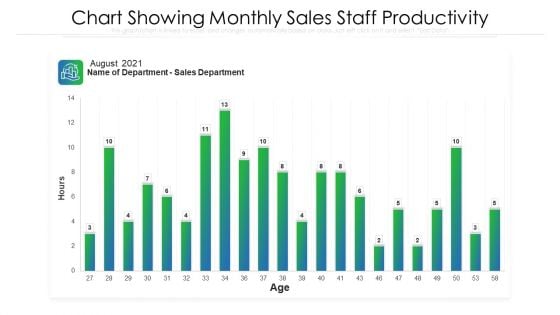
Chart Showing Monthly Sales Staff Productivity Ppt PowerPoint Presentation File Images PDF
Pitch your topic with ease and precision using this chart showing monthly sales staff productivity ppt powerpoint presentation file images pdf. This layout presents information on chart showing monthly sales staff productivity. It is also available for immediate download and adjustment. So, changes can be made in the color, design, graphics or any other component to create a unique layout.
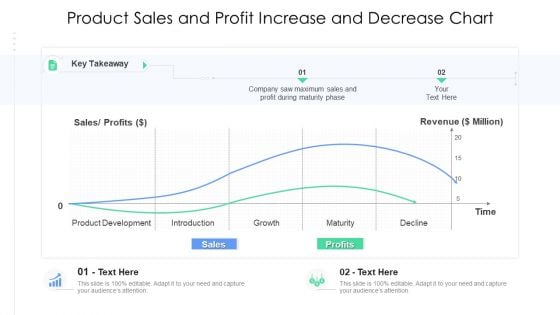
Product Sales And Profit Increase And Decrease Chart Ppt Show PDF
Pitch your topic with ease and precision using this product sales and profit increase and decrease chart ppt show pdf. This layout presents information on product sales and profit increase and decrease chart. It is also available for immediate download and adjustment. So, changes can be made in the color, design, graphics or any other component to create a unique layout.
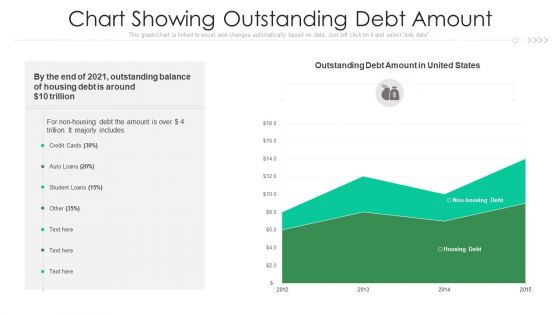
Chart Showing Outstanding Debt Amount Ppt PowerPoint Presentation Outline Background PDF
Pitch your topic with ease and precision using this chart showing outstanding debt amount ppt powerpoint presentation outline background pdf. This layout presents information on chart showing outstanding debt amount. It is also available for immediate download and adjustment. So, changes can be made in the color, design, graphics or any other component to create a unique layout.
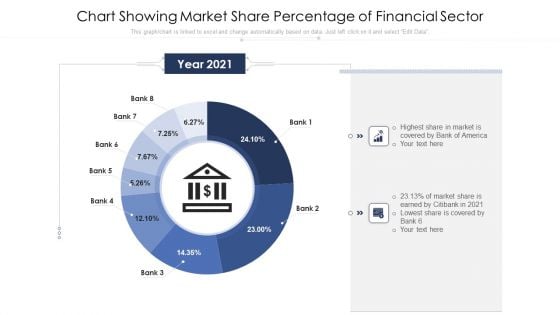
Chart Showing Market Share Percentage Of Financial Sector Ppt PowerPoint Presentation Show Guide PDF
Pitch your topic with ease and precision using this chart showing market share percentage of financial sector ppt powerpoint presentation show guide pdf. This layout presents information on chart showing market share percentage of financial sector. It is also available for immediate download and adjustment. So, changes can be made in the color, design, graphics or any other component to create a unique layout.
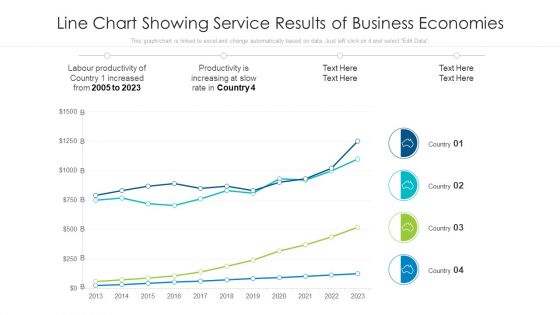
Line Chart Showing Service Results Of Business Economies Ppt PowerPoint Presentation Model Tips PDF
Pitch your topic with ease and precision using this line chart showing service results of business economies ppt powerpoint presentation model tips pdf. This layout presents information on line chart showing service results of business economies. It is also available for immediate download and adjustment. So, changes can be made in the color, design, graphics or any other component to create a unique layout.
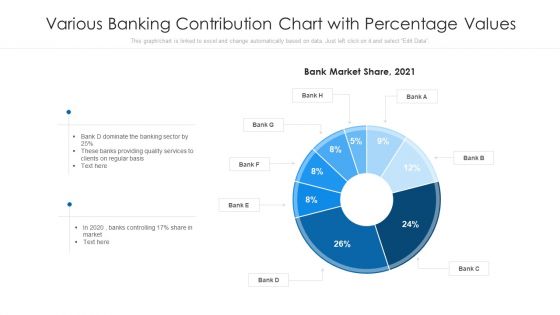
Various Banking Contribution Chart With Percentage Values Ppt PowerPoint Presentation Visual Aids Deck PDF
Pitch your topic with ease and precision using this various banking contribution chart with percentage values ppt powerpoint presentation visual aids deck pdf This layout presents information on various banking contribution chart with percentage values. It is also available for immediate download and adjustment. So, changes can be made in the color, design, graphics or any other component to create a unique layout.
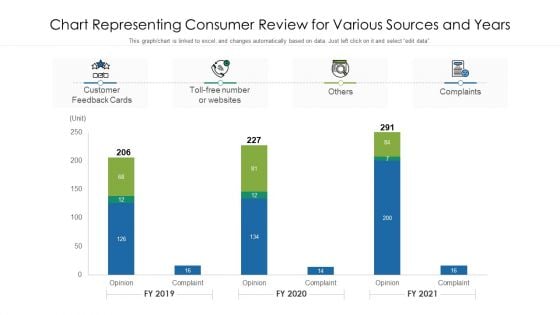
Chart Representing Consumer Review For Various Sources And Years Ppt Summary Background PDF
Pitch your topic with ease and precision using this chart representing consumer review for various sources and years ppt summary background pdf. This layout presents information on chart representing consumer review for various sources and years. It is also available for immediate download and adjustment. So, changes can be made in the color, design, graphics or any other component to create a unique layout.
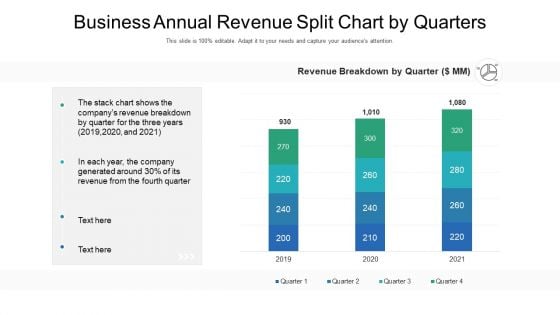
Business Annual Revenue Split Chart By Quarters Ppt PowerPoint Presentation Background Image PDF
Pitch your topic with ease and precision using this business annual revenue split chart by quarters ppt powerpoint presentation background image pdf. This layout presents information on business annual revenue split chart by quarters. It is also available for immediate download and adjustment. So, changes can be made in the color, design, graphics or any other component to create a unique layout.
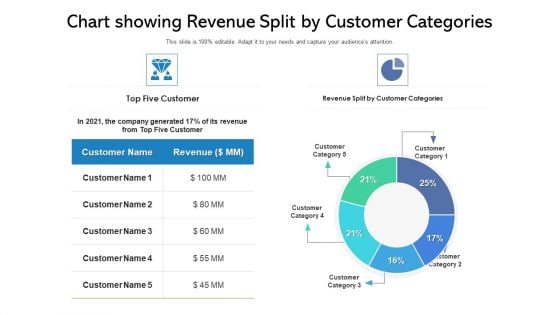
Chart Showing Revenue Split By Customer Categories Ppt PowerPoint Presentation Show Smartart PDF
Pitch your topic with ease and precision using this chart showing revenue split by customer categories ppt powerpoint presentation show smartart pdf. This layout presents information on chart showing revenue split by customer categories. It is also available for immediate download and adjustment. So, changes can be made in the color, design, graphics or any other component to create a unique layout.
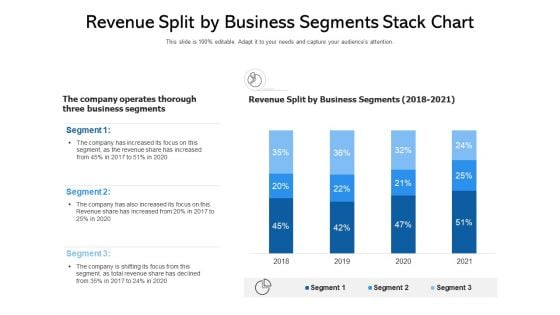
Revenue Split By Business Segments Stack Chart Ppt PowerPoint Presentation Ideas Sample PDF
Pitch your topic with ease and precision using this revenue split by business segments stack chart ppt powerpoint presentation ideas sample pdf. This layout presents information on revenue split by business segments stack chart. It is also available for immediate download and adjustment. So, changes can be made in the color, design, graphics or any other component to create a unique layout.
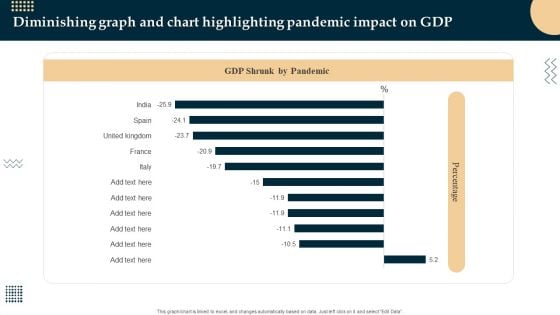
Diminishing Graph And Chart Highlighting Pandemic Impact On GDP Sample PDF
Pitch your topic with ease and precision using this Diminishing Graph And Chart Highlighting Pandemic Impact On GDP Sample PDF. This layout presents information on Diminishing Graph, Chart Highlighting Pandemic. It is also available for immediate download and adjustment. So, changes can be made in the color, design, graphics or any other component to create a unique layout.
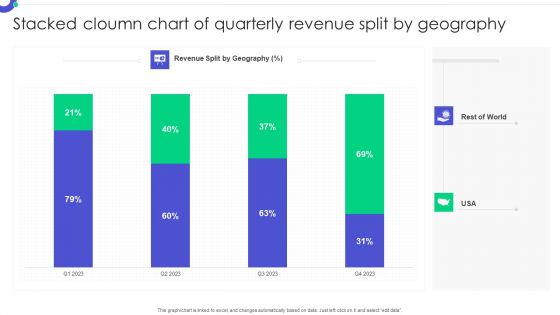
Stacked Cloumn Chart Of Quarterly Revenue Split By Geography Pictures PDF
Pitch your topic with ease and precision using this Stacked Cloumn Chart Of Quarterly Revenue Split By Geography Pictures PDF. This layout presents information on Stacked Column, Chart Quarterly, Revenue Split. It is also available for immediate download and adjustment. So, changes can be made in the color, design, graphics or any other component to create a unique layout.
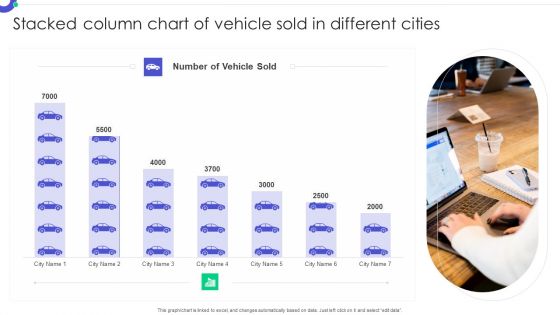
Stacked Column Chart Of Vehicle Sold In Different Cities Formats PDF
Pitch your topic with ease and precision using this Stacked Column Chart Of Vehicle Sold In Different Cities Formats PDF. This layout presents information on Stacked Column, Chart Vehicle, Sold Different Cities. It is also available for immediate download and adjustment. So, changes can be made in the color, design, graphics or any other component to create a unique layout.
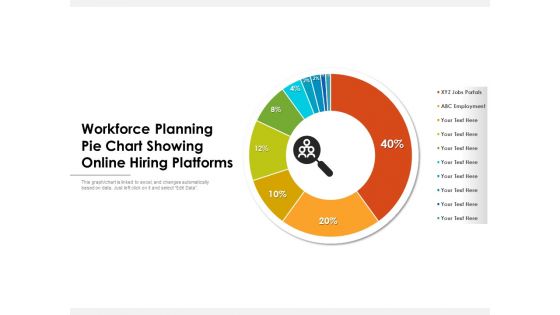
Workforce Planning Pie Chart Showing Online Hiring Platforms Ppt PowerPoint Presentation Inspiration Background Designs PDF
Pitch your topic with ease and precision using this workforce planning pie chart showing online hiring platforms ppt powerpoint presentation inspiration background designs pdf. This layout presents information on workforce planning pie chart showing online hiring platforms. It is also available for immediate download and adjustment. So, changes can be made in the color, design, graphics or any other component to create a unique layout.

Chart Depicting New Emerging Markets Share With Advanced Economies Ppt PowerPoint Presentation Gallery Design Ideas PDF
Pitch your topic with ease and precision using this chart depicting new emerging markets share with advanced economies ppt powerpoint presentation gallery design ideas pdf. This layout presents information on chart depicting new emerging markets share with advanced economies. It is also available for immediate download and adjustment. So, changes can be made in the color, design, graphics or any other component to create a unique layout.
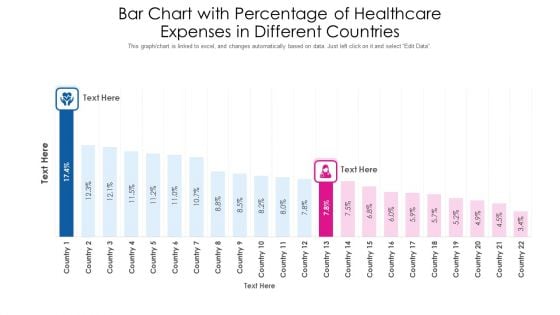
Bar Chart With Percentage Of Healthcare Expenses In Different Countries Ppt PowerPoint Presentation Gallery Tips PDF
Pitch your topic with ease and precision using this bar chart with percentage of healthcare expenses in different countries ppt powerpoint presentation gallery tips pdf. This layout presents information on bar chart with percentage of healthcare expenses in different countries. It is also available for immediate download and adjustment. So, changes can be made in the color, design, graphics or any other component to create a unique layout.
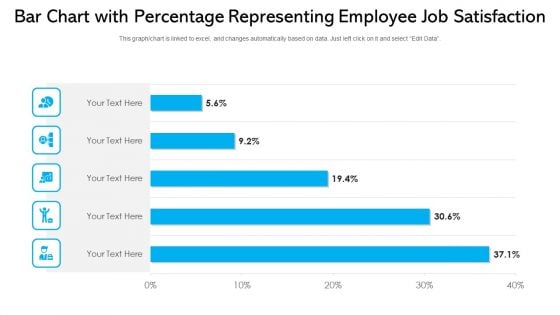
Bar Chart With Percentage Representing Employee Job Satisfaction Ppt PowerPoint Presentation File Slide Download PDF
Pitch your topic with ease and precision using this bar chart with percentage representing employee job satisfaction ppt powerpoint presentation file slide download pdf. This layout presents information on bar chart with percentage representing employee job satisfaction. It is also available for immediate download and adjustment. So, changes can be made in the color, design, graphics or any other component to create a unique layout.
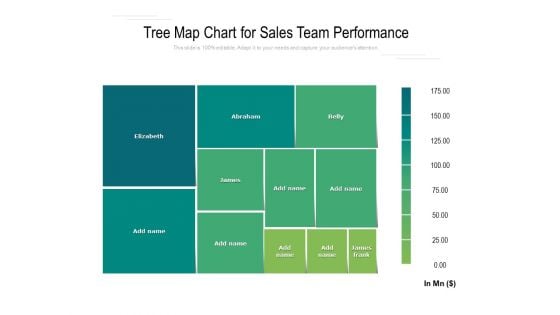
Tree Map Chart For Sales Team Performance Ppt PowerPoint Presentation Ideas Structure
Pitch your topic with ease and precision using this tree map chart for sales team performance ppt powerpoint presentation ideas structure. This layout presents information on tree map chart for sales team performance. It is also available for immediate download and adjustment. So, changes can be made in the color, design, graphics or any other component to create a unique layout.
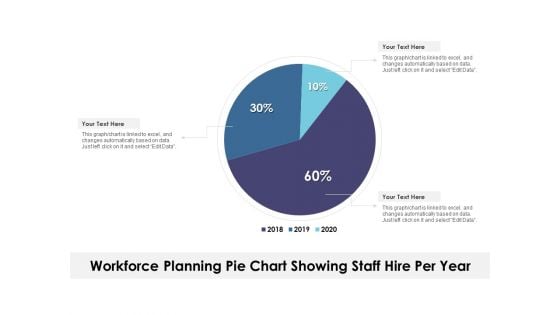
Workforce Planning Pie Chart Showing Staff Hire Per Year Ppt PowerPoint Presentation Show Demonstration PDF
Pitch your topic with ease and precision using this workforce planning pie chart showing staff hire per year ppt powerpoint presentation show demonstration pdf. This layout presents information on workforce planning pie chart showing staff hire per year. It is also available for immediate download and adjustment. So, changes can be made in the color, design, graphics or any other component to create a unique layout.
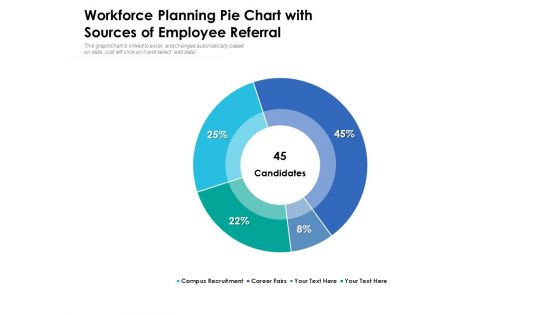
Workforce Planning Pie Chart With Sources Of Employee Referral Ppt PowerPoint Presentation Layouts Picture PDF
Pitch your topic with ease and precision using this workforce planning pie chart with sources of employee referral ppt powerpoint presentation layouts picture pdf. This layout presents information on workforce planning pie chart with sources of employee referral. It is also available for immediate download and adjustment. So, changes can be made in the color, design, graphics or any other component to create a unique layout.
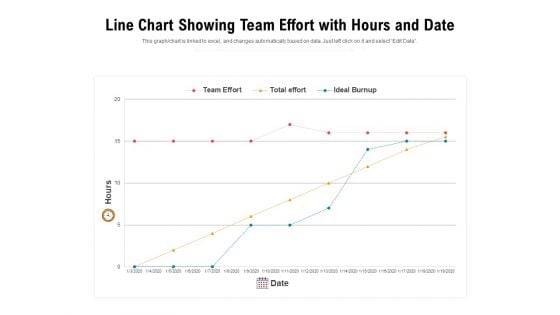
Line Chart Showing Team Effort With Hours And Date Ppt PowerPoint Presentation File Graphic Tips PDF
Pitch your topic with ease and precision using this line chart showing team effort with hours and date ppt powerpoint presentation file graphic tips pdf. This layout presents information on line chart showing team effort with hours and date. It is also available for immediate download and adjustment. So, changes can be made in the color, design, graphics or any other component to create a unique layout.
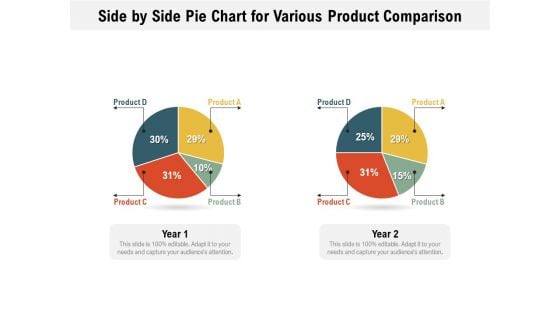
Side By Side Pie Chart For Various Product Comparison Ppt PowerPoint Presentation File Infographics PDF
Pitch your topic with ease and precision using this side by side pie chart for various product comparison ppt powerpoint presentation file infographics pdf. This layout presents information on side by side pie chart for various product comparison. It is also available for immediate download and adjustment. So, changes can be made in the color, design, graphics or any other component to create a unique layout.
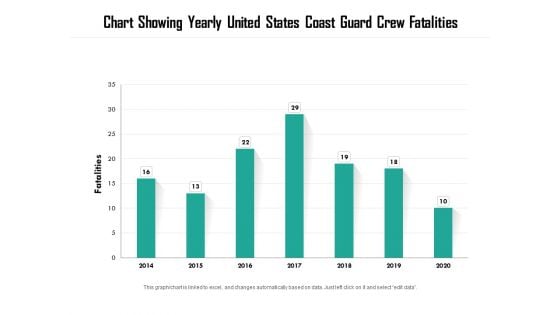
Chart Showing Yearly United States Coast Guard Crew Fatalities Ppt PowerPoint Presentation Inspiration Structure PDF
Pitch your topic with ease and precision using this chart showing yearly united states coast guard crew fatalities ppt powerpoint presentation inspiration structure pdf. This layout presents information on chart showing yearly united states coast guard crew fatalities. It is also available for immediate download and adjustment. So, changes can be made in the color, design, graphics or any other component to create a unique layout.
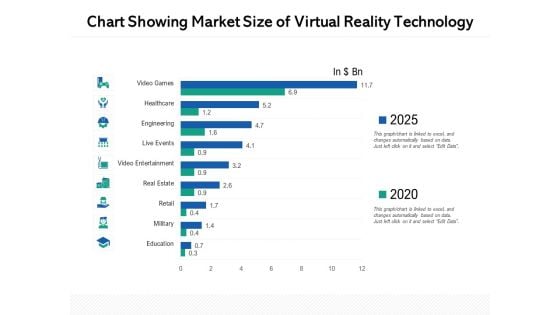
Chart Showing Market Size Of Virtual Reality Technology Ppt PowerPoint Presentation Layouts Graphics Example PDF
Pitch your topic with ease and precision using this chart showing market size of virtual reality technology ppt powerpoint presentation layouts graphics example pdf. This layout presents information on chart showing market size of virtual reality technology. It is also available for immediate download and adjustment. So, changes can be made in the colour, design, graphics or any other component to create a unique layout.
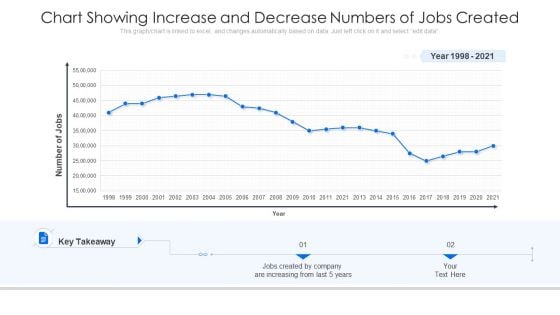
Chart Showing Increase And Decrease Numbers Of Jobs Created Ppt Visual Aids Model PDF
Pitch your topic with ease and precision using this chart showing increase and decrease numbers of jobs created ppt visual aids model pdf. This layout presents information on chart showing increase and decrease numbers of jobs created. It is also available for immediate download and adjustment. So, changes can be made in the color, design, graphics or any other component to create a unique layout.
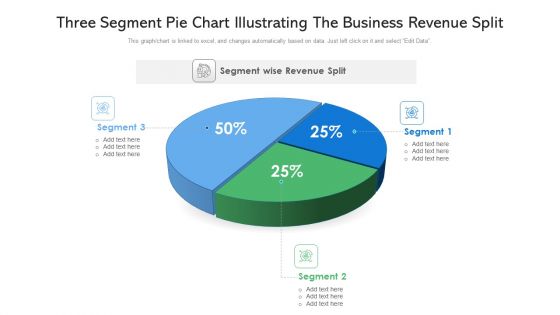
Three Segment Pie Chart Illustrating The Business Revenue Split Ppt PowerPoint Presentation Gallery Summary PDF
Pitch your topic with ease and precision using this three segment pie chart illustrating the business revenue split ppt powerpoint presentation gallery summary pdf. This layout presents information on three segment pie chart illustrating the business revenue split. It is also available for immediate download and adjustment. So, changes can be made in the color, design, graphics or any other component to create a unique layout.
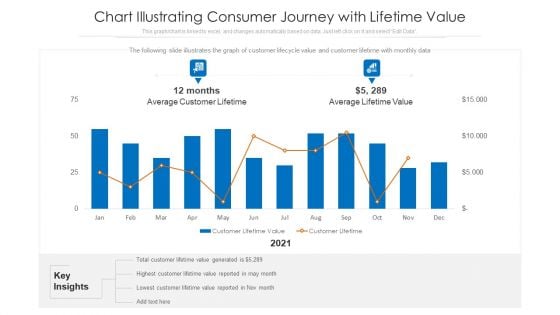
Chart Illustrating Consumer Journey With Lifetime Value Ppt PowerPoint Presentation File Background Images PDF
The following slide illustrates the graph of customer lifecycle value and customer lifetime with monthly data. Pitch your topic with ease and precision using this chart illustrating consumer journey with lifetime value ppt powerpoint presentation file background images pdf. This layout presents information on chart illustrating consumer journey with lifetime value. It is also available for immediate download and adjustment. So, changes can be made in the color, design, graphics or any other component to create a unique layout.
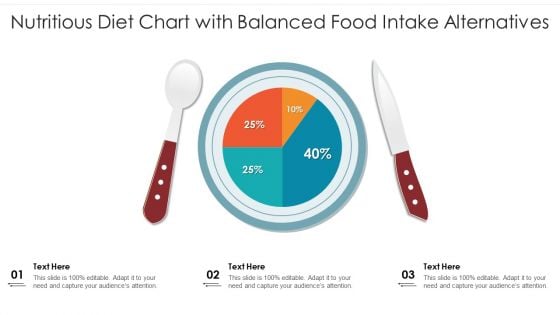
Nutritious Diet Chart With Balanced Food Intake Alternatives Ppt PowerPoint Presentation Portfolio Layout Ideas PDF
Pitch your topic with ease and precision using this nutritious diet chart with balanced food intake alternatives ppt powerpoint presentation portfolio layout ideas pdf. This layout presents information on nutritious diet chart with balanced food intake alternatives. It is also available for immediate download and adjustment. So, changes can be made in the color, design, graphics or any other component to create a unique layout.
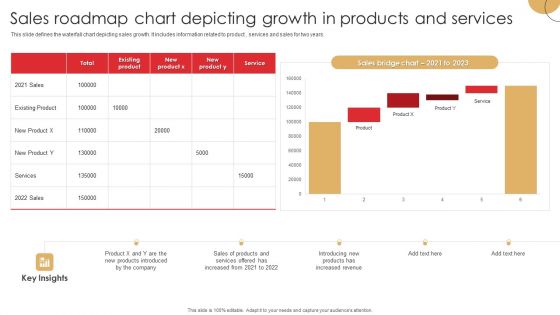
Sales Roadmap Chart Depicting Growth In Products And Services Ideas PDF
This slide defines the waterfall chart depicting sales growth. It includes information related to product , services and sales for two years.Pitch your topic with ease and precision using this Sales Roadmap Chart Depicting Growth In Products And Services Ideas PDF. This layout presents information on Products Introduced, Increased Revenue, Services Offered. It is also available for immediate download and adjustment. So, changes can be made in the color, design, graphics or any other component to create a unique layout.
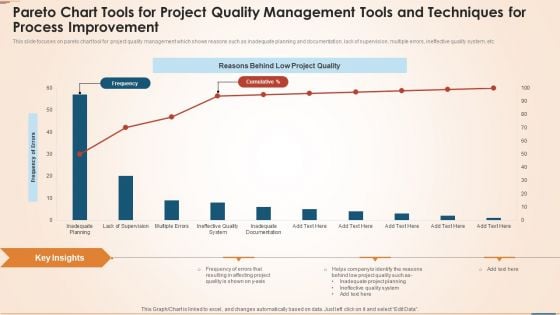
Pareto Chart Tools For Project Quality Management Tools And Techniques For Process Improvement Elements PDF
This slide focuses on pareto chart tool for project quality management which shows reasons such as inadequate planning and documentation, lack of supervision, multiple errors, ineffective quality system, etc. Pitch your topic with ease and precision using this pareto chart tools for project quality management tools and techniques for process improvement elements pdf. This layout presents information on frequency, reasons behind low project quality, frequency of errors, planning. It is also available for immediate download and adjustment. So, changes can be made in the color, design, graphics or any other component to create a unique layout.
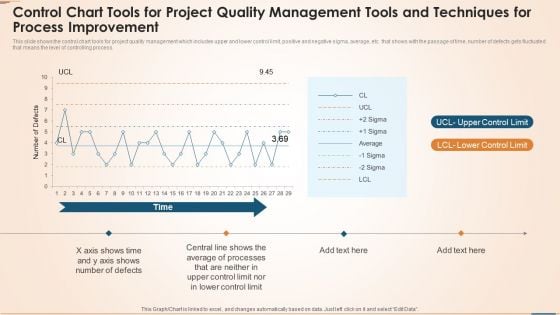
Control Chart Tools For Project Quality Management Tools And Techniques For Process Improvement Topics PDF
This slide shows the control chart tools for project quality management which includes upper and lower control limit, positive and negative sigma, average, etc. that shows with the passage of time, number of defects gets fluctuated that means the level of controlling process. Pitch your topic with ease and precision using this control chart tools for project quality management tools and techniques for process improvement topics pdf. This layout presents information on time, upper control limit, lower control limit. It is also available for immediate download and adjustment. So, changes can be made in the color, design, graphics or any other component to create a unique layout.
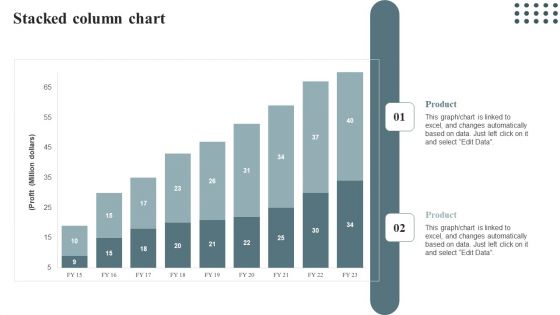
Stacked Column Chart Techniques For Enhancing Buyer Acquisition Approach Ideas PDF
Get a simple yet stunning designed Stacked Column Chart Techniques For Enhancing Buyer Acquisition Approach Ideas PDF. It is the best one to establish the tone in your meetings. It is an excellent way to make your presentations highly effective. So, download this PPT today from Slidegeeks and see the positive impacts. Our easy-to-edit Stacked Column Chart Techniques For Enhancing Buyer Acquisition Approach Ideas PDF can be your go-to option for all upcoming conferences and meetings. So, what are you waiting for Grab this template today.
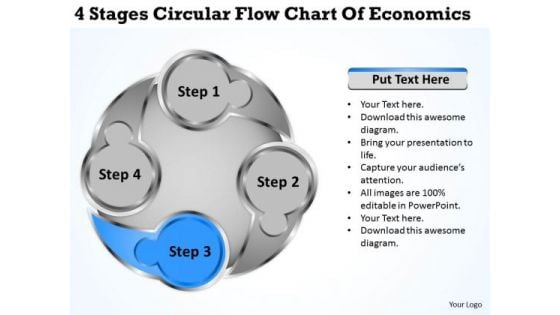
Circular Flow Chart Of Economics Business Plans For Small PowerPoint Templates
We present our circular flow chart of economics business plans for small PowerPoint templates.Use our Process and Flows PowerPoint Templates because Our PowerPoint Templates and Slides are specially created by a professional team with vast experience. They diligently strive to come up with the right vehicle for your brilliant Ideas. Download our Arrows PowerPoint Templates because Our PowerPoint Templates and Slides will give you great value for your money. Be assured of finding the best projection to highlight your words. Use our Circle Charts PowerPoint Templates because Our PowerPoint Templates and Slides are aesthetically designed to attract attention. We gaurantee that they will grab all the eyeballs you need. Download our Marketing PowerPoint Templates because Our PowerPoint Templates and Slides will provide you the cutting edge. Slice through the doubts in the minds of your listeners. Download and present our Shapes PowerPoint Templates because Our PowerPoint Templates and Slides has conjured up a web of all you need with the help of our great team. Use them to string together your glistening ideas.Use these PowerPoint slides for presentations relating to Action, stakeholders, tactics, model, tool, business, plan, concept, representation, diagram, guide, process, theory, personnel, management, learning,mba, manage, cycle, illustration, icon, strategy, clipart, guidelines, direction, design, organization, improve, implement, commerce, conceptual, improvement,heirarchy, analyze, resource, theoretical, measure, performance. The prominent colors used in the PowerPoint template are Blue, Gray, White. Take your thoughts to full bloom. Give them the manure of our Circular Flow Chart Of Economics Business Plans For Small PowerPoint Templates.
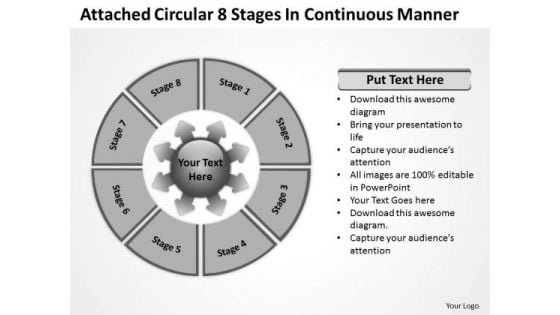
Circular 8 Stages In Continuous Manner Relative Cycle Arrow Chart PowerPoint Templates
We present our circular 8 stages in continuous manner Relative Cycle Arrow Chart PowerPoint templates.Download and present our Process and flows PowerPoint Templates because it helps to anticipate the doubts and questions in the minds of your colleagues and enlighten them with your inspired strategy to garner desired success. Download and present our Business PowerPoint Templates because the fruits of your labour are beginning to show.Enlighten them on the great plans you have for their enjoyment. Download and present our Marketing PowerPoint Templates because you can Highlight the key components of your entire manufacturing/ business process. Download our Flow charts PowerPoint Templates because they are Gauranteed to focus the minds of your team. Use our Arrows PowerPoint Templates because you understand the ailment and how to fight it.Use these PowerPoint slides for presentations relating to Circle, circular, circulation, clipart, colorful, connection, continuity, cut, cycle, cyclic, diagram, direction, empty, flow, graph, green, icon, illustration, isolated, loop, motion, pink, presentation, process, progress, reason, recycle, recycling, repetition, report, result, ring, rotation, round, scheme, section, step, sticker, symbol, arrows , flow charts. The prominent colors used in the PowerPoint template are Yellow, Black, White. People tell us our circular 8 stages in continuous manner Relative Cycle Arrow Chart PowerPoint templates are Spectacular. We assure you our continuity PowerPoint templates and PPT Slides are Tasteful. PowerPoint presentation experts tell us our circular 8 stages in continuous manner Relative Cycle Arrow Chart PowerPoint templates are Vintage. You can be sure our continuity PowerPoint templates and PPT Slides are aesthetically designed to attract attention. We guarantee that they will grab all the eyeballs you need. Professionals tell us our circular 8 stages in continuous manner Relative Cycle Arrow Chart PowerPoint templates are second to none. Use our cut PowerPoint templates and PPT Slides are Awesome. Our Circular 8 Stages In Continuous Manner Relative Cycle Arrow Chart PowerPoint Templates are fairly broadbased. They give you ample scope to address your mind.
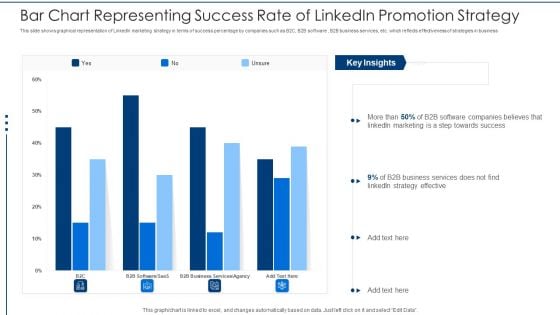
Bar Chart Representing Success Rate Of Linkedin Promotion Strategy Rules PDF
This slide shows graphical representation of LinkedIn marketing strategy in terms of success percentage by companies such as B2C, B2B software , B2B business services, etc. which reflects effectiveness of strategies in business Pitch your topic with ease and precision using this bar chart representing success rate of linkedin promotion strategy rules pdf. This layout presents information on bar chart representing success rate of linkedin promotion strategy. It is also available for immediate download and adjustment. So, changes can be made in the color, design, graphics or any other component to create a unique layout.

Coronavirus Disease 19 Contagiousness Comparison Chart Ppt PowerPoint Presentation Professional Background Designs PDF
Pitch your topic with ease and precision using this coronavirus disease 19 contagiousness comparison chart ppt powerpoint presentation professional background designs pdf. This layout presents information on x values seasonal norovirus case fatality rate. It is also available for immediate download and adjustment. So, changes can be made in the color, design, graphics or any other component to create a unique layout.
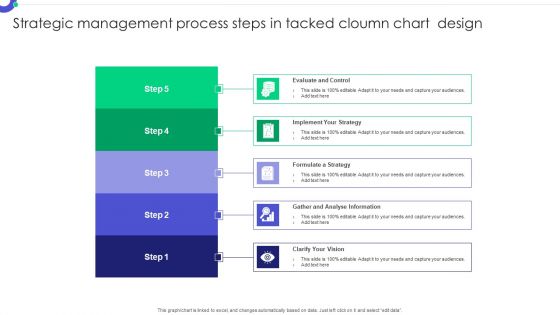
Strategic Management Process Steps In Tacked Cloumn Chart Design Pictures PDF
Pitch your topic with ease and precision using this Strategic Management Process Steps In Tacked Cloumn Chart Design Pictures PDF. This layout presents information on Evaluate Control, Implement Strategy, Formulate Strategy. It is also available for immediate download and adjustment. So, changes can be made in the color, design, graphics or any other component to create a unique layout.
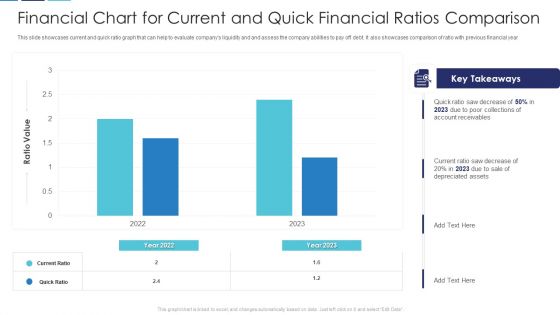
Financial Chart For Current And Quick Financial Ratios Comparison Brochure PDF
This slide showcases current and quick ratio graph that can help to evaluate companys liquidity and and assess the company abilities to pay off debt. It also showcases comparison of ratio with previous financial year Pitch your topic with ease and precision using this financial chart for current and quick financial ratios comparison brochure pdf. This layout presents information on financial chart for current and quick financial ratios comparison. It is also available for immediate download and adjustment. So, changes can be made in the color, design, graphics or any other component to create a unique layout.
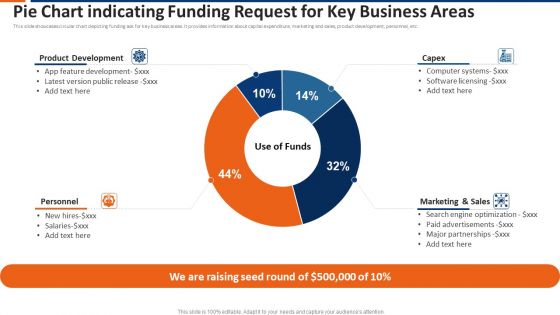
Pie Chart Indicating Funding Request For Key Business Areas Ppt Show Topics PDF
This slide showcases circular chart depicting funding ask for key business areas. It provides information about capital expenditure, marketing and sales, product development, personnel, etc. Pitch your topic with ease and precision using this pie chart indicating funding request for key business areas ppt show topics pdf. This layout presents information on product development, capex, marketing and sales, personnel. It is also available for immediate download and adjustment. So, changes can be made in the color, design, graphics or any other component to create a unique layout.
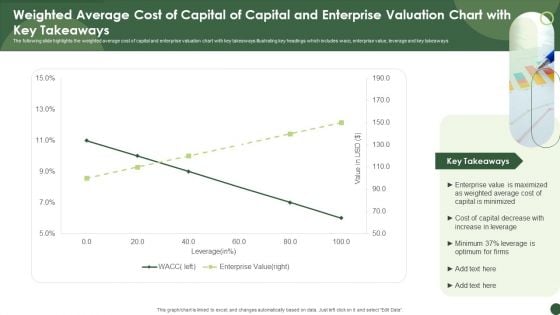
Weighted Average Cost Of Capital Of Capital And Enterprise Valuation Chart With Key Takeaways Inspiration PDF
The following slide highlights the weighted average cost of capital and enterprise valuation chart with key takeaways illustrating key headings which includes wacc, enterprise value, leverage and key takeaways. Pitch your topic with ease and precision using this Weighted Average Cost Of Capital Of Capital And Enterprise Valuation Chart With Key Takeaways Inspiration PDF. This layout presents information on Enterprise Value, Weighted Average, Capital Is Minimized. It is also available for immediate download and adjustment. So, changes can be made in the color, design, graphics or any other component to create a unique layout.
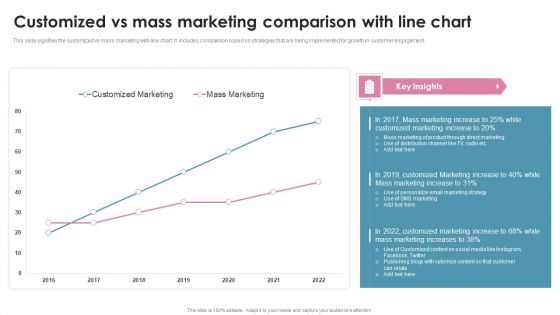
Customized Vs Mass Marketing Comparison With Line Chart Ppt PowerPoint Presentation File Ideas PDF
This slide signifies the customized vs mass marketing with line chart. It includes comparison based on strategies that are being implemented for growth in customer engagement. Pitch your topic with ease and precision using this Customized Vs Mass Marketing Comparison With Line Chart Ppt PowerPoint Presentation File Ideas PDF. This layout presents information on Customized Marketing, Mass Marketing, 2016 To 2022. It is also available for immediate download and adjustment. So, changes can be made in the color, design, graphics or any other component to create a unique layout.
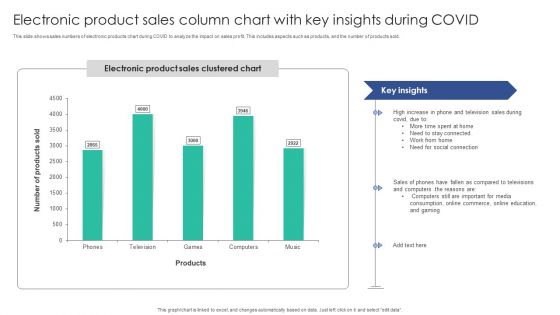
Electronic Product Sales Column Chart With Key Insights During COVID Microsoft PDF
This slide shows sales numbers of electronic products chart during COVID to analyze the impact on sales profit. This includes aspects such as products, and the number of products sold. Pitch your topic with ease and precision using this Electronic Product Sales Column Chart With Key Insights During COVID Microsoft PDF. This layout presents information on Stay Connected, Social Connection, Compared Televisions. It is also available for immediate download and adjustment. So, changes can be made in the color, design, graphics or any other component to create a unique layout.
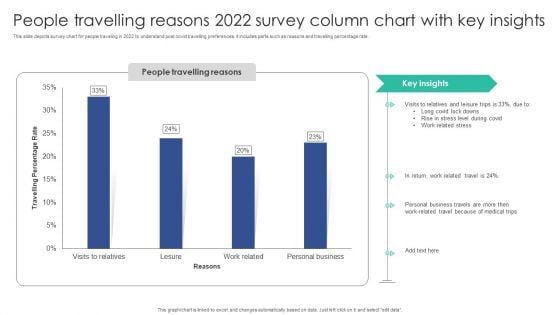
People Travelling Reasons 2022 Survey Column Chart With Key Insights Sample PDF
This slide depicts survey chart for people traveling in 2022 to understand post covid travelling preferences. It includes parts such as reasons and travelling percentage rate.Pitch your topic with ease and precision using this People Travelling Reasons 2022 Survey Column Chart With Key Insights Sample PDF. This layout presents information on Visits Relatives, Leisure Trips, Personal Business. It is also available for immediate download and adjustment. So, changes can be made in the color, design, graphics or any other component to create a unique layout.
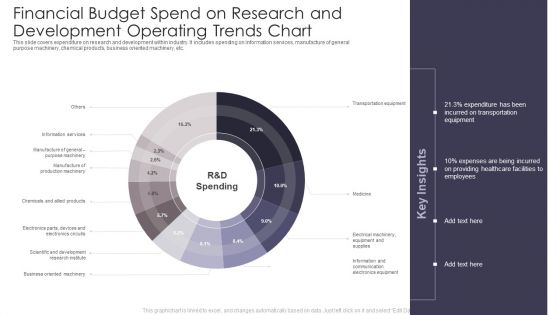
Financial Budget Spend On Research And Development Operating Trends Chart Professional PDF
This slide covers expenditure on research and development within industry. It includes spending on information services, manufacture of general purpose machinery, chemical products, business oriented machinery, etc. Pitch your topic with ease and precision using this Financial Budget Spend On Research And Development Operating Trends Chart Professional PDF. This layout presents information on Transportation Equipment, Healthcare Facilities, Trends Chart. It is also available for immediate download and adjustment. So, changes can be made in the color, design, graphics or any other component to create a unique layout.
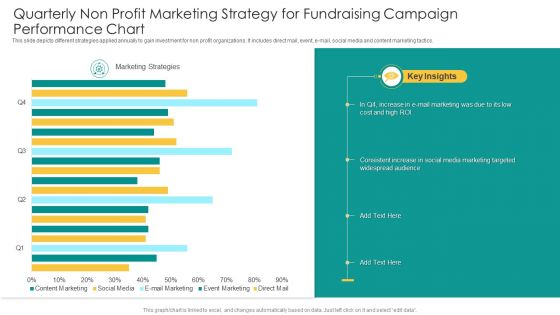
Quarterly Non Profit Marketing Strategy For Fundraising Campaign Performance Chart Diagrams PDF
This slide depicts different strategies applied annually to gain investment for non profit organizations. It includes direct mail, event, e-mail, social media and content marketing tactics. Pitch your topic with ease and precision using this Quarterly Non Profit Marketing Strategy For Fundraising Campaign Performance Chart Diagrams PDF. This layout presents information on Marketing Strategies, Event Marketing, Social Media. It is also available for immediate download and adjustment. So, changes can be made in the color, design, graphics or any other component to create a unique layout.
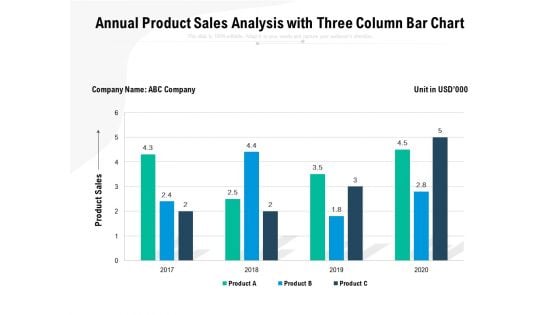
Annual Product Sales Analysis With Three Column Bar Chart Ppt PowerPoint Presentation Inspiration Layouts PDF
Pitch your topic with ease and precision using this annual product sales analysis with three column bar chart ppt powerpoint presentation inspiration layouts pdf. This layout presents information on product sales, 2017 to 2020. It is also available for immediate download and adjustment. So, changes can be made in the color, design, graphics or any other component to create a unique layout.
Budget Pie Chart Illustrating Promotional Costs Ppt PowerPoint Presentation Infographic Template Icon PDF
Pitch your topic with ease and precision using this budget pie chart illustrating promotional costs ppt powerpoint presentation infographic template icon pdf. This layout presents information on total budget allocated, online advertising, promotional items. It is also available for immediate download and adjustment. So, changes can be made in the color, design, graphics or any other component to create a unique layout.
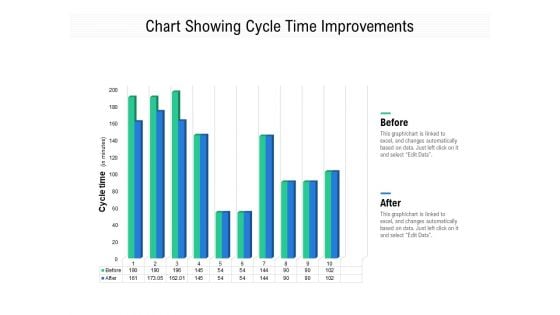
Chart Showing Cycle Time Improvements Ppt PowerPoint Presentation Infographic Template Rules PDF
Pitch your topic with ease and precision using this chart showing cycle time improvements ppt powerpoint presentation infographic template rules pdf. This layout presents information on before, after. It is also available for immediate download and adjustment. So, changes can be made in the color, design, graphics or any other component to create a unique layout.
Workforce Planning Pie Chart Showing Personnel Education And Department Ppt PowerPoint Presentation Icon Gallery PDF
Pitch your topic with ease and precision using this workforce planning pie chart showing personnel education and department ppt powerpoint presentation icon gallery pdf. This layout presents information on gender, department, education, management, department, marketing, accounts. It is also available for immediate download and adjustment. So, changes can be made in the color, design, graphics or any other component to create a unique layout.
Vendor Analysis Chart Based On Quality Features Ppt PowerPoint Presentation Icon Smartart
Pitch your topic with ease and precision using this vendor analysis chart based on quality features ppt powerpoint presentation icon smartart. This layout presents information on average, customer service, ontime delivery, service quality, product quality. It is also available for immediate download and adjustment. So, changes can be made in the color, design, graphics or any other component to create a unique layout.
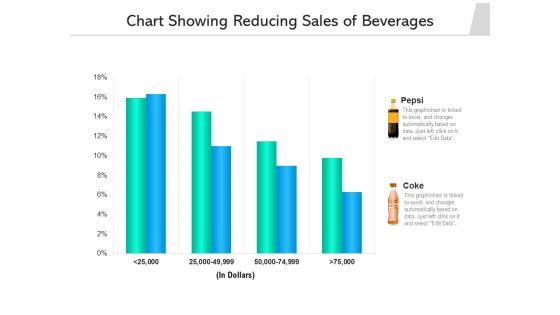
Chart Showing Reducing Sales Of Beverages Ppt PowerPoint Presentation Gallery Slide Portrait PDF
Pitch your topic with ease and precision using this chart showing reducing sales of beverages ppt powerpoint presentation gallery slide portrait pdf. This layout presents information on pepsi, coke. It is also available for immediate download and adjustment. So, changes can be made in the color, design, graphics or any other component to create a unique layout.
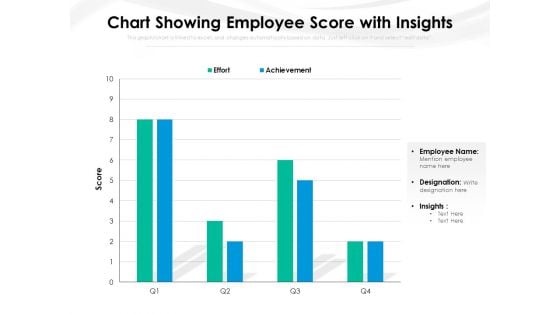
Chart Showing Employee Score With Insights Ppt PowerPoint Presentation Slides Influencers PDF
Pitch your topic with ease and precision using this chart showing employee score with insights ppt powerpoint presentation slides influencers pdf. This layout presents information on employee, effort, achievement, score. It is also available for immediate download and adjustment. So, changes can be made in the color, design, graphics or any other component to create a unique layout.
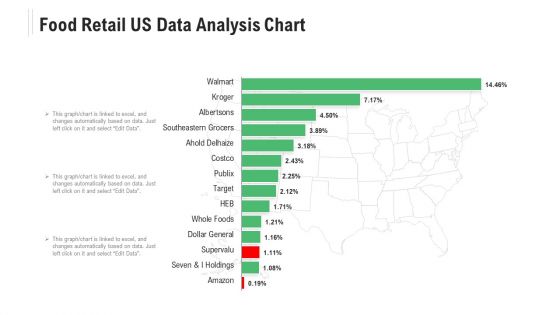
Food Retail US Data Analysis Chart Ppt Powerpoint Presentation Ideas Microsoft Pdf
Pitch your topic with ease and precision using this food retail us data analysis chart ppt powerpoint presentation ideas microsoft pdf. This layout presents information on seven and i holdings, amazon, southeastern grocers, albertsons, target. It is also available for immediate download and adjustment. So, changes can be made in the color, design, graphics or any other component to create a unique layout.


 Continue with Email

 Home
Home


