Histogram
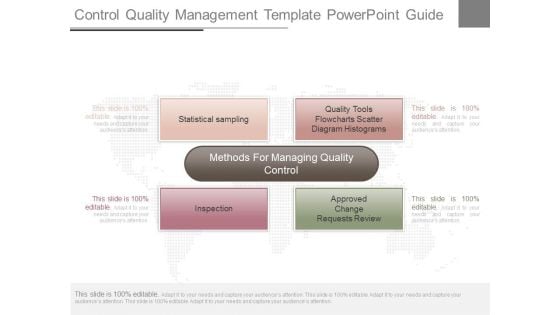
Control Quality Management Template Powerpoint Guide
This is a control quality management template powerpoint guide. This is a four stage process. The stages in this process are methods for managing quality control, statistical sampling, quality tools flowcharts scatter diagram histograms, inspection, approved change requests review.
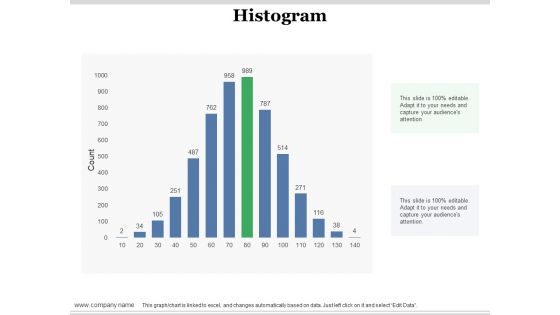
Histogram Ppt PowerPoint Presentation Gallery Objects
This is a histogram ppt powerpoint presentation gallery objects. This is a one stage process. The stages in this process are histogram, finance, business, marketing, management.

Evolution Histogram Ppt PowerPoint Presentation Complete Deck With Slides
This is a evolution histogram ppt powerpoint presentation complete deck with slides. This is a one stage process. The stages in this process are evolution histogram, business, management, strategy, marketing.
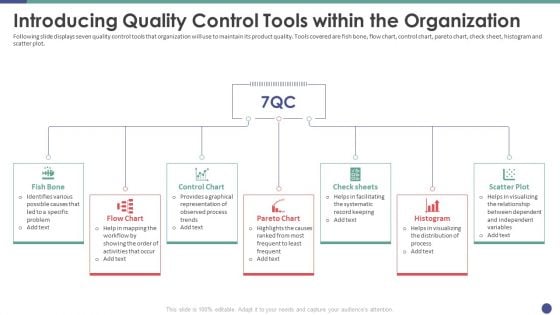
QC Engineering Introducing Quality Control Tools Within The Organization Ppt Infographic Template Design Templates PDF
Following slide displays seven quality control tools that organization will use to maintain its product quality. Tools covered are fish bone, flow chart, control chart, pareto chart, check sheet, histogram and scatter plot. Presenting qc engineering introducing quality control tools within the organization ppt infographic template design templates pdf to provide visual cues and insights. Share and navigate important information on seven stages that need your due attention. This template can be used to pitch topics like fish bone, flow chart, control chart, pareto chart, check sheets. In addtion, this PPT design contains high resolution images, graphics, etc, that are easily editable and available for immediate download.
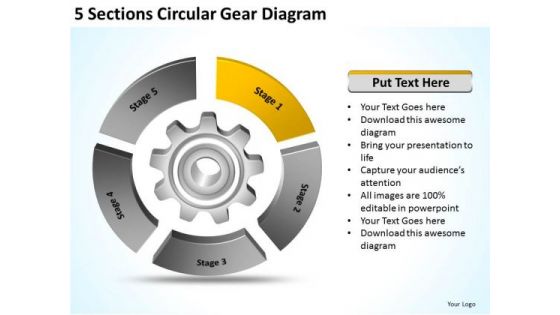
5 Sections Circular Gear Diagram How To Do Business Plan PowerPoint Templates
We present our 5 sections circular gear diagram how to do business plan PowerPoint templates.Use our Industrial PowerPoint Templates because Our PowerPoint Templates and Slides are created by a hardworking bunch of busybees. Always flitting around with solutions gauranteed to please. Use our Communication PowerPoint Templates because our PowerPoint Templates and Slides are the string of your bow. Fire of your ideas and conquer the podium. Use our Business PowerPoint Templates because Our PowerPoint Templates and Slides will generate and maintain the level of interest you desire. They will create the impression you want to imprint on your audience. Download our Gear Wheels PowerPoint Templates because Our PowerPoint Templates and Slides will let you Hit the right notes. Watch your audience start singing to your tune. Present our Circle Charts PowerPoint Templates because Our PowerPoint Templates and Slides will Activate the energies of your audience. Get their creative juices flowing with your words.Use these PowerPoint slides for presentations relating to Gear, vector, chart, isolated, model, step, layout, bar, business, concept, rotation, template, diagram, circle, shapes, ring, graphic, process, level, idea, graph, cycle, circulation, illustration, circular, round, segments, design, clip, motion, empty, procedure, art, progress, information, point, infographics. The prominent colors used in the PowerPoint template are Yellow, Black, Gray. Be a fighter with our 5 Sections Circular Gear Diagram How To Do Business Plan PowerPoint Templates. You will come out on top.
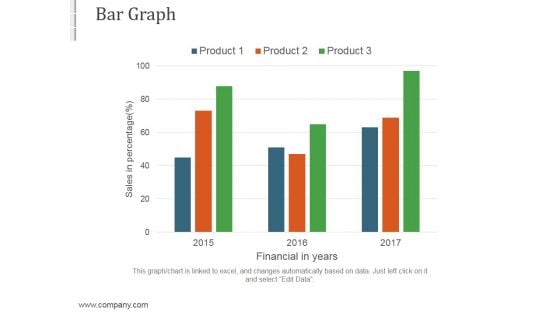
Bar Graph Ppt PowerPoint Presentation Themes
This is a bar graph ppt powerpoint presentation themes. This is a three stage process. The stages in this process are business, marketing, strategy, success, management.
Histogram Ppt PowerPoint Presentation Icon Images
This is a histogram ppt powerpoint presentation icon images. This is a one stage process. The stages in this process are product, percentage, marketing, business.
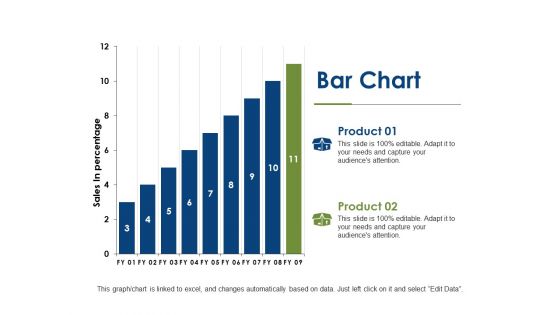
Bar Chart Growth Ppt PowerPoint Presentation Gallery Graphics
This is a bar chart growth ppt powerpoint presentation gallery graphics. This is a two stage process. The stages in this process are analysis, business, finance, investment, strategy.
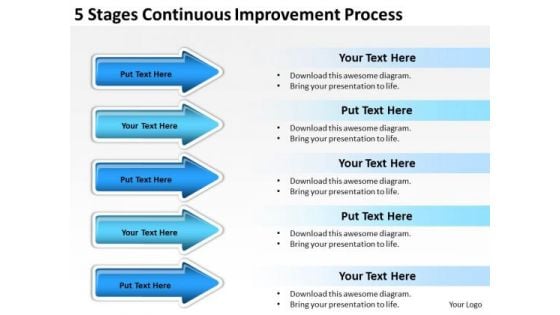
Parallel Processing Continuous Improvement PowerPoint Templates Ppt Backgrounds For Slides
We present our parallel processing continuous improvement PowerPoint templates PPT backgrounds for slides.Use our Marketing PowerPoint Templates because Our PowerPoint Templates and Slides will provide the perfect balance. Your weighty ideas will get the ideal impetus. Use our Arrows PowerPoint Templates because Our PowerPoint Templates and Slides will give good value for money. They also have respect for the value of your time. Download and present our Business PowerPoint Templates because It will Raise the bar of your Thoughts. They are programmed to take you to the next level. Download and present our Process and Flows PowerPoint Templates because Our PowerPoint Templates and Slides will provide you the cutting edge. Slice through the doubts in the minds of your listeners. Use our Shapes PowerPoint Templates because our PowerPoint Templates and Slides will give your ideas the shape.Use these PowerPoint slides for presentations relating to Arrow, Banner, Bar, Collection, Completion, Concept, Confirmation, Design, Flow, Graph, Graphic, Illustration, Indication, Information, Instruction, Interface, Internet, Layout, Measurement, Modern, Number, Order, Phase, Pointer, Process, Progress, Reflection, Scale, Shape, Stage, Status, Step, Template, Two, Vector, Web, Web . The prominent colors used in the PowerPoint template are Blue navy, Blue, White. Customers tell us our parallel processing continuous improvement PowerPoint templates PPT backgrounds for slides will make the presenter successul in his career/life. We assure you our Bar PowerPoint templates and PPT Slides are topically designed to provide an attractive backdrop to any subject. Use our parallel processing continuous improvement PowerPoint templates PPT backgrounds for slides are effectively colour coded to prioritise your plans They automatically highlight the sequence of events you desire. You can be sure our Design PowerPoint templates and PPT Slides are specially created by a professional team with vast experience. They diligently strive to come up with the right vehicle for your brilliant Ideas. PowerPoint presentation experts tell us our parallel processing continuous improvement PowerPoint templates PPT backgrounds for slides are readymade to fit into any presentation structure. The feedback we get is that our Flow PowerPoint templates and PPT Slides are visually appealing. Display executive leadership with our Parallel Processing Continuous Improvement PowerPoint Templates Ppt Backgrounds For Slides. They will make you look good.
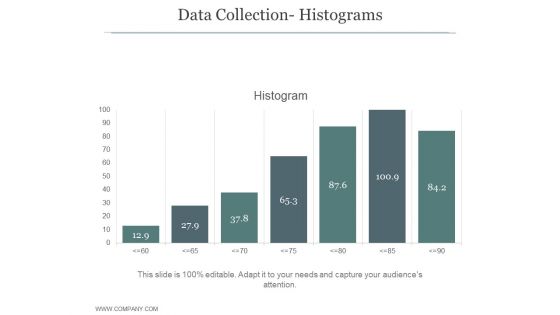
Data Collection Histograms Ppt PowerPoint Presentation Diagrams
This is a data collection histograms ppt powerpoint presentation diagrams. This is a seven stage process. The stages in this process are business, strategy, growth strategy, marketing, histogram, finance.
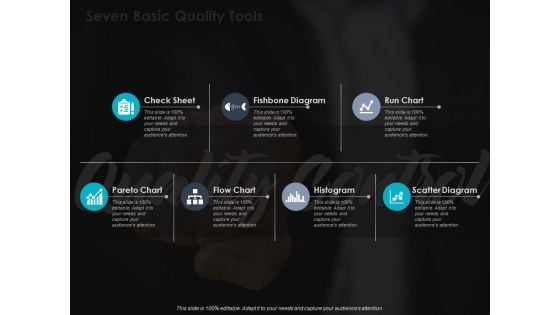
Seven Basic Quality Tools Ppt PowerPoint Presentation Layouts Example File
This is a seven basic quality tools ppt powerpoint presentation layouts example file. This is a seven stage process. The stages in this process are Check Sheet, Fishbone Diagram, Histogram, Run Chart.
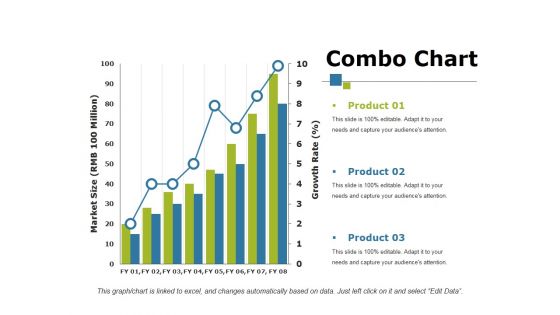
Combo Chart Ppt PowerPoint Presentation Show Influencers
This is a combo chart ppt powerpoint presentation show influencers. This is a three stage process. The stages in this process are product, bar graph, growth, growth rate, market size.

Successful Bar Graph Shows Business Profits PowerPoint Templates Ppt Backgrounds For Slides 0713
Give power to your elbow with our Successful Bar Graph Shows Business Profits PowerPoint Templates PPT Backgrounds For Slides. Get that extra information you need. Put them on the same page with our business PowerPoint Templates. Your team will sing from the same sheet. Push the envelop with our success PowerPoint Templates. Let your thoughts rise above the norm. Give them a big deal with our Successful Bar Graph Shows Business Profits PowerPoint Templates Ppt Backgrounds For Slides 0713. The audience will be unabashedly appreciative.
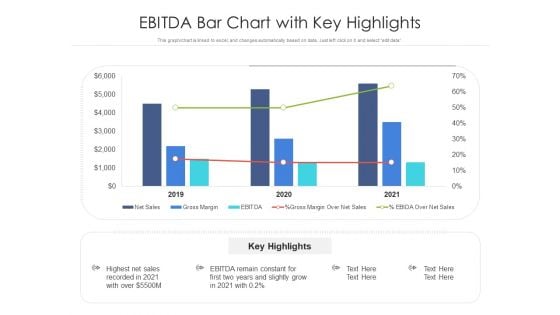
Ebitda Bar Chart With Key Highlights Ppt PowerPoint Presentation Gallery Layout PDF
Showcasing this set of slides titled ebitda bar chart with key highlights ppt powerpoint presentation gallery layout pdf. The topics addressed in these templates are ebitda bar chart with key highlights. All the content presented in this PPT design is completely editable. Download it and make adjustments in color, background, font etc. as per your unique business setting.
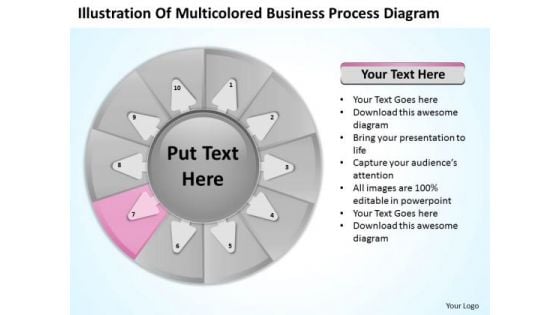
Business PowerPoint Templates Process Diagram 10 Stages Planning Slides
We present our business powerpoint templates process diagram 10 stages planning Slides.Download and present our Marketing PowerPoint Templates because Our PowerPoint Templates and Slides are effectively colour coded to prioritise your plans They automatically highlight the sequence of events you desire. Present our Computer PowerPoint Templates because Our PowerPoint Templates and Slides are the chords of your song. String them along and provide the lilt to your views. Download and present our Arrows PowerPoint Templates because It will Raise the bar of your Thoughts. They are programmed to take you to the next level. Use our Circle Charts PowerPoint Templates because Our PowerPoint Templates and Slides offer you the widest possible range of options. Download and present our Business PowerPoint Templates because You can Be the puppeteer with our PowerPoint Templates and Slides as your strings. Lead your team through the steps of your script.Use these PowerPoint slides for presentations relating to Process, integration, testing, strategic, model, business, implementation, flow, business, plan, engineering, arrow, rotation, recycling, infrastructure, recycle, data, schedule, analysis, rotate, marketing, development, gear, team, management, computing, strategy, project, iterative, assurance, maturity, design, maintenance, quality, control, improvement, database, software, analise. The prominent colors used in the PowerPoint template are Pink, Gray, White. Enter any situation with our Business PowerPoint Templates Process Diagram 10 Stages Planning Slides. They will be game for it all.
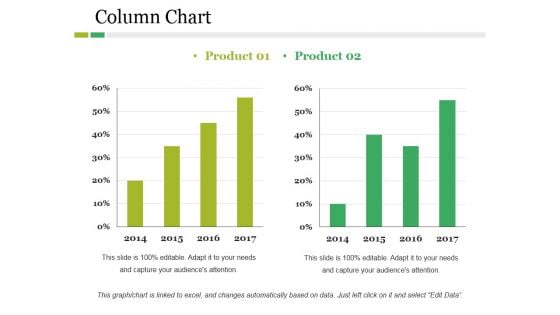
Column Chart Ppt PowerPoint Presentation Layouts Graphics Example
This is a column chart ppt powerpoint presentation layouts graphics example. This is a two stage process. The stages in this process are product, year, bar graph, business, finance.
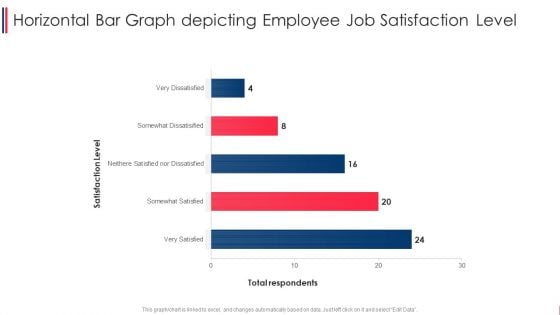
Horizontal Bar Graph Depicting Employee Job Satisfaction Level Summary PDF
Pitch your topic with ease and precision using this horizontal bar graph depicting employee job satisfaction level summary pdf. This layout presents information on horizontal bar graph depicting employee job satisfaction level. It is also available for immediate download and adjustment. So, changes can be made in the color, design, graphics or any other component to create a unique layout.
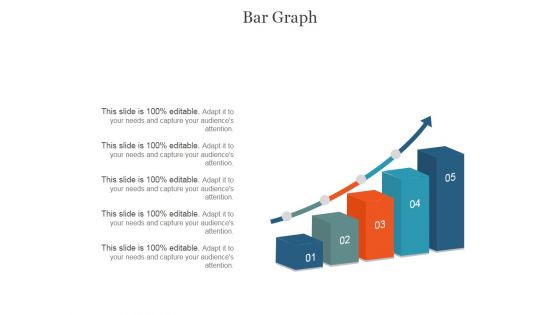
Bar Graph Ppt PowerPoint Presentation Infographics
This is a bar graph ppt powerpoint presentation infographics. This is a five stage process. The stages in this process are business, management, marketing, bar graph, analysis.
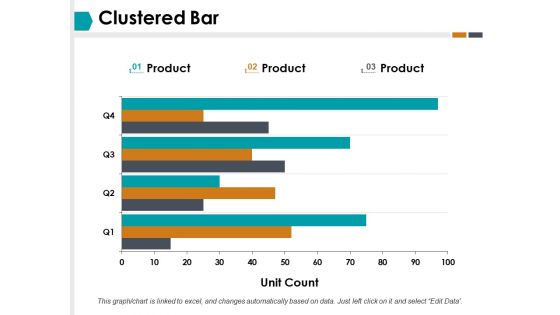
Clustered Bar Finance Ppt PowerPoint Presentation Infographics Graphics Template
This is a clustered bar finance ppt powerpoint presentation infographics graphics template. This is a three stage process. The stages in this process are clustered bar, finance, business, investment, marketing.
Sample Histogram Assessment For Project Executing Quality Ppt Example PM SS V
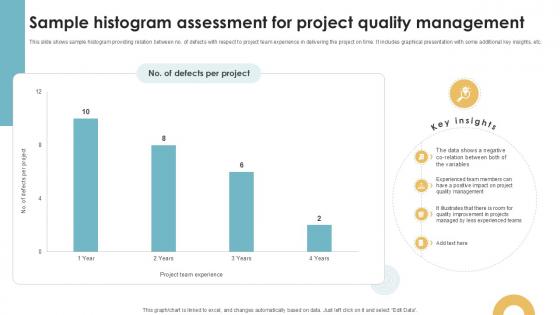
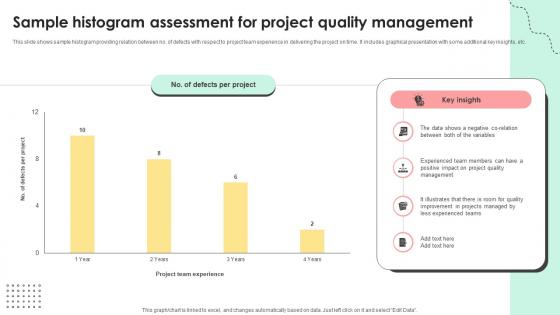
This slide shows sample histogram providing relation between no. of defects with respect to project team experience in delivering the project on time. It includes graphical presentation with some additional key insights, etc. Whether you have daily or monthly meetings, a brilliant presentation is necessary. Sample Histogram Assessment For Project Executing Quality Ppt Example PM SS V can be your best option for delivering a presentation. Represent everything in detail using Sample Histogram Assessment For Project Executing Quality Ppt Example PM SS V and make yourself stand out in meetings. The template is versatile and follows a structure that will cater to your requirements. All the templates prepared by Slidegeeks are easy to download and edit. Our research experts have taken care of the corporate themes as well. So, give it a try and see the results. This slide shows sample histogram providing relation between no. of defects with respect to project team experience in delivering the project on time. It includes graphical presentation with some additional key insights, etc.
Bar Diagram Ppt PowerPoint Presentation Gallery Structure
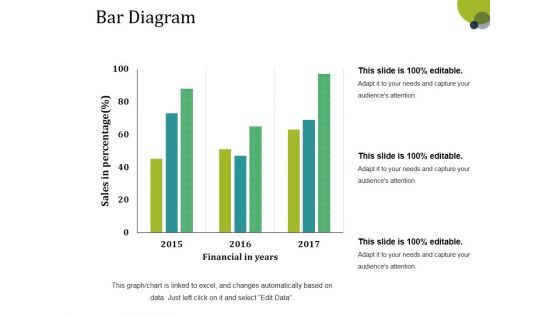
This is a bar diagram ppt powerpoint presentation gallery structure. This is a three stage process. The stages in this process are financial in years, sales in percentage, bar graph, growth, success.
Lead Scoring Template Ppt PowerPoint Presentation Model
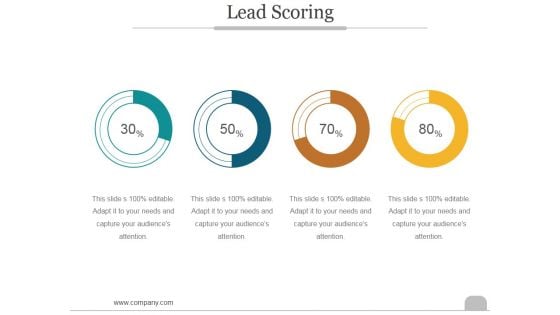
This is a lead scoring template ppt powerpoint presentation model. This is a four stage process. The stages in this process are business, marketing, success, bar graph, lead scoring.

Business People Clipart 3d Man Working On Laptop PowerPoint Templates
We present our business people clipart 3d man working on laptop PowerPoint templates.Download our Business PowerPoint Templates because Our PowerPoint Templates and Slides will let you meet your Deadlines. Present our People PowerPoint Templates because It will mark the footprints of your journey. Illustrate how they will lead you to your desired destination. Use our Computer PowerPoint Templates because Our PowerPoint Templates and Slides provide you with a vast range of viable options. Select the appropriate ones and just fill in your text. Use our Technology PowerPoint Templates because You aspire to touch the sky with glory. Let our PowerPoint Templates and Slides provide the fuel for your ascent. Download and present our Success PowerPoint Templates because Our PowerPoint Templates and Slides will Activate the energies of your audience. Get their creative juices flowing with your words.Use these PowerPoint slides for presentations relating to 3d, bars, business, businessman, character, communication, computer, concept, conceptual, design, device, digital, display, electronic, graph, growth, idea, illustration, internet, laptop, man, mobile, monitor, notebook, one, pad, pc, people, person, portable, presentation, render, screen, sign, symbol, tablet, technology, white, work, worker. The prominent colors used in the PowerPoint template are Red, Gray, Black. Presenters tell us our business people clipart 3d man working on laptop PowerPoint templates are the best it can get when it comes to presenting. Customers tell us our computer PowerPoint templates and PPT Slides are aesthetically designed to attract attention. We guarantee that they will grab all the eyeballs you need. Presenters tell us our business people clipart 3d man working on laptop PowerPoint templates are designed to make your presentations professional. We assure you our business PowerPoint templates and PPT Slides are readymade to fit into any presentation structure. The feedback we get is that our business people clipart 3d man working on laptop PowerPoint templates are second to none. The feedback we get is that our businessman PowerPoint templates and PPT Slides will make you look like a winner. Have a great ride at a low fare. Coast along on our PT&s.
Quality Control Plan Seven Basic Quality Control Tools Brochure PDF
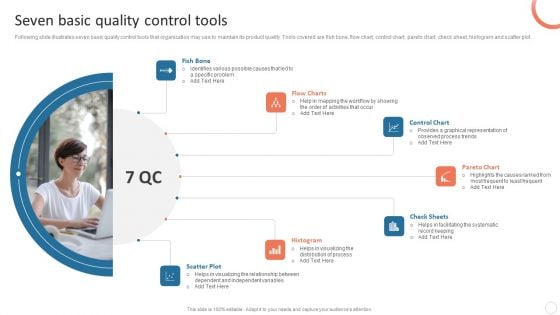
Following slide illustrates seven basic quality control tools that organization may use to maintain its product quality. Tools covered are fish bone, flow chart, control chart, pareto chart, check sheet, histogram and scatter plot. Coming up with a presentation necessitates that the majority of the effort goes into the content and the message you intend to convey. The visuals of a PowerPoint presentation can only be effective if it supplements and supports the story that is being told. Keeping this in mind our experts created Quality Control Plan Seven Basic Quality Control Tools Brochure PDF to reduce the time that goes into designing the presentation. This way, you can concentrate on the message while our designers take care of providing you with the right template for the situation.
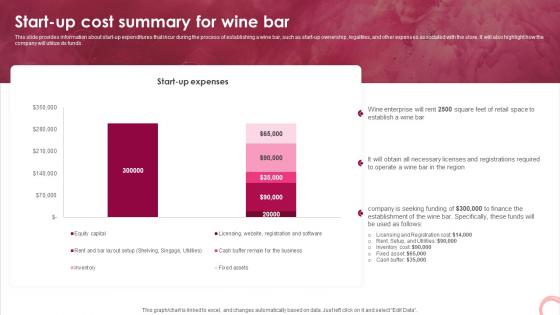
Wine Lounge Business Plan Start Up Cost Summary For Wine Bar BP SS V
This slide provides information about start-up expenditures that incur during the process of establishing a wine bar, such as start-up ownership, legalities, and other expenses associated with the store. It will also highlight how the company will utilize its funds. Take your projects to the next level with our ultimate collection of Wine Lounge Business Plan Start Up Cost Summary For Wine Bar BP SS V. Slidegeeks has designed a range of layouts that are perfect for representing task or activity duration, keeping track of all your deadlines at a glance. Tailor these designs to your exact needs and give them a truly corporate look with your own brand colors they will make your projects stand out from the rest This slide provides information about start-up expenditures that incur during the process of establishing a wine bar, such as start-up ownership, legalities, and other expenses associated with the store. It will also highlight how the company will utilize its funds.
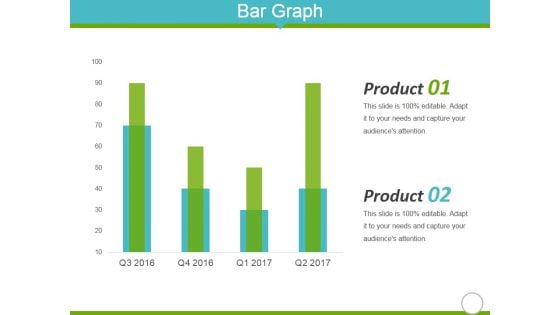
Bar Graph Ppt Powerpoint Presentation Outline Shapes
This is a bar graph ppt powerpoint presentation outline shapes. This is a four stage process. The stages in this process are product, graph, finance, marketing, business.
Histogram Ideas In Powerpoint And Google Slides Cpb
Presenting our innovatively designed set of slides titled Histogram Ideas In Powerpoint And Google Slides Cpb. This completely editable PowerPoint graphic exhibits Histogram Ideas that will help you convey the message impactfully. It can be accessed with Google Slides and is available in both standard screen and widescreen aspect ratios. Apart from this, you can download this well structured PowerPoint template design in different formats like PDF, JPG, and PNG. So, click the download button now to gain full access to this PPT design. Our Histogram Ideas In Powerpoint And Google Slides Cpb are topically designed to provide an attractive backdrop to any subject. Use them to look like a presentation pro.

Thank You Evolution Histogram Ppt PowerPoint Presentation Gallery Pictures
This is a thank you evolution histogram ppt powerpoint presentation gallery pictures. This is a one stage process. The stages in this process are thank you.
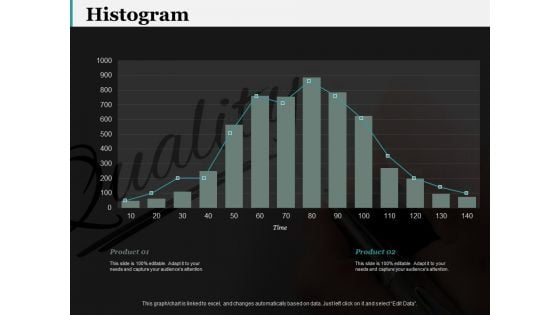
Histogram 7 QC Tools Ppt PowerPoint Presentation Gallery Layout
This is a histogram 7 qc tools ppt powerpoint presentation gallery layout. This is a two stage process. The stages in this process are business, finance, marketing, strategy, analysis.
Administering Quality Assurance Introduction Of Histogram With Project Use Cases PM SS V
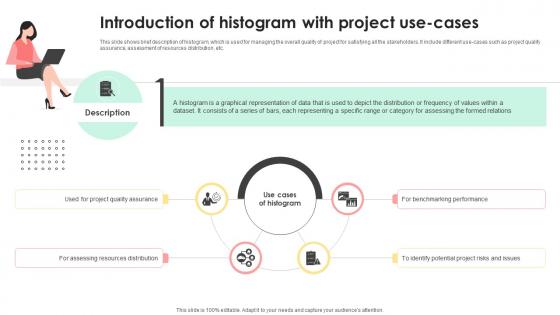
This slide shows brief description of histogram, which is used for managing the overall quality of project for satisfying all the stakeholders. It include different use-cases such as project quality assurance, assessment of resources distribution, etc. This modern and well-arranged Administering Quality Assurance Introduction Of Histogram With Project Use Cases PM SS V provides lots of creative possibilities. It is very simple to customize and edit with the Powerpoint Software. Just drag and drop your pictures into the shapes. All facets of this template can be edited with Powerpoint, no extra software is necessary. Add your own material, put your images in the places assigned for them, adjust the colors, and then you can show your slides to the world, with an animated slide included. This slide shows brief description of histogram, which is used for managing the overall quality of project for satisfying all the stakeholders. It include different use-cases such as project quality assurance, assessment of resources distribution, etc.
Administering Quality Assurance Sample Histogram Assessment For Project Quality Management PM SS V
This slide shows sample histogram providing relation between no. of defects with respect to project team experience in delivering the project on time. It includes graphical presentation with some additional key insights, etc. Present like a pro with Administering Quality Assurance Sample Histogram Assessment For Project Quality Management PM SS V. Create beautiful presentations together with your team, using our easy-to-use presentation slides. Share your ideas in real-time and make changes on the fly by downloading our templates. So whether you are in the office, on the go, or in a remote location, you can stay in sync with your team and present your ideas with confidence. With Slidegeeks presentation got a whole lot easier. Grab these presentations today. This slide shows sample histogram providing relation between no. of defects with respect to project team experience in delivering the project on time. It includes graphical presentation with some additional key insights, etc.
Introduction Of Histogram With Project Use Executing Quality Ppt Template PM SS V
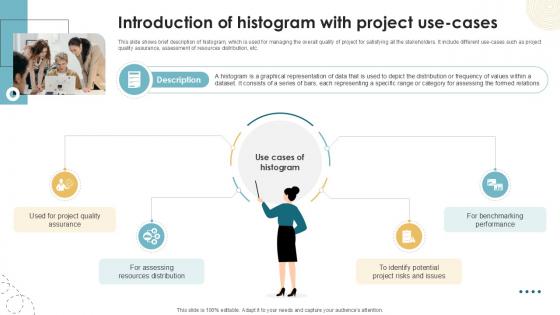
This slide shows brief description of histogram, which is used for managing the overall quality of project for satisfying all the stakeholders. It include different use cases such as project quality assurance, assessment of resources distribution, etc. Explore a selection of the finest Introduction Of Histogram With Project Use Executing Quality Ppt Template PM SS V here. With a plethora of professionally designed and pre-made slide templates, you can quickly and easily find the right one for your upcoming presentation. You can use our Introduction Of Histogram With Project Use Executing Quality Ppt Template PM SS V to effectively convey your message to a wider audience. Slidegeeks has done a lot of research before preparing these presentation templates. The content can be personalized and the slides are highly editable. Grab templates today from Slidegeeks. This slide shows brief description of histogram, which is used for managing the overall quality of project for satisfying all the stakeholders. It include different use cases such as project quality assurance, assessment of resources distribution, etc.
Collection Of Quality Assurance PPT Histogram Highlighting Frequency Of Quality Defects Slides PDF
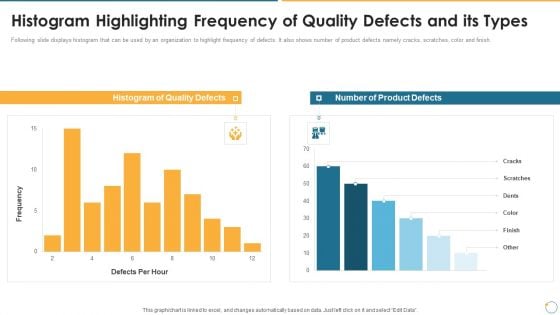
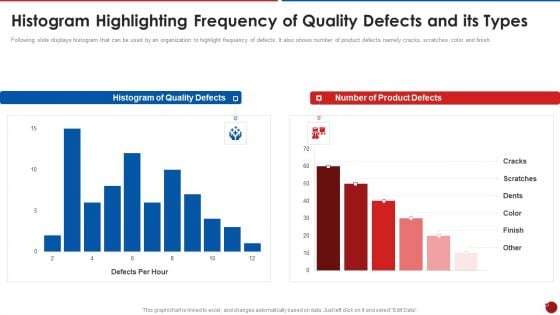
Following slide displays histogram that can be used by an organization to highlight frequency of defects. It also shows number of product defects namely cracks, scratches, color and finish. Deliver an awe inspiring pitch with this creative collection of quality assurance ppt histogram highlighting frequency of quality defects slides pdf bundle. Topics like histogram highlighting frequency of quality defects and its types can be discussed with this completely editable template. It is available for immediate download depending on the needs and requirements of the user.
Quality Assurance Templates Set 2 Histogram Highlighting Frequency Of Quality Defects And Its Types Professional PDF
Following slide displays histogram that can be used by an organization to highlight frequency of defects. It also shows number of product defects namely cracks, scratches, color and finish. Deliver an awe inspiring pitch with this creative quality assurance templates set 2 histogram highlighting frequency of quality defects and its types professional pdf bundle. Topics like histogram of quality defects, number of product defects can be discussed with this completely editable template. It is available for immediate download depending on the needs and requirements of the user.
QA Plan Set 2 Histogram Highlighting Frequency Of Quality Defects And Its Types Template PDF
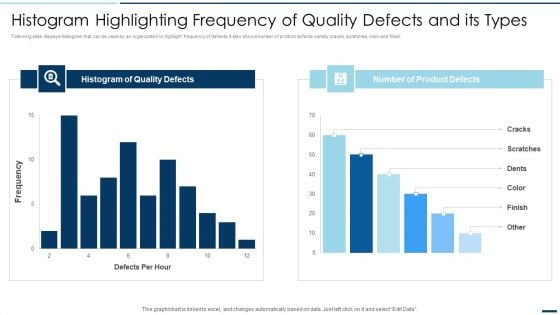
Following slide displays histogram that can be used by an organization to highlight frequency of defects. It also shows number of product defects namely cracks, scratches, color and finish. Deliver an awe inspiring pitch with this creative QA Plan Set 2 Histogram Highlighting Frequency Of Quality Defects And Its Types Template PDF bundle. Topics like Histogram Quality Defects, Number Product Defects can be discussed with this completely editable template. It is available for immediate download depending on the needs and requirements of the user.
Histogram Column Chart With Red Arrow Vector Icon Ppt PowerPoint Presentation Outline Ideas Cpb
This is a histogram column chart with red arrow vector icon ppt powerpoint presentation outline ideas cpb. This is a three stage process. The stages in this process are bar chart icon, bar graph icon, data chart icon.
Histogram Financial Analysis Vector Icon Ppt PowerPoint Presentation Layouts File Formats Cpb
This is a histogram financial analysis vector icon ppt powerpoint presentation layouts file formats cpb. This is a three stage process. The stages in this process are bar chart icon, bar graph icon, data chart icon.
Histogram Icon Showing Economic Fluctuations Ppt PowerPoint Presentation Slides Samples Cpb
This is a histogram icon showing economic fluctuations ppt powerpoint presentation slides samples cpb. This is a three stage process. The stages in this process are bar chart icon, bar graph icon, data chart icon.
Histogram Showing Business Trends Vector Icon Ppt PowerPoint Presentation Styles Portrait Cpb
This is a histogram showing business trends vector icon ppt powerpoint presentation styles portrait cpb. This is a three stage process. The stages in this process are bar chart icon, bar graph icon, data chart icon.
Histogram With Dollar For Financial Success Vector Icon Ppt PowerPoint Presentation Portfolio Example File Cpb
This is a histogram with dollar for financial success vector icon ppt powerpoint presentation portfolio example file cpb. This is a three stage process. The stages in this process are bar chart icon, bar graph icon, data chart icon.
Histogram With Gear Vector Icon Ppt PowerPoint Presentation Professional Slides Cpb
This is a histogram with gear vector icon ppt powerpoint presentation professional slides cpb. This is a three stage process. The stages in this process are bar chart icon, bar graph icon, data chart icon.
Quality Management Plan Templates Set 2 Histogram Highlighting Frequency Of Quality Defects And Its Types Guidelines PDF
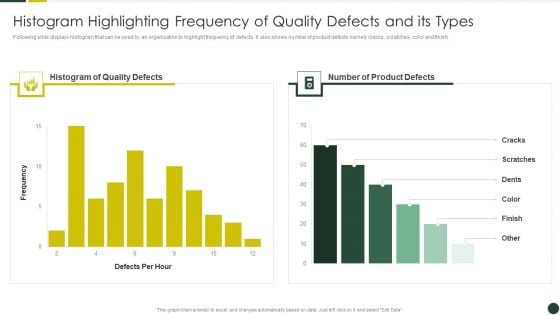
Following slide displays histogram that can be used by an organization to highlight frequency of defects. It also shows number of product defects namely cracks, scratches, color and finish.Deliver and pitch your topic in the best possible manner with this Quality Management Plan Templates Set 2 Histogram Highlighting Frequency Of Quality Defects And Its Types Guidelines PDF Use them to share invaluable insights on Product Defects, Quality Defects, Histogram and impress your audience. This template can be altered and modified as per your expectations. So, grab it now.
data collection histograms ppt powerpoint presentation example
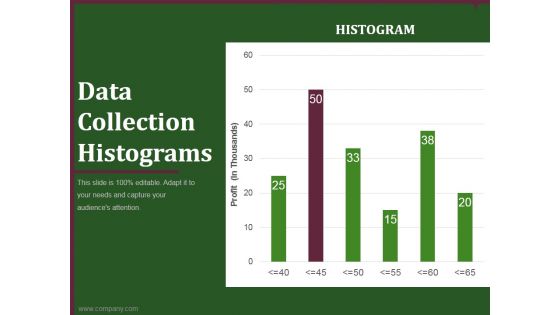
This is a data collection histograms ppt powerpoint presentation example. This is a six stage process. The stages in this process are business, planning, marketing, histograms, graph.
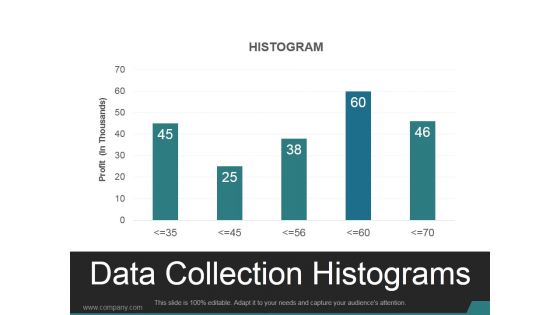
Data Collection Histograms Ppt PowerPoint Presentation Design Templates
This is a data collection histograms ppt powerpoint presentation design templates. This is a five stage process. The stages in this process are histogram, business, marketing, analysis, chart.
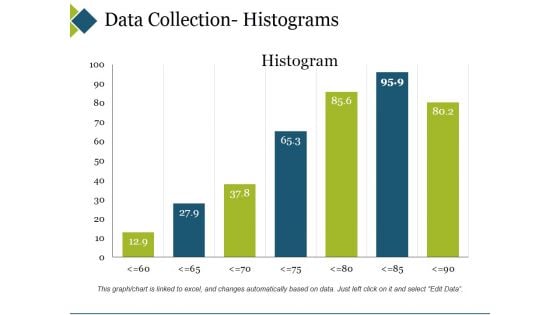
Data Collection Histograms Ppt PowerPoint Presentation Show Topics
This is a data collection histograms ppt powerpoint presentation show topics. This is a seven stage process. The stages in this process are business, marketing, histogram, finance, graph.
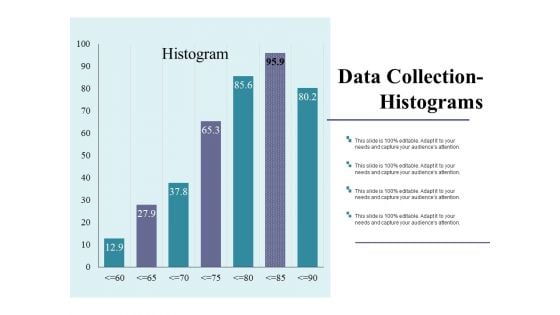
Data Collection Histograms Ppt PowerPoint Presentation Outline Show
This is a data collection histograms ppt powerpoint presentation outline show. This is a seven stage process. The stages in this process are business, marketing, strategy, finance, analysis.
Data Collection Histograms Ppt PowerPoint Presentation Icon Slides
This is a data collection histograms ppt powerpoint presentation icon slides. This is a two stage process. The stages in this process are bar chart, finance, marketing, business, analysis.

Graph Business PowerPoint Background And Template 1210
Microsoft PowerPoint Template and Background with a 3d rendering of a gold bars histogram Holster your thoughts in our Graph Business PowerPoint Background And Template 1210. You'll be faster on the draw.
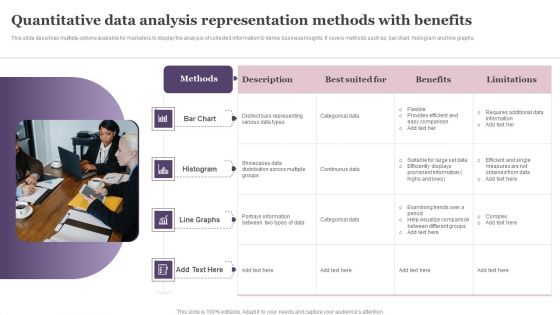
Quantitative Data Analysis Representation Methods With Benefits Template PDF
This slide describes multiple options available for marketers to display the analysis of collected information to derive business insights. It covers methods such as, bar chart, histogram and line graphs. Persuade your audience using this Quantitative Data Analysis Representation Methods With Benefits Template PDF. This PPT design covers four stages, thus making it a great tool to use. It also caters to a variety of topics including Bar Chart, Histogram, Line Graphs. Download this PPT design now to present a convincing pitch that not only emphasizes the topic but also showcases your presentation skills.

Collection Of Quality Assurance PPT Seven Basic Quality Control Tools Inspiration PDF
Following slide illustrates seven basic quality control tools that organization may use to maintain its product quality. Tools covered are fish bone, flow chart, control chart, pareto chart, check sheet, histogram and scatter plot. This is a collection of quality assurance ppt seven basic quality control tools inspiration pdf template with various stages. Focus and dispense information on seven stages using this creative set, that comes with editable features. It contains large content boxes to add your information on topics like control chart, flow charts, pareto chart, scatter plot, histogram. You can also showcase facts, figures, and other relevant content using this PPT layout. Grab it now.
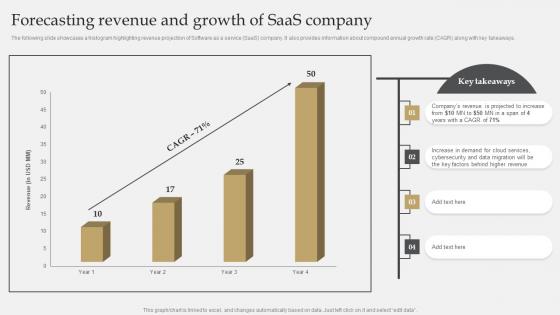
IT Industry Market Research Forecasting Revenue And Growth Of SaaS Company Elements Pdf
The following slide showcases a histogram highlighting revenue projection of Software as a service SaaS company. It also provides information about compound annual growth rate CAGR along with key takeaways. Slidegeeks is here to make your presentations a breeze with IT Industry Market Research Forecasting Revenue And Growth Of SaaS Company Elements Pdf With our easy-to-use and customizable templates, you can focus on delivering your ideas rather than worrying about formatting. With a variety of designs to choose from, you are sure to find one that suits your needs. And with animations and unique photos, illustrations, and fonts, you can make your presentation pop. So whether you are giving a sales pitch or presenting to the board, make sure to check out Slidegeeks first. The following slide showcases a histogram highlighting revenue projection of Software as a service SaaS company. It also provides information about compound annual growth rate CAGR along with key takeaways.

Quality Assurance Templates Set 3 Seven Basic Quality Control Tools Template PDF
Following slide illustrates seven basic quality control tools that organization may use to maintain its product quality. Tools covered are fish bone, flow chart, control chart, pareto chart, check sheet, histogram and scatter plot. This is a quality assurance templates set 3 seven basic quality control tools template pdf template with various stages. Focus and dispense information on seven stages using this creative set, that comes with editable features. It contains large content boxes to add your information on topics like fish bone, flow charts, control chart, pareto chart, check sheets. You can also showcase facts, figures, and other relevant content using this PPT layout. Grab it now.
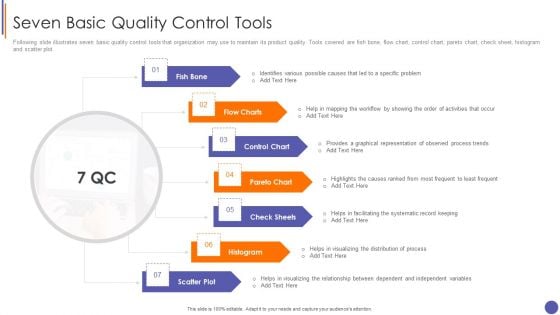
Contents For QA Plan And Process Set 3 Seven Basic Quality Control Tools Demonstration PDF
Following slide illustrates seven basic quality control tools that organization may use to maintain its product quality. Tools covered are fish bone, flow chart, control chart, pareto chart, check sheet, histogram and scatter plot.This is a Contents For QA Plan And Process Set 3 Seven Basic Quality Control Tools Demonstration PDF template with various stages. Focus and dispense information on seven stages using this creative set, that comes with editable features. It contains large content boxes to add your information on topics like Identifies Various, Graphical Representation, Facilitating The Systematic You can also showcase facts, figures, and other relevant content using this PPT layout. Grab it now.
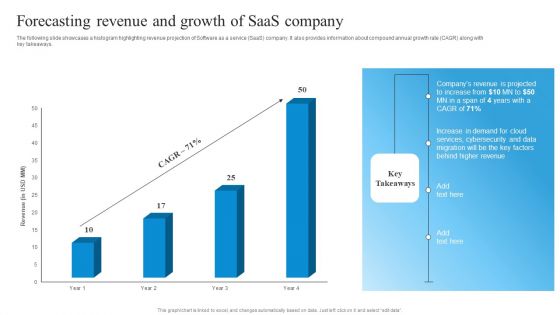
Market Evaluation Of IT Industry Forecasting Revenue And Growth Of Saas Company Guidelines PDF
The following slide showcases a histogram highlighting revenue projection of Software as a service SaaS company. It also provides information about compound annual growth rate CAGR along with key takeaways. Whether you have daily or monthly meetings, a brilliant presentation is necessary. Market Evaluation Of IT Industry Forecasting Revenue And Growth Of Saas Company Guidelines PDF can be your best option for delivering a presentation. Represent everything in detail using Market Evaluation Of IT Industry Forecasting Revenue And Growth Of Saas Company Guidelines PDF and make yourself stand out in meetings. The template is versatile and follows a structure that will cater to your requirements. All the templates prepared by Slidegeeks are easy to download and edit. Our research experts have taken care of the corporate themes as well. So, give it a try and see the results.
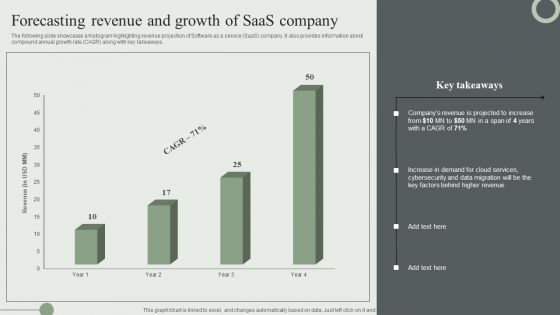
Forecasting Revenue And Growth Of Saas Company Ppt PowerPoint Presentation File Pictures PDF
The following slide showcases a histogram highlighting revenue projection of Software as a service SaaS company. It also provides information about compound annual growth rate CAGR along with key takeaways. Create an editable Forecasting Revenue And Growth Of Saas Company Ppt PowerPoint Presentation File Pictures PDF that communicates your idea and engages your audience. Whether youre presenting a business or an educational presentation, pre designed presentation templates help save time. Forecasting Revenue And Growth Of Saas Company Ppt PowerPoint Presentation File Pictures PDF is highly customizable and very easy to edit, covering many different styles from creative to business presentations. Slidegeeks has creative team members who have crafted amazing templates. So, go and get them without any delay.
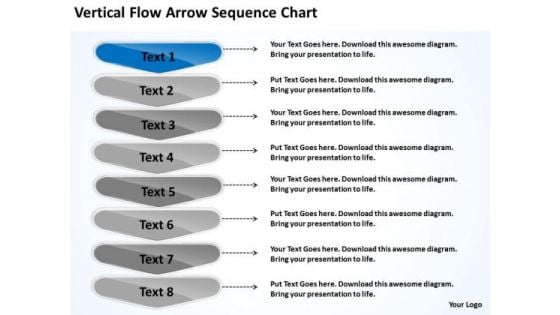
Vertical Flow Arrow Sequence Chart Website Business Plan PowerPoint Slides
We present our vertical flow arrow sequence chart website business plan PowerPoint Slides.Download and present our Arrow PowerPoint Templates because you know that the core of any organisation is the people who work for it. Present our Business PowerPoint Templates because spell out your advertising plans to increase market share. The feedback has been positive and productive. Present our Marketing PowerPoint Templates because they are truly some of the wonders of our life. Download and present our Shapes PowerPoint Templates because it has inspired a whole new world of medical endeavour. Download our Process and Flows PowerPoint Templates because forward thinking is the way to go.Use these PowerPoint slides for presentations relating to Advertising, arrow, business, creative, design, flyer,form, histogram, illustration, infographic,information, label, layout, leaflet, menu,navigation, number, options, order,origami, paper, pattern, product,promotion, ribbon, sequence, site,special, stationery, step, symbol, tab, text, vector, version, web, web design, website. The prominent colors used in the PowerPoint template are Blue, Gray, White. PowerPoint presentation experts tell us our vertical flow arrow sequence chart website business plan PowerPoint Slides are Dynamic. PowerPoint presentation experts tell us our business PowerPoint templates and PPT Slides are Appealing. You can be sure our vertical flow arrow sequence chart website business plan PowerPoint Slides are Glamorous. You can be sure our histogram PowerPoint templates and PPT Slides are Bold. PowerPoint presentation experts tell us our vertical flow arrow sequence chart website business plan PowerPoint Slides are Lush. People tell us our creative PowerPoint templates and PPT Slides are Pretty. App-date your audience with our Vertical Flow Arrow Sequence Chart Website Business Plan PowerPoint Slides. Familiarize them with the current fad.
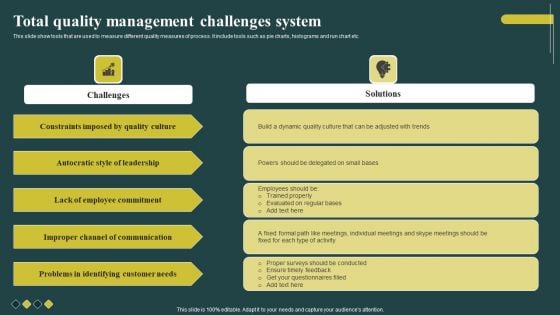
Total Quality Management Challenges System Themes PDF
This slide show tools that are used to measure different quality measures of process. It include tools such as pie charts, histograms and run chart etc. Showcasing this set of slides titled Total Quality Management Challenges System Themes PDF. The topics addressed in these templates are Employee Commitment, Communication, Customer Needs. All the content presented in this PPT design is completely editable. Download it and make adjustments in color, background, font etc. as per your unique business setting.
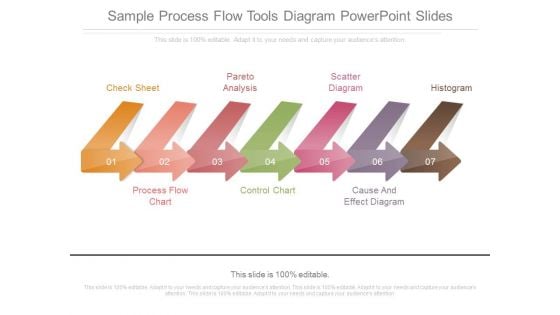
Sample Process Flow Tools Diagram Powerpoint Slides
This is a sample process flow tools diagram powerpoint slides. This is a seven stage process. The stages in this process are check sheet, process flow chart, pareto analysis, control chart, scatter diagram, cause and effect diagram, histogram.
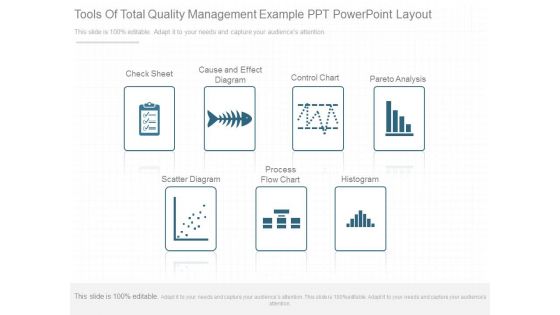
Tools Of Total Quality Management Example Ppt Powerpoint Layout
This is a tools of total quality management example ppt powerpoint layout. This is a seven stage process. The stages in this process are check sheet, cause and effect diagram, control chart, pareto analysis, scatter diagram, process flow chart, histogram.
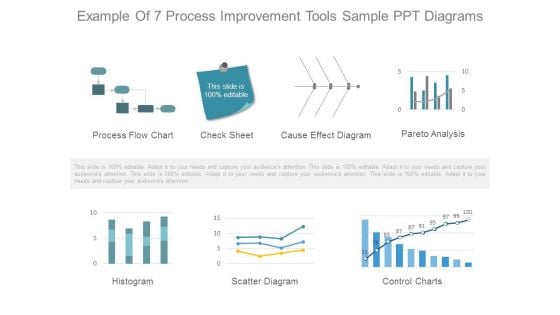
Example Of 7 Process Improvement Tools Sample Ppt Diagrams
This is a example of 7 process improvement tools sample ppt diagrams. This is a seven stage process. The stages in this process are process flow chart, check sheet, cause effect diagram, pareto analysis, histogram, scatter diagram, control charts.


 Continue with Email

 Home
Home


