Histogram
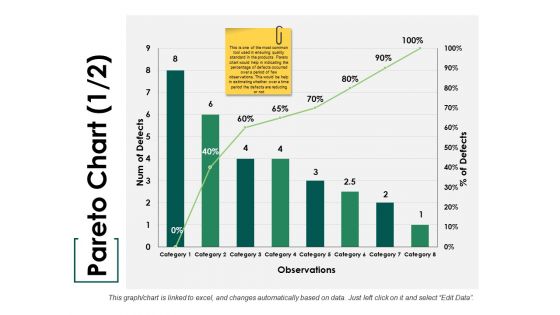
Pareto Chart Ppt PowerPoint Presentation Summary Show
This is a pareto chart ppt powerpoint presentation summary show. This is a eight stage process. The stages in this process are bar, marketing, strategy, finance, teamwork.
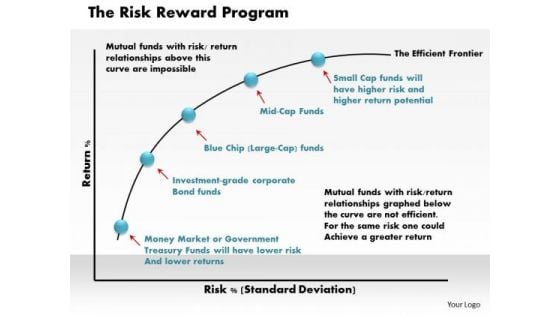
Business Framework The Risk Reward Program PowerPoint Presentation
This business framework PPT has been crafted with graphic of bar graph. This bar graph has been used to show the risk reward. Use this PPT diagram for marketing and business presentations and display risk reward program in graphical way.
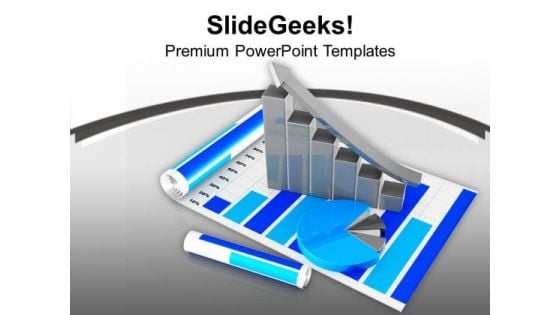
Boom In Growth Explained By Bar PowerPoint Templates Ppt Backgrounds For Slides 0313
We present our Boom In Growth Explained By Bar PowerPoint Templates PPT Backgrounds For Slides 0313.Present our Finance PowerPoint Templates because Our PowerPoint Templates and Slides are focused like a searchlight beam. They highlight your ideas for your target audience. Use our Success PowerPoint Templates because you should once Tap the ingenuity of our PowerPoint Templates and Slides. They are programmed to succeed. Use our Marketing PowerPoint Templates because It will let you Set new benchmarks with our PowerPoint Templates and Slides. They will keep your prospects well above par. Use our Business PowerPoint Templates because Our PowerPoint Templates and Slides will let your words and thoughts hit bullseye everytime. Present our Sales PowerPoint Templates because Our PowerPoint Templates and Slides are specially created by a professional team with vast experience. They diligently strive to come up with the right vehicle for your brilliant Ideas. Use these PowerPoint slides for presentations relating to Business graph on chart, marketing, sales, finance, business, success. The prominent colors used in the PowerPoint template are Blue, Gray, White. Bravely continue with your endeavour. Our Boom In Growth Explained By Bar PowerPoint Templates Ppt Backgrounds For Slides 0313 will keep the fight in you going.
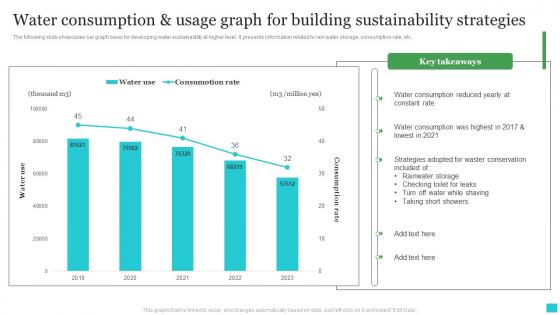
Water Consumption And Usage Graph For Building Sustainability Strategies Ideas Pdf
The following slide showcases bar graph basis for developing water sustainability at higher level. It presents information related to rain water storage, consumption rate, etc. Pitch your topic with ease and precision using this Water Consumption And Usage Graph For Building Sustainability Strategies Ideas Pdf. This layout presents information on Water Consumption, Constant Rate, Rainwater Storage. It is also available for immediate download and adjustment. So, changes can be made in the color, design, graphics or any other component to create a unique layout. The following slide showcases bar graph basis for developing water sustainability at higher level. It presents information related to rain water storage, consumption rate, etc.
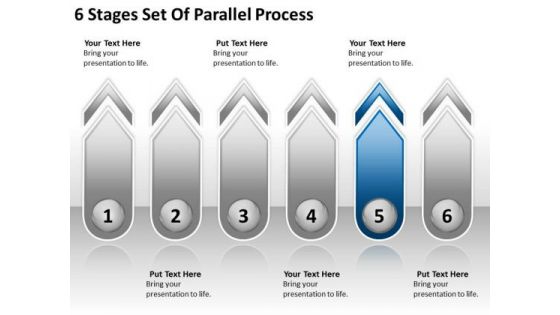
6 Stages Set Of Parallel Process Bar Business Plan Template PowerPoint Templates
We present our 6 stages set of parallel process bar business plan template PowerPoint templates.Present our Advertising PowerPoint Templates because It can Leverage your style with our PowerPoint Templates and Slides. Charm your audience with your ability. Present our Arrows PowerPoint Templates because our PowerPoint Templates and Slides will give your ideas the shape. Present our Business PowerPoint Templates because Our PowerPoint Templates and Slides will Embellish your thoughts. They will help you illustrate the brilliance of your ideas. Download our Shapes PowerPoint Templates because You can Create a matrix with our PowerPoint Templates and Slides. Feel the strength of your ideas click into place. Present our Process and Flows PowerPoint Templates because you can Break through with our PowerPoint Templates and Slides. Bring down the mental barriers of your audience.Use these PowerPoint slides for presentations relating to Arrow, Arrow Button, Arrow Vector, Art, Business, Button, Chart, Clip, communication, Decoration, Diagram, Direction, Drop, Element, Empty, Finance, Flow, Graph, Graphic, Illustration, Isometric, marketing, Presentation, Process, Shape, Sign, success, Step, Symbol, Template, Text, Vector. The prominent colors used in the PowerPoint template are Blue, White, Gray. Presenters tell us our 6 stages set of parallel process bar business plan template PowerPoint templates are effectively colour coded to prioritise your plans They automatically highlight the sequence of events you desire. Customers tell us our Button PowerPoint templates and PPT Slides provide you with a vast range of viable options. Select the appropriate ones and just fill in your text. The feedback we get is that our 6 stages set of parallel process bar business plan template PowerPoint templates are effectively colour coded to prioritise your plans They automatically highlight the sequence of events you desire. The feedback we get is that our Vector PowerPoint templates and PPT Slides are second to none. Presenters tell us our 6 stages set of parallel process bar business plan template PowerPoint templates are designed by professionals We assure you our Button PowerPoint templates and PPT Slides are specially created by a professional team with vast experience. They diligently strive to come up with the right vehicle for your brilliant Ideas. Reengineer your vision with our 6 Stages Set Of Parallel Process Bar Business Plan Template PowerPoint Templates. Download without worries with our money back guaranteee.
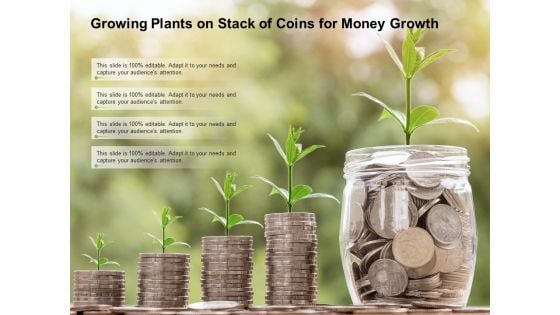
Growing Plants On Stack Of Coins For Money Growth Ppt Powerpoint Presentation Outline Display
This is a growing plants on stack of coins for money growth ppt powerpoint presentation outline display. This is a four stage process. The stages in this process are stacked bar, pile bar, heap bar.

Man Standing With Stack Of Us Currency Notes Bundles Ppt Powerpoint Presentation File Slides
This is a man standing with stack of us currency notes bundles ppt powerpoint presentation file slides. This is a three stage process. The stages in this process are stacked bar, pile bar, heap bar.
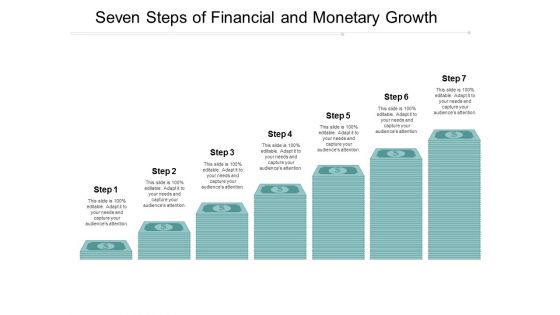
Seven Steps Of Financial And Monetary Growth Ppt Powerpoint Presentation Inspiration Backgrounds
This is a seven steps of financial and monetary growth ppt powerpoint presentation inspiration backgrounds. This is a seven stage process. The stages in this process are stacked bar, pile bar, heap bar.
Stack Of Coins For Bitcoin Transactions Ppt Powerpoint Presentation Icon Infographics
This is a stack of coins for bitcoin transactions ppt powerpoint presentation icon infographics. This is a four stage process. The stages in this process are stacked bar, pile bar, heap bar.

Stack Of Dollar Currency Banknotes For Financial Success Ppt Powerpoint Presentation Slides Background
This is a stack of dollar currency banknotes for financial success ppt powerpoint presentation slides background. This is a five stage process. The stages in this process are stacked bar, pile bar, heap bar.
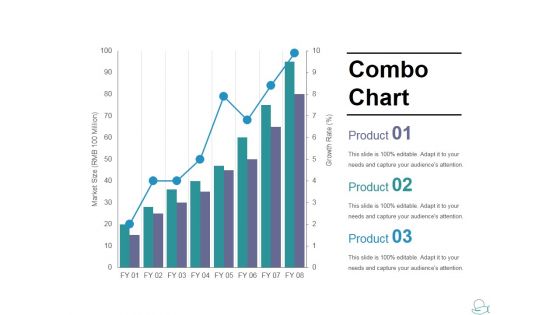
Combo Chart Ppt PowerPoint Presentation Slides Show
This is a combo chart ppt powerpoint presentation slides show. This is a three stage process. The stages in this process are combo chart, market size, product, bar graph, growth.
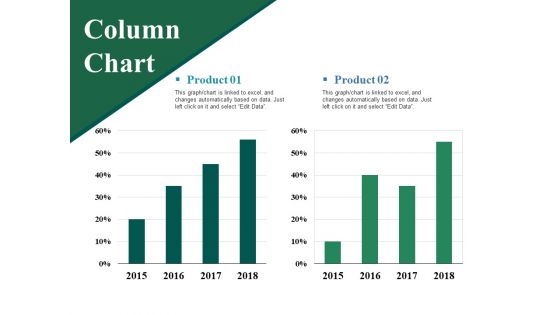
Column Chart Ppt PowerPoint Presentation Layouts Vector
This is a column chart ppt powerpoint presentation layouts vector. This is a two stage process. The stages in this process are product, column chart, bar graph, percentage, finance.
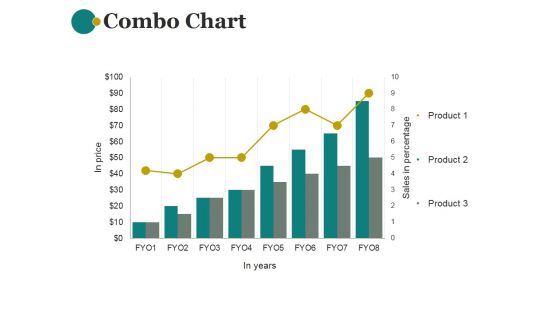
Combo Chart Ppt PowerPoint Presentation Shapes
This is a combo chart ppt powerpoint presentation shapes. This is a eight stage process. The stages in this process are combo chart, business, marketing, sales in percentage, bar graph.
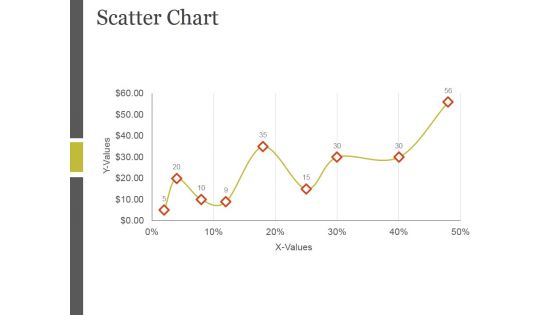
Scatter Chart Ppt PowerPoint Presentation Microsoft
This is a scatter chart ppt powerpoint presentation microsoft. This is a one stage process. The stages in this process are x values, scatter chart, bar graph, growth, business.
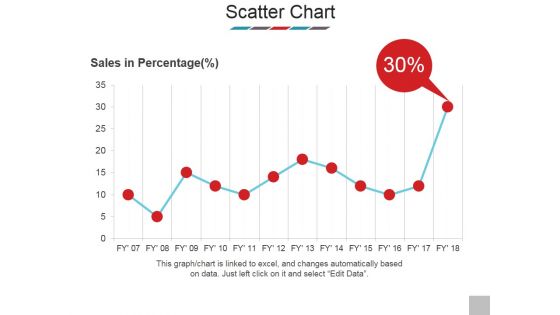
Scatter Chart Ppt PowerPoint Presentation Model Show
This is a scatter chart ppt powerpoint presentation model show. This is a one stage process. The stages in this process are sales in percentage, scatter chart, business, bar graph, marketing.
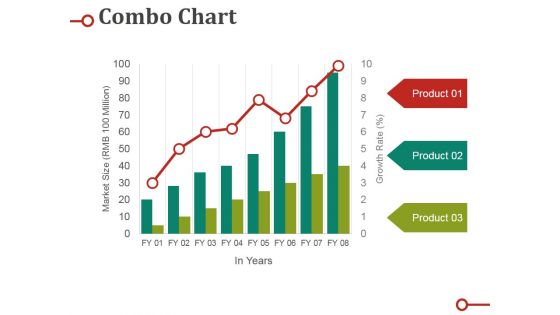
Combo Chart Ppt PowerPoint Presentation Gallery Sample
This is a combo chart ppt powerpoint presentation gallery sample. This is a three stage process. The stages in this process are market size, product, growth rate, bar, graph.
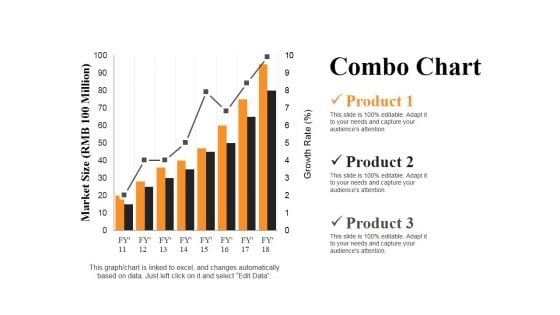
Combo Chart Ppt PowerPoint Presentation Summary Slides
This is a combo chart ppt powerpoint presentation summary slides. This is a three stage process. The stages in this process are market size, product, growth rate, bar graph, success.
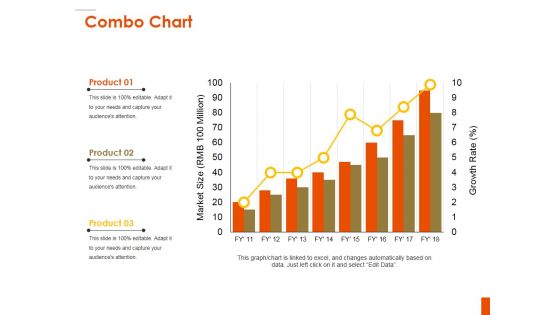
Combo Chart Ppt PowerPoint Presentation Inspiration Background
This is a combo chart ppt powerpoint presentation inspiration background. This is a three stage process. The stages in this process are product, bar graph, market size, growth, growth rate.
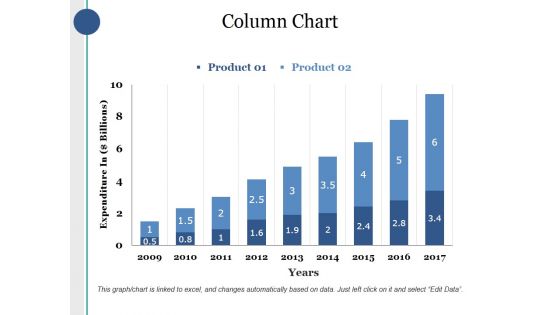
Column Chart Ppt PowerPoint Presentation Infographics Deck
This is a column chart ppt powerpoint presentation infographics deck. This is a two stage process. The stages in this process are product, expenditure in, years, bar graph, growth.
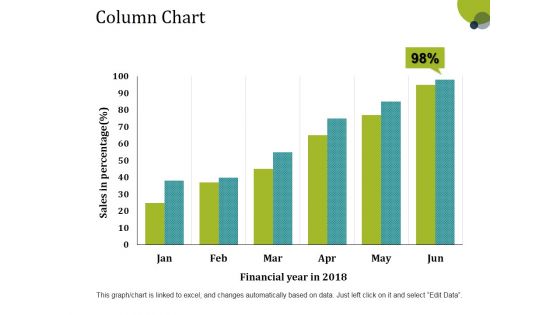
Column Chart Ppt PowerPoint Presentation Layouts Tips
This is a column chart ppt powerpoint presentation layouts tips. This is a six stage process. The stages in this process are sales in percentage, financial year, bar graph, growth, success.
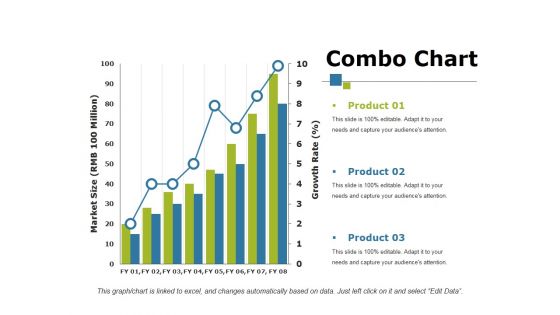
Combo Chart Ppt PowerPoint Presentation Show Influencers
This is a combo chart ppt powerpoint presentation show influencers. This is a three stage process. The stages in this process are product, bar graph, growth, growth rate, market size.
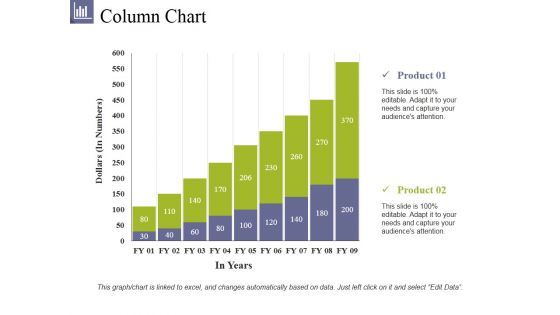
Column Chart Ppt PowerPoint Presentation File Summary
This is a column chart ppt powerpoint presentation file summary. This is a two stage process. The stages in this process are product, dollars, in years, bar graph, growth.
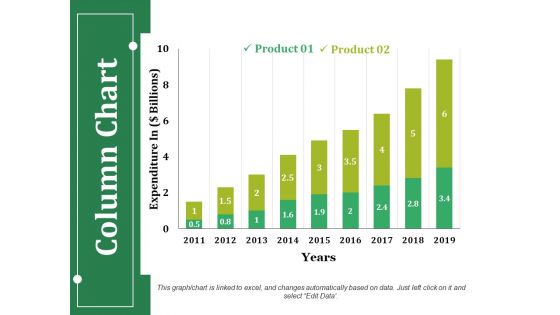
Column Chart Ppt PowerPoint Presentation Infographics Guidelines
This is a column chart ppt powerpoint presentation infographics guidelines. This is a two stage process. The stages in this process are product, expenditure in, years, business, bar graph.
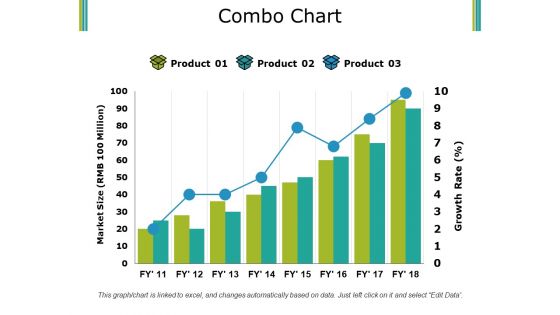
Combo Chart Ppt PowerPoint Presentation Pictures Summary
This is a combo chart ppt powerpoint presentation pictures summary. This is a three stage process. The stages in this process are product, market size, growth rate, bar graph, success.
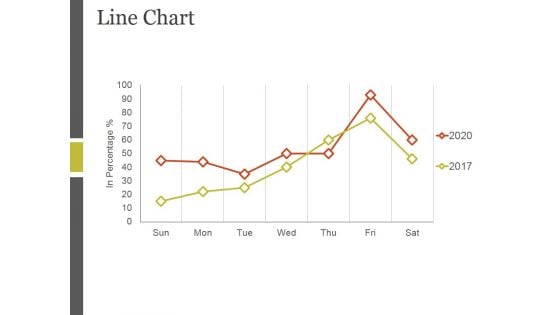
Line Chart Ppt PowerPoint Presentation Ideas Example
This is a line chart ppt powerpoint presentation ideas example. This is a two stage process. The stages in this process are sales in percentage, bar graph, business, marketing, growth.
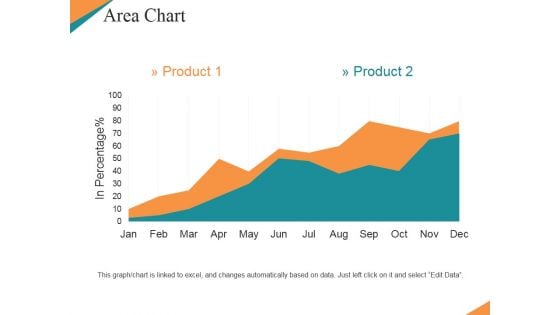
Area Chart Ppt PowerPoint Presentation Summary Templates
This is a area chart ppt powerpoint presentation summary templates. This is a two stage process. The stages in this process are product, in percentage, bar graph, growth, business.
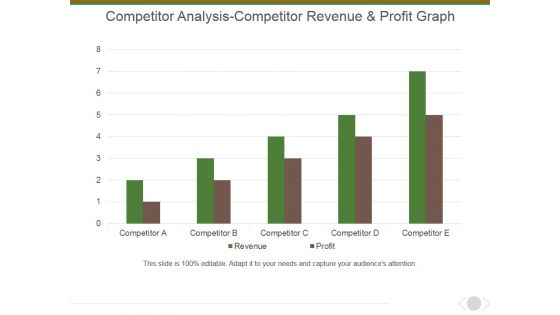
Competitor Analysis Competitor Revenue And Profit Graph Ppt PowerPoint Presentation Gallery Vector
This is a competitor analysis competitor revenue and profit graph ppt powerpoint presentation gallery vector. This is a five stage process. The stages in this process are bar graph, marketing, management, business, presentation.

Business Growth Chart Finance PowerPoint Templates And PowerPoint Backgrounds 0511
Microsoft PowerPoint Template and Background with businessman pushes graph piece with earth and bar graph Give your thoughts an extravagant display. Our Business Growth Chart Finance PowerPoint Templates And PowerPoint Backgrounds 0511 will add on extra dimensions.

Business Growth Chart Finance PowerPoint Themes And PowerPoint Slides 0511
Microsoft PowerPoint Slide and Theme with businessman pushes graph piece with earth and bar graph Identify targets with our Business Growth Chart Finance PowerPoint Themes And PowerPoint Slides 0511. Download without worries with our money back guaranteee.
Graph With America Flag Americana PowerPoint Templates And PowerPoint Backgrounds 0711
Microsoft PowerPoint Template and Background with bar chart and rippled american flag with currency Exhort your team with our Graph With America Flag Americana PowerPoint Templates And PowerPoint Backgrounds 0711. Urge them on to go one better.
Graph With America Flag Americana PowerPoint Themes And PowerPoint Slides 0711
Microsoft PowerPoint Theme and Slide with bar chart and rippled american flag with currency Your ideas deserve the best accessories. Our Graph With America Flag Americana PowerPoint Themes And PowerPoint Slides 0711 are a shining example.
Column Chart Ppt PowerPoint Presentation Icon Show
This is a column chart ppt powerpoint presentation icon show. This is a two stage process. The stages in this process are column chart, product, years, bar graph, growth.
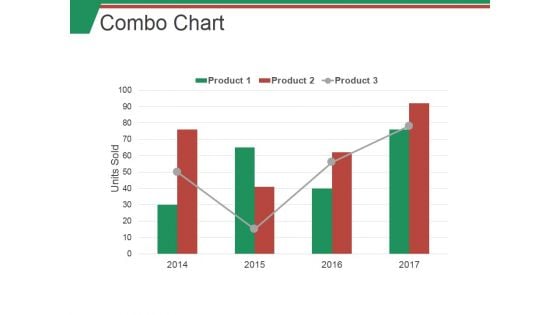
Combo Chart Ppt PowerPoint Presentation Styles Example Topics
This is a combo chart ppt powerpoint presentation styles example topics. This is a four stage process. The stages in this process are bar, success, growth, business, marketing.
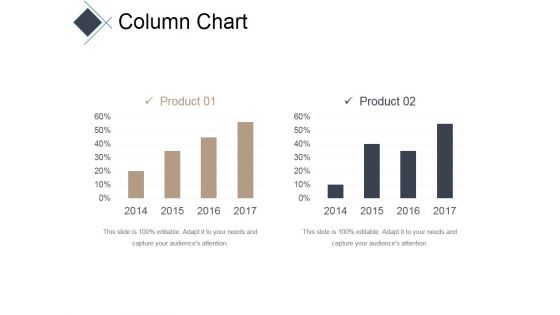
Column Chart Ppt PowerPoint Presentation Infographic Template Inspiration
This is a column chart ppt powerpoint presentation infographic template inspiration. This is a two stage process. The stages in this process are bar, years, business, marketing, success.
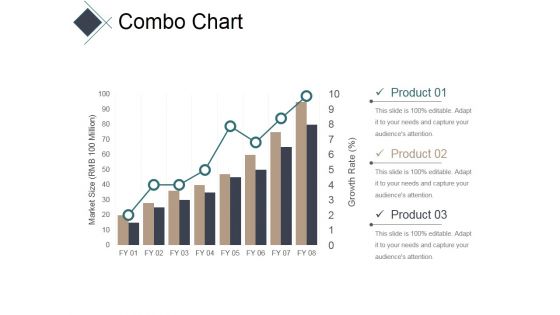
Combo Chart Ppt PowerPoint Presentation Ideas Graphic Images
This is a combo chart ppt powerpoint presentation ideas graphic images. This is a eight stage process. The stages in this process are bar, finance, business, marketing, success.
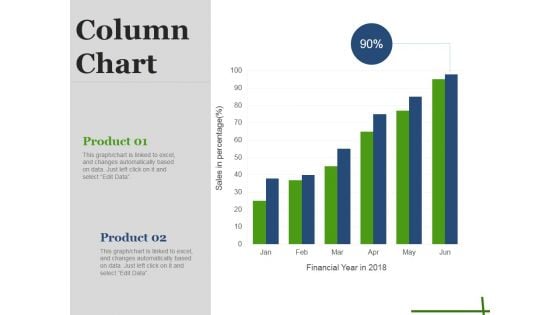
Column Chart Ppt PowerPoint Presentation Pictures Background Images
This is a column chart ppt powerpoint presentation pictures background images. This is a six stage process. The stages in this process are business, marketing, strategy, bar, success.
Combo Chart Ppt PowerPoint Presentation Icon Format Ideas
This is a combo chart ppt powerpoint presentation icon format ideas. This is a three stage process. The stages in this process are bar, marketing, strategy, planning, growth.
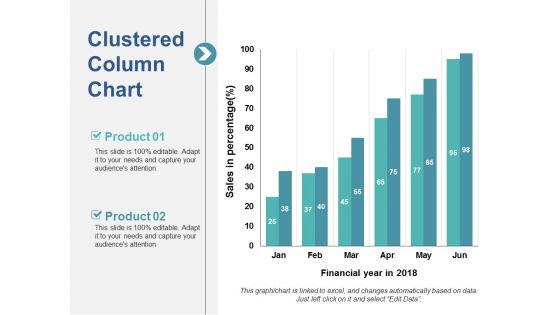
Clustered Column Chart Ppt PowerPoint Presentation Slides Smartart
This is a clustered column chart ppt powerpoint presentation slides smartart. This is a two stage process. The stages in this process are bar, marketing, strategy, planning, finance.
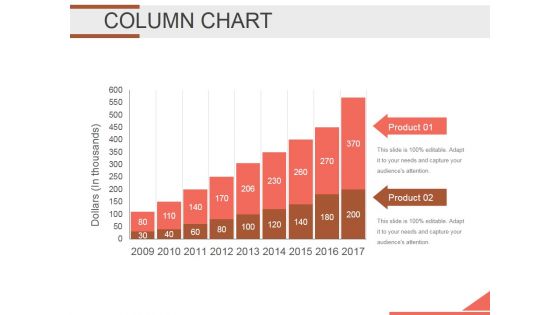
Column Chart Ppt PowerPoint Presentation Background Designs
This is a column chart ppt powerpoint presentation background designs. This is a two stage process. The stages in this process are bar graph, finance, marketing, strategy, analysis, business.
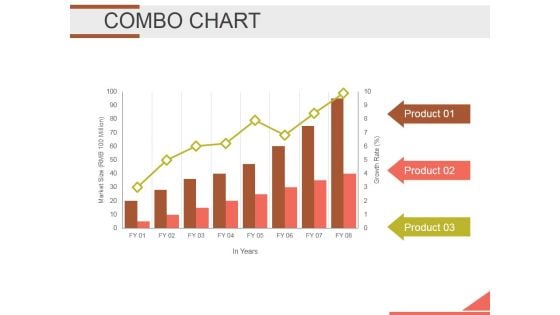
Combo Chart Ppt PowerPoint Presentation Infographics Infographics
This is a combo chart ppt powerpoint presentation infographics infographics. This is a three stage process. The stages in this process are bar graph, growth, finance, marketing, strategy, business.
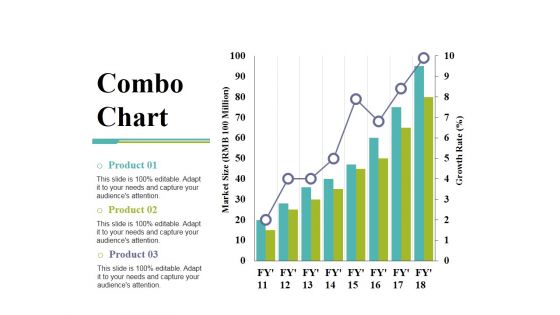
Combo Chart Ppt PowerPoint Presentation Show Deck
This is a combo chart ppt powerpoint presentation show deck. This is a three stage process. The stages in this process are growth rate, market size, product, bar graph, growth.

Up Arrow Graph Business PowerPoint Templates And PowerPoint Backgrounds 0511
Microsoft PowerPoint Template and Background with 3d rendered image of a bar-chart for success concept Presentation to a sizable audience. We've got your back with our Up Arrow Graph Business PowerPoint Templates And PowerPoint Backgrounds 0511. You'll always stay ahead of the game.
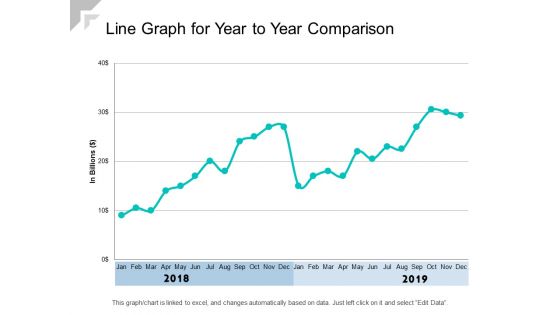
Line Graph For Year To Year Comparison Ppt PowerPoint Presentation Show Graphics Example
Presenting this set of slides with name line graph for year to year comparison ppt powerpoint presentation show graphics example. The topics discussed in these slides are revenue trend, bar chart, financial. This is a completely editable PowerPoint presentation and is available for immediate download. Download now and impress your audience.
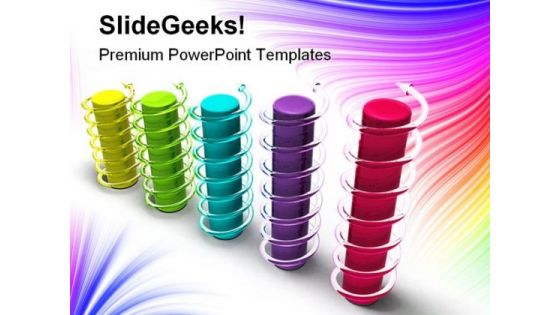
Graph Business PowerPoint Template 0910
Business 3d graph multi colored with spiral arrows around bars. Get the break you have been waiting for. Earn it with the help of our Graph Business PowerPoint Template 0910.
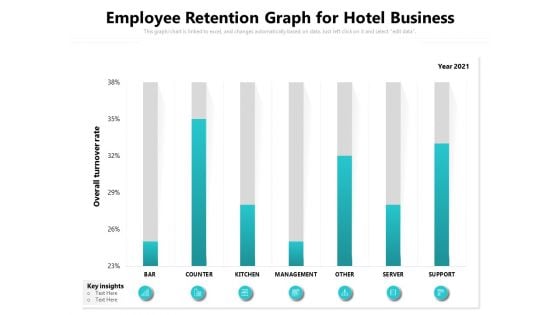
Employee Retention Graph For Hotel Business Ppt PowerPoint Presentation Show Skills PDF
Presenting this set of slides with name employee retention graph for hotel business ppt powerpoint presentation show skills pdf. The topics discussed in these slides are bar, counter, kitchen, management, other, server, support. This is a completely editable PowerPoint presentation and is available for immediate download. Download now and impress your audience.
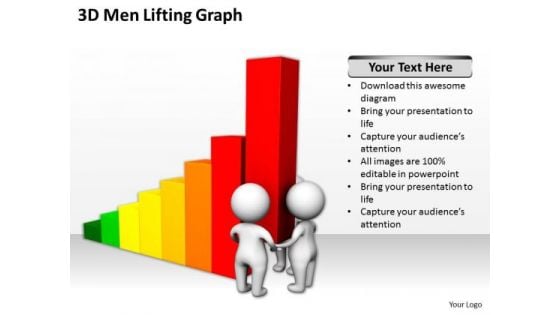
Successful Business Men 3d Lifting Graph PowerPoint Slides
We present our successful business men 3d lifting graph PowerPoint Slides.Download our Business PowerPoint Templates because Our PowerPoint Templates and Slides are aesthetically designed to attract attention. We gaurantee that they will grab all the eyeballs you need. Download and present our People PowerPoint Templates because Our PowerPoint Templates and Slides are created by a hardworking bunch of busybees. Always flitting around with solutions gauranteed to please. Present our Finance PowerPoint Templates because It is Aesthetically crafted by artistic young minds. Our PowerPoint Templates and Slides are designed to display your dexterity. Download our Success PowerPoint Templates because You can Connect the dots. Fan expectations as the whole picture emerges. Download and present our Marketing PowerPoint Templates because You are well armed with penetrative ideas. Our PowerPoint Templates and Slides will provide the gunpowder you need.Use these PowerPoint slides for presentations relating to 3d, abstract, accounting, achievement, advantage, bar, bar graph, bar-chart, bar-graph, business, cartoon, chart, company, concept, corporate, financial, graph, growth, help, icon, idiom, lifting, lifting the bar, market, meeting, men, metaphor, partnership, people, performance, presentation, progress, report, strength, team, teamwork. The prominent colors used in the PowerPoint template are Red, Yellow, Green. Position yourself with our Successful Business Men 3d Lifting Graph PowerPoint Slides. Download without worries with our money back guaranteee.
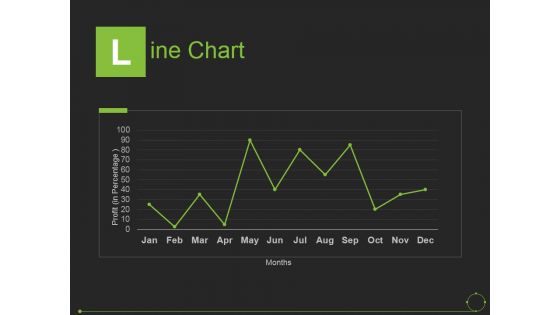
Line Chart Ppt PowerPoint Presentation File Graphics Tutorials
This is a line chart ppt powerpoint presentation file graphics tutorials. This is a one stage process. The stages in this process are months, line chart, bar graph, business, marketing.
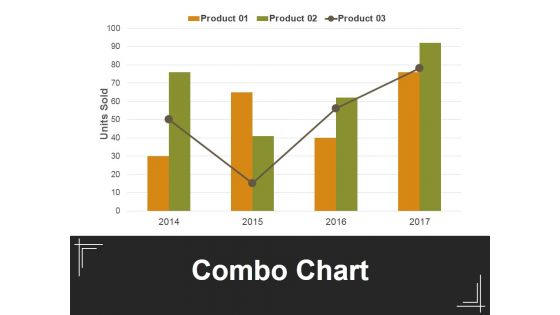
Combo Chart Ppt PowerPoint Presentation Outline Background Image
This is a combo chart ppt powerpoint presentation outline background image. This is a four stage process. The stages in this process are combo chart, units sold, bar graph, business, marketing.
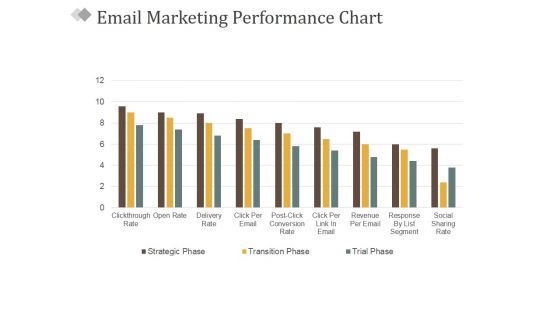
Email Marketing Performance Chart Ppt PowerPoint Presentation Gallery Elements
This is a email marketing performance chart ppt powerpoint presentation gallery elements. This is a nine stage process. The stages in this process are business, marketing, success, management, bar graph.
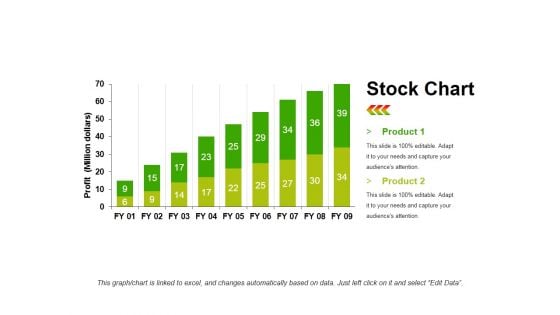
Stock Chart Template 1 Ppt PowerPoint Presentation Infographic Template Objects
This is a stock chart template 1 ppt powerpoint presentation infographic template objects. This is a two stage process. The stages in this process are product, profit, bar graph, growth, success.
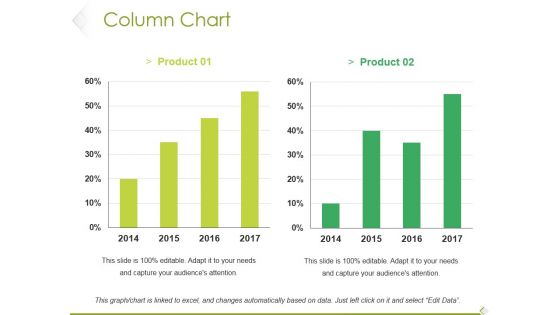
Column Chart Ppt PowerPoint Presentation Model Clipart Images
This is a column chart ppt powerpoint presentation model clipart images. This is a two stage process. The stages in this process are product, bar graph, growth, success, business.
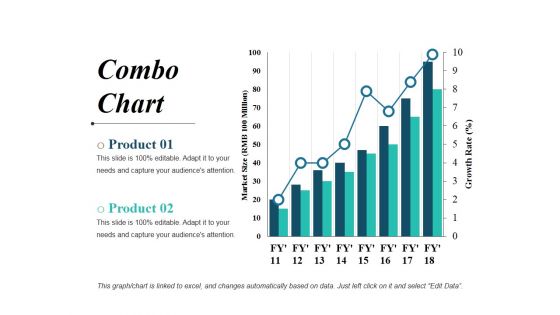
Combo Chart Ppt PowerPoint Presentation File Visual Aids
This is a combo chart ppt powerpoint presentation file visual aids. This is a two stage process. The stages in this process are bar graph, business, marketing, finance, planning.
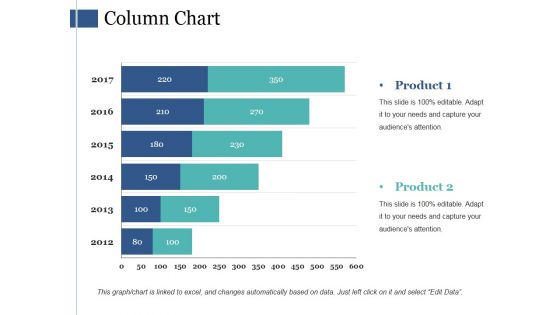
Column Chart Ppt PowerPoint Presentation Model Background Images
This is a column chart ppt powerpoint presentation model background images. This is a six stage process. The stages in this process are bar graph, marketing, finance, strategy, planning.
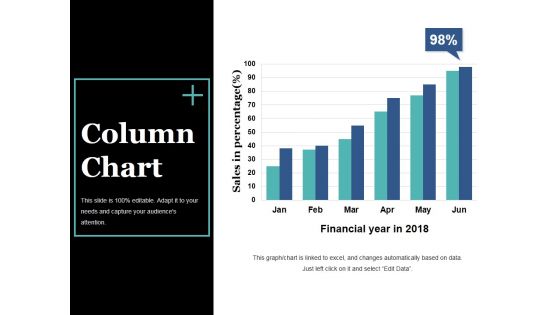
Column Chart Ppt PowerPoint Presentation Slides Visual Aids
This is a column chart ppt powerpoint presentation slides visual aids. This is a six stage process. The stages in this process are bar graph, growth, success, sales in percentage, financial year.
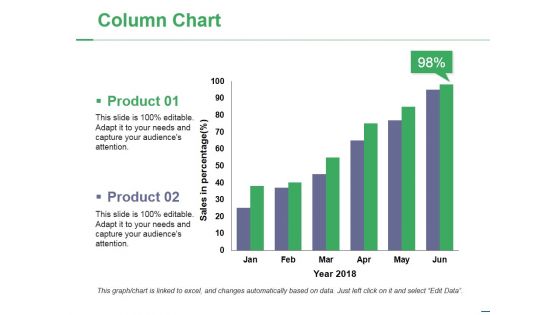
Column Chart Ppt PowerPoint Presentation Portfolio Slide Download
This is a column chart ppt powerpoint presentation portfolio slide download. This is a two stage process. The stages in this process are product, year, bar graph, success, business.
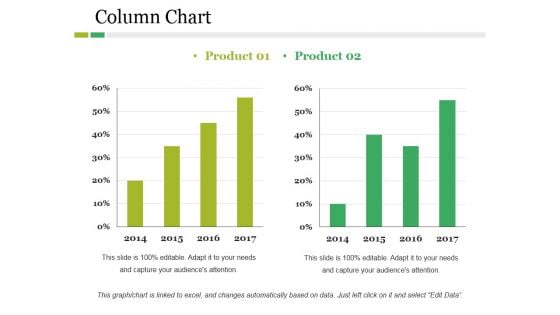
Column Chart Ppt PowerPoint Presentation Layouts Graphics Example
This is a column chart ppt powerpoint presentation layouts graphics example. This is a two stage process. The stages in this process are product, year, bar graph, business, finance.
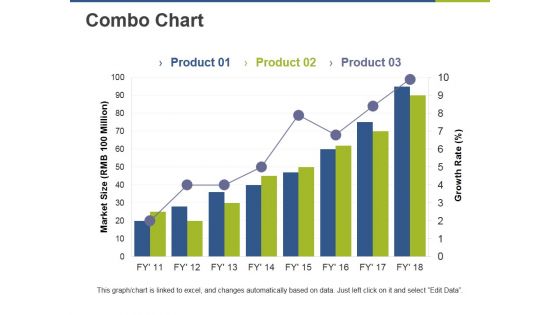
Combo Chart Ppt PowerPoint Presentation Pictures Graphic Images
This is a combo chart ppt powerpoint presentation pictures graphic images. This is a three stage process. The stages in this process are bar graph, growth, market size, growth rate, success.
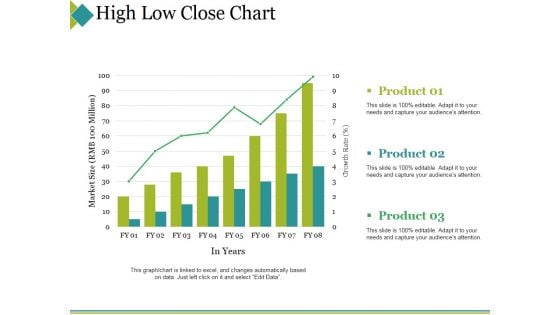
High Low Close Chart Ppt PowerPoint Presentation Portfolio Topics
This is a high low close chart ppt powerpoint presentation portfolio topics. This is a three stage process. The stages in this process are product, market size, in years, success, bar graph.

Column Chart Ppt PowerPoint Presentation Pictures Graphic Images
This is a column chart ppt powerpoint presentation pictures graphic images. This is a two stage process. The stages in this process are product, years, growth, success, bar graph.
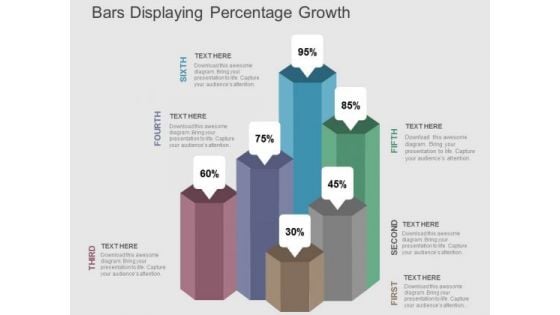
Bars Displaying Percentage Growth PowerPoint Templates
Our above PPT slide contains bar graph displaying percentage growth. This diagram of bar graph helps to depict statistical information. Use this diagram to impart more clarity to data and to create more sound impact on viewers.


 Continue with Email

 Home
Home


