Histogram
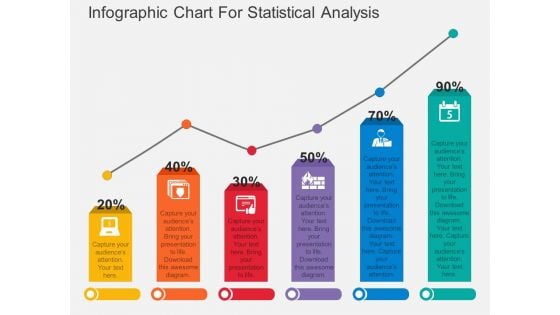
Infographic Chart For Statistical Analysis Powerpoint Template
Download this exclusive business diagram to display statistical analysis. This PowerPoint template contains bar chart with percentage values. This diagram is useful for business presentations.
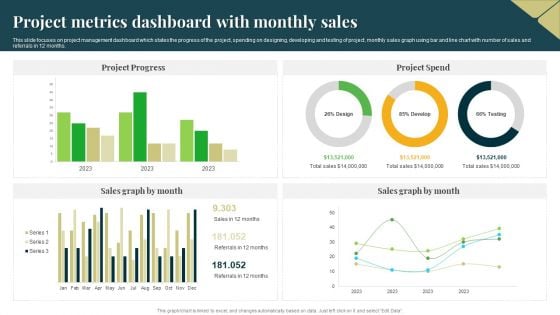
Project Metrics Dashboard With Monthly Sales Professional PDF
This slide focuses on project management dashboard which states the progress of the project, spending on designing, developing and testing of project, monthly sales graph using bar and line chart with number of sales and referrals in 12 months. Pitch your topic with ease and precision using this Project Metrics Dashboard With Monthly Sales Professional PDF. This layout presents information on Project Progress, Project Spend, Sales Graph. It is also available for immediate download and adjustment. So, changes can be made in the color, design, graphics or any other component to create a unique layout.
Business Outcomes Analysis Business Man With Pie Bar And Line Chart Ppt Powerpoint Presentation Infographics Visual Aids
This is a business outcomes analysis business man with pie bar and line chart ppt powerpoint presentation infographics visual aids. This is a three stage process. The stages in this process are business outcomes, business results, business output.
Bar Chart With Magnifying Glass And Dollar Symbol For Financial Analysis Ppt PowerPoint Presentation File Structure PDF
Presenting this set of slides with name bar chart with magnifying glass and dollar symbol for financial analysis ppt powerpoint presentation file structure pdf. This is a one stage process. The stages in this process is bar chart with magnifying glass and dollar symbol for financial analysis. This is a completely editable PowerPoint presentation and is available for immediate download. Download now and impress your audience.
Gender Salary Gap Icon With Bar Chart And Dollar Symbol Ppt PowerPoint Presentation Model Graphic Tips PDF
Presenting gender salary gap icon with bar chart and dollar symbol ppt powerpoint presentation model graphic tips pdf to dispense important information. This template comprises three stages. It also presents valuable insights into the topics including gender salary gap icon with bar chart and dollar symbol. This is a completely customizable PowerPoint theme that can be put to use immediately. So, download it and address the topic impactfully.
Mobile Phone With Bar Chart And Magnify Glass Vector Icon Ppt PowerPoint Presentation Visual Aids Show PDF
Presenting mobile phone with bar chart and magnify glass vector icon ppt powerpoint presentation visual aids show pdf to dispense important information. This template comprises three stages. It also presents valuable insights into the topics including mobile phone with bar chart and magnify glass vector icon. This is a completely customizable PowerPoint theme that can be put to use immediately. So, download it and address the topic impactfully.
Employee Career Growth Steps With Bar Chart And Idea Bulb Vector Icon Ppt PowerPoint Presentation File Format Ideas PDF
Persuade your audience using this employee career growth steps with bar chart and idea bulb vector icon ppt powerpoint presentation file format ideas pdf. This PPT design covers three stages, thus making it a great tool to use. It also caters to a variety of topics including employee career growth steps with bar chart and idea bulb vector icon. Download this PPT design now to present a convincing pitch that not only emphasizes the topic but also showcases your presentation skills.
Sales Steps Process With Gear And Bar Chart Vector Icon Ppt PowerPoint Presentation Infographics Graphics Design PDF
Presenting sales steps process with gear and bar chart vector icon ppt powerpoint presentation infographics graphics design pdf to dispense important information. This template comprises three stages. It also presents valuable insights into the topics including sales steps process with gear and bar chart vector icon. This is a completely customizable PowerPoint theme that can be put to use immediately. So, download it and address the topic impactfully.
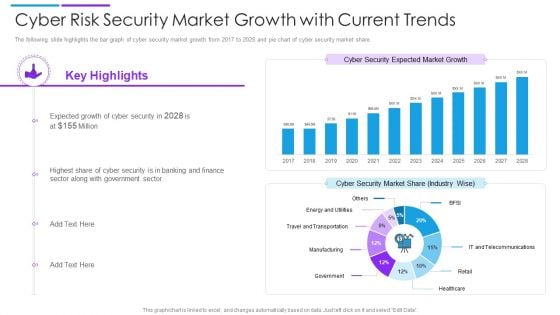
Cyber Risk Security Market Growth With Current Trends Summary PDF
The following slide highlights the bar graph of cyber security market growth from 2017 to 2028 and pie chart of cyber security market share. Showcasing this set of slides titled cyber risk security market growth with current trends summary pdf. The topics addressed in these templates are cyber security market share, cyber security expected market growth, banking and finance. All the content presented in this PPT design is completely editable. Download it and make adjustments in color, background, font etc. as per your unique business setting.
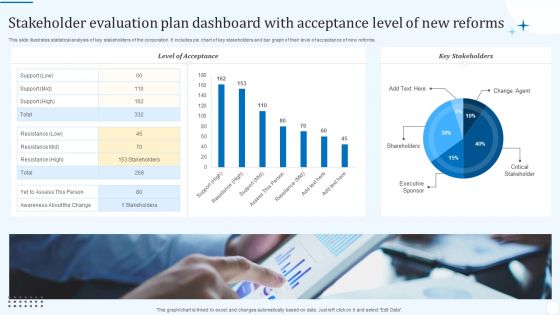
Stakeholder Evaluation Plan Dashboard With Acceptance Level Of New Reforms Background PDF
This slide illustrates statistical analysis of key stakeholders of the corporation. It includes pie chart of key stakeholders and bar graph of their level of acceptance of new reforms. Showcasing this set of slides titled Stakeholder Evaluation Plan Dashboard With Acceptance Level Of New Reforms Background PDF. The topics addressed in these templates are Level Acceptance, Key Stakeholders, Critical Stakeholder. All the content presented in this PPT design is completely editable. Download it and make adjustments in color, background, font etc. as per your unique business setting.

HR KPI Dashboard With Staff Payroll Details Ppt PowerPoint Presentation File Layout Ideas PDF
This slide represents the key performance indicator dashboard with salary details of employee working in an organisation. It includes turnover rate, pie chart of employment contract and status, bar graph based on employee gender. Showcasing this set of slides titled HR KPI Dashboard With Staff Payroll Details Ppt PowerPoint Presentation File Layout Ideas PDF. The topics addressed in these templates are Turnover Rate, Absenteeism Rate, Permanent Rate. All the content presented in this PPT design is completely editable. Download it and make adjustments in color, background, font etc. as per your unique business setting.
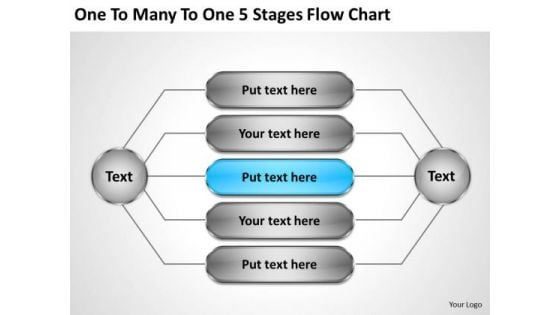
Company Business Strategy To Many 5 Stages Flow Chart Development
We present our company business strategy to many 5 stages flow chart development.Download our Process and Flows PowerPoint Templates because Our PowerPoint Templates and Slides will provide weight to your words. They will bring out the depth of your thought process. Present our Flow Charts PowerPoint Templates because Our PowerPoint Templates and Slides will embellish your thoughts. See them provide the desired motivation to your team. Use our Org Charts PowerPoint Templates because It will Raise the bar of your Thoughts. They are programmed to take you to the next level. Download and present our Business PowerPoint Templates because You are an avid believer in ethical practices. Highlight the benefits that accrue with our PowerPoint Templates and Slides. Download our Marketing PowerPoint Templates because our PowerPoint Templates and Slides are the string of your bow. Fire of your ideas and conquer the podium.Use these PowerPoint slides for presentations relating to Arrow, art, background, blank, business, button, chart, clip, coded, circlecharts,diagram, drop, financial, flow, graph, graphic, icon, illustration, image, org,organizational, process,shadow, symbol, team, transparency, vector, marketing, . The prominent colors used in the PowerPoint template are Blue light, White, Gray. Win over your fans with our Company Business Strategy To Many 5 Stages Flow Chart Development. They will cheer all day for you.
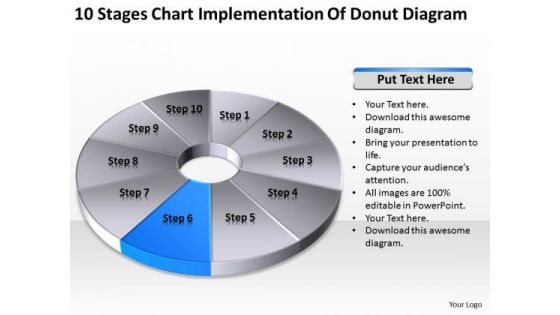
Chart Implementation Of Donut Diagram Simple Business Plan Templates PowerPoint
We present our chart implementation of donut diagram simple business plan templates PowerPoint.Present our Ring Charts PowerPoint Templates because Our PowerPoint Templates and Slides will steer your racing mind. Hit the right buttons and spur on your audience. Download and present our Process and Flows PowerPoint Templates because Our PowerPoint Templates and Slides will let Your superior ideas hit the target always and everytime. Use our Flow Charts PowerPoint Templates because Our PowerPoint Templates and Slides have the Brilliant backdrops. Guaranteed to illuminate the minds of your audience. Use our Marketing PowerPoint Templates because our PowerPoint Templates and Slides will give your ideas the shape. Use our Business PowerPoint Templates because You are an avid believer in ethical practices. Highlight the benefits that accrue with our PowerPoint Templates and Slides.Use these PowerPoint slides for presentations relating to Pie, chart, isolated, white, bar, business, concept, sign, render, spectrum, bright, diagram, circle, percentage, light, graphic,element, digital, report, marketing, abstract, graph, modern, creative, illustration, icon, up, web, design, painting, set, art, progress, effect, style, steps,ten,pattern, financial. The prominent colors used in the PowerPoint template are Gray, White, Blue. Establish your credentials with our Chart Implementation Of Donut Diagram Simple Business Plan Templates PowerPoint. They give you an air of authority.
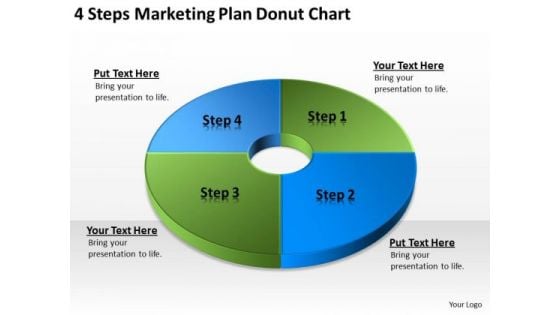
4 Steps Marketing Plan Donut Chart Business Guidelines PowerPoint Slides
We present our 4 steps marketing plan donut chart business guidelines PowerPoint Slides.Download and present our Ring Charts PowerPoint Templates because Our PowerPoint Templates and Slides team portray an attitude of elegance. Personify this quality by using them regularly. Download our Flow Charts PowerPoint Templates because You should Ascend the ladder of success with ease. Our PowerPoint Templates and Slides will provide strong and sturdy steps. Download our Business PowerPoint Templates because You can Connect the dots. Fan expectations as the whole picture emerges. Use our Shapes PowerPoint Templates because Our PowerPoint Templates and Slides help you pinpoint your timelines. Highlight the reasons for your deadlines with their use. Present our Process and Flows PowerPoint Templates because You can Rise to the occasion with our PowerPoint Templates and Slides. You will bring your audience on their feet in no time.Use these PowerPoint slides for presentations relating to Wheel, color, pie, chart, isolated, bar, business, concept, sign, render, bright, template, diagram, circle, graphic, report, marketing, abstract, graph, modern, creative, illustration, web, design, blue, painting, progress, pattern, financial. The prominent colors used in the PowerPoint template are Green, Blue, Black. Achievestrong & sustainable performance gains with our 4 Steps Marketing Plan Donut Chart Business Guidelines PowerPoint Slides. They will make you look good.
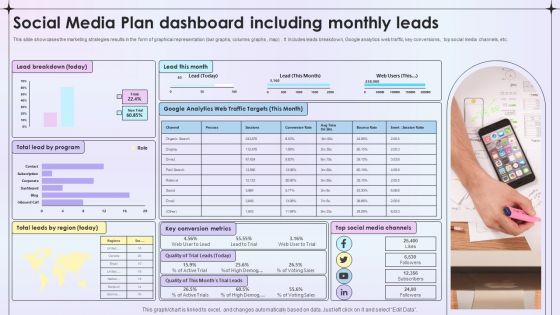
Social Media Plan Dashboard Including Monthly Leads Ppt File Slides PDF
This slide showcases the marketing strategies results in the form of graphical representation bar graphs, columns graphs , map. It includes leads breakdown, Google analytics web traffic, key conversions , top social media channels, etc. Showcasing this set of slides titled Social Media Plan Dashboard Including Monthly Leads Ppt File Slides PDF. The topics addressed in these templates are Lead Breakdown, Key Conversion Metrics, Social Media Channels. All the content presented in this PPT design is completely editable. Download it and make adjustments in color, background, font etc. as per your unique business setting.
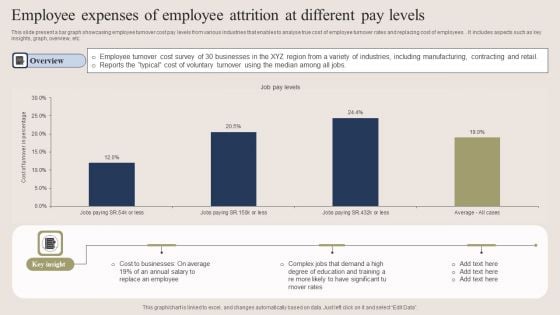
Employee Expenses Of Employee Attrition At Different Pay Levels Formats PDF
This slide present a bar graph showcasing employee turnover cost pay levels from various industries that enables to analyse true cost of employee turnover rates and replacing cost of employees . It includes aspects such as key insights, graph, overview, etc. Showcasing this set of slides titled Employee Expenses Of Employee Attrition At Different Pay Levels Formats PDF. The topics addressed in these templates are Cost To Businesses, Average, Employee. All the content presented in this PPT design is completely editable. Download it and make adjustments in color, background, font etc. as per your unique business setting.
Down Arrow Icon R
3d decay graph bar Let your ideas acquire a flourish. Our PT&s will ensure they blossom.
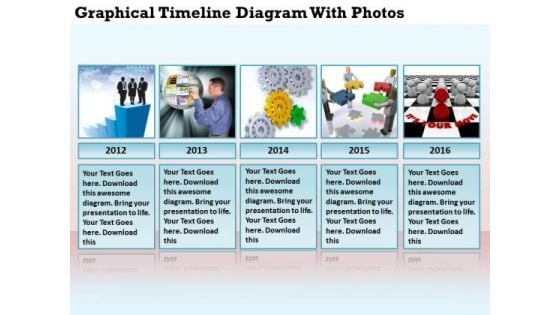
Business Charts Graphical Timeline Diagram With Photos PowerPoint Slides
We present our business charts graphical timeline diagram with photos PowerPoint Slides.Use our Spheres PowerPoint Templates because Our PowerPoint Templates and Slides will let you Hit the target. Go the full distance with ease and elan. Download and present our Business PowerPoint Templates because Our PowerPoint Templates and Slides will embellish your thoughts. See them provide the desired motivation to your team. Download and present our Marketing PowerPoint Templates because Our PowerPoint Templates and Slides will let you meet your Deadlines. Download our Flow Charts PowerPoint Templates because Our PowerPoint Templates and Slides will bullet point your ideas. See them fall into place one by one. Present our Future PowerPoint Templates because Our PowerPoint Templates and Slides will definately Enhance the stature of your presentation. Adorn the beauty of your thoughts with their colourful backgrounds.Use these PowerPoint slides for presentations relating to Agenda, agendum, arrow, art, bar, board, business, button, calendar, chart, data,design, developments, diagram, economics, elements, graph, graphics, growth,icon, illustration, infochart, infographic, infomation, information, life, meeting,modern, month, number, organizer, pointer, presentation, proceedings,report, set, sign, statistic, structure, symbol, tag, time, timeframe, timeline, vector, visualization. The prominent colors used in the PowerPoint template are Blue light, Gray, White. Concentrate on the assignment with our Business Charts Graphical Timeline Diagram With Photos PowerPoint Slides. Don't give a fig about other issues.
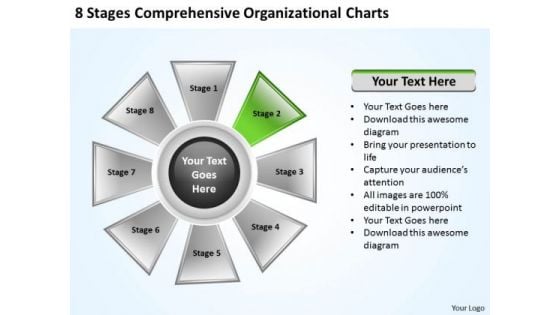
Business Concepts 8 Stages Comprehensive Organizational Charts Marketing Strategy
We present our business concepts 8 stages comprehensive organizational charts marketing strategy.Use our Advertising PowerPoint Templates because It can Bubble and burst with your ideas. Use our Business PowerPoint Templates because Our PowerPoint Templates and Slides are aesthetically designed to attract attention. We gaurantee that they will grab all the eyeballs you need. Use our Process and Flows PowerPoint Templates because It will Raise the bar of your Thoughts. They are programmed to take you to the next level. Present our Circle Charts PowerPoint Templates because You have the co-ordinates for your destination of success. Let our PowerPoint Templates and Slides map out your journey. Use our Shapes PowerPoint Templates because Our PowerPoint Templates and Slides will let you Illuminate the road ahead to Pinpoint the important landmarks along the way.Use these PowerPoint slides for presentations relating to Application, brainstorming, business, chart, circle, circular, clipart, closing, concept, diagram, flowchart, graph, graphic, illustration, infographic, insurance, loan, mortgage, pre-closing, pre-qualification, process, processing, stage, steps, symbol, text, underwriting, vector, visualization. The prominent colors used in the PowerPoint template are Green, White, Gray. Do a commendable job with our Business Concepts 8 Stages Comprehensive Organizational Charts Marketing Strategy. Your audience will keep clapping for you.
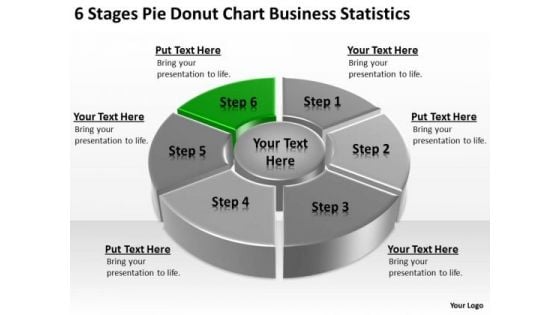
Chart Free Business PowerPoint Templates Statistics Ppt Subway Plan Slides
We present our chart free business powerpoint templates statistics ppt subway plan Slides.Download our Success PowerPoint Templates because Our PowerPoint Templates and Slides will let you Hit the target. Go the full distance with ease and elan. Download and present our Finance PowerPoint Templates because Our PowerPoint Templates and Slides are aesthetically designed to attract attention. We gaurantee that they will grab all the eyeballs you need. Present our Arrows PowerPoint Templates because It will Raise the bar of your Thoughts. They are programmed to take you to the next level. Download and present our Circle Charts PowerPoint Templates because Our PowerPoint Templates and Slides are created by a hardworking bunch of busybees. Always flitting around with solutions gauranteed to please. Present our Business PowerPoint Templates because Our PowerPoint Templates and Slides will let you Hit the right notes. Watch your audience start singing to your tune.Use these PowerPoint slides for presentations relating to Chart, wheel, pie, graph, vector, process, marketing, diagram, business, catalog, website, network, statistics, model, document, junction, plan, presentation, template, circle, brochure, data, stock, management, box, options, direction, design, company, navigation, financial, structure, button, goals, results. The prominent colors used in the PowerPoint template are Green, Black, Gray. Enthuse your audience with our Chart Free Business PowerPoint Templates Statistics Ppt Subway Plan Slides. You will come out on top.
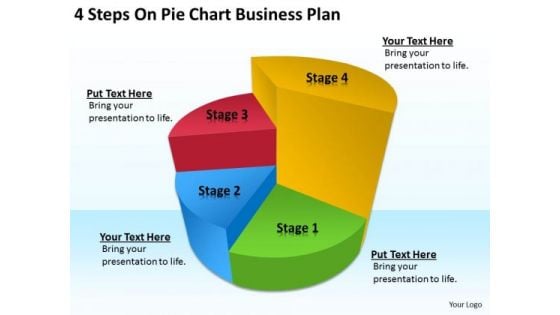
4 Steps On Pie Chart Business Plan Sample PowerPoint Templates
We present our 4 steps on pie chart business plan sample PowerPoint templates.Use our Flow Charts PowerPoint Templates because Your success is our commitment. Our PowerPoint Templates and Slides will ensure you reach your goal. Use our Process and Flows PowerPoint Templates because Our PowerPoint Templates and Slides will let you Hit the target. Go the full distance with ease and elan. Present our Marketing PowerPoint Templates because you can Set pulses racing with our PowerPoint Templates and Slides. They will raise the expectations of your team. Download our Success PowerPoint Templates because Our PowerPoint Templates and Slides help you meet the demand of the Market. Just browse and pick the slides that appeal to your intuitive senses. Download our Business PowerPoint Templates because Our PowerPoint Templates and Slides will let you Illuminate the road ahead to Pinpoint the important landmarks along the way.Use these PowerPoint slides for presentations relating to Chart, pie, bar, business, percent, forecasting, economy, piechart, white, achievement, future, sign, symbol, chartgraph, diagram, styles, finance, data, stock,report, marketing, analyzing, shape, graph, modern, economic, up, stair, money, solution, design, growth, colorful, progress, profit, inspiration,background, investment, successful, growthbusiness, prosperity, improvement, financial, concepts, structure, ideas. The prominent colors used in the PowerPoint template are Red, Yellow, Blue. Our 4 Steps On Pie Chart Business Plan Sample PowerPoint Templates are like angels. They take extraordinary care of your thoughts.
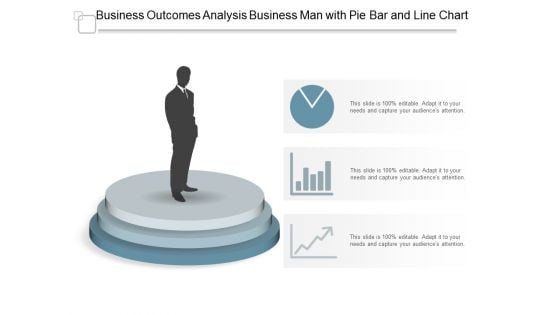
Business Outcomes Analysis Business Man With Pie Bar And Line Chart Ppt PowerPoint Presentation Professional Graphics Download
Presenting this set of slides with name business outcomes analysis business man with pie bar and line chart ppt powerpoint presentation professional graphics download. This is a three stage process. The stages in this process are business outcomes, business results, business output. This is a completely editable PowerPoint presentation and is available for immediate download. Download now and impress your audience.
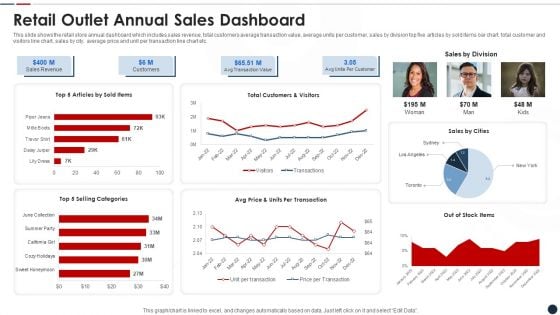
Retail Outlet Annual Sales Dashboard Elements PDF
This slide shows the retail store annual dashboard which includes sales revenue, total customers average transaction value, average units per customer, sales by division top five articles by sold items bar chart, total customer and visitors line chart, sales by city, average price and unit per transaction line chart etc.Pitch your topic with ease and precision using this retail outlet annual sales dashboard elements pdf This layout presents information on Retail outlet annual sales dashboard It is also available for immediate download and adjustment. So, changes can be made in the color, design, graphics or any other component to create a unique layout.
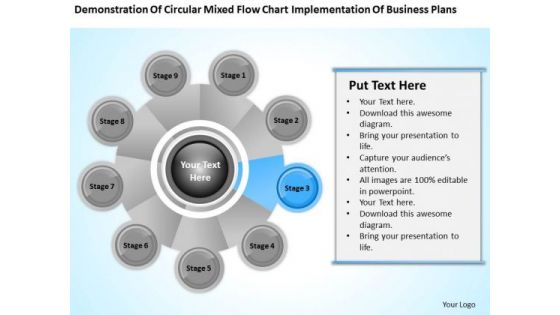
Business Process Flow Diagram Chart Implementation Plan Ppt PowerPoint Slides
We present our business process flow diagram chart implementation plan ppt PowerPoint Slides.Use our Process and Flows PowerPoint Templates because You are an avid believer in ethical practices. Highlight the benefits that accrue with our PowerPoint Templates and Slides. Use our Circle Charts PowerPoint Templates because Our PowerPoint Templates and Slides have the Brilliant backdrops. Guaranteed to illuminate the minds of your audience. Present our Flow Chart PowerPoint Templates because It will Raise the bar of your Thoughts. They are programmed to take you to the next level. Present our Shapes PowerPoint Templates because You should Ascend the ladder of success with ease. Our PowerPoint Templates and Slides will provide strong and sturdy steps. Download and present our Business PowerPoint Templates because Our PowerPoint Templates and Slides will let you Leave a lasting impression to your audiences. They possess an inherent longstanding recall factor.Use these PowerPoint slides for presentations relating to Chart, flow, vector, flowchart, circular, position, diagram elements, segment, diagram vector, business, concept, sign, diagram chart, presentation, diagram, circle, graphic, description, element, shape, cycle, circulation, illustration, diagram circle, business, section, web, direction, design, color, text , brainstorm, background, fresh, present. The prominent colors used in the PowerPoint template are Blue, Black, Gray. Gain entry into a special world. Our Business Process Flow Diagram Chart Implementation Plan Ppt PowerPoint Slides will ease the passage.
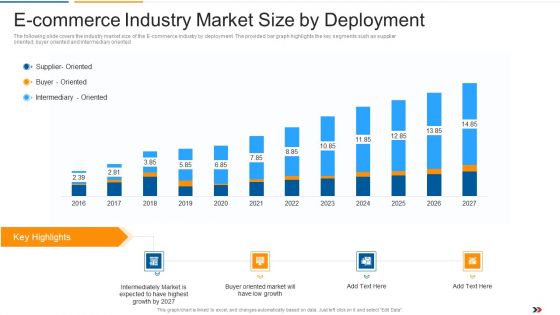
E Commerce Industry Market Size By Deployment Ecommerce Startup Capital Raising Elevator Structure Pdf
The following slide covers the industry market size of the E-commerce industry by deployment. The provided bar graph highlights the key segments such as supplier oriented, buyer oriented and intermediary oriented. Deliver an awe inspiring pitch with this creative e commerce industry market size by deployment ecommerce startup capital raising elevator structure pdf bundle. Topics like e commerce industry market size by deployment can be discussed with this completely editable template. It is available for immediate download depending on the needs and requirements of the user.
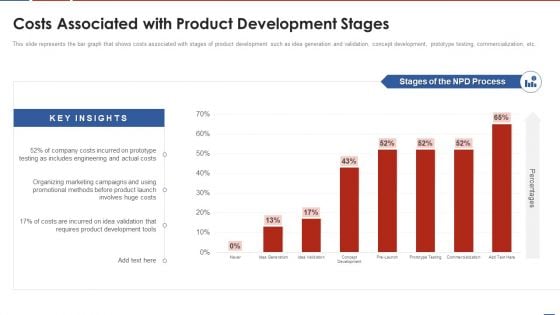
Formulating Product Development Action Plan To Enhance Client Experience Costs Associated With Product Diagrams PDF
This slide represents the bar graph that shows costs associated with stages of product development such as idea generation and validation, concept development, prototype testing, commercialization, etc. Deliver and pitch your topic in the best possible manner with this formulating product development action plan to enhance client experience costs associated with product diagrams pdf. Use them to share invaluable insights on development, costs, organizing, marketing, campaigns and impress your audience. This template can be altered and modified as per your expectations. So, grab it now.
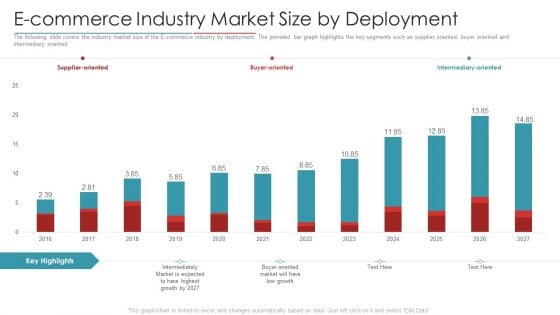
Digital Marketing Business Investor Funding Pitch Deck E Commerce Industry Market Size By Deployment Background PDF
The following slide covers the industry market size of the E-commerce industry by deployment. The provided bar graph highlights the key segments such as supplier oriented, buyer oriented and intermediary oriented Deliver an awe inspiring pitch with this creative digital marketing business investor funding pitch deck e commerce industry market size by deployment background pdf bundle. Topics like e commerce industry market size by deployment can be discussed with this completely editable template. It is available for immediate download depending on the needs and requirements of the user.
Performance Analysis Of New Product Development Total Number Of Units Sold By The Product Icons PDF
The following slide displays the total number of units sold by the organization, the provided bar graph displays the various months and total units in million sold in each. Deliver an awe inspiring pitch with this creative performance analysis of new product development total number of units sold by the product icons pdf bundle. Topics like total number of units sold by the product can be discussed with this completely editable template. It is available for immediate download depending on the needs and requirements of the user.
Project Budget Planning Summary With Planned And Actual Cost Details Icons PDF
This slide covers table with bar graph of planned vs actual cost and deviation. It also includes type of costs such as planned cost, actual cost and value difference. Showcasing this set of slides titled project budget planning summary with planned and actual cost details icons pdf. The topics addressed in these templates are planned vs actual cost, deviation. All the content presented in this PPT design is completely editable. Download it and make adjustments in color, background, font etc. as per your unique business setting.
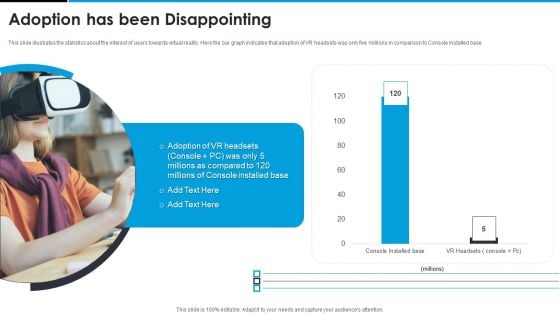
Sandbox VR Venture Capital Financing Pitch Deck Adoption Has Been Disappointing Information PDF
This slide illustrates the statistics about the interest of users towards virtual reality. Here the bar graph indicates that adoption of VR headsets was only five millions in comparison to Console installed base. Deliver an awe inspiring pitch with this creative sandbox vr venture capital financing pitch deck adoption has been disappointing information pdf bundle. Topics like adoption has been disappointing can be discussed with this completely editable template. It is available for immediate download depending on the needs and requirements of the user.
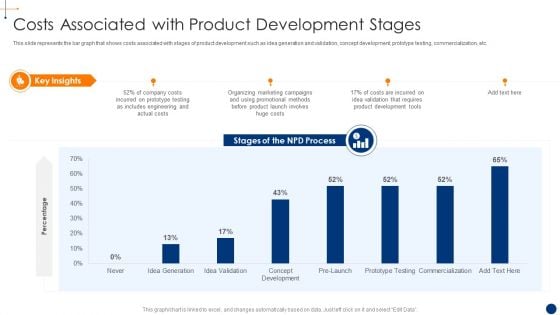
New Product Development Process Optimization Costs Associated With Product Pictures PDF
This slide represents the bar graph that shows costs associated with stages of product development such as idea generation and validation, concept development, prototype testing, commercialization, etc. Deliver and pitch your topic in the best possible manner with this new product development process optimization automating sales related activities diagrams pdf . Use them to share invaluable insights on automating sales related activities to accelerate product delivery and impress your audience. This template can be altered and modified as per your expectations. So, grab it now.
Netflix Capital Funding Elevator Pitch Deck Understanding Our Competition Cond Icons PDF
Purpose of the following slide is to show the result of general population survey of preference over OTT platforms, as it displays a bar graph that highlights the customer and their preference in the OTT platform Department Deliver and pitch your topic in the best possible manner with this netflix capital funding elevator pitch deck understanding our competition cond icons pdf. Use them to share invaluable insights on understanding our competition and impress your audience. This template can be altered and modified as per your expectations. So, grab it now.
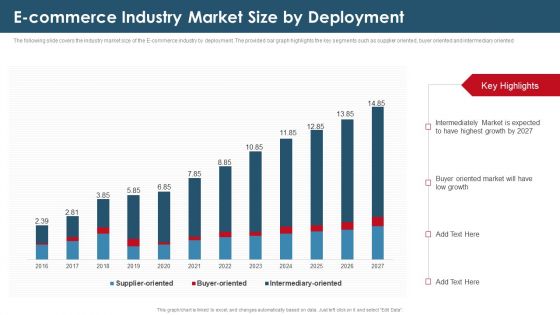
Investor Capital Raising Elevator E Commerce Industry Market Size By Deployment Elements PDF
The following slide covers the industry market size of the E-commerce industry by deployment. The provided bar graph highlights the key segments such as supplier oriented, buyer oriented and intermediary oriented. Deliver and pitch your topic in the best possible manner with this investor capital raising elevator e commerce industry market size by deployment elements pdf. Use them to share invaluable insights on supplier oriented, buyer oriented, intermediary oriented and impress your audience. This template can be altered and modified as per your expectations. So, grab it now.
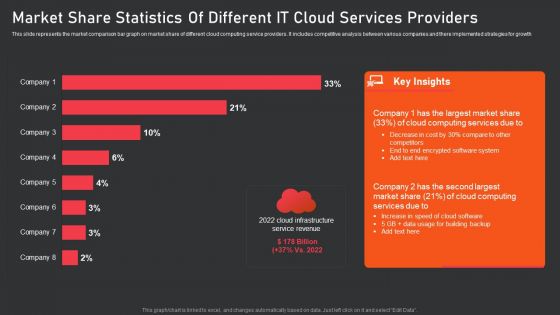
Market Share Statistics Of Different IT Cloud Services Providers Topics PDF
This slide represents the market comparison bar graph on market share of different cloud computing service providers. It includes competitive analysis between various companies and there implemented strategies for growth. Showcasing this set of slides titled market share statistics of different it cloud services providers topics pdf. The topics addressed in these templates are largest market share, cloud computing services. All the content presented in this PPT design is completely editable. Download it and make adjustments in color, background, font etc. as per your unique business setting.
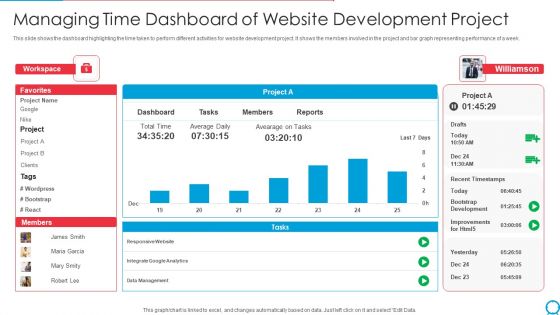
Managing Time Dashboard Of Website Development Project Ppt PowerPoint Presentation Gallery Outline PDF
This slide shows the dashboard highlighting the time taken to perform different activities for website development project. It shows the members involved in the project and bar graph representing performance of a week. Showcasing this set of slides titled managing time dashboard of website development project ppt powerpoint presentation gallery outline pdf. The topics addressed in these templates are workspace, project, data management, recent timestamps. All the content presented in this PPT design is completely editable. Download it and make adjustments in color, background, font etc. as per your unique business setting.

Monthly Cost Comparative Analysis Of Advertising Expenditure Introduction PDF
This slide represents the bar graph on marketing monthly cost comparative analysis for increasing organisation revenue. It includes methods like online, catalogues, conventions, trade shows, print, radio and magazines Pitch your topic with ease and precision using this Monthly Cost Comparative Analysis Of Advertising Expenditure Introduction PDF This layout presents information on Monthly Cost Comparative Analysis Of Advertising Expenditure It is also available for immediate download and adjustment. So, changes can be made in the color, design, graphics or any other component to create a unique layout.
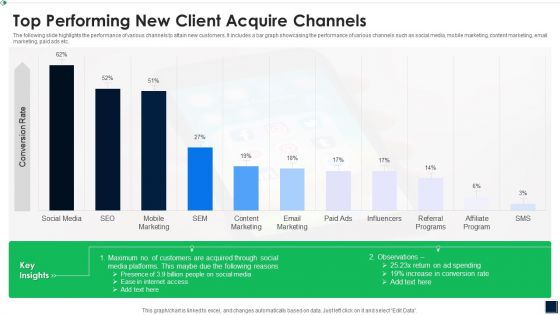
Top Performing New Client Acquire Channels Elements PDF
The following slide highlights the performance of various channels to attain new customers. It includes a bar graph showcasing the performance of various channels such as social media, mobile marketing, content marketing, email marketing, paid ads etc. Showcasing this set of slides titled Top Performing New Client Acquire Channels Elements PDF The topics addressed in these templates are Top Performing New Client Acquire Channels All the content presented in this PPT design is completely editable. Download it and make adjustments in color, background, font etc. as per your unique business setting.
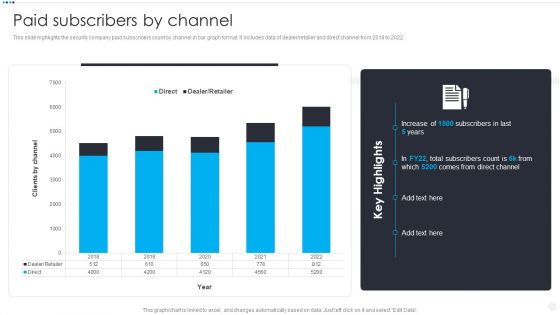
Smart Home Security Solutions Company Profile Paid Subscribers By Channel Clipart PDF
This slide highlights the security company paid subscribers count by channel in bar graph format. It includes data of dealer or retailer and direct channel from 2018 to 2022. Deliver an awe inspiring pitch with this creative Smart Home Security Solutions Company Profile Paid Subscribers By Channel Clipart PDF bundle. Topics like Direct Dealer Retailer, 2018 To 2022, Clients By Channel can be discussed with this completely editable template. It is available for immediate download depending on the needs and requirements of the user.
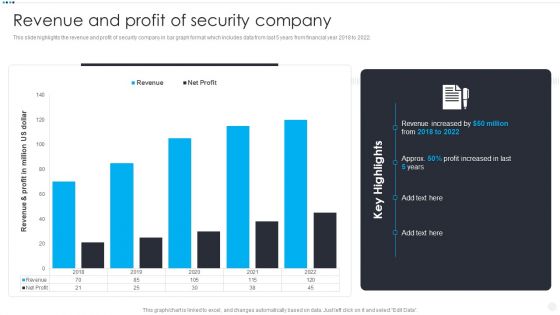
Smart Home Security Solutions Company Profile Revenue And Profit Of Security Company Elements PDF
This slide highlights the revenue and profit of security company in bar graph format which includes data from last 5 years from financial year 2018 to 2022. Deliver and pitch your topic in the best possible manner with this Smart Home Security Solutions Company Profile Revenue And Profit Of Security Company Elements PDF. Use them to share invaluable insights on Revenue And Profit, Million US Dollar, Revenue Increased Profit and impress your audience. This template can be altered and modified as per your expectations. So, grab it now.
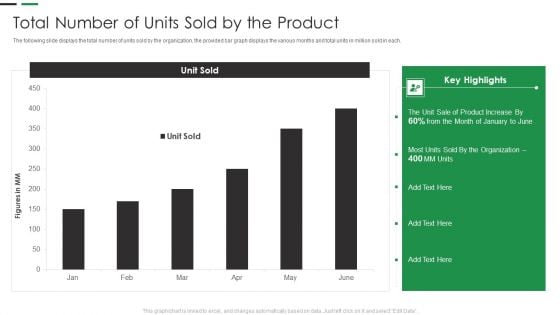
Evaluating New Commodity Impact On Market Total Number Of Units Sold By The Product Clipart PDF
The following slide displays the total number of units sold by the organization, the provided bar graph displays the various months and total units in million sold in each.Deliver and pitch your topic in the best possible manner with this Evaluating New Commodity Impact On Market Total Number Of Units Sold By The Product Clipart PDF Use them to share invaluable insights on Product Increase, Total Units, Sold Product and impress your audience. This template can be altered and modified as per your expectations. So, grab it now.
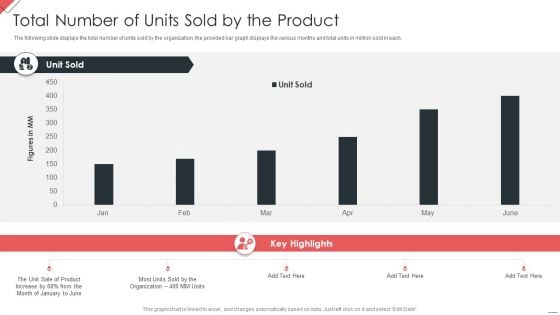
New Commodity Market Viability Review Total Number Of Units Sold By The Product Guidelines PDF
The following slide displays the total number of units sold by the organization, the provided bar graph displays the various months and total units in million sold in each.Deliver and pitch your topic in the best possible manner with this New Commodity Market Viability Review Total Number Of Units Sold By The Product Guidelines PDF Use them to share invaluable insights on Key Highlights, Total Units, Sold Product and impress your audience. This template can be altered and modified as per your expectations. So, grab it now.
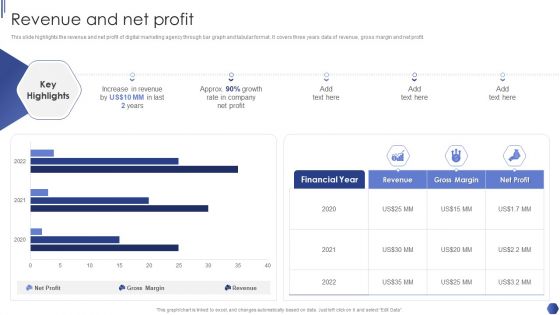
Digital Marketing Agency Business Profile Revenue And Net Profit Diagrams PDF
This slide highlights the revenue and net profit of digital marketing agency through bar graph and tabular format. It covers three years data of revenue, gross margin and net profit. Deliver and pitch your topic in the best possible manner with this Digital Marketing Agency Business Profile Revenue And Net Profit Diagrams PDF. Use them to share invaluable insights on Increase In Revenue, Growth Rate, Net Profit and impress your audience. This template can be altered and modified as per your expectations. So, grab it now.
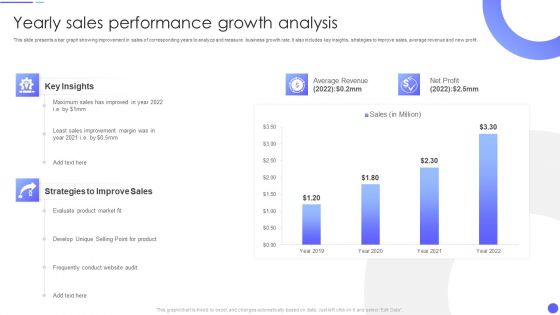
Yearly Sales Performance Growth Analysis Rules PDF
This slide presents a bar graph showing improvement in sales of corresponding years to analyze and measure business growth rate. It also includes key insights, strategies to improve sales, average revenue and new profit.Pitch your topic with ease and precision using this Yearly Sales Performance Growth Analysis Rules PDF This layout presents information on Average Revenue, Strategies To Improve, Sales Improvement It is also available for immediate download and adjustment. So, changes can be made in the color, design, graphics or any other component to create a unique layout.
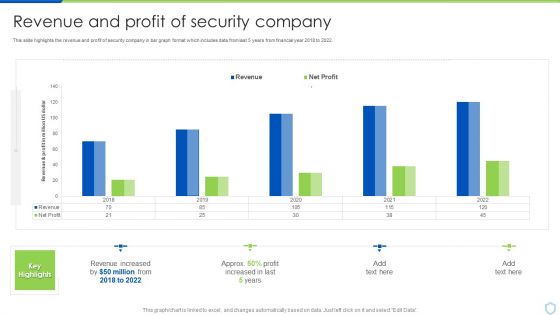
Security And Surveillance Company Profile Revenue And Profit Of Security Company Microsoft PDF
This slide highlights the revenue and profit of security company in bar graph format which includes data from last 5 years from financial year 2018 to 2022.Deliver and pitch your topic in the best possible manner with this Security And Surveillance Company Profile Revenue And Profit Of Security Company Microsoft PDF. Use them to share invaluable insights on Revenue Increased, Increased In Last, Key Highlights and impress your audience. This template can be altered and modified as per your expectations. So, grab it now.
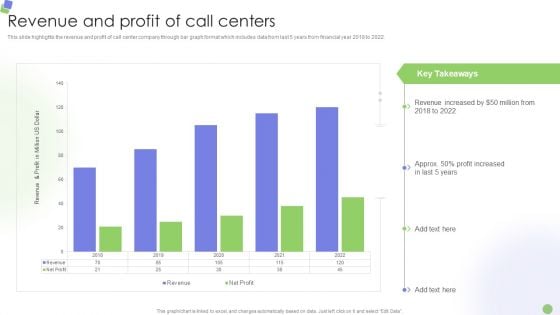
Knowledge Process Outsourcing Company Profile Revenue And Profit Of Call Centers Diagrams PDF
This slide highlights the revenue and profit of call center company through bar graph format which includes data from last 5 years from financial year 2018 to 2022.Deliver and pitch your topic in the best possible manner with this Knowledge Process Outsourcing Company Profile Revenue And Profit Of Call Centers Diagrams PDF. Use them to share invaluable insights on Revenue Increased, Profit Increased, Key Takeaways and impress your audience. This template can be altered and modified as per your expectations. So, grab it now.
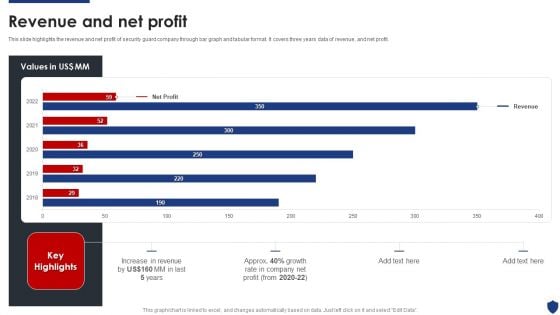
Security Officer Service Company Profile Revenue And Net Profit Ppt PowerPoint Presentation Gallery Graphic Images PDF
This slide highlights the revenue and net profit of security guard company through bar graph and tabular format. It covers three years data of revenue, and net profit. Deliver an awe inspiring pitch with this creative Security Officer Service Company Profile Revenue And Net Profit Ppt PowerPoint Presentation Gallery Graphic Images PDF bundle. Topics like Net Profit, Increase Revenue, 2018 To 2022 can be discussed with this completely editable template. It is available for immediate download depending on the needs and requirements of the user.
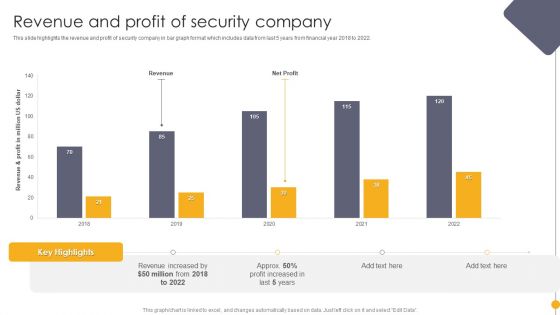
Portable Home Safety Systems Company Profile Revenue And Profit Of Security Company Ideas PDF
This slide highlights the revenue and profit of security company in bar graph format which includes data from last 5 years from financial year 2018 to 2022. Deliver and pitch your topic in the best possible manner with this Portable Home Safety Systems Company Profile Revenue And Profit Of Security Company Ideas PDF. Use them to share invaluable insights on Revenue Increased, 2018 To 2022, Profit Increased and impress your audience. This template can be altered and modified as per your expectations. So, grab it now.
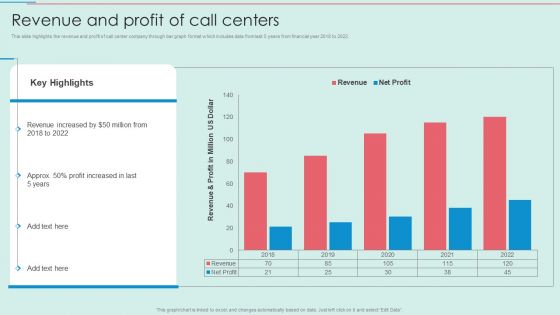
BPO Call Center Company Profile Revenue And Profit Of Call Centers Template PDF
This slide highlights the revenue and profit of call center company through bar graph format which includes data from last 5 years from financial year 2018 to 2022.Deliver and pitch your topic in the best possible manner with this BPO Call Center Company Profile Revenue And Profit Of Call Centers Template PDF. Use them to share invaluable insights on Revenue Increased, Profit Increased, Profit Million and impress your audience. This template can be altered and modified as per your expectations. So, grab it now.
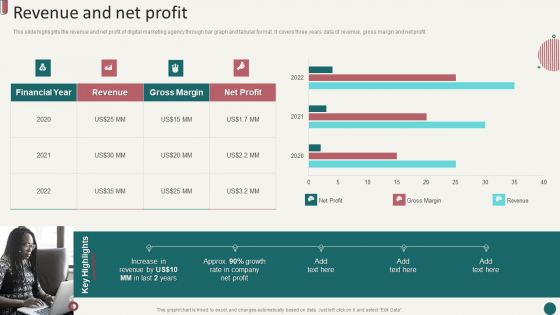
Social Media Marketing Company Profile Revenue And Net Profit Ppt Summary Gallery PDF
This slide highlights the revenue and net profit of digital marketing agency through bar graph and tabular format. It covers three years data of revenue, gross margin and net profit. Deliver and pitch your topic in the best possible manner with this Social Media Marketing Company Profile Revenue And Net Profit Ppt Summary Gallery PDF. Use them to share invaluable insights on Financial Year, Revenue, Gross Margin and impress your audience. This template can be altered and modified as per your expectations. So, grab it now.

Commercial And Urban Architect Business Profile Company Revenue And Profit For 2017 And 2022 Introduction PDF
This slide highlights the company revenue and profit increases with supply chain planning and automation which includes data of 2018 and 2022 through bar graph. Deliver and pitch your topic in the best possible manner with this Commercial And Urban Architect Business Profile Company Revenue And Profit For 2017 And 2022 Introduction PDF. Use them to share invaluable insights on Additional Costs, Revenue Increased, Profits and impress your audience. This template can be altered and modified as per your expectations. So, grab it now.
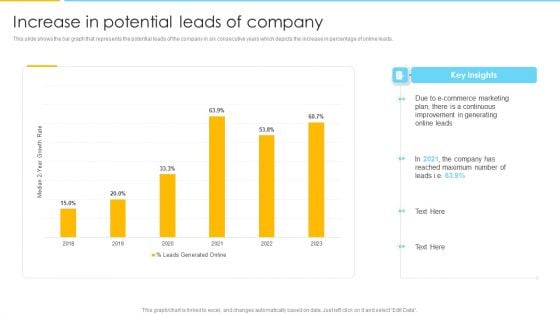
Optimizing Ecommerce Marketing Plan To Improve Sales Increase In Potential Leads Of Company Background PDF
This slide shows the bar graph that represents the potential leads of the company in six consecutive years which depicts the increase in percentage of online leads. Deliver an awe inspiring pitch with this creative Optimizing Ecommerce Marketing Plan To Improve Sales Increase In Potential Leads Of Company Background PDF bundle. Topics like E Commerce Marketing Plan, Potential Leads Of Company can be discussed with this completely editable template. It is available for immediate download depending on the needs and requirements of the user.
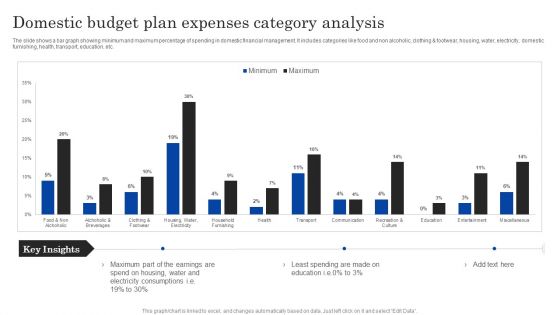
Domestic Budget Plan Expenses Category Analysis Ppt PowerPoint Presentation Layouts Inspiration PDF
The slide shows a bar graph showing minimum and maximum percentage of spending in domestic financial management. It includes categories like food and non alcoholic, clothing and footwear, housing, water, electricity, domestic furnishing, health, transport, education, etc.Showcasing this set of slides titled Domestic Budget Plan Expenses Category Analysis Ppt PowerPoint Presentation Layouts Inspiration PDF. The topics addressed in these templates are Part Earnings, Electricity Consumptions, Least Spending. All the content presented in this PPT design is completely editable. Download it and make adjustments in color, background, font etc. as per your unique business setting.
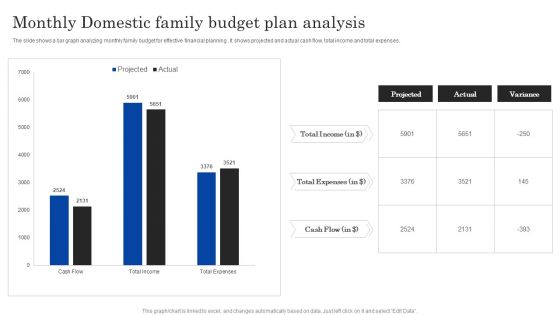
Monthly Domestic Family Budget Plan Analysis Ppt PowerPoint Presentation Portfolio Guide PDF
The slide shows a bar graph analyzing monthly family budget for effective financial planning . It shows projected and actual cash flow, total income and total expenses.Showcasing this set of slides titled Monthly Domestic Family Budget Plan Analysis Ppt PowerPoint Presentation Portfolio Guide PDF. The topics addressed in these templates are Total Income, Total Expenses, Cash Flow. All the content presented in this PPT design is completely editable. Download it and make adjustments in color, background, font etc. as per your unique business setting.
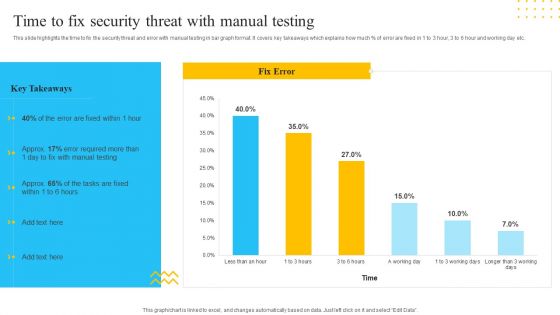
IT Security Automation Tools Integration Time To Fix Security Threat With Manual Testing Template PDF
This slide highlights the time to fix the security threat and error with manual testing in bar graph format. It covers key takeaways which explains how much percent of error are fixed in 1 to 3 hour, 3 to 6 hour and working day etc. Deliver and pitch your topic in the best possible manner with this IT Security Automation Tools Integration Time To Fix Security Threat With Manual Testing Template PDF. Use them to share invaluable insights on Manual Testing, Fix Error, 3 Working Days and impress your audience. This template can be altered and modified as per your expectations. So, grab it now.
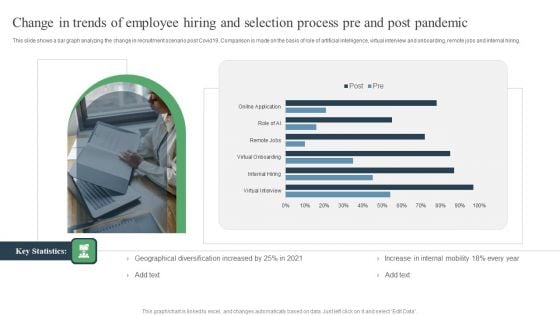
Change In Trends Of Employee Hiring And Selection Process Pre And Post Pandemic Ppt PowerPoint Presentation Images PDF
This slide shows a bar graph analyzing the change in recruitment scenario post Covid19. Comparison is made on the basis of role of artificial intelligence, virtual interview and onboarding, remote jobs and internal hiring. Showcasing this set of slides titled Change In Trends Of Employee Hiring And Selection Process Pre And Post Pandemic Ppt PowerPoint Presentation Images PDF. The topics addressed in these templates are Geographical Diversification, Internal Mobility, Virtual Onboarding. All the content presented in this PPT design is completely editable. Download it and make adjustments in color, background, font etc. as per your unique business setting.
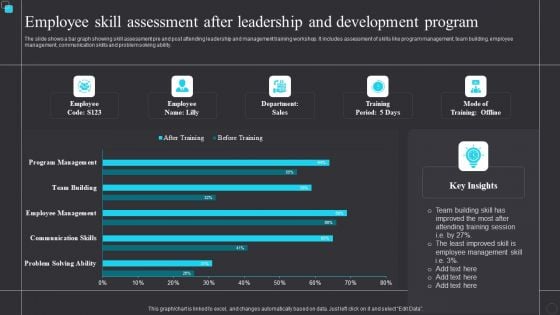
Employee Skill Assessment After Leadership And Development Program Themes PDF
The slide shows a bar graph showing skill assessment pre and post attending leadership and management training workshop. It includes assessment of skills like program management, team building, employee management, communication skills and problem solving ability. Showcasing this set of slides titled Employee Skill Assessment After Leadership And Development Program Themes PDF. The topics addressed in these templates are Team, Employee Management. All the content presented in this PPT design is completely editable. Download it and make adjustments in color, background, font etc. as per your unique business setting.
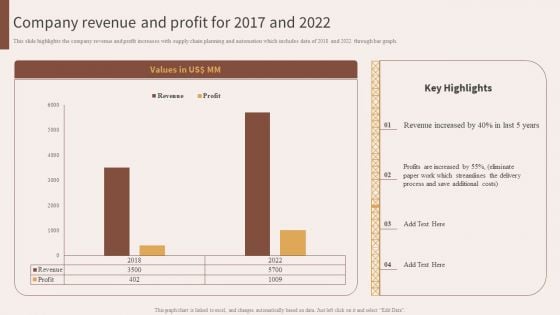
Company Revenue And Profit For 2017 And 2022 Structure PDF
This slide highlights the company revenue and profit increases with supply chain planning and automation which includes data of 2018 and 2022 through bar graph. Boost your pitch with our creative Company Revenue And Profit For 2017 And 2022 Structure PDF. Deliver an awe-inspiring pitch that will mesmerize everyone. Using these presentation templates you will surely catch everyones attention. You can browse the ppts collection on our website. We have researchers who are experts at creating the right content for the templates. So you do not have to invest time in any additional work. Just grab the template now and use them.
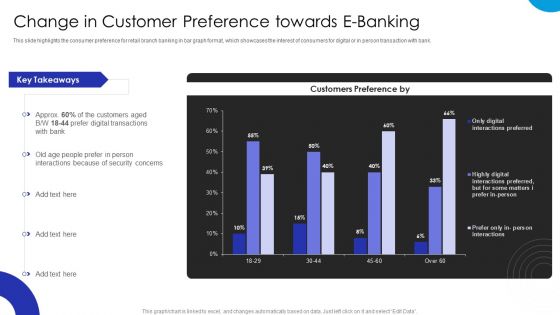
Operational Innovation In Banking Change In Customer Preference Towards E Banking Demonstration PDF
This slide highlights the consumer preference for retail branch banking in bar graph format, which showcases the interest of consumers for digital or in person transaction with bank. Want to ace your presentation in front of a live audience Our Operational Innovation In Banking Change In Customer Preference Towards E Banking Demonstration PDF can help you do that by engaging all the users towards you. Slidegeeks experts have put their efforts and expertise into creating these impeccable powerpoint presentations so that you can communicate your ideas clearly. Moreover, all the templates are customizable, and easy-to-edit and downloadable. Use these for both personal and commercial use.
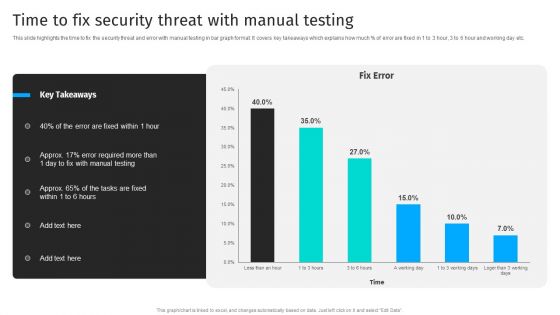
Security Automation To Analyze And Mitigate Cyberthreats Time To Fix Security Threat Ideas PDF
This slide highlights the time to fix the security threat and error with manual testing in bar graph format. It covers key takeaways which explains how much of error are fixed in 1 to 3 hour, 3 to 6 hour and working day etc.The best PPT templates are a great way to save time, energy, and resources. Slidegeeks have 100 precent editable powerpoint slides making them incredibly versatile. With these quality presentation templates, you can create a captivating and memorable presentation by combining visually appealing slides and effectively communicating your message. Download Security Automation To Analyze And Mitigate Cyberthreats Time To Fix Security Threat Ideas PDF from Slidegeeks and deliver a wonderful presentation.
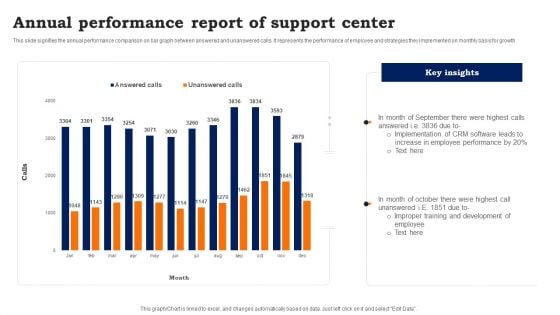
Annual Performance Report Of Support Center Inspiration PDF
This slide signifies the annual performance comparison on bar graph between answered and unanswered calls. It represents the performance of employee and strategies they implemented on monthly basis for growth. Showcasing this set of slides titled Annual Performance Report Of Support Center Inspiration PDF. The topics addressed in these templates are Annual Performance, Report Of Support Center. All the content presented in this PPT design is completely editable. Download it and make adjustments in color, background, font etc. as per your unique business setting.


 Continue with Email

 Home
Home


