Icon Revenue
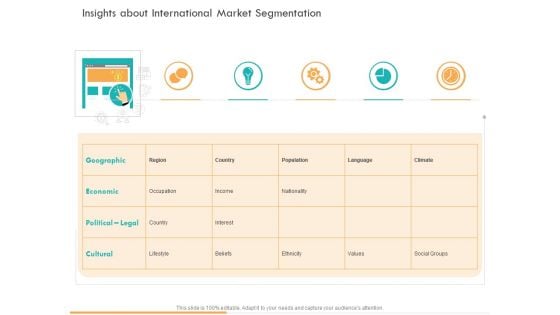
Business Planning And Strategy Playbook Insights About International Market Segmentation Themes PDF
Deliver an awe-inspiring pitch with this creative business planning and strategy playbook insights about international market segmentation themes pdf bundle. Topics like geographic, economic, political legal, cultural, occupation, income can be discussed with this completely editable template. It is available for immediate download depending on the needs and requirements of the user.
3d Complex Diagram Business Flow Chart PowerPoint Templates Ppt Backgrounds For Slides 0113
We present our 3d Complex Diagram Business Flow Chart PowerPoint Templates PPT Backgrounds For Slides 0113.Download and present our Business PowerPoint Templates because It will mark the footprints of your journey. Illustrate how they will lead you to your desired destination. Use our Process and Flows PowerPoint Templates because You should Press the right buttons with our PowerPoint Templates and Slides. They will take your ideas down the perfect channel. Download and present our Boxes PowerPoint Templates because You can Hit the nail on the head with our PowerPoint Templates and Slides. Embed your ideas in the minds of your audience. Use our Shapes PowerPoint Templates because It will Strengthen your hand with your thoughts. They have all the aces you need to win the day. Present our Marketing PowerPoint Templates because It can Conjure up grand ideas with our magical PowerPoint Templates and Slides. Leave everyone awestruck by the end of your presentation.Use these PowerPoint slides for presentations relating to Complex flowchart diagram, business, process and flows, boxes, shapes, marketing. The prominent colors used in the PowerPoint template are Green, Yellow, Black. Use our 3d Complex Diagram Business Flow Chart PowerPoint Templates PPT Backgrounds For Slides 0113 are visually appealing. We assure you our process PowerPoint templates and PPT Slides are designed to make your presentations professional. People tell us our 3d Complex Diagram Business Flow Chart PowerPoint Templates PPT Backgrounds For Slides 0113 are specially created by a professional team with vast experience. They diligently strive to come up with the right vehicle for your brilliant Ideas. The feedback we get is that our and PowerPoint templates and PPT Slides provide great value for your money. Be assured of finding the best projection to highlight your words. The feedback we get is that our 3d Complex Diagram Business Flow Chart PowerPoint Templates PPT Backgrounds For Slides 0113 are readymade to fit into any presentation structure. Use our flows PowerPoint templates and PPT Slides are topically designed to provide an attractive backdrop to any subject. Handle a delicate situation with our 3d Complex Diagram Business Flow Chart PowerPoint Templates Ppt Backgrounds For Slides 0113. Just download, type and present.
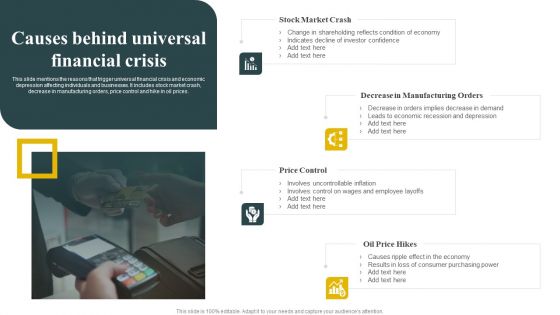
Causes Behind Universal Financial Crisis Download PDF
This slide mentions the reasons that trigger universal financial crisis and economic depression affecting individuals and businesses. It includes stock market crash, decrease in manufacturing orders, price control and hike in oil prices. Presenting Causes Behind Universal Financial Crisis Download PDF to dispense important information. This template comprises four stages. It also presents valuable insights into the topics including Stock Market Crash, Price Control, Oil Price Hikes. This is a completely customizable PowerPoint theme that can be put to use immediately. So, download it and address the topic impactfully.
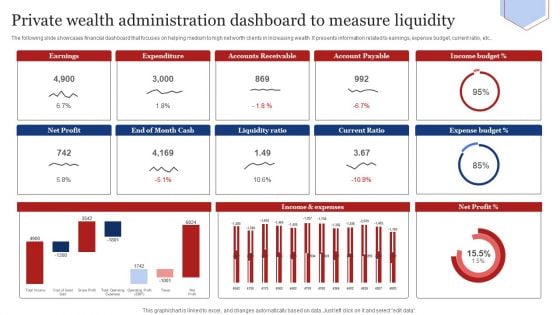
Private Wealth Administration Dashboard To Measure Liquidity Infographics PDF
The following slide showcases financial dashboard that focuses on helping medium to high net worth clients in increasing wealth. It presents information related to earnings, expense budget, current ratio, etc. Showcasing this set of slides titled Private Wealth Administration Dashboard To Measure Liquidity Infographics PDF. The topics addressed in these templates are Liquidity Ratio, Current Ratio, Expense Budget. All the content presented in this PPT design is completely editable. Download it and make adjustments in color, background, font etc. as per your unique business setting.
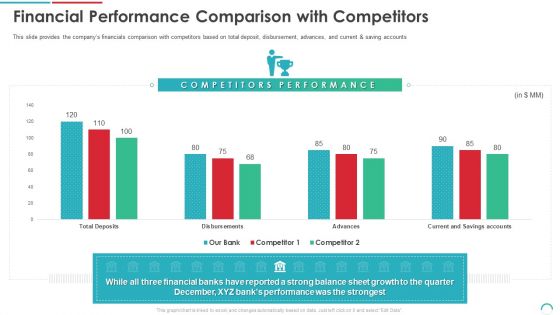
Post Initial Public Offering Equity Financing Pitch Financial Performance Comparison With Competitors Diagrams PDF
This slide provides the companys financials comparison with competitors based on total deposit, disbursement, advances, and current and saving accounts. Deliver an awe inspiring pitch with this creative post initial public offering equity financing pitch financial performance comparison with competitors diagrams pdf bundle. Topics like financial performance comparison with competitors can be discussed with this completely editable template. It is available for immediate download depending on the needs and requirements of the user.
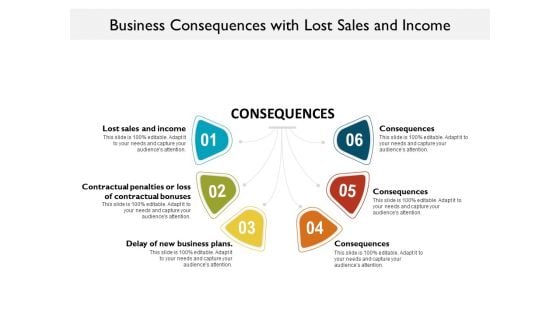
Business Consequences With Lost Sales And Income Ppt PowerPoint Presentation Inspiration Example File PDF
Presenting business consequences with lost sales and income ppt powerpoint presentation inspiration example file pdf to dispense important information. This template comprises six stages. It also presents valuable insights into the topics including lost sales and income, contractual consequences, delay new business plans. This is a completely customizable PowerPoint theme that can be put to use immediately. So, download it and address the topic impactfully.

Technology Transformation Trends In Financial Services Themes PDF
The following slide showcases trends that help meet regulatory deadlines, improve employee and customer experience for competitive edge. It presents information related to mobile banking, blockchain, etc. Presenting Technology Transformation Trends In Financial Services Themes PDF to dispense important information. This template comprises four stages. It also presents valuable insights into the topics including Enhance Customer Experience, Mobile Banking, Blockchain, Cloud Banking. This is a completely customizable PowerPoint theme that can be put to use immediately. So, download it and address the topic impactfully.
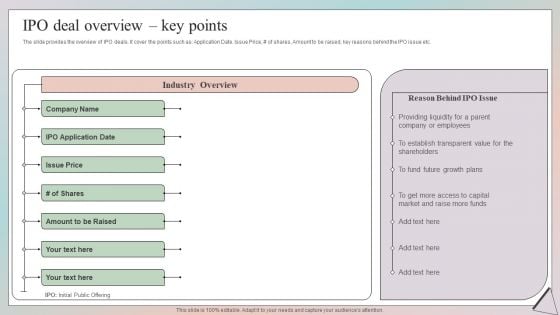
Grow Capital Through Equity Debt IPO Deal Overview Key Points Themes PDF
The slide provides the key points related to companys investments. It covers the key objectives of the investment i.e. share growth, strengthening competitive position and financials profile etc.Do you have to make sure that everyone on your team knows about any specific topic I yes, then you should give Grow Capital Through Equity Debt IPO Deal Overview Key Points Themes PDF a try. Our experts have put a lot of knowledge and effort into creating this impeccable Grow Capital Through Equity Debt IPO Deal Overview Key Points Themes PDF. You can use this template for your upcoming presentations, as the slides are perfect to represent even the tiniest detail. You can download these templates from the Slidegeeks website and these are easy to edit. So grab these today.
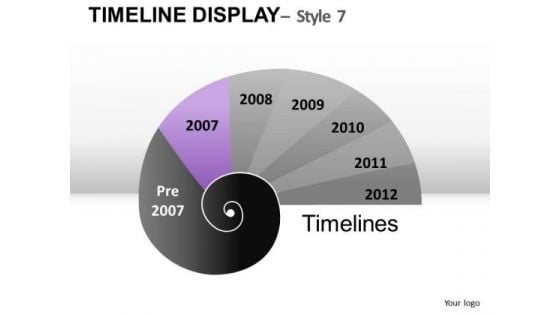
5 10 Year Forecast Planning PowerPoint Slides And Ppt Diagram Templates
5 10 Year Forecast Planning PowerPoint Slides And PPT Diagram Templates-These high quality, editable pre-designed powerpoint slides have been carefully created by our professional team to help you impress your audience. Each graphic in every slide is vector based and is 100% editable in powerpoint. Each and every property of any slide - color, size, shading etc can be modified to build an effective powerpoint presentation. Use these slides to convey complex business concepts in a simplified manner. Any text can be entered at any point in the powerpoint slide. Simply DOWNLOAD, TYPE and PRESENT! Locate problems with our 5 10 Year Forecast Planning PowerPoint Slides And Ppt Diagram Templates. Download without worries with our money back guaranteee.
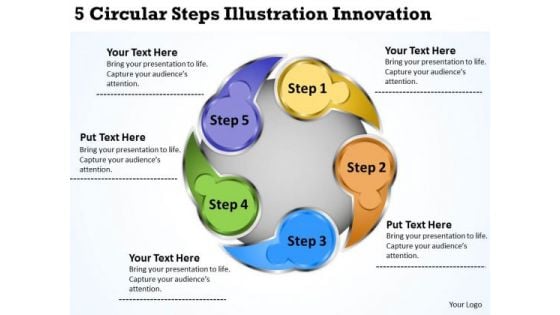
Business Logic Diagram 5 Circular Steps Illustration Innovation PowerPoint Slides
We present our business logic diagram 5 circular steps illustration innovation PowerPoint Slides.Download our Advertising PowerPoint Templates because You can Be the puppeteer with our PowerPoint Templates and Slides as your strings. Lead your team through the steps of your script. Use our Circle Charts PowerPoint Templates because It will Raise the bar of your Thoughts. They are programmed to take you to the next level. Present our Business PowerPoint Templates because Our PowerPoint Templates and Slides will provide weight to your words. They will bring out the depth of your thought process. Download our Shapes PowerPoint Templates because It will Give impetus to the hopes of your colleagues. Our PowerPoint Templates and Slides will aid you in winning their trust. Download our Arrows PowerPoint Templates because Our PowerPoint Templates and Slides are focused like a searchlight beam. They highlight your ideas for your target audience.Use these PowerPoint slides for presentations relating to Analysis, Arrow, Blue, Business, Chart, Circle, Circular, Cycle, Diagram, Five, Flow, Flow-Chart, Flowchart, Graphic, Green, Implementation, Infographic, Lifecycle, Model, Phase, Process, Red, Step, Work, Work-Flow, Workflow, Yellow. The prominent colors used in the PowerPoint template are Yellow, Orange, Green. Progress is inevitable with our Business Logic Diagram 5 Circular Steps Illustration Innovation PowerPoint Slides. Download without worries with our money back guaranteee.
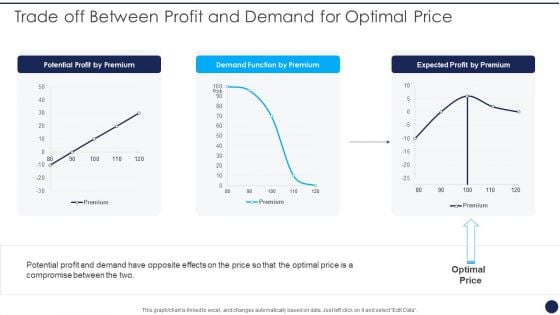
Product Pricing Strategies Analysis Trade Off Between Profit And Demand For Optimal Price Portrait PDF
This graph or chart is linked to excel, and changes automatically based on data. Just left click on it and select Edit Data. Deliver and pitch your topic in the best possible manner with this Product Pricing Strategies Analysis Trade Off Between Profit And Demand For Optimal Price Portrait PDF. Use them to share invaluable insights on Potential Profit Premium, Demand Function Premium and impress your audience. This template can be altered and modified as per your expectations. So, grab it now.

Identify Pieces 5 Stage Circle PowerPoint Slides And Ppt Diagram Templates
Identify pieces 5 stage circle PowerPoint Slides And PPT Diagram TemplatesThese high quality, editable pre-designed powerpoint slides have been carefully created by our professional team to help you impress your audience. Each graphic in every slide is vector based and is 100% editable in powerpoint. Each and every property of any slide - color, size, shading etc can be modified to build an effective powerpoint presentation. Use these slides to convey complex business concepts in a simplified manner. Any text can be entered at any point in the powerpoint slide. Simply DOWNLOAD, TYPE and PRESENT! Launch products with our Identify Pieces 5 Stage Circle PowerPoint Slides And Ppt Diagram Templates. Download without worries with our money back guaranteee.
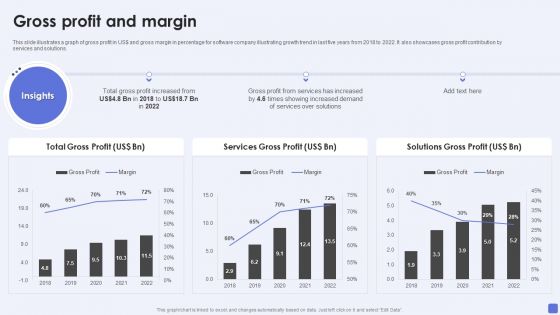
Software Services Business Profile Gross Profit And Margin Ppt PowerPoint Presentation Gallery Templates PDF
This slide illustrates a graph of gross profit in US dollar and gross margin in percentage for software company illustrating growth trend in last five years from 2018 to 2022. It also showcases gross profit contribution by services and solutions. Deliver an awe inspiring pitch with this creative Software Services Business Profile Gross Profit And Margin Ppt PowerPoint Presentation Gallery Templates PDF bundle. Topics like Total Gross Profit, Services Gross Profit, Solutions Gross Profit can be discussed with this completely editable template. It is available for immediate download depending on the needs and requirements of the user.
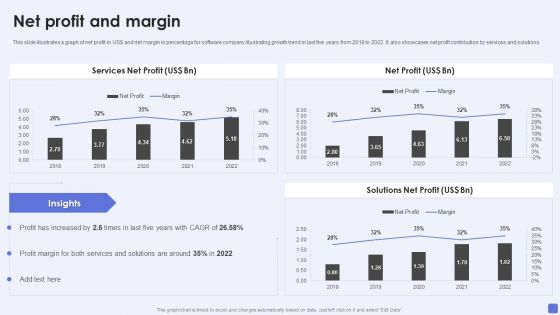
Software Services Business Profile Net Profit And Margin Ppt PowerPoint Presentation File Slides PDF
This slide illustrates a graph of net profit in US dollar and net margin in percentage for software company illustrating growth trend in last five years from 2018 to 2022. It also showcases net profit contribution by services and solutions. Deliver an awe inspiring pitch with this creative Software Services Business Profile Net Profit And Margin Ppt PowerPoint Presentation File Slides PDF bundle. Topics like Services Net Profit, Net Profit, Solutions Net Profit can be discussed with this completely editable template. It is available for immediate download depending on the needs and requirements of the user.
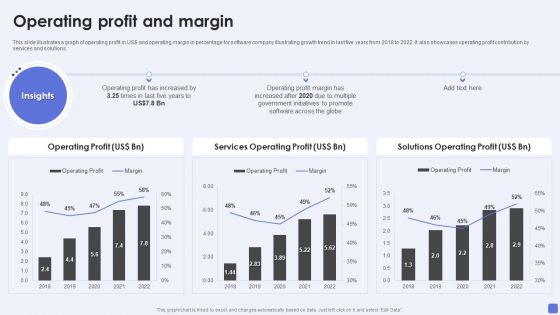
Software Services Business Profile Operating Profit And Margin Ppt PowerPoint Presentation Gallery Inspiration PDF
This slide illustrates a graph of operating profit in US dollar and operating margin in percentage for software company illustrating growth trend in last five years from 2018 to 2022. It also showcases operating profit contribution by services and solutions. Deliver and pitch your topic in the best possible manner with this Software Services Business Profile Operating Profit And Margin Ppt PowerPoint Presentation Gallery Inspiration PDF. Use them to share invaluable insights on Operating Profit, Services Operating Profit, Solutions Operating Profit and impress your audience. This template can be altered and modified as per your expectations. So, grab it now.
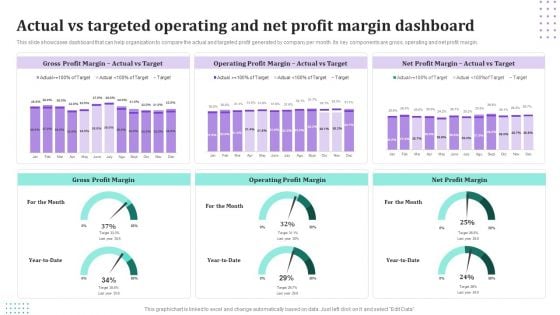
Actual Vs Targeted Operating And Net Profit Margin Dashboard Information PDF
This slide showcases dashboard that can help organization to compare the actual and targeted profit generated by company per month. Its key components are gross, operating and net profit margin. Showcasing this set of slides titled Actual Vs Targeted Operating And Net Profit Margin Dashboard Information PDF. The topics addressed in these templates are Gross Profit Margin, Operating Profit Margin, Net Profit Margin. All the content presented in this PPT design is completely editable. Download it and make adjustments in color, background, font etc. as per your unique business setting.
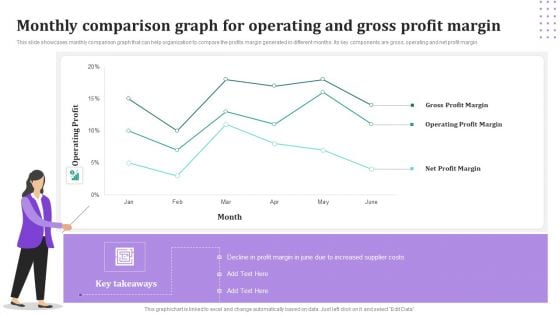
Monthly Comparison Graph For Operating And Gross Profit Margin Pictures PDF
This slide showcases monthly comparison graph that can help organization to compare the profits margin generated in different months. Its key components are gross, operating and net profit margin. Showcasing this set of slides titled Monthly Comparison Graph For Operating And Gross Profit Margin Pictures PDF. The topics addressed in these templates are Gross Profit Margin, Operating Profit Margin, Net Profit Margin. All the content presented in this PPT design is completely editable. Download it and make adjustments in color, background, font etc. as per your unique business setting.
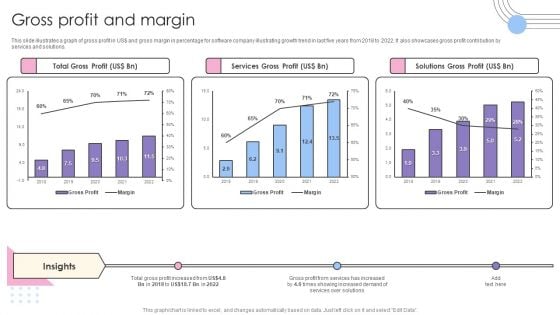
Software Products And Solutions Firm Details Gross Profit And Margin Pictures PDF
This slide illustrates a graph of gross profit in US dollar and gross margin in percentage for software company illustrating growth trend in last five years from 2018 to 2022. It also showcases gross profit contribution by services and solutions. Deliver and pitch your topic in the best possible manner with this Software Products And Solutions Firm Details Gross Profit And Margin Pictures PDF. Use them to share invaluable insights on Total Gross Profit, Services Gross Profit, Solutions Gross Profit and impress your audience. This template can be altered and modified as per your expectations. So, grab it now.
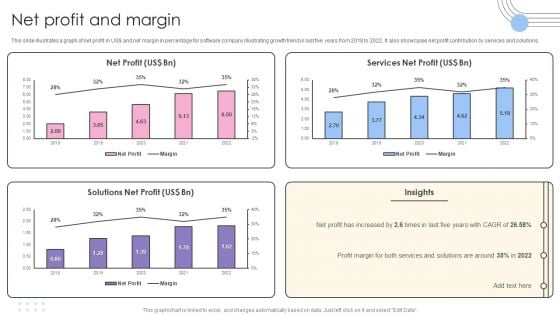
Software Products And Solutions Firm Details Net Profit And Margin Information PDF
This slide illustrates a graph of net profit in US dollar and net margin in percentage for software company illustrating growth trend in last five years from 2018 to 2022. It also showcases net profit contribution by services and solutions. Deliver and pitch your topic in the best possible manner with this Software Products And Solutions Firm Details Net Profit And Margin Information PDF. Use them to share invaluable insights on Net Profit, Services Net Profit, Solutions Net Profit and impress your audience. This template can be altered and modified as per your expectations. So, grab it now.

Software Products And Solutions Firm Details Operating Profit And Margin Mockup PDF
This slide illustrates a graph of operating profit in US dollar and operating margin in percentage for software company illustrating growth trend in last five years from 2018 to 2022. It also showcases operating profit contribution by services and solutions. Deliver an awe inspiring pitch with this creative Software Products And Solutions Firm Details Operating Profit And Margin Mockup PDF bundle. Topics like Operating Profit, Services Operating Profit, Solutions Operating Profit can be discussed with this completely editable template. It is available for immediate download depending on the needs and requirements of the user.
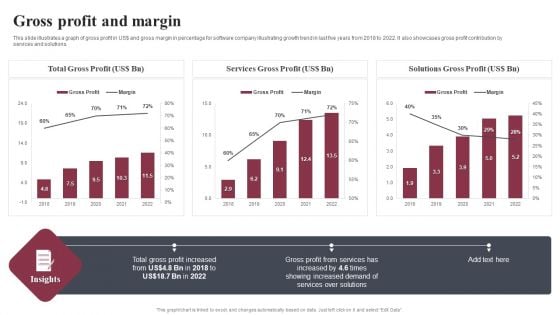
Business Software Development Company Profile Gross Profit And Margin Microsoft PDF
This slide illustrates a graph of gross profit in US dollar and gross margin in percentage for software company illustrating growth trend in last five years from 2018 to 2022. It also showcases gross profit contribution by services and solutions. Deliver and pitch your topic in the best possible manner with this Business Software Development Company Profile Gross Profit And Margin Microsoft PDF. Use them to share invaluable insights on Total Gross Profit, Services Gross Profit, Solutions Gross Profit and impress your audience. This template can be altered and modified as per your expectations. So, grab it now.
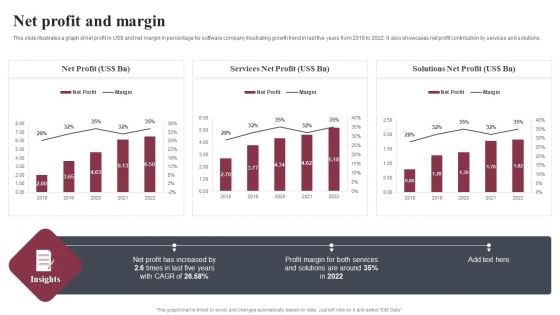
Business Software Development Company Profile Net Profit And Margin Mockup PDF
This slide illustrates a graph of net profit in US dollar and net margin in percentage for software company illustrating growth trend in last five years from 2018 to 2022. It also showcases net profit contribution by services and solutions. Deliver an awe inspiring pitch with this creative Business Software Development Company Profile Net Profit And Margin Mockup PDF bundle. Topics like Net Profit, Services Net Profit, Solutions Net Profit can be discussed with this completely editable template. It is available for immediate download depending on the needs and requirements of the user.
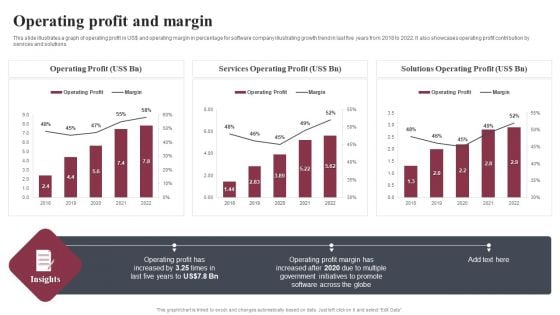
Business Software Development Company Profile Operating Profit And Margin Summary PDF
This slide illustrates a graph of operating profit in US dollar and operating margin in percentage for software company illustrating growth trend in last five years from 2018 to 2022. It also showcases operating profit contribution by services and solutions. Deliver and pitch your topic in the best possible manner with this Business Software Development Company Profile Operating Profit And Margin Summary PDF. Use them to share invaluable insights on Operating Profit, Services Operating Profit, Solutions Operating Profit and impress your audience. This template can be altered and modified as per your expectations. So, grab it now.
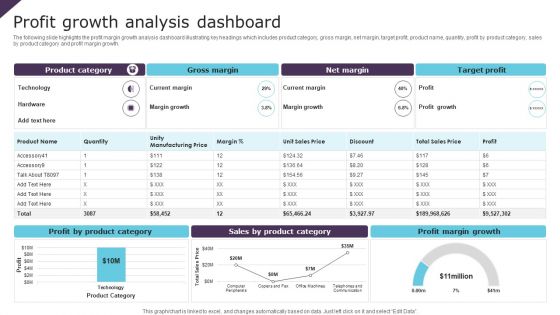
Profit Growth Analysis Dashboard Ppt PowerPoint Presentation File Design Templates PDF
The following slide highlights the profit margin growth analysis dashboard illustrating key headings which includes product category, gross margin, net margin, target profit, product name, quantity, profit by product category, sales by product category and profit margin growth. Showcasing this set of slides titled Profit Growth Analysis Dashboard Ppt PowerPoint Presentation File Design Templates PDF. The topics addressed in these templates are Gross Margin, Net Margin, Target Profit. All the content presented in this PPT design is completely editable. Download it and make adjustments in color, background, font etc. as per your unique business setting.
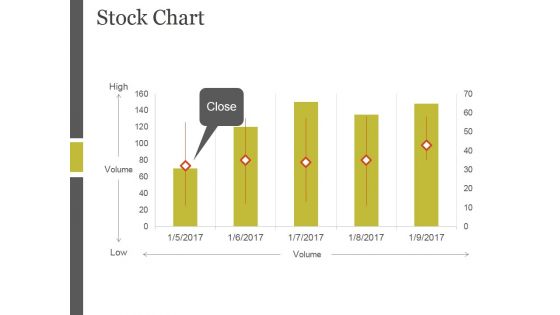
Stock Chart Ppt PowerPoint Presentation Backgrounds
This is a stock chart ppt powerpoint presentation backgrounds. This is a five stage process. The stages in this process are high, volume, low, close.
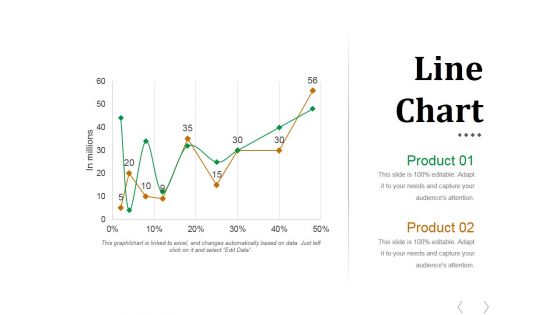
Line Chart Ppt PowerPoint Presentation Styles Outfit
This is a line chart ppt powerpoint presentation styles outfit. This is a two stage process. The stages in this process are business, finance, management, growth, planning.
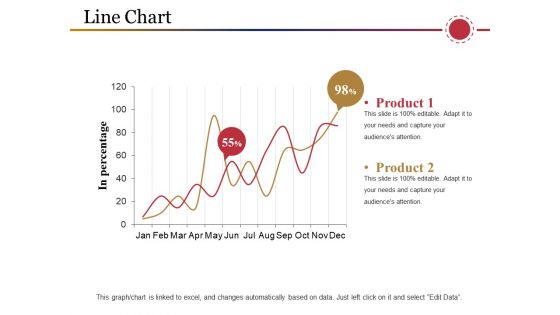
Line Chart Ppt PowerPoint Presentation Inspiration Samples
This is a line chart ppt powerpoint presentation inspiration samples. This is a two stage process. The stages in this process are product, in percentage, business, marketing, graph.
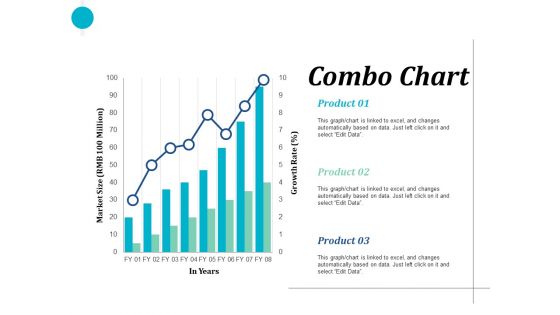
Combo Chart Finance Ppt PowerPoint Presentation Clipart
This is a combo chart finance ppt powerpoint presentation pictures show. This is a two stage process. The stages in this process are finance, marketing, management, investment, analysis.
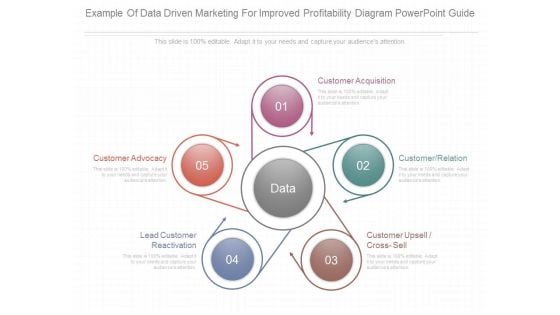
Example Of Data Driven Marketing For Improved Profitability Diagram Powerpoint Guide
This is a example of data driven marketing for improved profitability diagram powerpoint guide. This is a five stage process. The stages in this process are customer acquisition, customer relation, customer upsell cross sell, lead customer reactivation, customer advocacy.
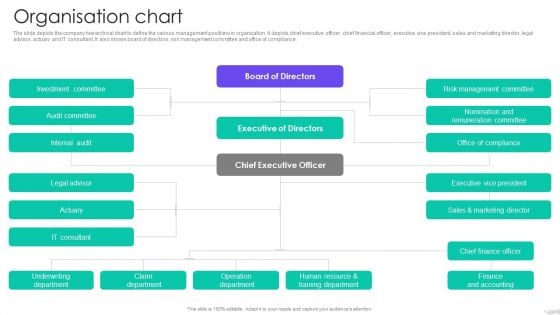
Insurance Services Firm Profile Organisation Chart Diagrams PDF
The slide depicts the company hierarchical chart to define the various management positions in organization. It depicts chief executive officer, chief financial officer, executive vice president, sales and marketing director, legal advisor, actuary and IT consultant. It also shows board of directors, risk management committee and office of compliance. Deliver an awe inspiring pitch with this creative Insurance Services Firm Profile Organisation Chart Diagrams PDF bundle. Topics like Executive Of Directors, Chief Executive Officer, Board Of Directors can be discussed with this completely editable template. It is available for immediate download depending on the needs and requirements of the user.
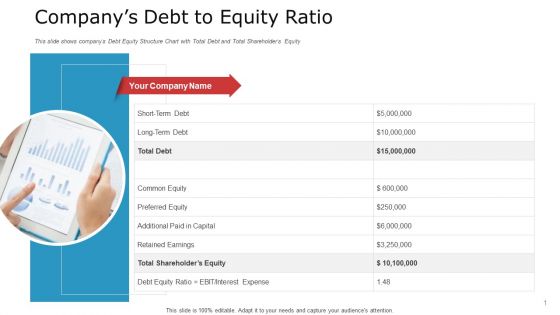
Pitch Deck To Raise Capital From Commercial Financial Institution Using Bonds Companys Debt To Equity Ratio Sample PDF
This slide shows companys Debt Equity Structure Chart with Total Debt and Total Shareholders Equity Deliver an awe-inspiring pitch with this creative pitch deck to raise capital from commercial financial institution using bonds companys debt to equity ratio sample pdf bundle. Topics like preferred equity, additional paid in capital, shareholders equity can be discussed with this completely editable template. It is available for immediate download depending on the needs and requirements of the user.

Blue Arrow With Wealth PowerPoint Templates And PowerPoint Themes 1012
Blue Arrow With Wealth PowerPoint Templates And PowerPoint Themes 1012-Create visually stunning and define your PPT Presentations in a unique and inspiring manner using our above template which contains a graphic of word wealth and blue arrow pointing right with green stunning abstract background. Aesthetically designed to make a great first impression this template symbolizes financial advice one would receive from an advisor when saving for a profitable future. This image has been conceived to enable you to emphatically communicate your ideas in your Business and Finance PPT presentations on investment, success and security. Outline your targets to your team. Inform them of the various means they have to achieve them. Help them align their arrows to consistently be accurate.-Blue Arrow With Wealth PowerPoint Templates And PowerPoint Themes 1012-This PowerPoint template can be used for presentations relating to-Arrows direction wealth, future, business, targets, success, shapes Recapture your dream with our Blue Arrow With Wealth PowerPoint Templates And PowerPoint Themes 1012. Download without worries with our money back guaranteee.
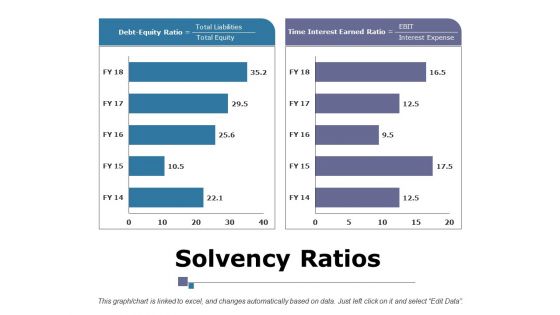
Solvency Ratios Ppt PowerPoint Presentation Summary Layouts
This is a solvency ratios ppt powerpoint presentation summary layouts. This is a two stage process. The stages in this process are business, marketing, strategy, debt equity ratio, time interest earned ratio, finance.
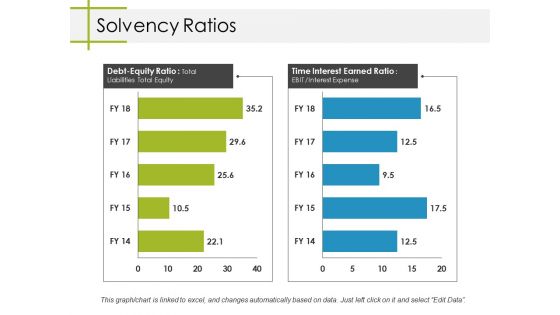
Solvency Ratios Ppt PowerPoint Presentation Professional Rules
This is a solvency ratios ppt powerpoint presentation professional rules. This is a two stage process. The stages in this process are business, marketing, debt equity ratio, time interest earned ratio, graph.
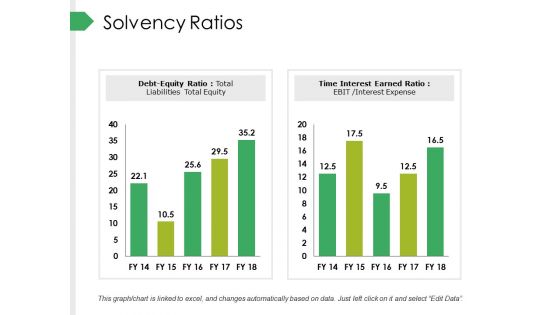
Solvency Ratios Ppt PowerPoint Presentation Outline Ideas
This is a solvency ratios ppt powerpoint presentation outline ideas. This is a two stage process. The stages in this process are business, marketing, debt equity ratio, time interest earned ratio, finance.
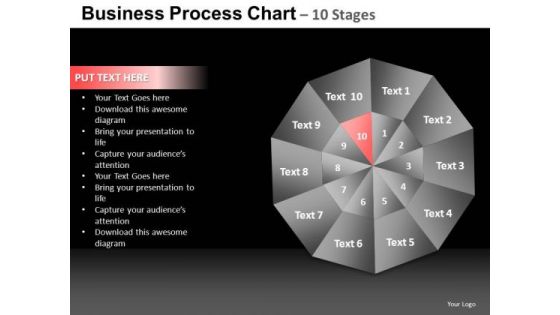
PowerPoint Slide Designs Success Quadrant Diagram Ppt Presentation
PowerPoint Slide Designs Success Quadrant Diagram PPT Presentation-These high quality powerpoint pre-designed slides and powerpoint templates have been carefully created by our professional team to help you impress your audience. All slides have been created and are 100% editable in powerpoint. Each and every property of any graphic - color, size, orientation, shading, outline etc. can be modified to help you build an effective powerpoint presentation. Any text can be entered at any point in the powerpoint template or slide. Simply DOWNLOAD, TYPE and PRESENT! Present admirably with our PowerPoint Slide Designs Success Quadrant Diagram Ppt Presentation. Download without worries with our money back guaranteee.
PowerPoint Slides Sales Quadrant Diagram Ppt Slide Designs
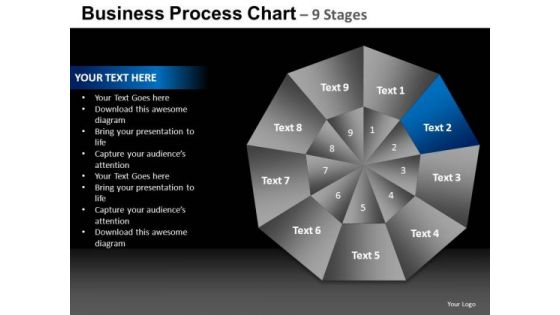
PowerPoint Slides Sales Quadrant Diagram PPT Slide Designs-These high quality powerpoint pre-designed slides and powerpoint templates have been carefully created by our professional team to help you impress your audience. All slides have been created and are 100% editable in powerpoint. Each and every property of any graphic - color, size, orientation, shading, outline etc. can be modified to help you build an effective powerpoint presentation. Any text can be entered at any point in the powerpoint template or slide. Simply DOWNLOAD, TYPE and PRESENT! Train your team with our PowerPoint Slides Sales Quadrant Diagram Ppt Slide Designs. Download without worries with our money back guaranteee.
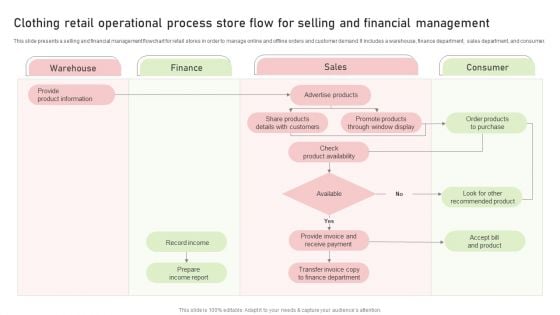
Clothing Retail Operational Process Store Flow For Selling And Financial Management Ideas PDF
This slide presents a selling and financial management flowchart for retail stores in order to manage online and offline orders and customer demand. It includes a warehouse, finance department, sales department, and consumer. Presenting Clothing Retail Operational Process Store Flow For Selling And Financial Management Ideas PDF to dispense important information. This template comprises one stages. It also presents valuable insights into the topics including Advertise Products, Check Product Availability, Record Income . This is a completely customizable PowerPoint theme that can be put to use immediately. So, download it and address the topic impactfully.
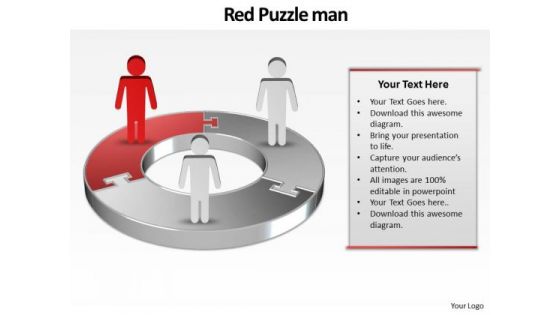
Ppt Red World Business Layouts People Stand On Circular Chart PowerPoint Templates
PPT red world business layouts people stand on circular chart PowerPoint Templates-This 3D PowerPoint Diagram shows the Three interconnected stages represented by first Red Quadrant. It signifies the concept of aspect, attribute, bearing, complexion, component, differentia, disposition, distinction, earmark, essence, essential etc.-PPT red world business layouts people stand on circular chart PowerPoint Templates-abstract, accounting, background, business, businessman, chart, company, connection, corporate, diagram, earnings, finance, forecast, graph, growth, investment, management, network, people, profit, progress, puzzle, shapes, team, technology, vector, wealth Make a powerful statement with our Ppt Red World Business Layouts People Stand On Circular Chart PowerPoint Templates. You'll always stay ahead of the game.
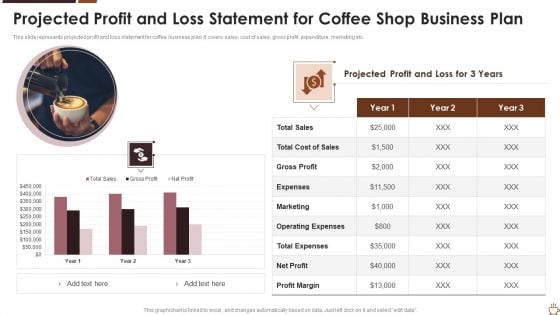
Projected Profit And Loss Statement For Coffee Shop Business Plan Guidelines PDF
This slide represents projected profit and loss statement for coffee business plan. It covers sales, cost of sales, gross profit, expenditure, marketing etc. Pitch your topic with ease and precision using this projected profit and loss statement for coffee shop business plan guidelines pdf. This layout presents information on gross profit, expenses, marketing. It is also available for immediate download and adjustment. So, changes can be made in the color, design, graphics or any other component to create a unique layout.
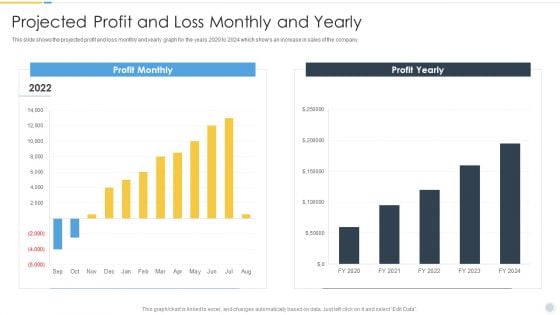
Growth Strategy For Startup Company Projected Profit And Loss Monthly And Yearly Pictures PDF
This slide shows the projected profit and loss monthly and yearly graph for the years 2020 to 2024 which shows an increase in sales of the company. Deliver an awe inspiring pitch with this creative Growth Strategy For Startup Company Projected Profit And Loss Monthly And Yearly Pictures PDF bundle. Topics like Profit Monthly, Profit Yearly, 2020 To 2024 can be discussed with this completely editable template. It is available for immediate download depending on the needs and requirements of the user.

Tour Management Company Profile Operating Profit 2018 To 2022 Ideas PDF
This slide covers the operating profit of travel agency for last five years from 2018 to 2022 which shows increase in operating profits year after year due to more efficient use of resources.Deliver an awe inspiring pitch with this creative Tour Management Company Profile Operating Profit 2018 To 2022 Ideas PDF bundle. Topics like Operating Profit, Primary Reason, Improved Operating can be discussed with this completely editable template. It is available for immediate download depending on the needs and requirements of the user.
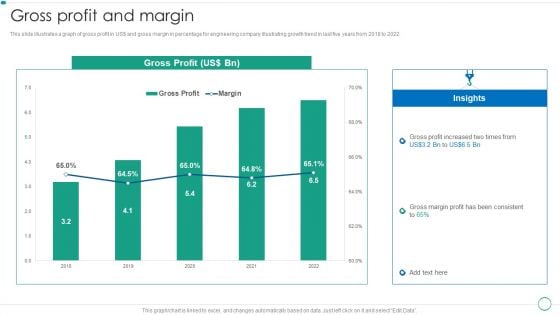
Real Estate Construction And Engineering Company Profile Gross Profit And Margin Demonstration PDF
This slide illustrates a graph of gross profit in US and gross margin in percentage for engineering company illustrating growth trend in last five years from 2018 to 2022.Deliver an awe inspiring pitch with this creative Real Estate Construction And Engineering Company Profile Gross Profit And Margin Demonstration PDF bundle. Topics like Gross Profit, Insights, Profit Increased can be discussed with this completely editable template. It is available for immediate download depending on the needs and requirements of the user.

Home Interior Design And Decoration Company Profile Operating Profits From 2018 To 2022 Introduction PDF
This slide covers the operating profit of interior design company for last five years from 2018 to 2022 which shows changes in operating profits year after year. Deliver an awe inspiring pitch with this creative Home Interior Design And Decoration Company Profile Operating Profits From 2018 To 2022 Introduction PDF bundle. Topics like Operating Profit, Key Insights, 2018 To 2022 can be discussed with this completely editable template. It is available for immediate download depending on the needs and requirements of the user.
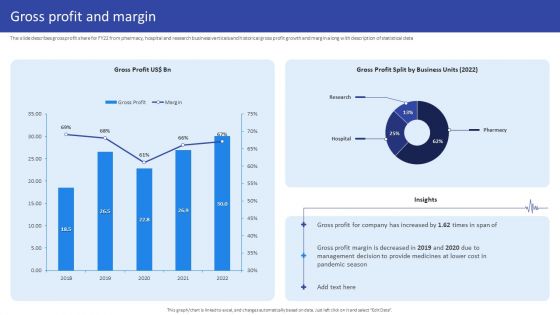
Hospital Medical Research Company Profile Gross Profit And Margin Pictures PDF
The slide describes gross profit share for FY22 from pharmacy, hospital and research business verticals and historical gross profit growth and margin along with description of statistical data. Deliver an awe inspiring pitch with this creative Hospital Medical Research Company Profile Gross Profit And Margin Pictures PDF bundle. Topics like Gross Profit Split, Business Units 2022, 2018 To 2022 can be discussed with this completely editable template. It is available for immediate download depending on the needs and requirements of the user.
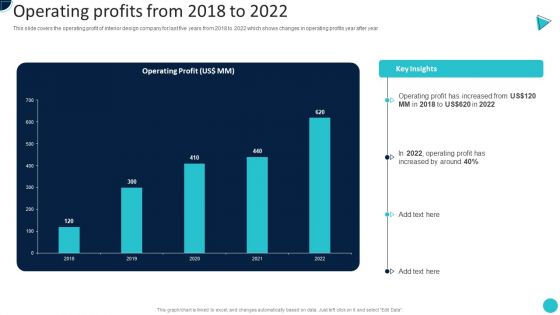
Home Decoration Company Profile Operating Profits From 2018 To 2022 Inspiration PDF
This slide covers the operating profit of interior design company for last five years from 2018 to 2022 which shows changes in operating profits year after year.Deliver and pitch your topic in the best possible manner with this Home Decoration Company Profile Operating Profits From 2018 To 2022 Inspiration PDF. Use them to share invaluable insights on Operating Profit, Increased, Increased Around and impress your audience. This template can be altered and modified as per your expectations. So, grab it now.
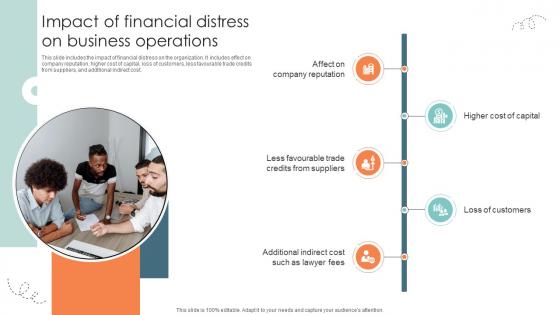
Impact Of Financial Distress On Business Operations Strategic Approaches To Corporate Financial
This slide includes the impact of financial distress on the organization. It includes effect on company reputation, higher cost of capital, loss of customers, less favourable trade credits from suppliers, and additional indirect cost.If you are looking for a format to display your unique thoughts, then the professionally designed Impact Of Financial Distress On Business Operations Strategic Approaches To Corporate Financial is the one for you. You can use it as a Google Slides template or a PowerPoint template. Incorporate impressive visuals, symbols, images, and other charts. Modify or reorganize the text boxes as you desire. Experiment with shade schemes and font pairings. Alter, share or cooperate with other people on your work. Download Impact Of Financial Distress On Business Operations Strategic Approaches To Corporate Financial and find out how to give a successful presentation. Present a perfect display to your team and make your presentation unforgettable. This slide includes the impact of financial distress on the organization. It includes effect on company reputation, higher cost of capital, loss of customers, less favourable trade credits from suppliers, and additional indirect cost.
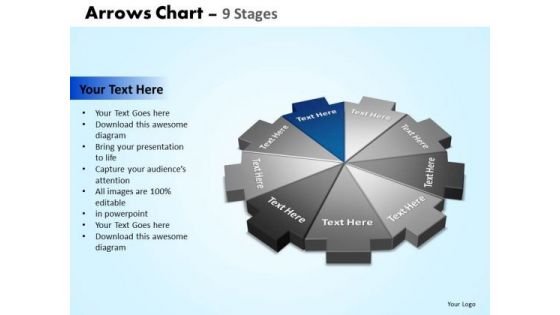
PowerPoint Design Slides Graphic Arrows Chart Ppt Design
PowerPoint Design Slides Graphic Arrows Chart PPT Design-The Circle of Life - a concept emmbedded in our minds and hence easy to comprehend. Life and Business is made up of processes comprising stages that flow from one to another. An excellent graphic to attract the attention of and understanding by your audience to improve earnings.-These amazing PowerPoint pre-designed slides and PowerPoint templates have been carefully created by our team of experts to help you impress your audience. Our stunning collection of Powerpoint slides are 100% editable and can easily fit in any PowerPoint presentations. By using these animations and graphics in PowerPoint and you can easily make professional presentations. Any text can be entered at any point in the PowerPoint template or slide. Just DOWNLOAD our awesome PowerPoint templates and you are ready to go. Our PowerPoint Design Slides Graphic Arrows Chart Ppt Design create presentations that blow your audience away. With our money back guarantee you have nothing to lose.
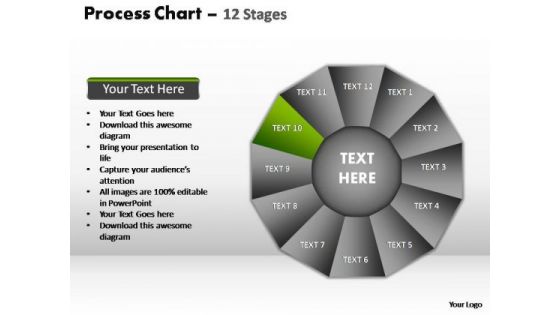
PowerPoint Slide Designs Sales Process Chart Ppt Slides
PowerPoint Slide Designs Sales process chart PPT Slides-The Circle of Life - a concept emmbedded in our minds and hence easy to comprehend. Life and Business is made up of processes comprising stages that flow from one to another. An excellent graphic to attract the attention of and understanding by your audience to improve earnings.-These amazing PowerPoint pre-designed slides and PowerPoint templates have been carefully created by our team of experts to help you impress your audience. Our stunning collection of Powerpoint slides are 100% editable and can easily fit in any PowerPoint presentations. By using these animations and graphics in PowerPoint and you can easily make professional presentations. Any text can be entered at any point in the PowerPoint template or slide. Just DOWNLOAD our awesome PowerPoint templates and you are ready to go. Specify paths to success with our PowerPoint Slide Designs Sales Process Chart Ppt Slides. Download without worries with our money back guaranteee.

Professional Code Of Ethics Of Financial Institutions Themes PDF
This slide showcases the different types of code of ethics. It includes types such as compliance-based code of ethics, value-based code of ethics and code professional ethics. Persuade your audience using this Professional Code Of Ethics Of Financial Institutions Themes PDF. This PPT design covers seven stages, thus making it a great tool to use. It also caters to a variety of topics including Respect, Interest, Caution, Inspire, Support, Knowledge. Download this PPT design now to present a convincing pitch that not only emphasizes the topic but also showcases your presentation skills.
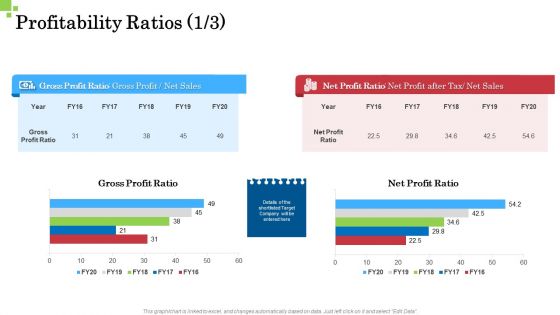
Inorganic Growth Business Profitability Ratios After Ppt File Graphic Tips PDF
Deliver and pitch your topic in the best possible manner with this inorganic growth business profitability ratios after ppt file graphic tips pdf. Use them to share invaluable insights on gross profit ratio, net profit ratio and impress your audience. This template can be altered and modified as per your expectations. So, grab it now.
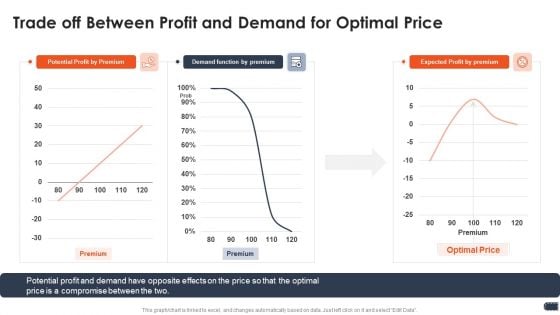
Business Pricing Model Trade Off Between Profit And Demand For Optimal Price Slides PDF
Deliver an awe inspiring pitch with this creative business pricing model trade off between profit and demand for optimal price slides pdf bundle. Topics like potential profit by premium, demand function by premium, expected profit by premium can be discussed with this completely editable template. It is available for immediate download depending on the needs and requirements of the user.
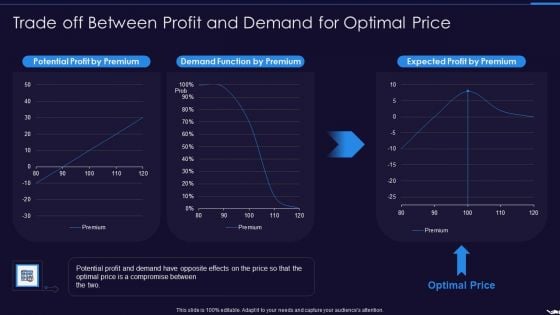
Optimize Marketing Pricing Trade Off Between Profit And Demand For Optimal Price Clipart PDF
Deliver an awe inspiring pitch with this creative optimize marketing pricing trade off between profit and demand for optimal price clipart pdf bundle. Topics like potential profit by premium, demand function by premium, expected profit by premium can be discussed with this completely editable template. It is available for immediate download depending on the needs and requirements of the user.
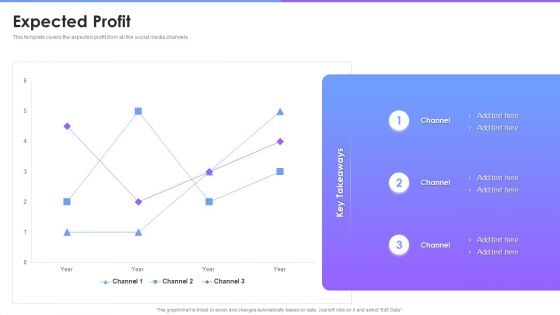
Social Media Promotion Pitch Deck Expected Profit Ppt Styles Sample PDF
This template covers the expected profit from all the social media channels. Deliver an awe inspiring pitch with this creative Social Media Promotion Pitch Deck Expected Profit Ppt Styles Sample PDF bundle. Topics like Expected Profit can be discussed with this completely editable template. It is available for immediate download depending on the needs and requirements of the user.
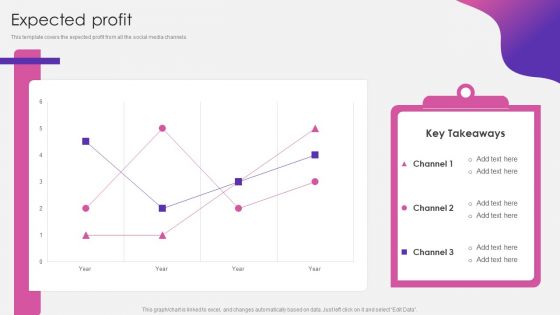
Social Media Pitch Deck For New Business Expected Profit Template PDF
This template covers the expected profit from all the social media channels. Deliver and pitch your topic in the best possible manner with this Social Media Pitch Deck For New Business Expected Profit Template PDF. Use them to share invaluable insights on Expected Profit and impress your audience. This template can be altered and modified as per your expectations. So, grab it now.
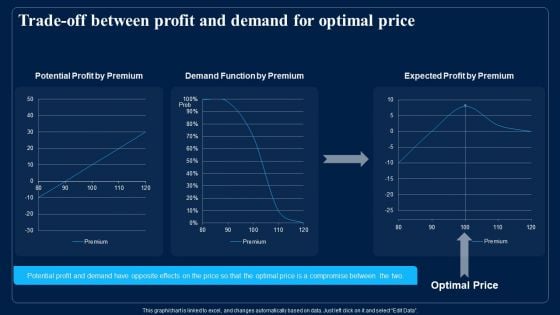
Trade Off Between Profit And Demand For Optimal Price Guidelines PDF
Deliver and pitch your topic in the best possible manner with this Trade Off Between Profit And Demand For Optimal Price Guidelines PDF. Use them to share invaluable insights on Potential Profit By Premium, Demand Function By Premium, Expected Profit By Premium and impress your audience. This template can be altered and modified as per your expectations. So, grab it now.
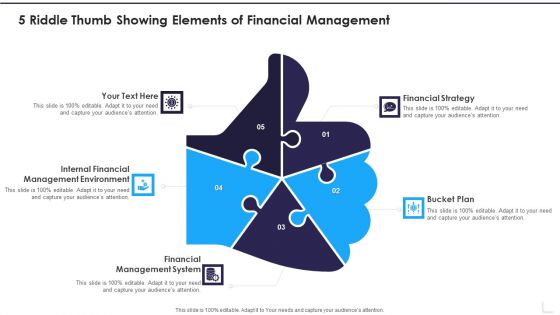
5 Riddle Thumb Showing Elements Of Financial Management Diagrams PDF
Presenting 5 Riddle Thumb Showing Elements Of Financial Management Diagrams PDF to dispense important information. This template comprises five stages. It also presents valuable insights into the topics including Internal Financial, Financial Strategy, Bucket Plan. This is a completely customizable PowerPoint theme that can be put to use immediately. So, download it and address the topic impactfully.
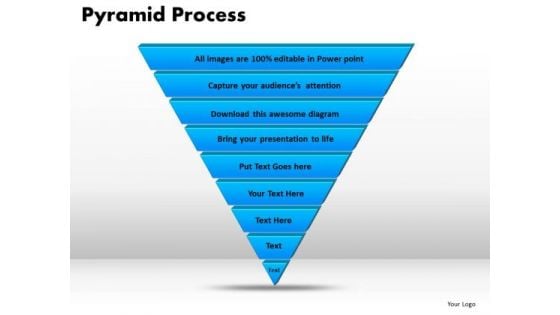
PowerPoint Slide Pyramid Process Diagram Ppt Templates
PowerPoint Slide Pyramid Process Diagram PPT Templates-Pyramids are truly wonders of the world. This PowerPoint Diagram Shows the Pyramid Process which is used to show proportional, interconnected, or hierarchical relationships with the largest component on the top and narrowing down.-PowerPoint Slide Pyramid Process Diagram PPT Templates Convert customers with our PowerPoint Slide Pyramid Process Diagram Ppt Templates. Download without worries with our money back guaranteee.

Scatter Bubble Chart Ppt PowerPoint Presentation Professional Model
This is a scatter bubble chart ppt powerpoint presentation professional model. This is a six stage process. The stages in this process are sales in profit, financial year, growth, business, marketing, strategy.
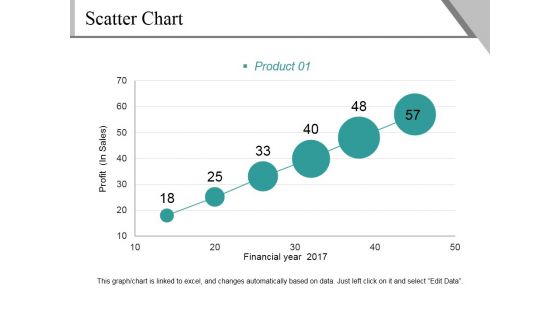
Scatter Chart Ppt PowerPoint Presentation File Background Image
This is a scatter chart ppt powerpoint presentation file background image. This is a six stage process. The stages in this process are profit, financial year, product, growth, success.

 Home
Home