Icon Revenue
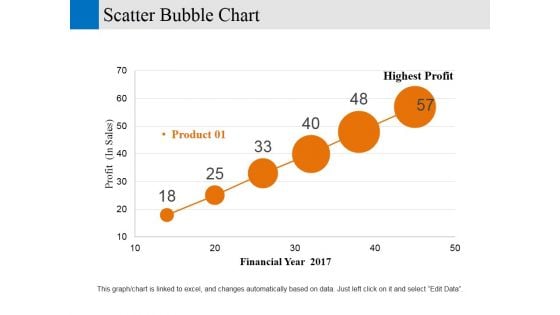
Scatter Bubble Chart Ppt PowerPoint Presentation Gallery Designs Download
This is a scatter bubble chart ppt powerpoint presentation gallery designs download. This is a six stage process. The stages in this process are financial year, profit, business, marketing, strategy.
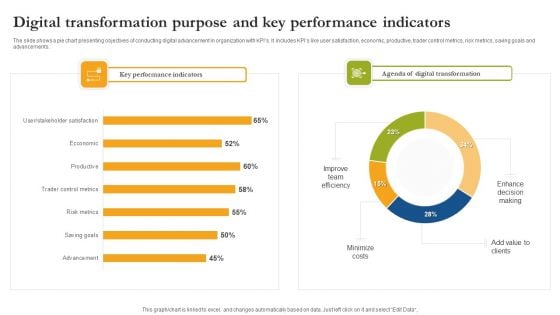
Digital Transformation Purpose And Key Performance Indicators Formats PDF
The slide shows a pie chart presenting objectives of conducting digital advancement in organization with KPIs. It includes KPIs like user satisfaction, economic, productive, trader control metrics, risk metrics, saving goals and advancements. Pitch your topic with ease and precision using this Digital Transformation Purpose And Key Performance Indicators Formats PDF. This layout presents information on Key Performance Indicators, Digital Transformation, Minimize Costs. It is also available for immediate download and adjustment. So, changes can be made in the color, design, graphics or any other component to create a unique layout.
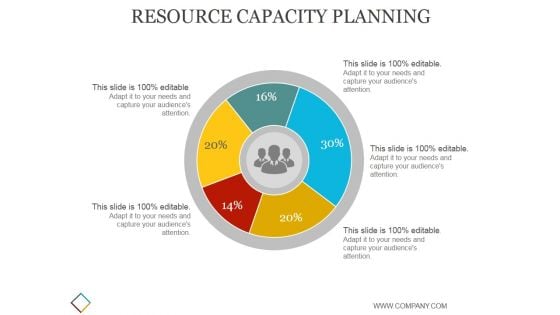
Resource Capacity Planning Ppt PowerPoint Presentation Diagrams
This is a resource capacity planning ppt powerpoint presentation diagrams. This is a five stage process. The stages in this process are business, strategy, marketing, analysis, finance.
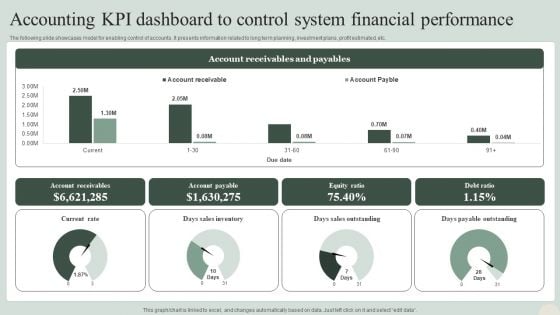
Accounting KPI Dashboard To Control System Financial Performance Formats PDF
The following slide showcases model for enabling control of accounts. It presents information related to long term planning, investment plans, profit estimated, etc. Pitch your topic with ease and precision using this Accounting KPI Dashboard To Control System Financial Performance Formats PDF. This layout presents information on Sales Outstanding, Payable Outstanding, Sales Inventory. It is also available for immediate download and adjustment. So, changes can be made in the color, design, graphics or any other component to create a unique layout.

PowerPoint Design Cycle Process Chart Ppt Template
PowerPoint Design Cycle Process Chart PPT Template- Life and Business is made up of processes comprising stages that flow from one to another. An excellent graphic to attract the attention of and understanding by your audience to improve earnings.-PowerPoint Design Cycle Process Chart PPT Template-Background, Business, Chart, Circle, Circular, Marketing, Management, Flow, Graph, Process, Round, Segmented, Sequence, Wheel, Diagram, Division, Continuity, Template, Web, Illustration Excellence is a byword for our PowerPoint Design Cycle Process Chart Ppt Template. They aim for the best without exception.

Instant Snacks And Food Firm Details Net Profit And Margin Microsoft PDF
This slide illustrates a graph of net profit in US and gross margin in percentage for food company. Additionally, it shows net profit of all business lines of the company food, beverage and dairy products.Deliver and pitch your topic in the best possible manner with this Instant Snacks And Food Firm Details Net Profit And Margin Microsoft PDF Use them to share invaluable insights on Profit Increased, Profit Margin, Disrupted Supply and impress your audience. This template can be altered and modified as per your expectations. So, grab it now.
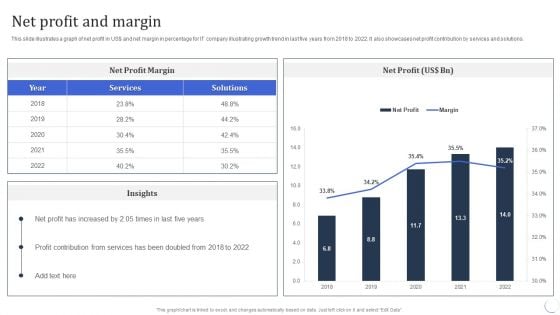
Infotech Solutions Research And Development Company Summary Net Profit And Margin Information PDF
This slide illustrates a graph of net profit in US dollar and net margin in percentage for IT company illustrating growth trend in last five years from 2018 to 2022. It also showcases net profit contribution by services and solutions. Deliver and pitch your topic in the best possible manner with this Infotech Solutions Research And Development Company Summary Net Profit And Margin Information PDF. Use them to share invaluable insights on Profit Contribution, Services, Net Profit and impress your audience. This template can be altered and modified as per your expectations. So, grab it now.
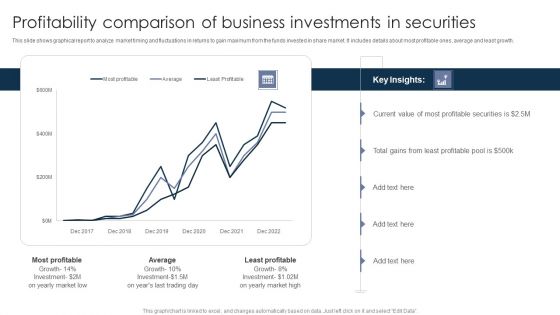
Profitability Comparison Of Business Investments In Securities Ppt PowerPoint Presentation Outline Deck PDF
This slide shows graphical report to analyze market timing and fluctuations in returns to gain maximum from the funds invested in share market. It includes details about most profitable ones, average and least growth. Pitch your topic with ease and precision using this Profitability Comparison Of Business Investments In Securities Ppt PowerPoint Presentation Outline Deck PDF. This layout presents information on Most Profitable, Least Profitable, Least Profitable. It is also available for immediate download and adjustment. So, changes can be made in the color, design, graphics or any other component to create a unique layout.
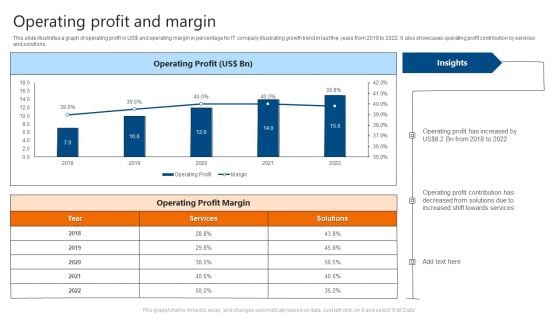
Operating Profit And Margin IT Software Development Company Profile Guidelines PDF
This slide illustrates a graph of operating profit in US doller and operating margin in percentage for IT company illustrating growth trend in last five years from 2018 to 2022. It also showcases operating profit contribution by services and solutions. Deliver and pitch your topic in the best possible manner with this Operating Profit And Margin IT Software Development Company Profile Guidelines PDF. Use them to share invaluable insights on Operating Profit, Operating Profit Margin and impress your audience. This template can be altered and modified as per your expectations. So, grab it now.
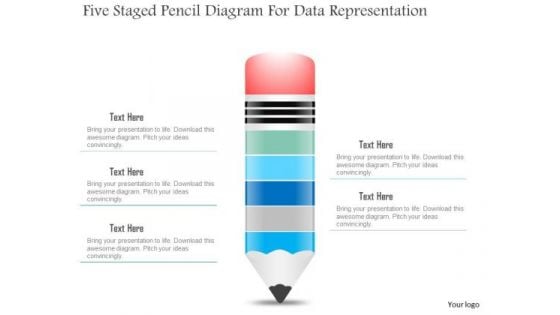
Business Diagram Five Staged Pencil Diagram For Data Representation PowerPoint Slide
This business slide displays five staged pencil diagram. It contains pencil graphic divided into five parts. This diagram slide depicts processes, stages, steps, points, options and education information display. Use this diagram, in your presentations to express your views innovatively.
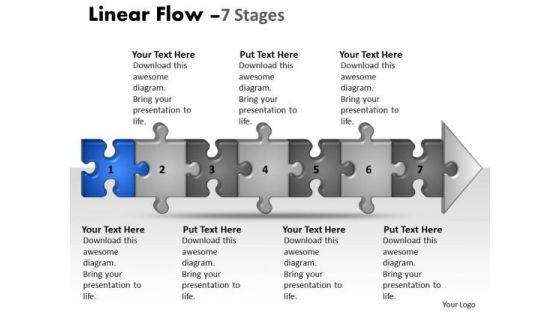
Usa Ppt Theme Linear Flow 7 State Diagram Style1 Project Management PowerPoint 2 Image
USA PPT Theme linear flow 7 state diagram style1 project management powerpoint 2 Image-Create visually stunning and define your PPT Presentations in a unique and inspiring manner using our above template which shows a simple interdependent process. You can easily edit the size, position, text, color. -USA PPT Theme linear flow 7 state diagram style1 project management powerpoint 2 Image-Arrow, Attached, Background, Business, Chain, Chart, Competition, Concepts, Connection, Diagram, Finance, Future, Graph, Growth, Ideas, Improvement, Investment, Isolated, Jigsaw, Making, Market, Money, Order, Partnership, Piece, Planning, Puzzle, Shape Let our Usa Ppt Theme Linear Flow 7 State Diagram Style1 Project Management PowerPoint 2 Image rub off on your thoughts. They will get a dose of the X-factor.
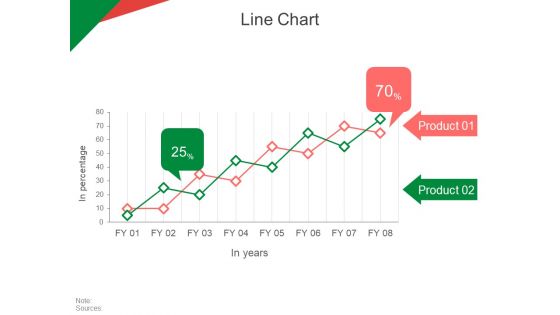
Line Chart Ppt PowerPoint Presentation Professional Smartart
This is a line chart ppt powerpoint presentation professional smartart. This is a two stage process. The stages in this process are in percentage, in years, product, finance, business.
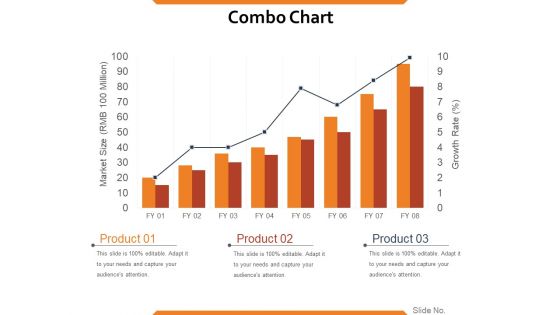
Combo Chart Ppt PowerPoint Presentation Styles Good
This is a combo chart ppt powerpoint presentation styles good. This is a eight stage process. The stages in this process are market size, growth rate, product, growth, strategy, graph, finance.
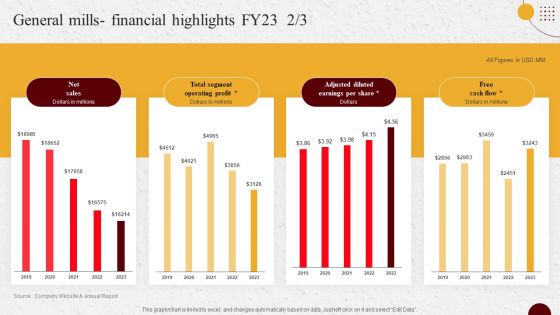
Industry Report Of Packaged Food Products Part 2 General Mills Financial Highlights Fy23 Diagrams PDF
Do you have to make sure that everyone on your team knows about any specific topic I yes, then you should give Industry Report Of Packaged Food Products Part 2 General Mills Financial Highlights Fy23 Diagrams PDF a try. Our experts have put a lot of knowledge and effort into creating this impeccable Industry Report Of Packaged Food Products Part 2 General Mills Financial Highlights Fy23 Diagrams PDF. You can use this template for your upcoming presentations, as the slides are perfect to represent even the tiniest detail. You can download these templates from the Slidegeeks website and these are easy to edit. So grab these today.
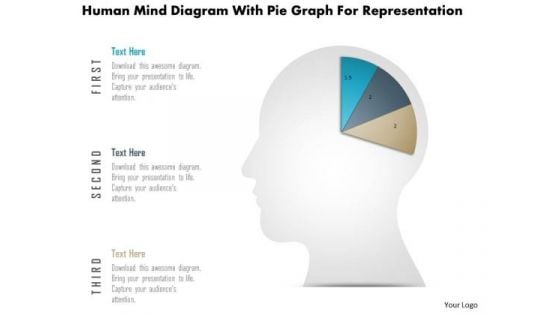
Business Diagram Human Mind Diagram With Pie Graph For Representation PowerPoint Slide
This diagram displays human face graphic divided into sections. This section can be used for data display. Use this diagram to build professional presentations for your viewers.
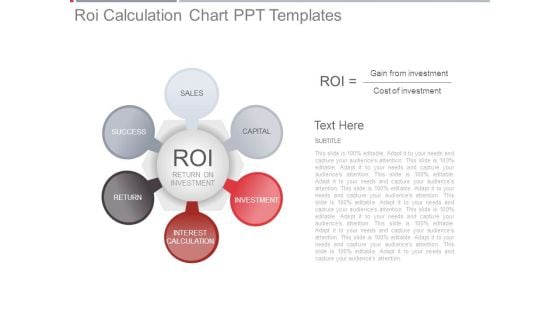
Roi Calculation Chart Ppt Templates
This is a roi calculation chart ppt templates. This is a six stage process. The stages in this process are sales, capital, investment, interest calculation, return, success, return on investment.
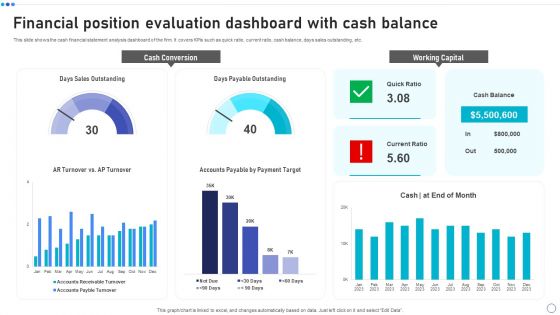
Financial Position Evaluation Dashboard With Cash Balance Rules PDF
This slide shows the cash financial statement analysis dashboard of the firm. It covers KPIs such as quick ratio, current ratio, cash balance, days sales outstanding, etc. Showcasing this set of slides titled Financial Position Evaluation Dashboard With Cash Balance Rules PDF. The topics addressed in these templates are Cash Conversion, Working Capital, Days Sales Outstanding. All the content presented in this PPT design is completely editable. Download it and make adjustments in color, background, font etc. as per your unique business setting.
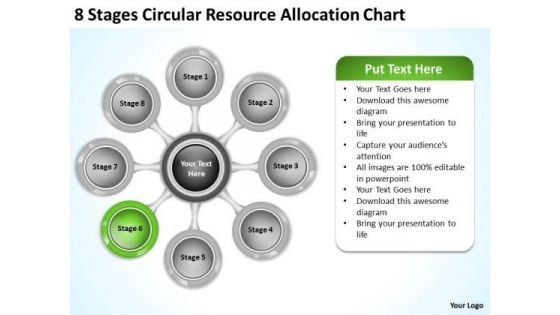
Business Strategy Planning Circular Resource Allocation Chart Template
We present our business strategy planning circular resource allocation chart template.Download and present our Process and Flows PowerPoint Templates because you can Break through with our PowerPoint Templates and Slides. Bring down the mental barriers of your audience. Use our Ring Charts PowerPoint Templates because Our PowerPoint Templates and Slides are designed to help you succeed. They have all the ingredients you need. Download and present our Circle Charts PowerPoint Templates because Our PowerPoint Templates and Slides will provide weight to your words. They will bring out the depth of your thought process. Download our Business PowerPoint Templates because Our PowerPoint Templates and Slides will provide you the cutting edge. Slice through the doubts in the minds of your listeners. Download our Success PowerPoint Templates because our PowerPoint Templates and Slides are the string of your bow. Fire of your ideas and conquer the podium.Use these PowerPoint slides for presentations relating to Abstract, arrow, brochure, business, button, catalog, chart, circle, colors, cross,demonstration, description, design, diagram, eight, glossy, goals,illustration, information, interface, internet, isolated, level, list, marketing, model,multiple, navigation, network, pattern, presentation, registry, report, section,space, sphere, statement, statistics, steps, structure, target. The prominent colors used in the PowerPoint template are Green, Gray, White. Establish success with our Business Strategy Planning Circular Resource Allocation Chart Template. Download without worries with our money back guaranteee.
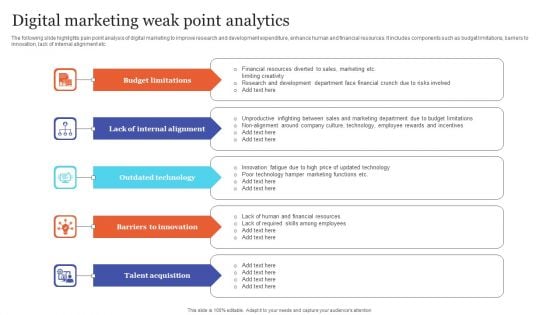
Digital Marketing Weak Point Analytics Themes PDF
The following slide highlights pain point analysis of digital marketing to improve research and development expenditure, enhance human and financial resources. It includes components such as budget limitations, barriers to innovation, lack of internal alignment etc. Presenting Digital Marketing Weak Point Analytics Themes PDF to dispense important information. This template comprises five stages. It also presents valuable insights into the topics including Budget Limitations, Outdated Technology, Talent Acquisition. This is a completely customizable PowerPoint theme that can be put to use immediately. So, download it and address the topic impactfully.
PowerPoint Slide Rings Business Ppt Themes
PowerPoint Slide Rings Business PPT Themes-This Interconnected Ring graphics add color, shape, and emphasis to your text and data, and they're a snap to use. You can easily try out a variety of SmartArt graphics to see which one works best for getting your point across. You can customize it with colors, animation, and effects such as shadows, bevels, and glows, and more.-PowerPoint Slide Rings Business PPT Themes Create plans with our PowerPoint Slide Rings Business Ppt Themes. Download without worries with our money back guaranteee.
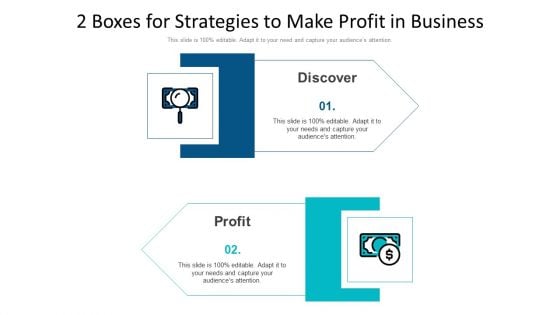
2 Boxes For Strategies To Make Profit In Business Ppt PowerPoint Presentation Diagram Templates PDF
Persuade your audience using this 2 boxes for strategies to make profit in business ppt powerpoint presentation diagram templates pdf. This PPT design covers two stages, thus making it a great tool to use. It also caters to a variety of topics including discover, profit. Download this PPT design now to present a convincing pitch that not only emphasizes the topic but also showcases your presentation skills.
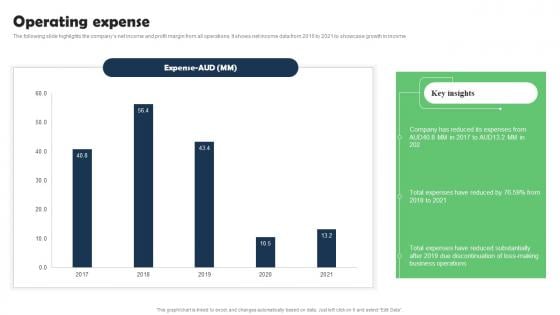
Operating Expense Marketing Research Services Management Business Formats Pdf
The following slide highlights the companys net income and profit margin from all operations. It shows net income data from 2016 to 2021 to showcase growth in income. The best PPT templates are a great way to save time, energy, and resources. Slidegeeks have 100 percent editable powerpoint slides making them incredibly versatile. With these quality presentation templates, you can create a captivating and memorable presentation by combining visually appealing slides and effectively communicating your message. Download Operating Expense Marketing Research Services Management Business Formats Pdf from Slidegeeks and deliver a wonderful presentation. The following slide highlights the companys net income and profit margin from all operations. It shows net income data from 2016 to 2021 to showcase growth in income.
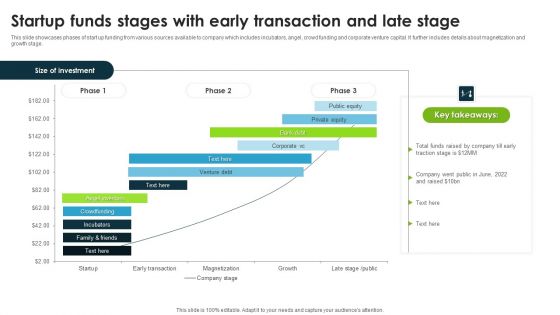
Startup Funds Stages With Early Transaction And Late Stage Themes PDF
This slide showcases phases of start up funding from various sources available to company which includes incubators, angel, crowd funding and corporate venture capital. It further includes details about magnetization and growth stage. Showcasing this set of slides titled Startup Funds Stages With Early Transaction And Late Stage Themes PDF. The topics addressed in these templates are Private Equity, Angel Investors, Investment. All the content presented in this PPT design is completely editable. Download it and make adjustments in color, background, font etc. as per your unique business setting.
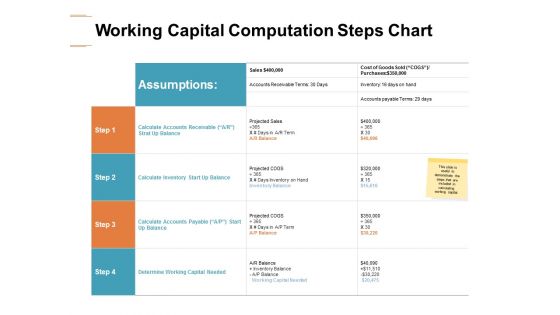
Working Capital Computation Steps Chart Ppt PowerPoint Presentation Layouts Graphic Images
presenting this set of slides with name working capital computation steps chart ppt powerpoint presentation layouts graphic images. the topics discussed in these slides are working capital needed, inventory balance, determine working capital needed. this is a completely editable powerpoint presentation and is available for immediate download. download now and impress your audience.
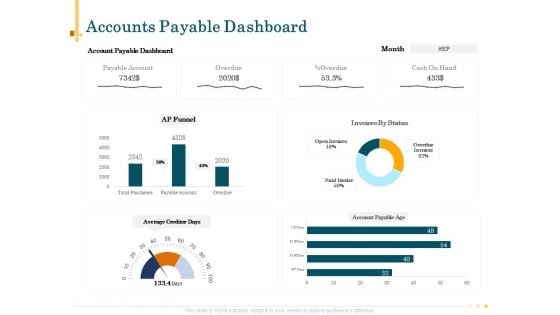
Outsource Bookkeeping Service Manage Financial Transactions Accounts Payable Dashboard Diagrams PDF
Presenting this set of slides with name outsource bookkeeping service manage financial transactions accounts payable dashboard diagrams pdf. The topics discussed in these slide is accounts payable dashboard. This is a completely editable PowerPoint presentation and is available for immediate download. Download now and impress your audience.
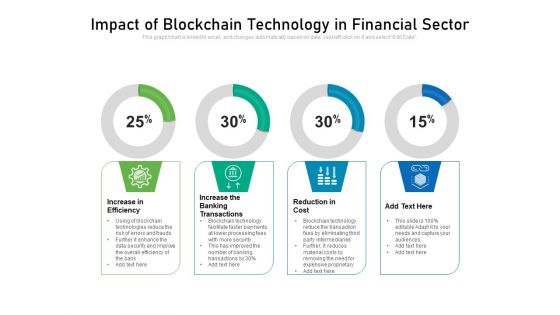
Impact Of Blockchain Technology In Financial Sector Ppt PowerPoint Presentation Diagram Templates PDF
Showcasing this set of slides titled impact of blockchain technology in financial sector ppt powerpoint presentation diagram templates pdf. The topics addressed in these templates are increase in efficiency, reduction in cost, increase the banking transactions. All the content presented in this PPT design is completely editable. Download it and make adjustments in color, background, font etc. as per your unique business setting.
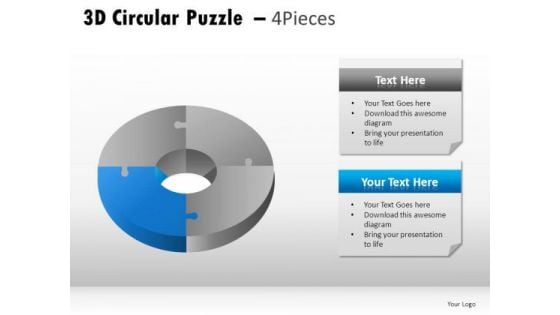
Segment 3d Circular Puzzle 4 Pieces PowerPoint Slides And Ppt Diagram Templates
Segment 3D Circular Puzzle 4 Pieces PowerPoint Slides And PPT Diagram Templates-These high quality powerpoint pre-designed slides and powerpoint templates have been carefully created by our professional team to help you impress your audience. All slides have been created and are 100% editable in powerpoint. Each and every property of any graphic - color, size, orientation, shading, outline etc. can be modified to help you build an effective powerpoint presentation. Any text can be entered at any point in the powerpoint template or slide. Simply DOWNLOAD, TYPE and PRESENT! Form plans with our Segment 3d Circular Puzzle 4 Pieces PowerPoint Slides And Ppt Diagram Templates. Download without worries with our money back guaranteee.
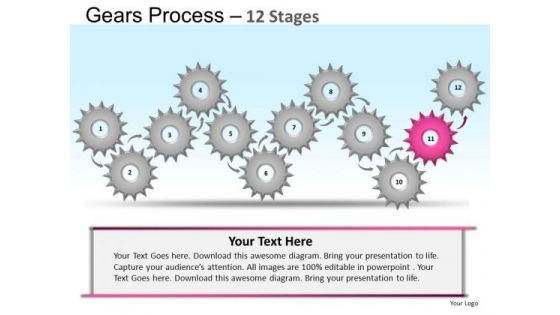
PowerPoint Theme Strategy Gears Ppt Slides
PowerPoint Theme Strategy Gears PPT Slides-The Circle of Life - a concept emmbedded in our minds and hence easy to comprehend. Life and Business is made up of processes comprising stages that flow from one to another. An excellent graphic to attract the attention of and understanding by your audience to improve earnings.-These amazing PowerPoint pre-designed slides and PowerPoint templates have been carefully created by our team of experts to help you impress your audience. Our stunning collection of Powerpoint slides are 100% editable and can easily fit in any PowerPoint presentations. By using these animations and graphics in PowerPoint and you can easily make professional presentations. Any text can be entered at any point in the PowerPoint template or slide. Just DOWNLOAD our awesome PowerPoint templates and you are ready to go. Oversee plans with our PowerPoint Theme Strategy Gears Ppt Slides. Download without worries with our money back guaranteee.
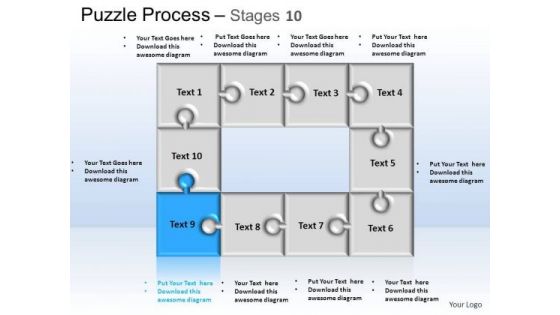
PowerPoint Themes Business Puzzle Process Ppt Layout
PowerPoint Themes Business Puzzle Process PPT Layout-The Circle of Life - a concept emmbedded in our minds and hence easy to comprehend. Life and Business is made up of processes comprising stages that flow from one to another. An excellent graphic to attract the attention of and understanding by your audience to improve earnings.-These amazing PowerPoint pre-designed slides and PowerPoint templates have been carefully created by our team of experts to help you impress your audience. Our stunning collection of Powerpoint slides are 100% editable and can easily fit in any PowerPoint presentations. By using these animations and graphics in PowerPoint and you can easily make professional presentations. Any text can be entered at any point in the PowerPoint template or slide. Just DOWNLOAD our awesome PowerPoint templates and you are ready to go. Illustrate goals with our PowerPoint Themes Business Puzzle Process Ppt Layout. Download without worries with our money back guaranteee.
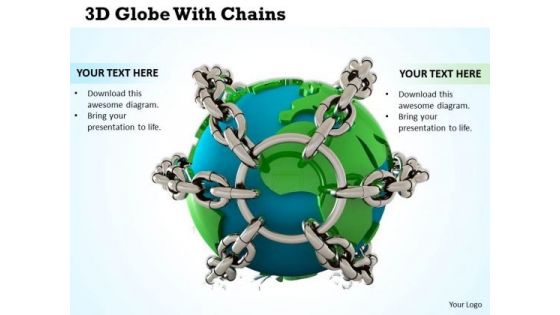
Stock Photo 3d Globe With Chains Global Safety PowerPoint Slide
Display the global business concept in any business presentation with the help of this unique image. This image contains the graphic of 3d globe. This image shows the financial reporting for global business. Use this image in global financial topic related presentation.
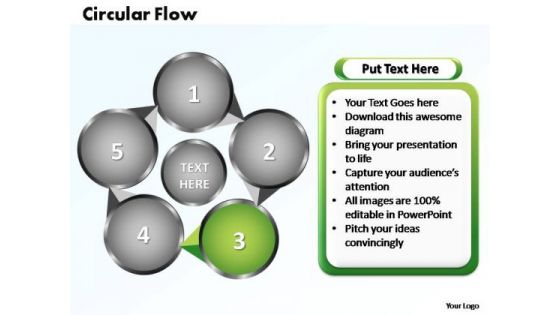
PowerPoint Templates Circular Flow Chart Ppt Design
Flowchart is a simple mapping tool that shows the sequence of actions within a process. Flowchart is widely used in business, education and economic presentations to help the audience visualize the content better, or to find flaws in a process. Explore all avenues with our PowerPoint Templates Circular Flow Chart Ppt Design. They really do cover the compass.
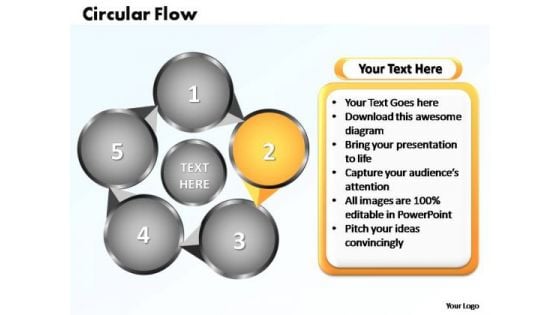
PowerPoint Templates Circular Flow Chart Ppt Designs
Flowchart is a simple mapping tool that shows the sequence of actions within a process. Flowchart is widely used in business, education and economic presentations to help the audience visualize the content better, or to find flaws in a process. Our PowerPoint Templates Circular Flow Chart Ppt Designs make an explicit statement. They are direct and accurate.
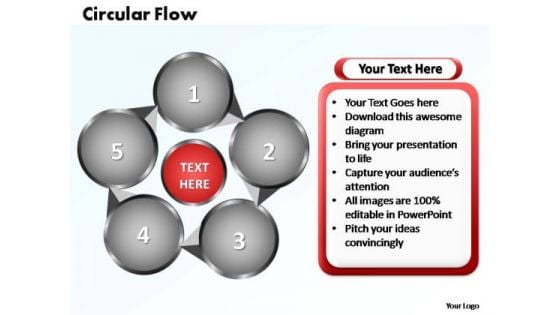
PowerPoint Templates Circular Flow Chart Ppt Layouts
Flowchart is a simple mapping tool that shows the sequence of actions within a process. Flowchart is widely used in business, education and economic presentations to help the audience visualize the content better, or to find flaws in a process. With our PowerPoint Templates Circular Flow Chart Ppt Layouts the entertainment never ends. Things just keep getting better and better.
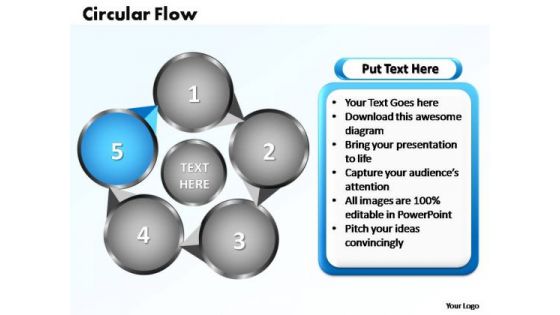
PowerPoint Templates Circular Flow Chart Ppt Slide
Flowchart is a simple mapping tool that shows the sequence of actions within a process. Flowchart is widely used in business, education and economic presentations to help the audience visualize the content better, or to find flaws in a process. Honest effort always shows through. Our PowerPoint Templates Circular Flow Chart Ppt Slide are a good example.
PowerPoint Templates Circular Flow Chart Ppt Slides
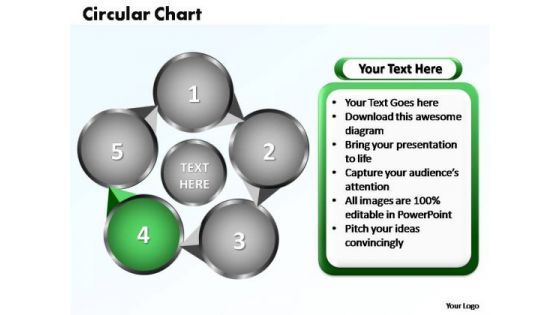
Flowchart is a simple mapping tool that shows the sequence of actions within a process. Flowchart is widely used in business, education and economic presentations to help the audience visualize the content better, or to find flaws in a process. Improve the efficiency of your factory. Our PowerPoint Templates Circular Flow Chart Ppt Slides make process assessment easier.
Business Market Research Services Chart Slides
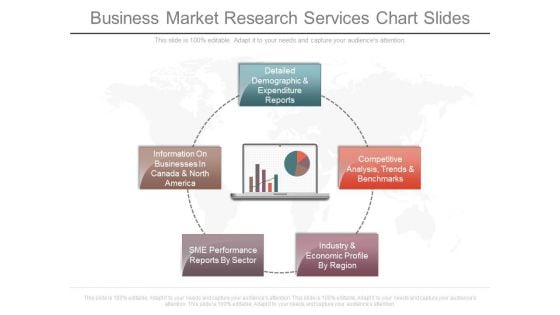
This is a business market research services chart slides. This is a five stage process. The stages in this process are detailed demographic and expenditure reports, competitive analysis trends and benchmarks, industry and economic profile by region, sme performance reports by sector, information on businesses in canada and north america.
Wework Capital Financing Elevator Details About Wework As Flexible Workspace Provider Clipart PDF
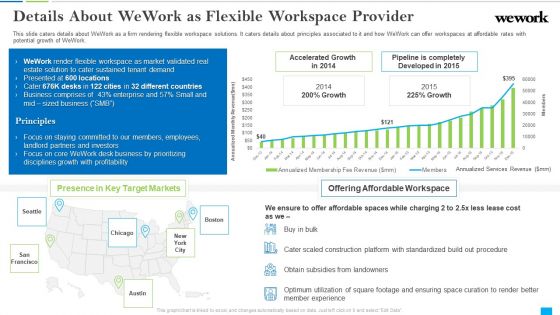
This slide caters details about WeWork as a firm rendering flexible workspace solutions. It caters details about principles associated to it and how WeWork can offer workspaces at affordable rates with potential growth of WeWork. Deliver and pitch your topic in the best possible manner with this wework capital financing elevator details about wework as flexible workspace provider clipart pdf. Use them to share invaluable insights on accelerated growth, developed, profitability, business, sustained and impress your audience. This template can be altered and modified as per your expectations. So, grab it now.
Our Cost Advantage For Soft Drinks Capital Raising Pitch Deck Ppt Summary Example Topics PDF
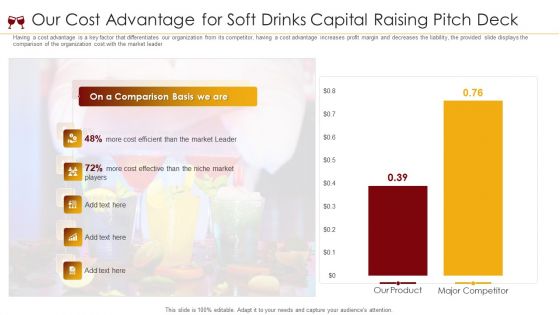
Having a cost advantage is a key factor that differentiates our organization from its competitor, having a cost advantage increases profit margin and decreases the liability, the provided slide displays the comparison of the organization cost with the market leader. Deliver an awe inspiring pitch with this creative our cost advantage for soft drinks capital raising pitch deck ppt summary example topics pdf bundle. Topics like our product, major competitor, market leader, niche market players can be discussed with this completely editable template. It is available for immediate download depending on the needs and requirements of the user.
Oil Barrel With Finance Graph Industrial PowerPoint Templates And PowerPoint Themes 1012
The above template displays a diagram of black barrels of oil by a colorful bar graph with an arrow. This image signifies business concept. This image has been conceived to enable you to emphatically communicate your ideas in your Business and Financial PPT presentation. Our PPT images are so perfectly/ideally designed that it reveals the very basis of our PPT template to make your clients understand. Mastermind plans with our Oil Barrel With Finance Graph Industrial PowerPoint Templates And PowerPoint Themes 1012. Download without worries with our money back guaranteee.
Financial Report Business PowerPoint Themes And PowerPoint Slides 0411
Microsoft PowerPoint Theme and Slide with financial report Optimize your business cyclewith our Financial Report Business PowerPoint Themes And PowerPoint Slides 0411. You'll deliver your best presentation yet.
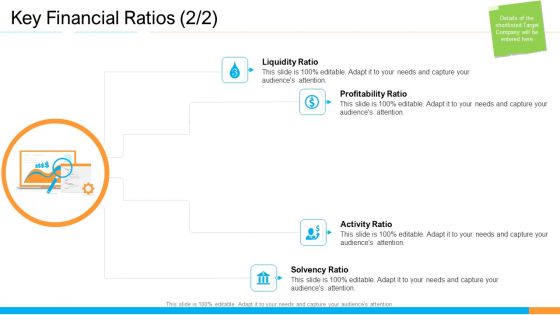
Business Takeover Plan For Inorganic Growth Key Financial Ratios Price Summary PDF
Deliver and pitch your topic in the best possible manner with this business takeover plan for inorganic growth key financial ratios price summary pdf. Use them to share invaluable insights on return on assets, price to earnings, p or e ratio, debt to equity ratio, current ratio and impress your audience. This template can be altered and modified as per your expectations. So, grab it now.
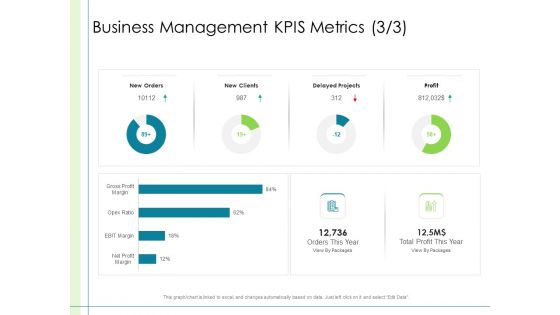
In Depth Business Assessment Business Management Kpis Metrics Profit Ppt PowerPoint Presentation Show Layouts PDF
Deliver and pitch your topic in the best possible manner with this in depth business assessment business management kpis metrics profit ppt powerpoint presentation show layouts pdf. Use them to share invaluable insights on gross profit margin, opex ratio, ebit margin, net profit, new orders, delayed projects, new clients and impress your audience. This template can be altered and modified as per your expectations. So, grab it now.
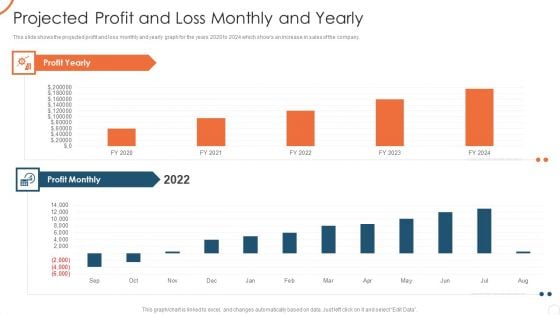
Corporate Strategy For Business Development Projected Profit And Loss Monthly And Yearly Slides PDF
This slide shows the projected profit and loss monthly and yearly graph for the years 2020 to 2024 which shows an increase in sales of the company. Deliver an awe inspiring pitch with this creative corporate strategy for business development projected profit and loss monthly and yearly slides pdf bundle. Topics like projected profit and loss monthly and yearly can be discussed with this completely editable template. It is available for immediate download depending on the needs and requirements of the user.
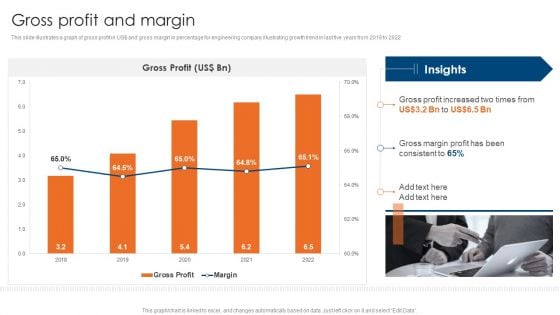
Engineering Consultancy Works Company Profile Gross Profit And Margin Infographics PDF
This slide illustrates a graph of gross profit in US doller and gross margin in percentage for engineering company illustrating growth trend in last five years from 2018 to 2022. Deliver an awe inspiring pitch with this creative Engineering Consultancy Works Company Profile Gross Profit And Margin Infographics PDF bundle. Topics like Gross Profit, Margin can be discussed with this completely editable template. It is available for immediate download depending on the needs and requirements of the user.
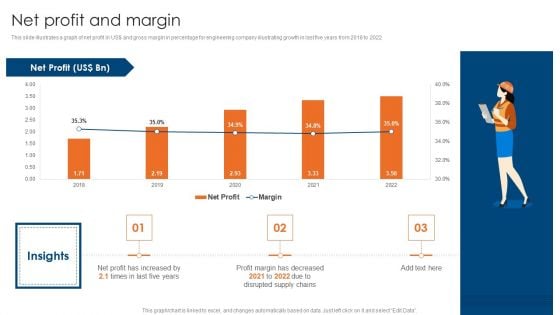
Engineering Consultancy Works Company Profile Net Profit And Margin Clipart PDF
This slide illustrates a graph of net profit in US doller and gross margin in percentage for engineering company illustrating growth in last five years from 2018 to 2022. Deliver an awe inspiring pitch with this creative Engineering Consultancy Works Company Profile Net Profit And Margin Clipart PDF bundle. Topics like Net Profit And Margin can be discussed with this completely editable template. It is available for immediate download depending on the needs and requirements of the user.
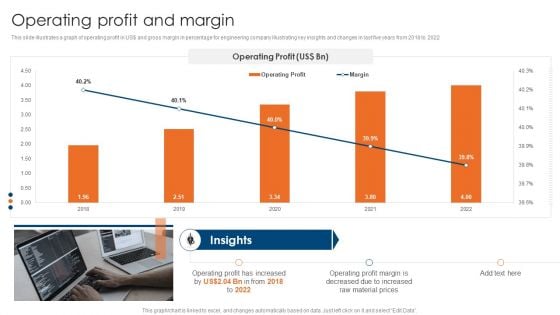
Engineering Consultancy Works Company Profile Operating Profit And Margin Topics PDF
This slide illustrates a graph of operating profit in US doller and gross margin in percentage for engineering company illustrating key insights and changes in last five years from 2018 to 2022. Deliver an awe inspiring pitch with this creative Engineering Consultancy Works Company Profile Operating Profit And Margin Topics PDF bundle. Topics like Operating, Profit, Margin can be discussed with this completely editable template. It is available for immediate download depending on the needs and requirements of the user.

Digital Ad Marketing Services Company Profile Operating Profit 2018 To 2022 Formats PDF
This slide focuses on operating profit of advertising agency for last five years from 2018 to 2022 which represents increasing trend due to reduced operating expenses. Deliver and pitch your topic in the best possible manner with this Digital Ad Marketing Services Company Profile Operating Profit 2018 To 2022 Formats PDF. Use them to share invaluable insights on Operating Profit and impress your audience. This template can be altered and modified as per your expectations. So, grab it now.
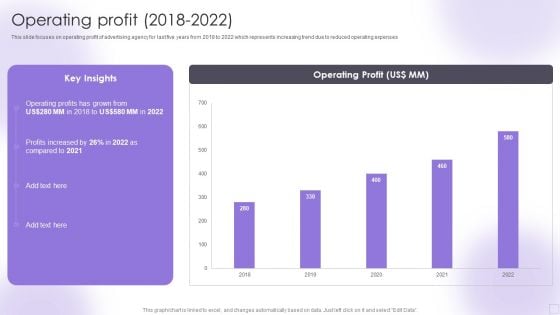
Advertising Services Company Profile Operating Profit 2018 To 2022 Slides PDF
This slide focuses on operating profit of advertising agency for last five years from 2018 to 2022 which represents increasing trend due to reduced operating expenses. Deliver and pitch your topic in the best possible manner with this Advertising Services Company Profile Operating Profit 2018 To 2022 Slides PDF. Use them to share invaluable insights on Operating Profit and impress your audience. This template can be altered and modified as per your expectations. So, grab it now.

Web Design Company Overview Operating Profits From 2018 To 2022 Professional PDF
This slide covers the operating profit of web design company for last five years from 2018 to 2022 which shows changes in operating profits year after year. There are so many reasons you need a Web Design Company Overview Operating Profits From 2018 To 2022 Professional PDF. The first reason is you can not spend time making everything from scratch, Thus, Slidegeeks has made presentation templates for you too. You can easily download these templates from our website easily.

Ad And Media Agency Company Profile Operating Profit 2018 To 2022 Information PDF
This slide focuses on operating profit of advertising agency for last five years from 2018 to 2022 which represents increasing trend due to reduced operating expenses. If you are looking for a format to display your unique thoughts, then the professionally designed Ad And Media Agency Company Profile Operating Profit 2018 To 2022 Information PDF is the one for you. You can use it as a Google Slides template or a PowerPoint template. Incorporate impressive visuals, symbols, images, and other charts. Modify or reorganize the text boxes as you desire. Experiment with shade schemes and font pairings. Alter, share or cooperate with other people on your work. Download Ad And Media Agency Company Profile Operating Profit 2018 To 2022 Information PDF and find out how to give a successful presentation. Present a perfect display to your team and make your presentation unforgettable.

Pie Chart Ppt PowerPoint Presentation Portfolio Maker
This is a pie chart ppt powerpoint presentation portfolio maker. This is a five stage process. The stages in this process are business, pie chart, finance, process, planning.
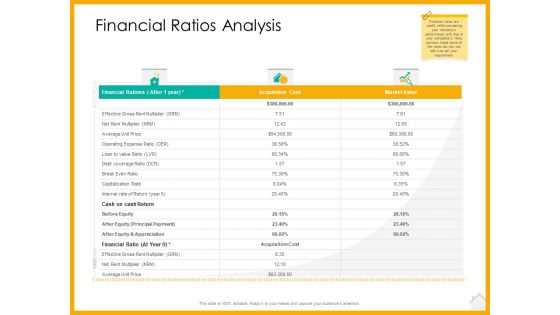
Real Estate Property Management System Financial Ratios Analysis Ppt Themes PDF
Deliver an awe inspiring pitch with this creative real estate property management system financial ratios analysis ppt themes pdf bundle. Topics like effective, financial, capitalization, equity, operating expense can be discussed with this completely editable template. It is available for immediate download depending on the needs and requirements of the user.
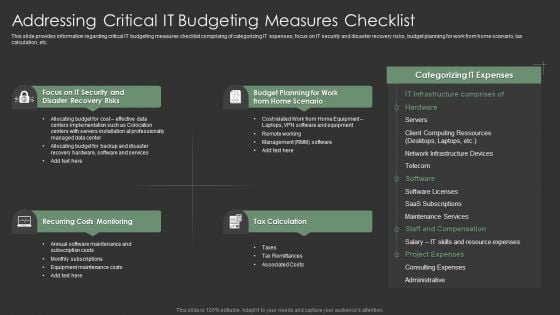
IT Spend Management Priorities By Cios Addressing Critical IT Budgeting Measures Checklist Diagrams PDF
This slide provides information regarding critical IT budgeting measures checklist comprising of categorizing IT expenses, focus on IT security and disaster recovery risks, budget planning for work from home scenario, tax calculation, etc. This is a IT Spend Management Priorities By Cios Addressing Critical IT Budgeting Measures Checklist Diagrams PDF template with various stages. Focus and dispense information on four stages using this creative set, that comes with editable features. It contains large content boxes to add your information on topics like Budget Planning, Recurring Costs Monitoring, Tax Calculation. You can also showcase facts, figures, and other relevant content using this PPT layout. Grab it now.
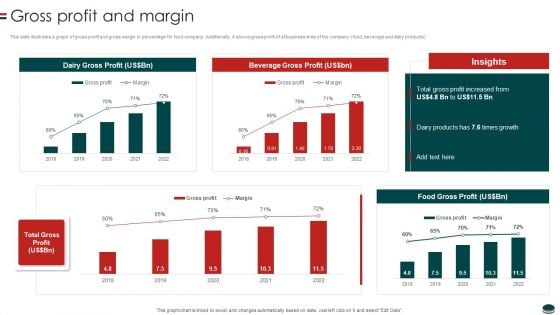
Instant Snacks And Food Firm Details Gross Profit And Margin Professional PDF
This slide illustrates a graph of gross profit and gross margin in percentage for food company. Additionally, it shows gross profit of all business lines of the company food, beverage and dairy products.Deliver an awe inspiring pitch with this creative Instant Snacks And Food Firm Details Gross Profit And Margin Professional PDF bundle. Topics like Gross Profit, Beverage Gross, Dairy Products can be discussed with this completely editable template. It is available for immediate download depending on the needs and requirements of the user.
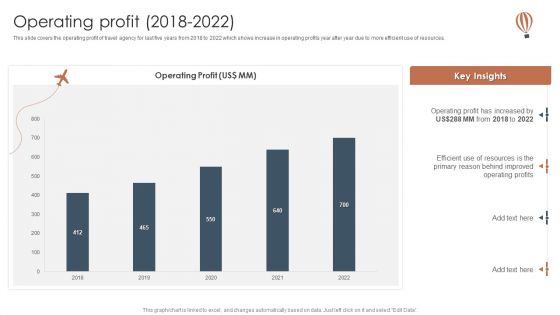
Tour And Travels Agency Profile Operating Profit 2018 To 2022 Ideas PDF
This slide covers the operating profit of travel agency for last five years from 2018 to 2022 which shows increase in operating profits year after year due to more efficient use of resources.Deliver an awe inspiring pitch with this creative Tour And Travels Agency Profile Operating Profit 2018 To 2022 Ideas PDF bundle. Topics like Operating, Profit Has Increased, Behind Improved can be discussed with this completely editable template. It is available for immediate download depending on the needs and requirements of the user.
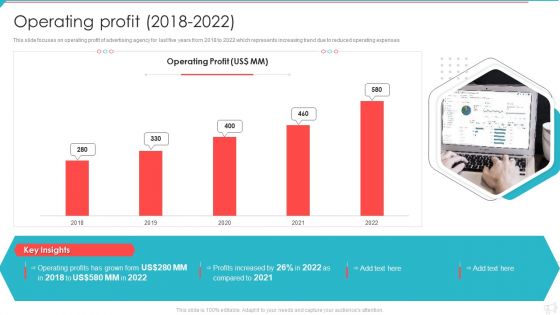
Advertisement And Marketing Agency Company Profile Operating Profit 2018 To 2022 Infographics PDF
This slide focuses on operating profit of advertising agency for last five years from 2018 to 2022 which represents increasing trend due to reduced operating expenses. Deliver and pitch your topic in the best possible manner with this Advertisement And Marketing Agency Company Profile Operating Profit 2018 To 2022 Infographics PDF. Use them to share invaluable insights on Operating Profit, Profits Increased, 2018 To 2022 and impress your audience. This template can be altered and modified as per your expectations. So, grab it now.
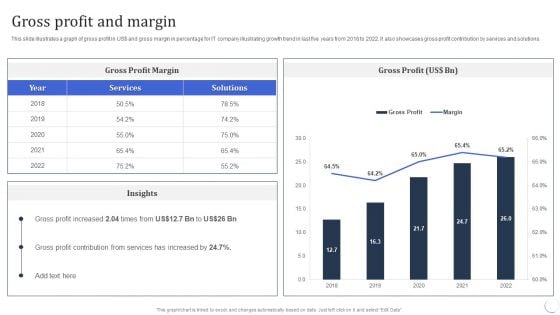
Infotech Solutions Research And Development Company Summary Gross Profit And Margin Ideas PDF
This slide illustrates a graph of gross profit in US dollar and gross margin in percentage for IT company illustrating growth trend in last five years from 2018 to 2022. It also showcases gross profit contribution by services and solutions. Deliver an awe inspiring pitch with this creative Infotech Solutions Research And Development Company Summary Gross Profit And Margin Ideas PDF bundle. Topics like Services, Gross Profit Margin can be discussed with this completely editable template. It is available for immediate download depending on the needs and requirements of the user.
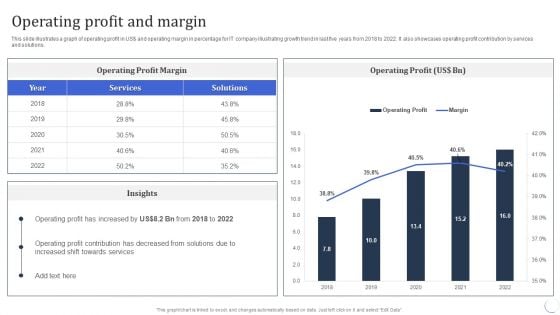
Infotech Solutions Research And Development Company Summary Operating Profit And Margin Download PDF
This slide illustrates a graph of operating profit in US dollar and operating margin in percentage for IT company illustrating growth trend in last five years from 2018 to 2022. It also showcases operating profit contribution by services and solutions. Deliver an awe inspiring pitch with this creative Infotech Solutions Research And Development Company Summary Operating Profit And Margin Download PDF bundle. Topics like Services, Operating Profit can be discussed with this completely editable template. It is available for immediate download depending on the needs and requirements of the user.
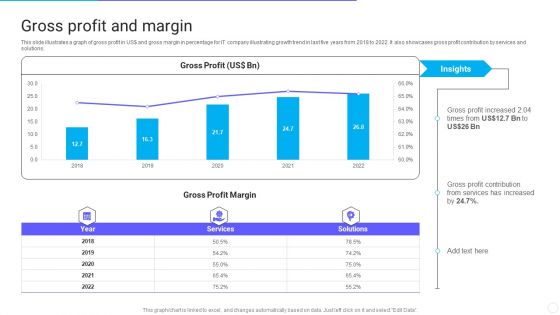
IT Application Services Company Outline Gross Profit And Margin Elements PDF
This slide illustrates a graph of gross profit in US dollar and gross margin in percentage for IT company illustrating growth trend in last five years from 2018 to 2022. It also showcases gross profit contribution by services and solutions. Deliver an awe inspiring pitch with this creative IT Application Services Company Outline Gross Profit And Margin Elements PDF bundle. Topics like Gross Profit Margin, Services can be discussed with this completely editable template. It is available for immediate download depending on the needs and requirements of the user.
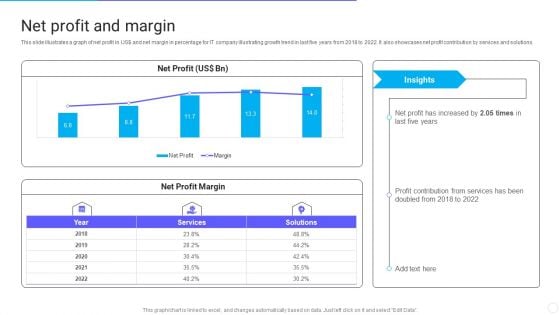
IT Application Services Company Outline Net Profit And Margin Structure PDF
This slide illustrates a graph of net profit in US dollar and net margin in percentage for IT company illustrating growth trend in last five years from 2018 to 2022. It also showcases net profit contribution by services and solutions. Deliver and pitch your topic in the best possible manner with this IT Application Services Company Outline Net Profit And Margin Structure PDF. Use them to share invaluable insights on Net Profit Margin, Services, Margin and impress your audience. This template can be altered and modified as per your expectations. So, grab it now.

 Home
Home