Improvement Chart
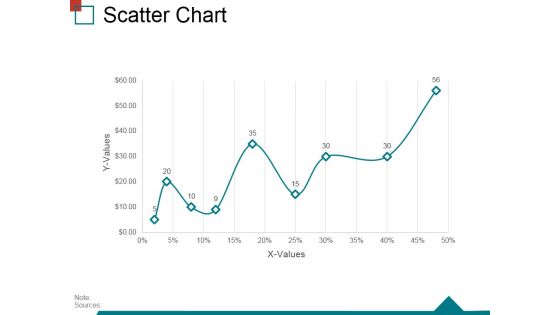
Scatter Chart Ppt PowerPoint Presentation Inspiration Demonstration
This is a scatter chart ppt powerpoint presentation inspiration demonstration. This is a one stage process. The stages in this process are scatter chart, business, marketing, process, growth.
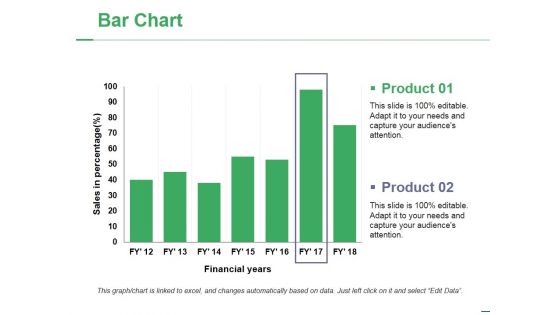
Bar Chart Ppt PowerPoint Presentation Model Topics
This is a bar chart ppt powerpoint presentation model topics. This is a two stage process. The stages in this process are bar graph, growth, success, business, marketing.
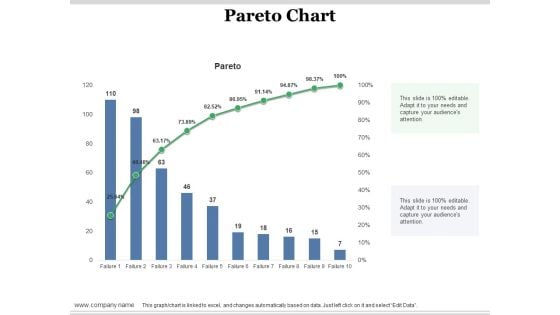
Pareto Chart Ppt PowerPoint Presentation Ideas Themes
This is a pareto chart ppt powerpoint presentation ideas themes. This is a two stage process. The stages in this process are pareto chart, growth, success, business, marketing.
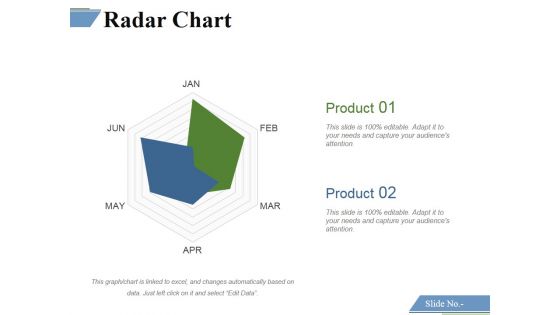
Radar Chart Ppt PowerPoint Presentation Summary Gallery
This is a radar chart ppt powerpoint presentation summary gallery. This is a two stage process. The stages in this process are radar chart, business, marketing, management, strategy.
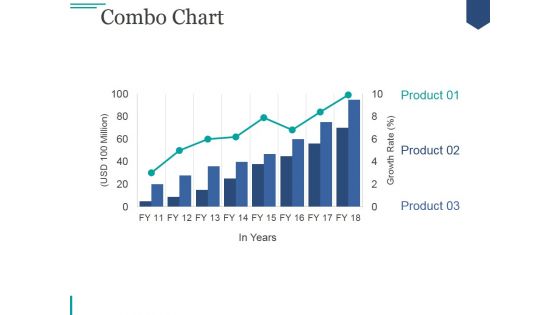
Combo Chart Ppt PowerPoint Presentation Microsoft
This is a combo chart ppt powerpoint presentation microsoft. This is a three stage process. The stages in this process are business, marketing, growth, product, chart.
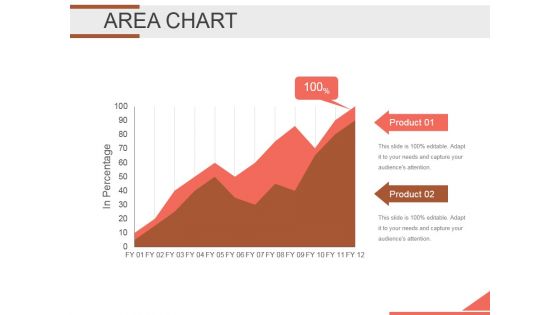
Area Chart Ppt PowerPoint Presentation Information
This is a area chart ppt powerpoint presentation information. This is a two stage process. The stages in this process are area chart, growth, strategy, management, analysis.
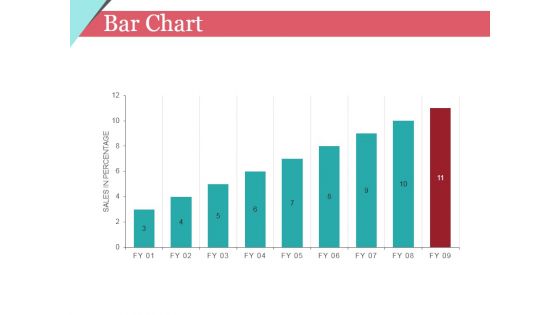
Bar Chart Ppt PowerPoint Presentation Show Show
This is a bar chart ppt powerpoint presentation show show. This is a nine stage process. The stages in this process are business, marketing, chart, growth.
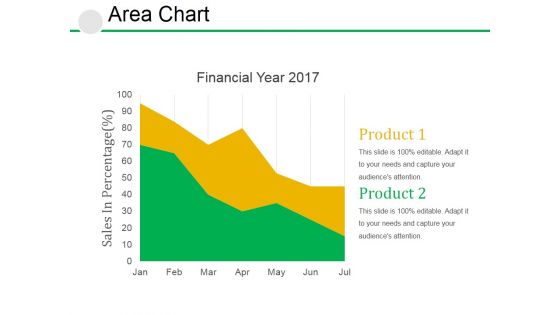
Area Chart Ppt PowerPoint Presentation Gallery Sample
This is a area chart ppt powerpoint presentation gallery sample. This is a two stage process. The stages in this process are area chart, growth, strategy, analysis, business.
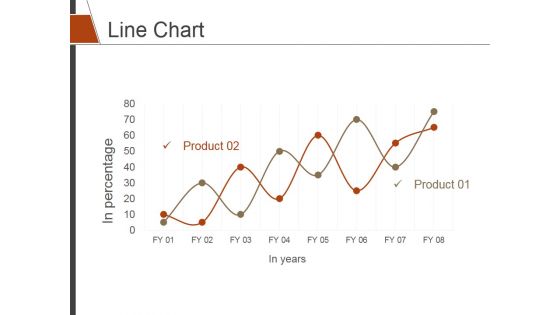
Line Chart Ppt PowerPoint Presentation Model Example
This is a line chart ppt powerpoint presentation model example. This is a two stage process. The stages in this process are line chart, growth, strategy, analysis, business.
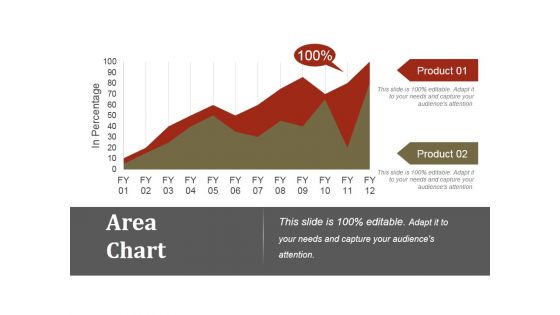
Area Chart Ppt PowerPoint Presentation Portfolio Ideas
This is a area chart ppt powerpoint presentation portfolio ideas. This is a two stage process. The stages in this process are area chart, growth, strategy, marketing, business.
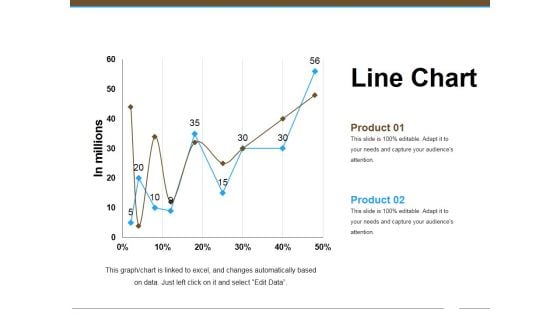
Line Chart Ppt Powerpoint Presentation Model Maker
This is a line chart ppt powerpoint presentation model maker. This is a two stage process. The stages in this process are line chart, growth, analysis, finance, business.

Line Chart Ppt PowerPoint Presentation Designs Download
This is a line chart ppt powerpoint presentation designs download. This is a two stage process. The stages in this process are growth, business, finance, strategy, line chart.
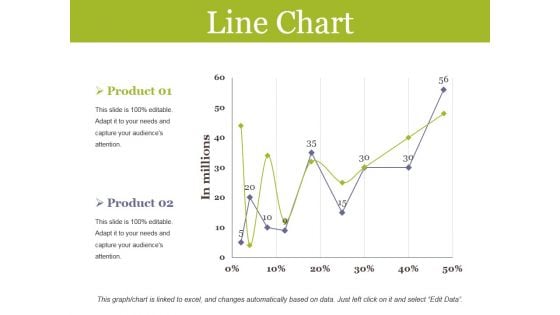
Line Chart Ppt PowerPoint Presentation Pictures Inspiration
This is a line chart ppt powerpoint presentation pictures inspiration. This is a two stage process. The stages in this process are line chart, finance, growth, analysis, business.
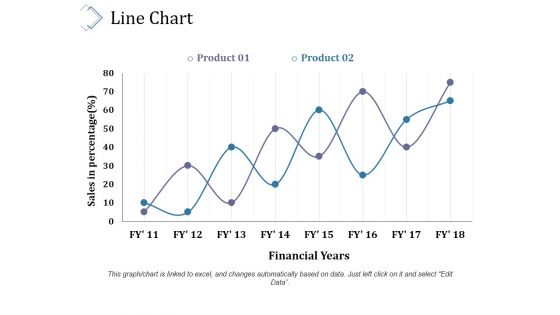
Line Chart Ppt PowerPoint Presentation Styles Slides
This is a line chart ppt powerpoint presentation styles slides. This is a two stage process. The stages in this process are line chart, business, growth, marketing, management.
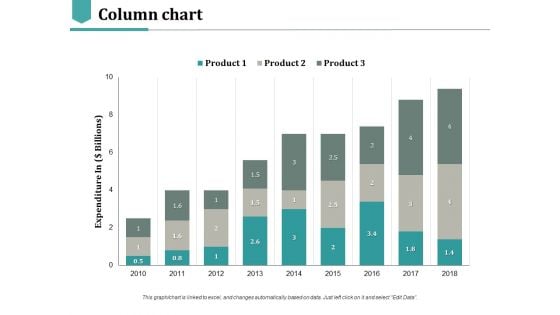
Column Chart Ppt PowerPoint Presentation Slides Diagrams
This is a column chart ppt powerpoint presentation slides diagrams. This is a three stage process. The stages in this process are business, marketing, management.
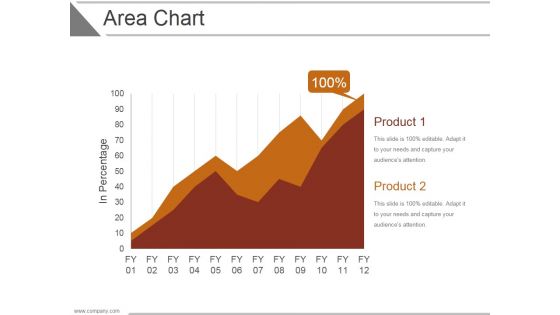
Area Chart Ppt PowerPoint Presentation Deck
This is a area chart ppt powerpoint presentation deck. This is a two stage process. The stages in this process are business, strategy, analysis, marketing, growth strategy.
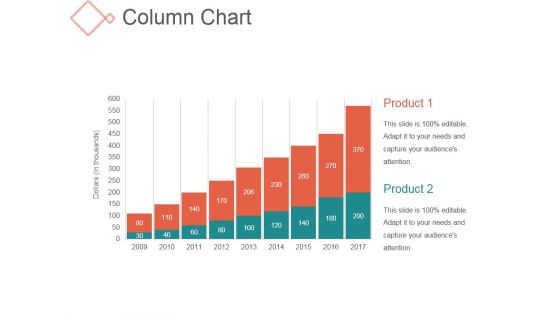
Column Chart Ppt PowerPoint Presentation Professional
This is a column chart ppt powerpoint presentation professional. This is a nine stage process. The stages in this process are product, growth, marketing, management.
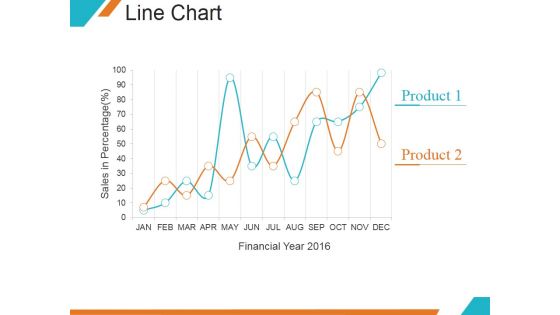
Line Chart Ppt PowerPoint Presentation Samples
This is a line chart ppt powerpoint presentation samples. This is a two stage process. The stages in this process are financial year, product, growth, marketing.
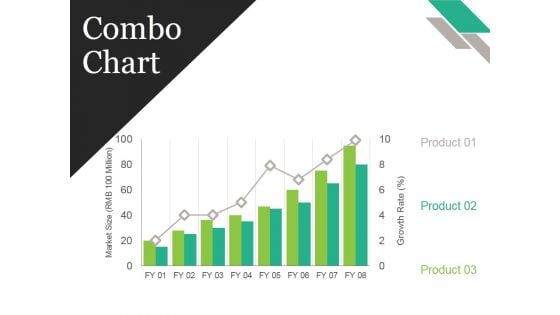
Combo Chart Ppt PowerPoint Presentation Pictures Gallery
This is a combo chart ppt powerpoint presentation pictures gallery. This is a eight stage process. The stages in this process are business, strategy, marketing, analysis, growth strategy.
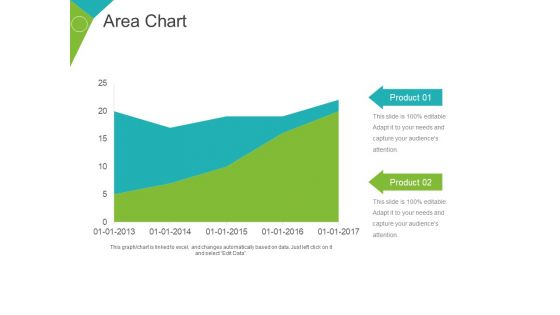
Area Chart Ppt PowerPoint Presentation Professional Portfolio
This is a area chart ppt powerpoint presentation professional portfolio. This is a two stage process. The stages in this process are product, business, growth, management, strategy.
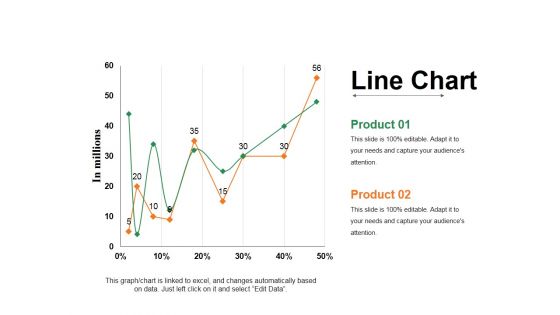
Line Chart Ppt PowerPoint Presentation Gallery Slide
This is a line chart ppt powerpoint presentation gallery slide. This is a two stage process. The stages in this process are in millions, business, marketing, growth, strategy.

Line Chart Ppt PowerPoint Presentation Layouts Portfolio
This is a line chart ppt powerpoint presentation layouts portfolio. This is a two stage process. The stages in this process are marketing, in millions, growth, strategy, business.
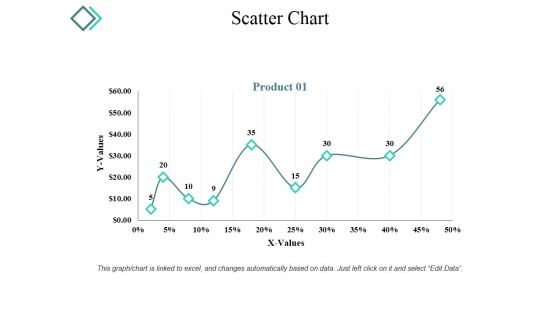
Scatter Chart Ppt PowerPoint Presentation Templates
This is a scatter chart ppt powerpoint presentation templates. This is a nine stage process. The stages in this process are product, values, business, marketing, growth, success.
Radar Chart Ppt PowerPoint Presentation Slides Icon
This is a radar chart ppt powerpoint presentation slides icon. This is a two stage process. The stages in this process are business, marketing, growth, success, radar.
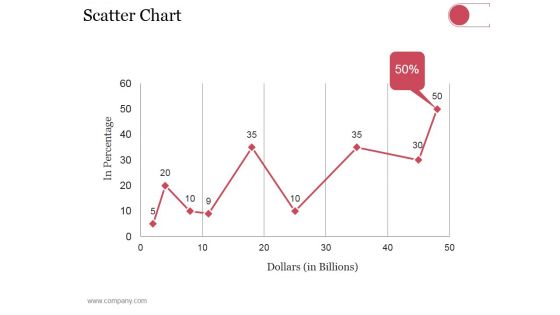
Scatter Chart Ppt PowerPoint Presentation Styles Show
This is a scatter chart ppt powerpoint presentation styles show. This is a nine stage process. The stages in this process are dollars, in percentage, finance, growth strategy.
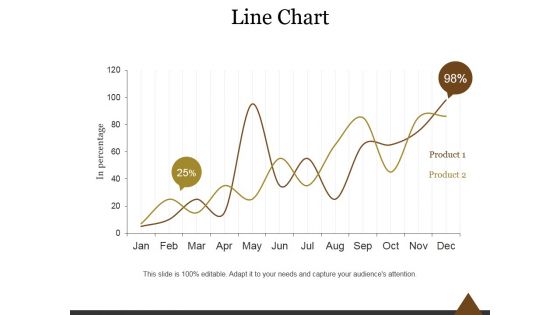
Line Chart Ppt PowerPoint Presentation Infographics
This is a line chart ppt powerpoint presentation infographics. This is a two stage process. The stages in this process are line chart, product, business, marketing, management.
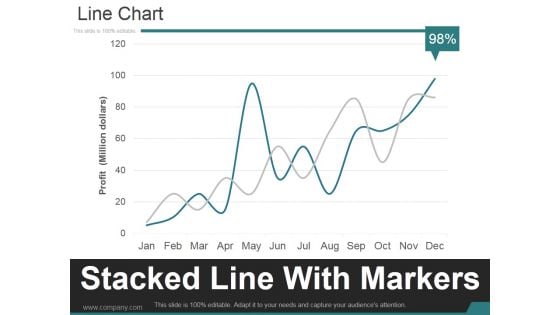
Line Chart Ppt PowerPoint Presentation Summary
This is a line chart ppt powerpoint presentation summary. This is a two stage process. The stages in this process are business, marketing, line chart, finance, markers.

Line Chart Ppt PowerPoint Presentation Gallery Good
This is a line chart ppt powerpoint presentation gallery good. This is a two stage process. The stages in this process are business, strategy, marketing, analysis, line chart.
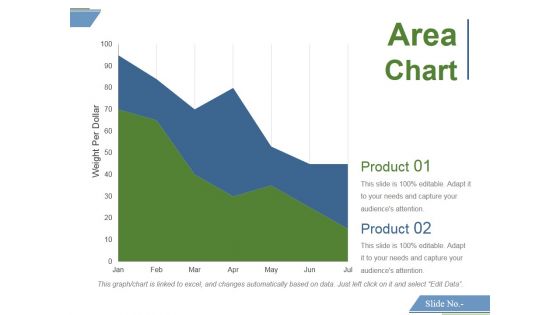
Area Chart Ppt PowerPoint Presentation Styles Designs
This is a area chart ppt powerpoint presentation styles designs. This is a two stage process. The stages in this process are area chart, product.
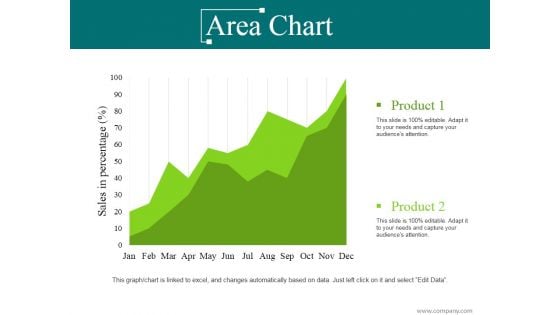
Area Chart Ppt PowerPoint Presentation Styles Skills
This is a area chart ppt powerpoint presentation styles skills. This is a two stage process. The stages in this process are growth, success, business, marketing, chart.
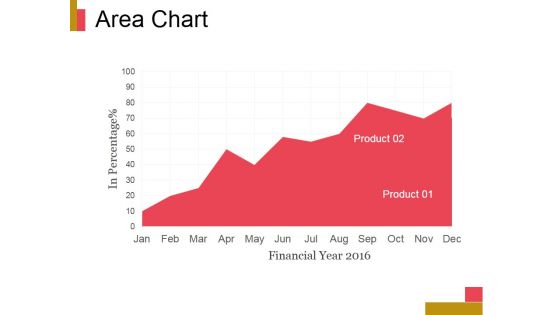
Area Chart Ppt PowerPoint Presentation Professional
This is a area chart ppt powerpoint presentation professional. This is a one stage process. The stages in this process are product, in percentage, jan, feb, mar, apr.
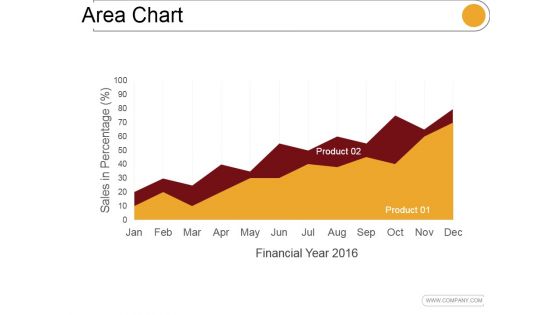
Area Chart Ppt PowerPoint Presentation Samples
This is a area chart ppt powerpoint presentation samples. This is a two stage process. The stages in this process are financial year, sales in percentage, jan, feb.

Scatter Chart Ppt PowerPoint Presentation File Example
This is a scatter chart ppt powerpoint presentation file example. This is a twelve stage process. The stages in this process are business, strategy, marketing, analysis, finance.
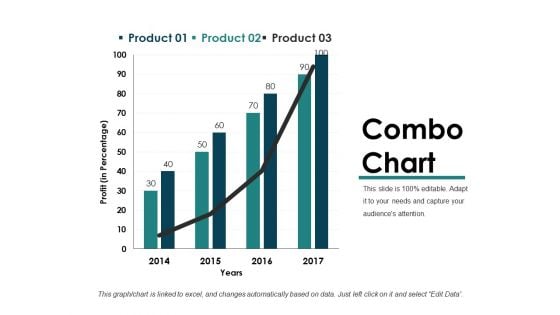
Combo Chart Ppt PowerPoint Presentation Slides Introduction
This is a combo chart ppt powerpoint presentation slides introduction. This is a four stage process. The stages in this process are profit, years, business, marketing, graph.
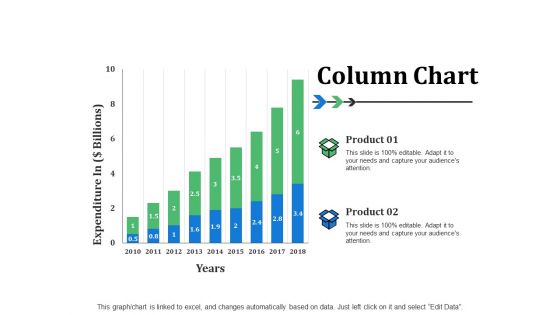
Column Chart Ppt PowerPoint Presentation Professional Shapes
This is a column chart ppt powerpoint presentation professional shapes. This is a two stage process. The stages in this process are business, management, marketing.
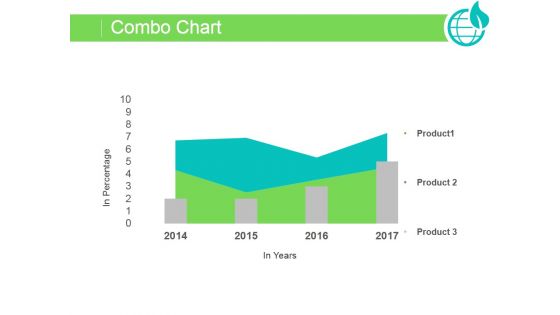
Combo Chart Ppt PowerPoint Presentation Pictures
This is a combo chart ppt powerpoint presentation pictures. This is a three stage process. The stages in this process are graph, success, growth, business, marketing.
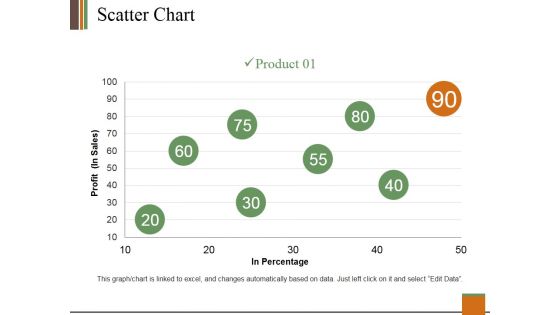
Scatter Chart Ppt PowerPoint Presentation Gallery Guide
This is a scatter chart ppt powerpoint presentation gallery guide. This is a one stage process. The stages in this process are profit, product, in percentage, growth, success.
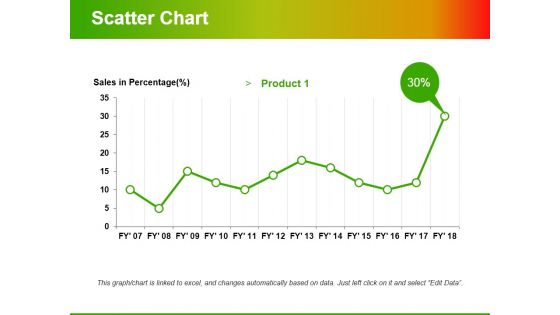
Scatter Chart Ppt PowerPoint Presentation Ideas Professional
This is a scatter chart ppt powerpoint presentation ideas professional. This is a one stage process. The stages in this process are product, percentage, growth, success, line graph.
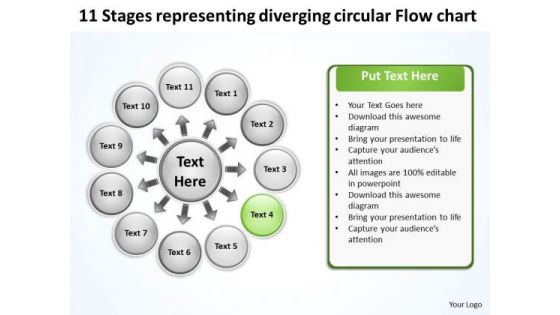
Representing Diverging Circular Flow Chart PowerPoint Templates
We present our representing diverging circular flow chart PowerPoint templates.Present our Ring charts PowerPoint Templates because this PPt slide helps you to measure key aspects of the current process and collect relevant data. Download our Circle charts PowerPoint Templates because the mind is always whirring with new ideas. Download our Process and Flows PowerPoint Templates because you have a clear vision of the cake you want. Download our Business PowerPoint Templates because you can Flutter your wings and enchant the world. Impress them with the innate attractiveness of your thoughts and words. Download our Marketing PowerPoint Templates because with the help of our Slides you can Illustrate your ideas one by one and demonstrate how each is an important cog in running the entire wheel.Use these PowerPoint slides for presentations relating to Circle, circulation, cobalt,colorful, cyan, cycle, element,emblem, grayshadow, green,icon, indicator, interface, internet, label,link, load, marker, motion, movement,navigationpanel, next, orientation, pagsite, pink, pointer, previous, process, reload, rotation, satined, sign, signpost,smooth, sticker, sticky, symbol. The prominent colors used in the PowerPoint template are Green, Black, White. Customers tell us our representing diverging circular flow chart PowerPoint templates will make the presenter successul in his career/life. We assure you our cobalt PowerPoint templates and PPT Slides are Nifty. PowerPoint presentation experts tell us our representing diverging circular flow chart PowerPoint templates are Fabulous. People tell us our grayshadow PowerPoint templates and PPT Slides will help you be quick off the draw. Just enter your specific text and see your points hit home. We assure you our representing diverging circular flow chart PowerPoint templates are Excellent. Use our cobalt PowerPoint templates and PPT Slides have awesome images to get your point across. Compile targets with our Representing Diverging Circular Flow Chart PowerPoint Templates. Download without worries with our money back guaranteee.
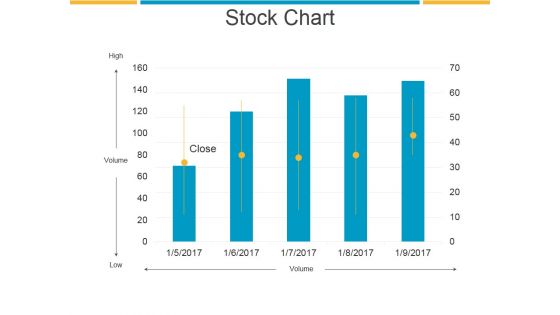
Stock Chart Ppt PowerPoint Presentation Guidelines
This is a stock chart ppt powerpoint presentation guidelines. This is a five stage process. The stages in this process are high, volume, low, close.
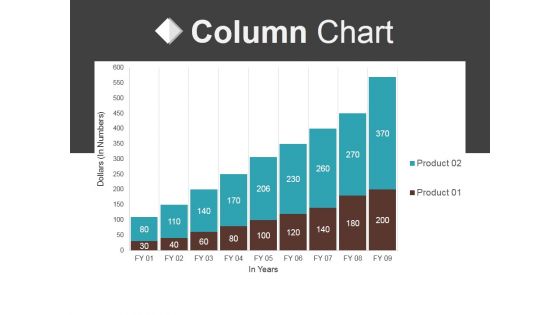
Column Chart Ppt PowerPoint Presentation Professional Vector
This is a column chart ppt powerpoint presentation professional vector. This is a nine stage process. The stages in this process are business, marketing, graph, finance, growth.

Column Chart Ppt PowerPoint Presentation Deck
This is a column chart ppt powerpoint presentation deck. This is a nine stage process. The stages in this process are business, marketing, product, graph, growth.

Combo Chart Ppt PowerPoint Presentation Sample
This is a combo chart ppt powerpoint presentation sample. This is a eight stage process. The stages in this process are product, market size, business, marketing, growth.
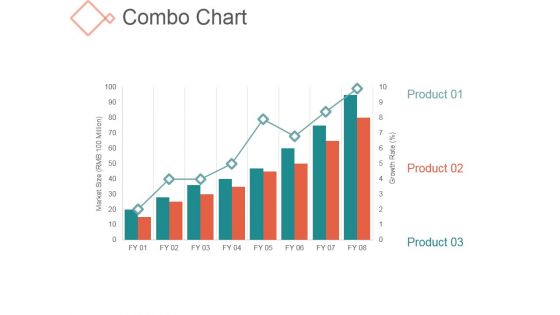
Combo Chart Ppt PowerPoint Presentation Tips
This is a combo chart ppt powerpoint presentation tips. This is a eight stage process. The stages in this process are product, growth, marketing, management.
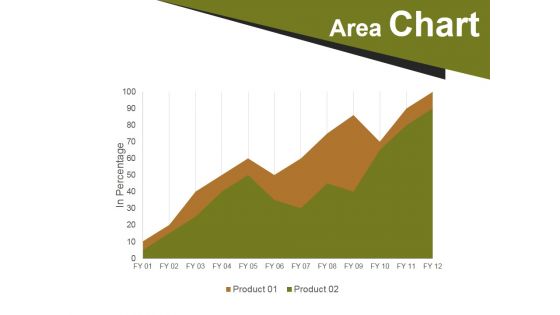
Area Chart Ppt PowerPoint Presentation Pictures Rules
This is a area chart ppt powerpoint presentation pictures rules. This is a two stage process. The stages in this process are area chart, business, marketing, strategy, success.
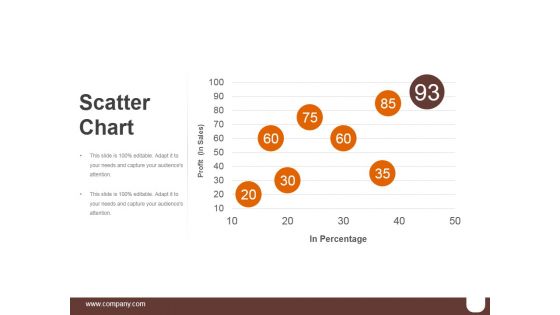
Scatter Chart Ppt PowerPoint Presentation Graphics
This is a scatter chart ppt powerpoint presentation graphics. This is a five stage process. The stages in this process are business, marketing, percentage, success, finance.
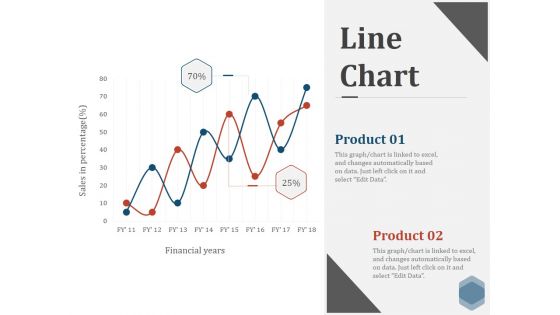
Line Chart Ppt PowerPoint Presentation Show Visuals
This is a line chart ppt powerpoint presentation show visuals. This is a two stage process. The stages in this process are financial, graph, line, marketing, success.
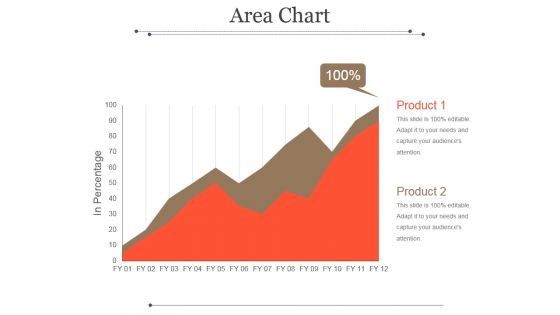
Area Chart Ppt PowerPoint Presentation Picture
This is a area chart ppt powerpoint presentation picture. This is a two stage process. The stages in this process are product, in percentage, graph, management, business.
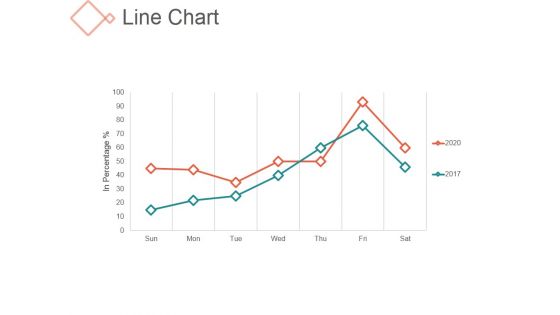
Line Chart Ppt PowerPoint Presentation Show
This is a line chart ppt powerpoint presentation show. This is a seven stage process. The stages in this process are sun, mon, tue, wed.
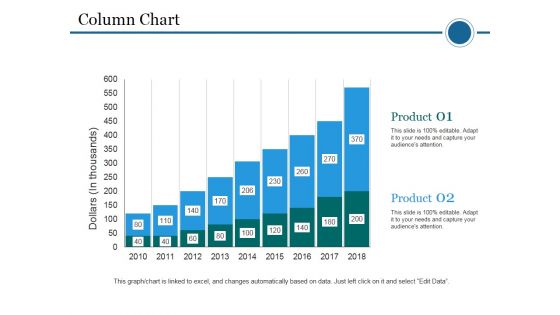
Column Chart Ppt PowerPoint Presentation Ideas Styles
This is a column chart ppt powerpoint presentation ideas styles. This is a two stage process. The stages in this process are dollars, product, planning, business, years.
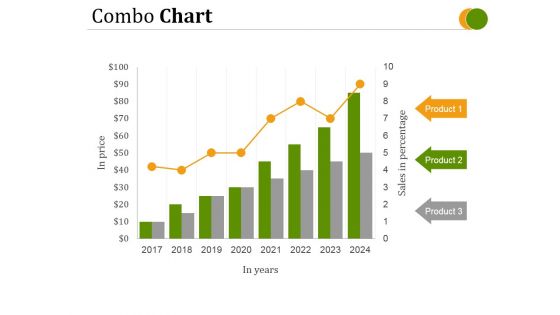
Combo Chart Ppt PowerPoint Presentation Deck
This is a combo chart ppt powerpoint presentation deck. This is a eight stage process. The stages in this process are in price, in years, product.
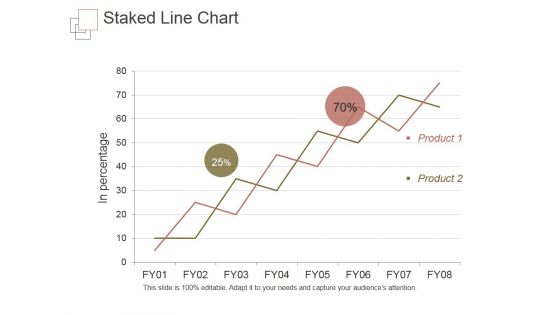
Staked Line Chart Ppt PowerPoint Presentation Topics
This is a staked line chart ppt powerpoint presentation topics. This is a two stage process. The stages in this process are in percentage, product.
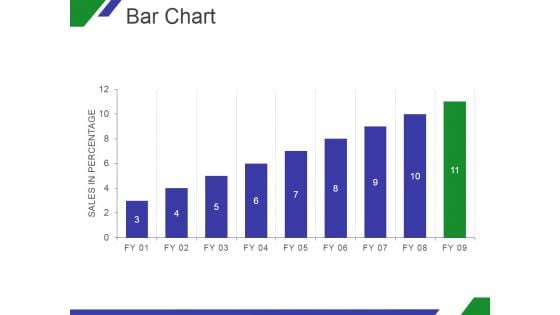
Bar Chart Ppt PowerPoint Presentation Ideas
This is a bar chart ppt powerpoint presentation ideas. This is a nine stage process. The stages in this process are graph, in percentage, growth, business, marketing.
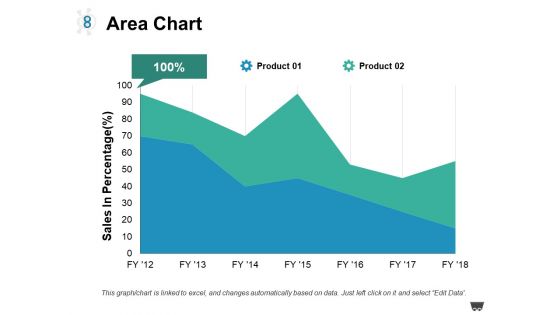
Area Chart Ppt PowerPoint Presentation Model Guidelines
This is a area chart ppt powerpoint presentation model guidelines. This is a two stage process. The stages in this process are product, area chart, sales in percentage.
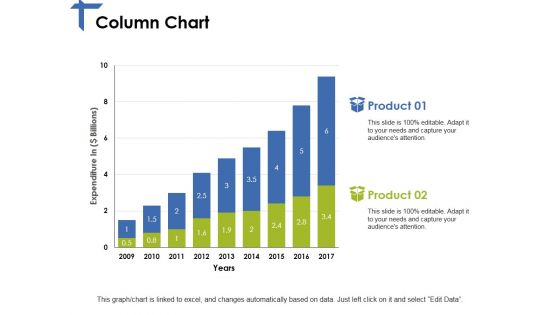
Column Chart Ppt PowerPoint Presentation Portfolio Topics
This is a column chart ppt powerpoint presentation portfolio topics. This is a two stage process. The stages in this process are expenditure, years, product, growth, success.
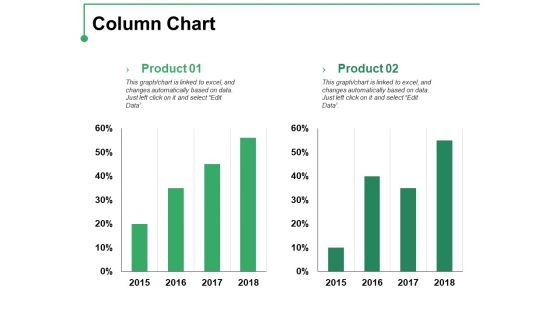
Column Chart Ppt PowerPoint Presentation Professional Template
This is a column chart ppt powerpoint presentation professional template. This is a two stage process. The stages in this process are product, percentage, finance, bar graph, growth.
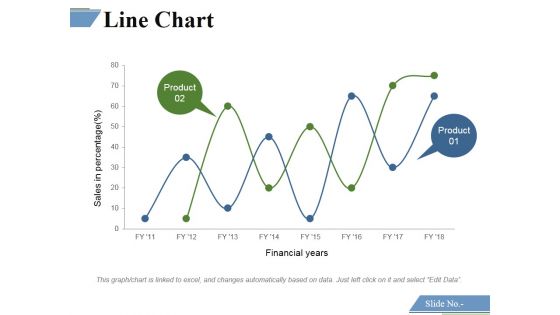
Line Chart Ppt PowerPoint Presentation Inspiration Mockup
This is a line chart ppt powerpoint presentation inspiration mockup. This is a two stage process. The stages in this process are line chart, fiance, success, strategy, management.
Area Chart Ppt PowerPoint Presentation Icon Designs
This is a area chart ppt powerpoint presentation icon designs. This is a two stage process. The stages in this process are business, marketing, strategy, finance, growth.

Column Chart Ppt PowerPoint Presentation Show Images
This is a column chart ppt powerpoint presentation show images. This is a two stage process. The stages in this process are product, expenditure, years, bar graph, growth.
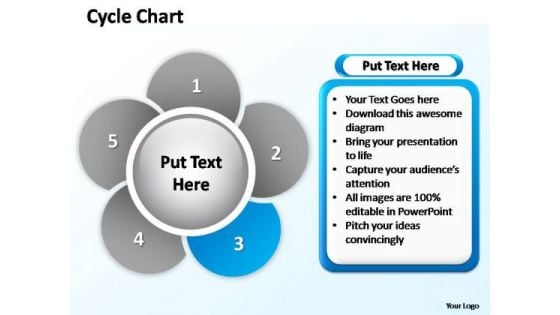
PowerPoint Designs Company Cycle Chart Ppt Process
PowerPoint Designs Company Cycle Chart PPT Process-Cycle Diagrams are a type of graphics that shows how items are related to one another in a repeating cycle. In a cycle diagram, you can explain the main events in the cycle, how they interact, and how the cycle repeats. These Diagrams can be used to interact visually and logically with audiences. -PowerPoint Designs Company Cycle Chart PPT Process Achieve strategic & tactical operations with our PowerPoint Designs Company Cycle Chart Ppt Process. They will make you look good.


 Continue with Email

 Home
Home


