Improvement Chart
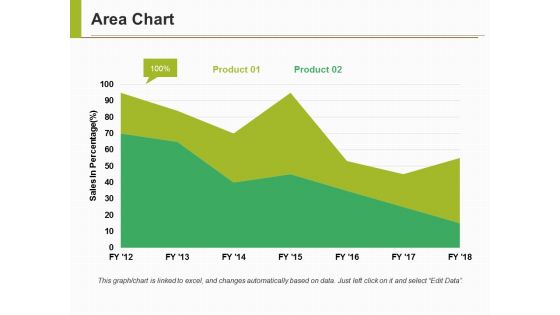
Area Chart Ppt PowerPoint Presentation Pictures Influencers
This is a area chart ppt powerpoint presentation pictures influencers. This is a two stage process. The stages in this process are business, marketing, strategy, finance, planning.
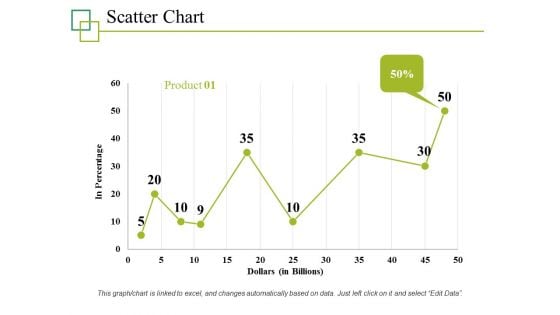
Scatter Chart Ppt PowerPoint Presentation File Graphics
This is a scatter chart ppt powerpoint presentation file graphics. This is a one stage process. The stages in this process are business, marketing, strategy, planning, finance.
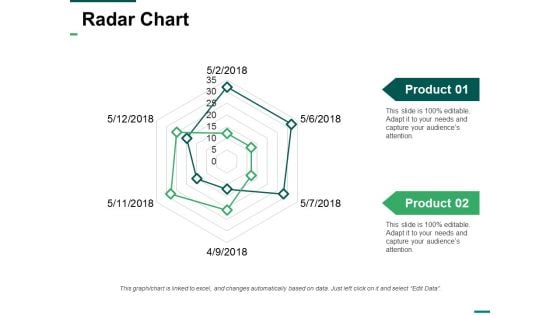
Radar Chart Ppt PowerPoint Presentation Slides Deck
This is a radar chart ppt powerpoint presentation slides deck. This is a two stage process. The stages in this process are radar, marketing, strategy, finance, planning.
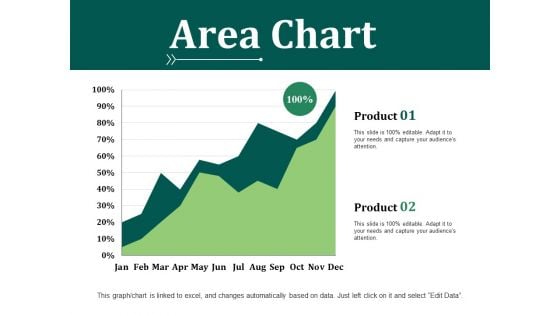
Area Chart Ppt PowerPoint Presentation Model Designs
This is a area chart ppt powerpoint presentation model designs. This is a three stage process. The stages in this process are business, marketing, strategy, planning, finance.
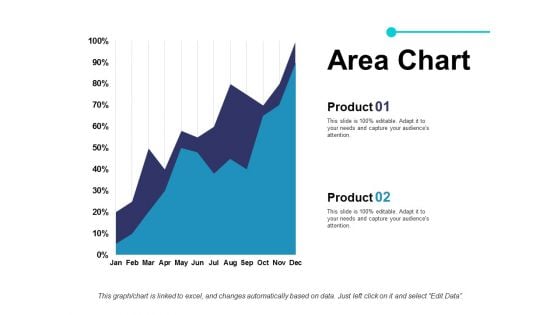
Area Chart Ppt PowerPoint Presentation File Outfit
This is a area chart ppt powerpoint presentation file outfit. This is a two stage process. The stages in this process are business, marketing, strategy, planning, finance.
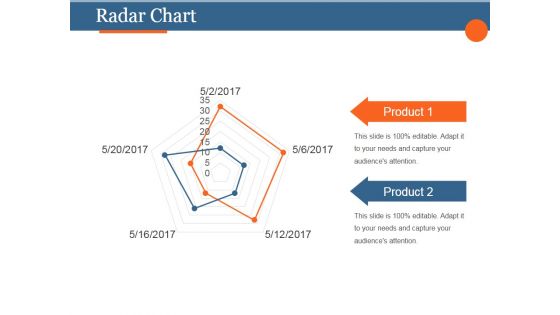
Radar Chart Ppt PowerPoint Presentation Slide
This is a radar chart ppt powerpoint presentation slide. This is a two stage process. The stages in this process are product, strategy, marketing, management, business.
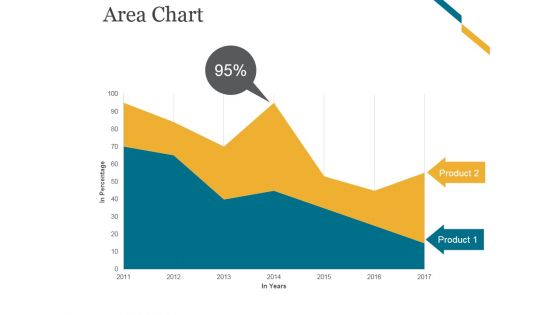
Area Chart Ppt PowerPoint Presentation Summary
This is a area chart ppt powerpoint presentation summary. This is a two stage process. The stages in this process are business, marketing, finance, timeline, product.
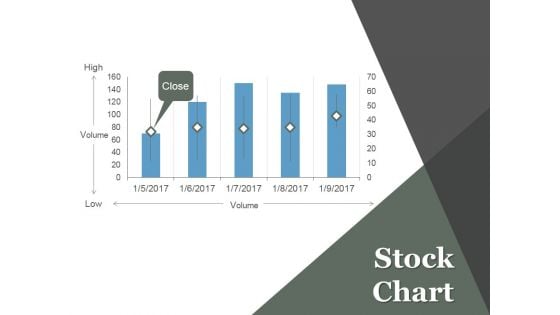
Stock Chart Ppt PowerPoint Presentation Information
This is a stock chart ppt powerpoint presentation information. This is a five stage process. The stages in this process are projects, marketing, high, volume, low.
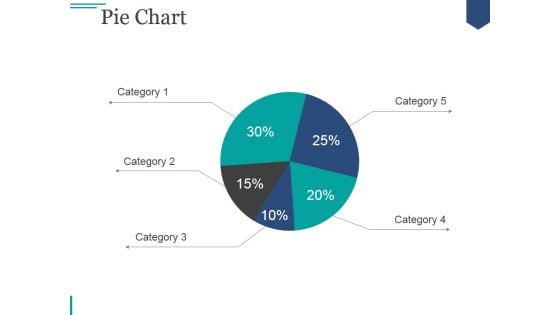
Pie Chart Ppt PowerPoint Presentation Visual Aids
This is a pie chart ppt powerpoint presentation visual aids. This is a five stage process. The stages in this process are pie, finance, analysis, division, percentage.
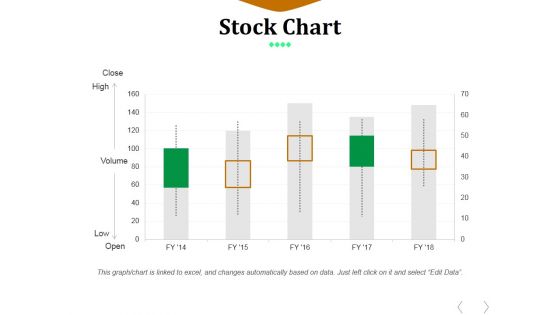
Stock Chart Ppt PowerPoint Presentation Professional Maker
This is a stock chart ppt powerpoint presentation professional maker. This is a five stage process. The stages in this process are close, high, volume, low, open.
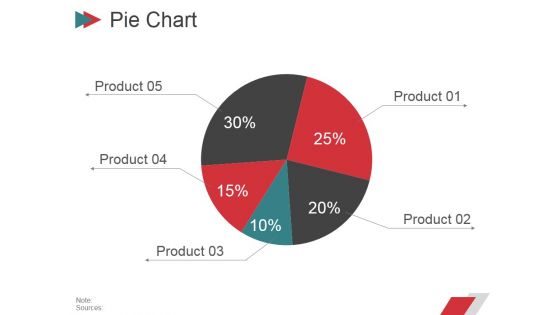
Pie Chart Ppt PowerPoint Presentation Deck
This is a pie chart ppt powerpoint presentation deck. This is a five stage process. The stages in this process are business, pie, finance, percentage, product.
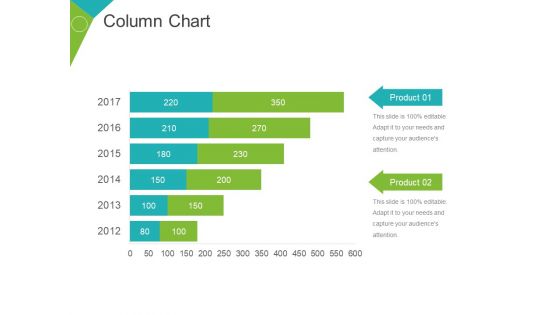
Column Chart Ppt PowerPoint Presentation Gallery
This is a column chart ppt powerpoint presentation gallery. This is a six stage process. The stages in this process are business, finance, years, product, graph.
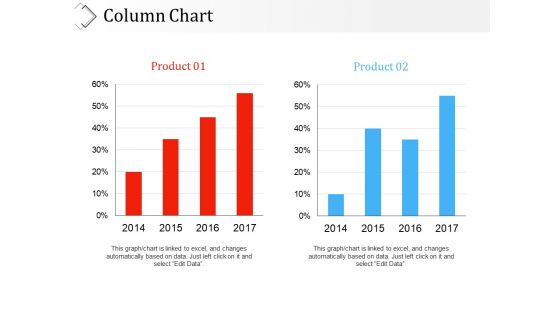
Column Chart Ppt PowerPoint Presentation Inspiration Deck
This is a column chart ppt powerpoint presentation inspiration deck. This is a two stage process. The stages in this process are years, business, marketing, graph, finance, product.
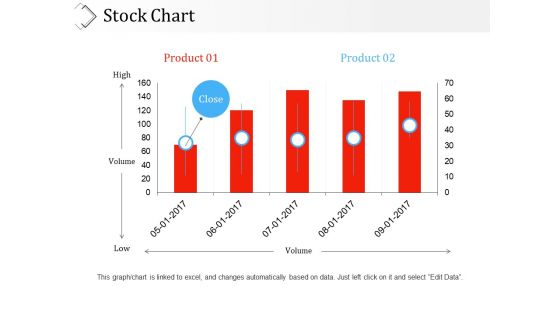
Stock Chart Ppt PowerPoint Presentation Ideas Sample
This is a stock chart ppt powerpoint presentation ideas sample. This is a five stage process. The stages in this process are product, high, low, volume, business.
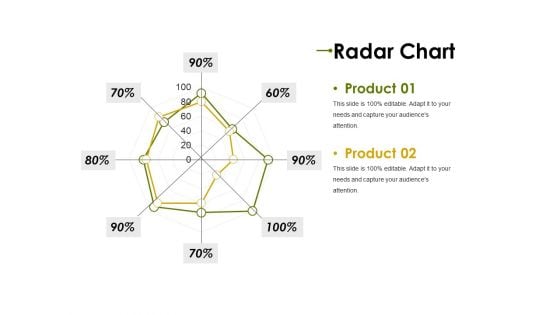
Radar Chart Ppt PowerPoint Presentation Styles Guide
This is a radar chart ppt powerpoint presentation styles guide. This is a two stage process. The stages in this process are product, graph, business, marketing, finance.
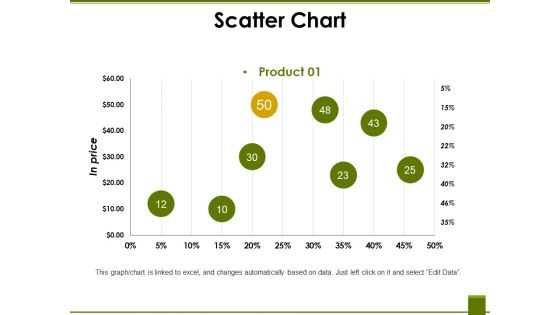
Scatter Chart Ppt PowerPoint Presentation File Display
This is a scatter chart ppt powerpoint presentation file display. This is a eight stage process. The stages in this process are product, business, marketing, finance, in price.
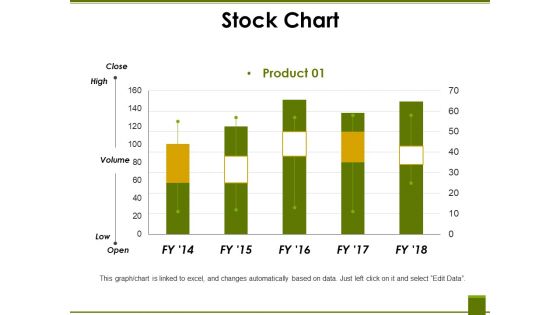
Stock Chart Ppt PowerPoint Presentation Summary Pictures
This is a stock chart ppt powerpoint presentation summary pictures. This is a five stage process. The stages in this process are high, volume, low, product, graph.
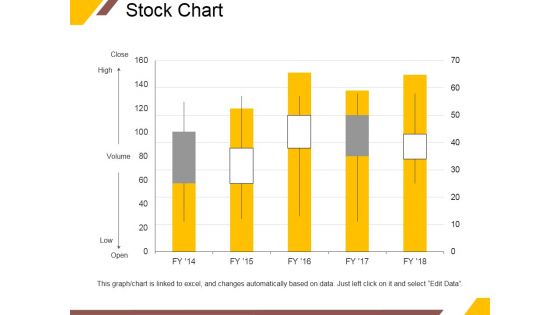
Stock Chart Ppt PowerPoint Presentation Professional Pictures
This is a stock chart ppt powerpoint presentation professional pictures. This is a five stage process. The stages in this process are close, high, volume, low, open.
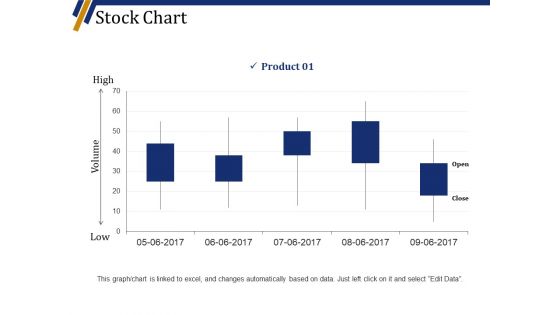
Stock Chart Ppt PowerPoint Presentation Slides Maker
This is a stock chart ppt powerpoint presentation slides maker. This is a five stage process. The stages in this process are high, volume, low, product, business, graph.
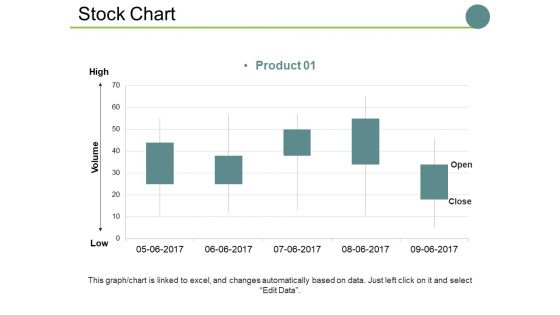
Stock Chart Ppt PowerPoint Presentation Show Sample
This is a stock chart ppt powerpoint presentation show sample. This is a one stage process. The stages in this process are high, volume, low, business, graph, marketing.
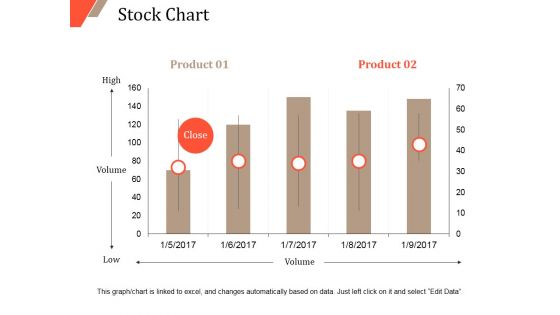
Stock Chart Ppt PowerPoint Presentation Styles Deck
This is a stock chart ppt powerpoint presentation styles deck. This is a two stage process. The stages in this process are high, volume, low.
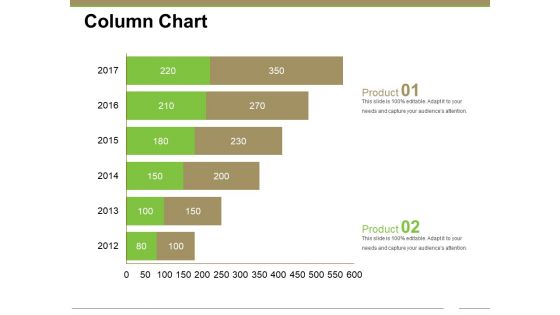
Column Chart Ppt PowerPoint Presentation Gallery Styles
This is a column chart ppt powerpoint presentation gallery styles. This is a two stage process. The stages in this process are years, graph, business, marketing, finance.
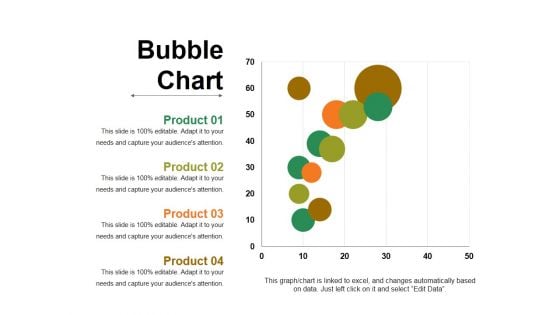
Bubble Chart Ppt PowerPoint Presentation Show Graphics
This is a bubble chart ppt powerpoint presentation show graphics. This is a four stage process. The stages in this process are business, marketing, graph, finance, strategy.

Stock Chart Ppt PowerPoint Presentation Show Backgrounds
This is a stock chart ppt powerpoint presentation show backgrounds. This is a one stage process. The stages in this process are high, volume, low, business, marketing.
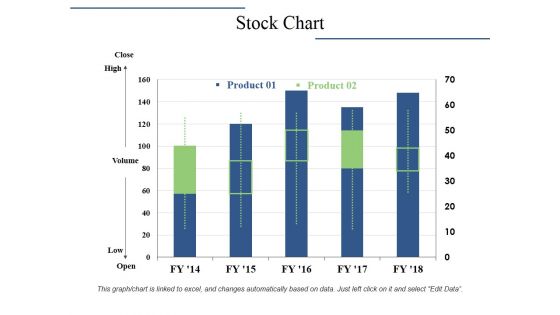
Stock Chart Ppt PowerPoint Presentation Model Grid
This is a stock chart ppt powerpoint presentation model grid. This is a two stage process. The stages in this process are close, high, volume, low, open, product.
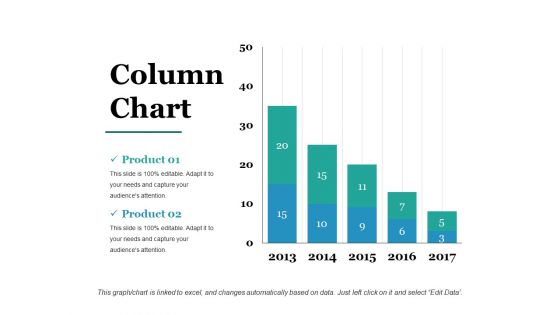
Column Chart Ppt PowerPoint Presentation Styles Picture
This is a column chart ppt powerpoint presentation styles picture. This is a five stage process. The stages in this process are years, business, marketing, graph, finance.

Column Chart Ppt Powerpoint Presentation Slides Ideas
This is a column chart ppt powerpoint presentation slides ideas. This is a six stage process. The stages in this process are business, finance, analysis, marketing, strategy.
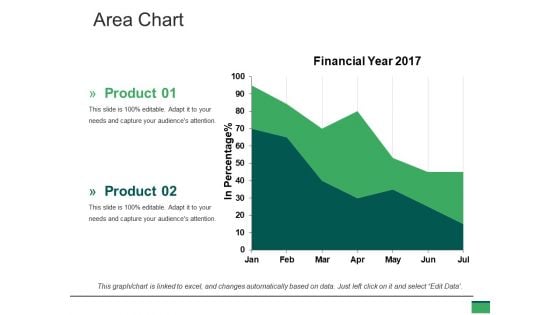
Area Chart Ppt PowerPoint Presentation Ideas Tips
This is a area chart ppt powerpoint presentation ideas tips. This is a two stage process. The stages in this process are in percentage, financial, year, business, marketing.
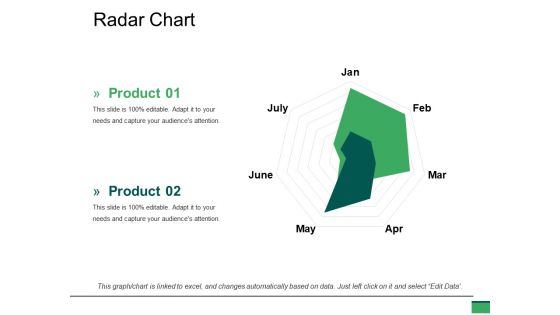
Radar Chart Ppt PowerPoint Presentation Summary Slides
This is a radar chart ppt powerpoint presentation summary slides. This is a two stage process. The stages in this process are marketing, finance, radar, business, marketing.
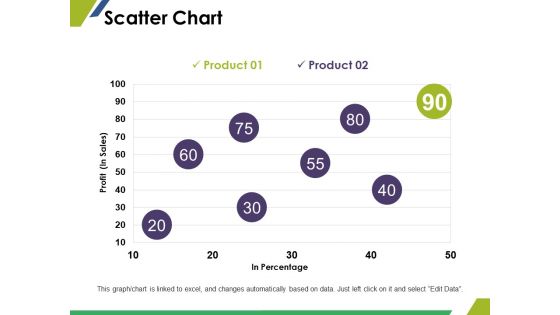
Scatter Chart Ppt PowerPoint Presentation Styles Images
This is a scatter chart ppt powerpoint presentation styles images. This is a two stage process. The stages in this process are in percentage, profit, finance, marketing, business.
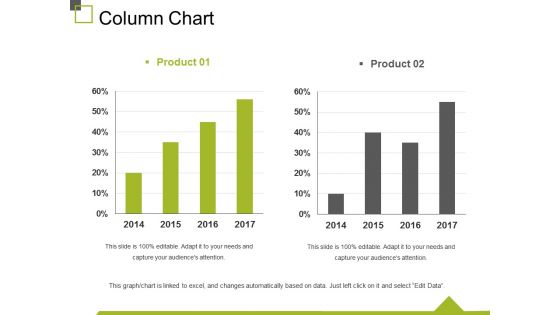
Column Chart Ppt PowerPoint Presentation Summary Slides
This is a column chart ppt powerpoint presentation summary slides. This is a two stage process. The stages in this process are finance, marketing, business, graph, years.
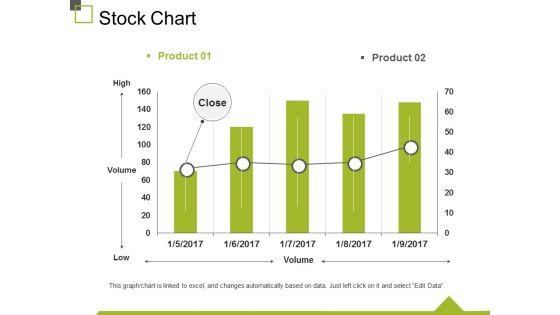
Stock Chart Ppt PowerPoint Presentation Summary Graphics
This is a stock chart ppt powerpoint presentation summary graphics. This is a two stage process. The stages in this process are High, Volume, Low, Business, Marketing.
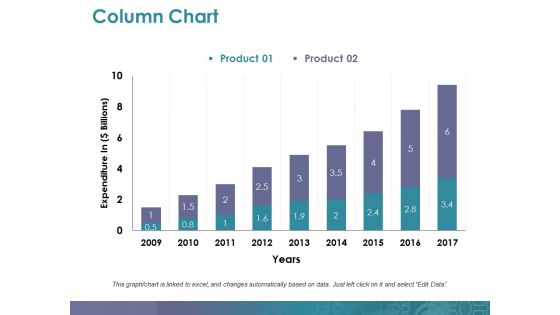
Column Chart Ppt PowerPoint Presentation Summary Deck
This is a column chart ppt powerpoint presentation summary deck. This is a two stage process. The stages in this process are expenditure in, years, business, marketing, graph.
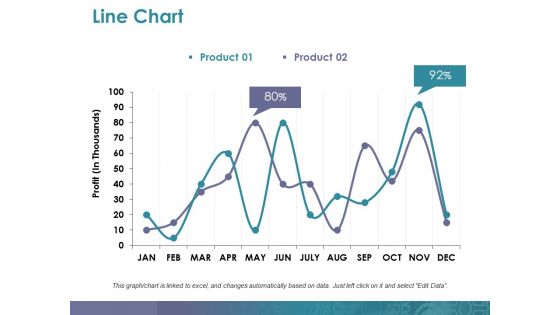
Line Chart Ppt PowerPoint Presentation Summary Rules
This is a line chart ppt powerpoint presentation summary rules. This is a two stage process. The stages in this process are profit, business, marketing, graph, finance.
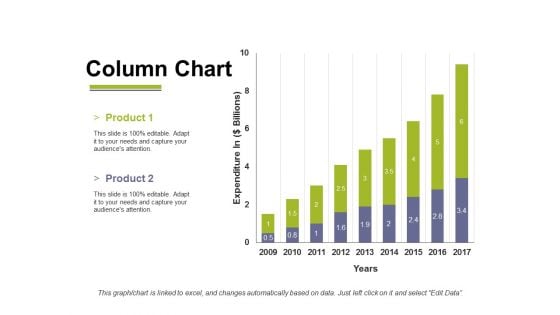
Column Chart Ppt PowerPoint Presentation File Inspiration
This is a column chart ppt powerpoint presentation file inspiration. This is a two stage process. The stages in this process are business, marketing, years, expenditure in, graph.
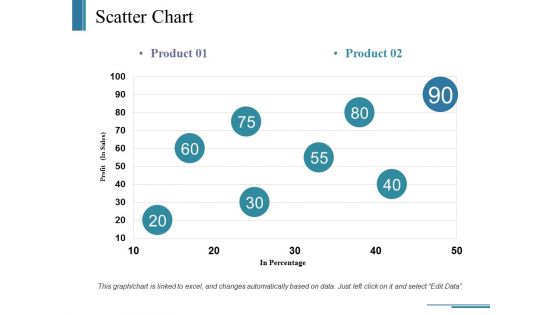
Scatter Chart Ppt PowerPoint Presentation Ideas Example
This is a scatter chart ppt powerpoint presentation ideas example. This is a two stage process. The stages in this process are business, in percentage, profit, marketing, graph.
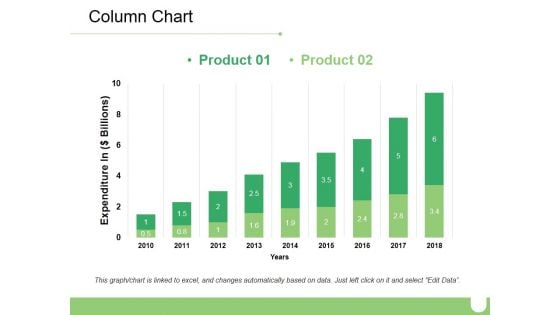
Column Chart Ppt PowerPoint Presentation Show Example
This is a column chart ppt powerpoint presentation show example. This is a two stage process. The stages in this process are business, marketing, expenditure in, finance, years.
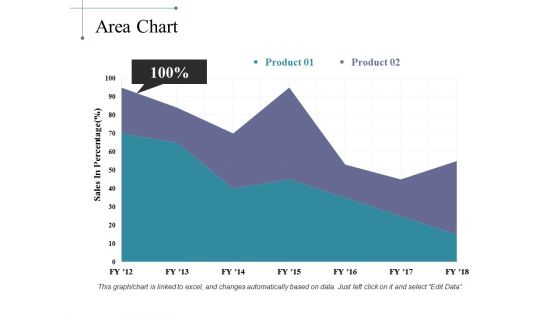
Area Chart Ppt PowerPoint Presentation Inspiration Guide
This is a area chart ppt powerpoint presentation inspiration guide. This is a two stage process. The stages in this process are business, marketing, strategy, finance, analysis.

Column Chart Ppt PowerPoint Presentation Ideas Deck
This is a column chart ppt powerpoint presentation ideas deck. This is a two stage process. The stages in this process are business, marketing, dollars, in years, graph.
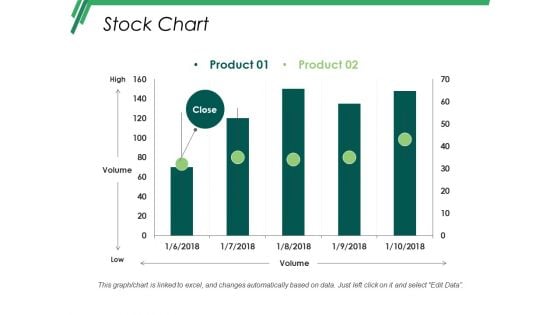
Stock Chart Ppt PowerPoint Presentation Ideas Designs
This is a stock chart ppt powerpoint presentation ideas designs. This is a five stage process. The stages in this process are business, marketing, strategy, finance, analysis.
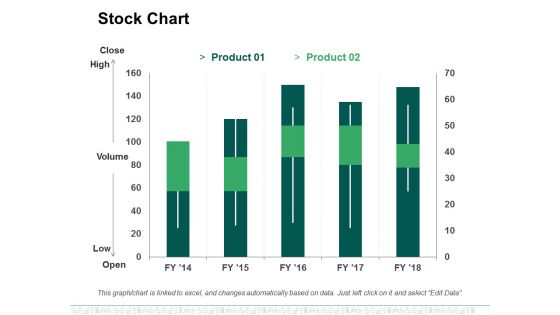
Stock Chart Ppt PowerPoint Presentation Show
This is a stock chart ppt powerpoint presentation show. This is a two stage process. The stages in this process are high, volume, low, business, marketing.
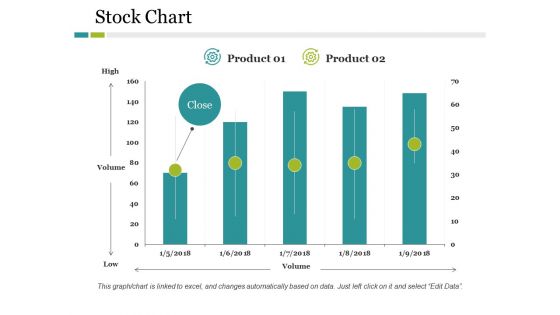
Stock Chart Ppt PowerPoint Presentation Layouts Portfolio
This is a stock chart ppt powerpoint presentation layouts portfolio. This is a two stage process. The stages in this process are business, marketing, high, volume, low, finance.
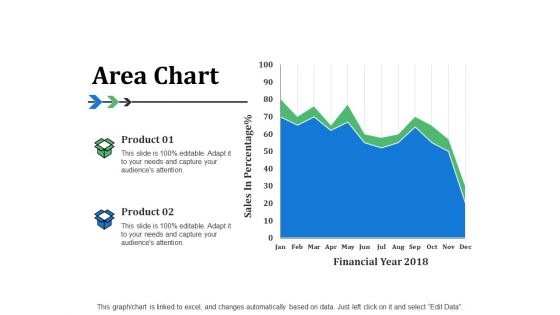
Area Chart Ppt PowerPoint Presentation Summary Backgrounds
This is a area chart ppt powerpoint presentation summary backgrounds. This is a two stage process. The stages in this process are percentage, financial, business, management.
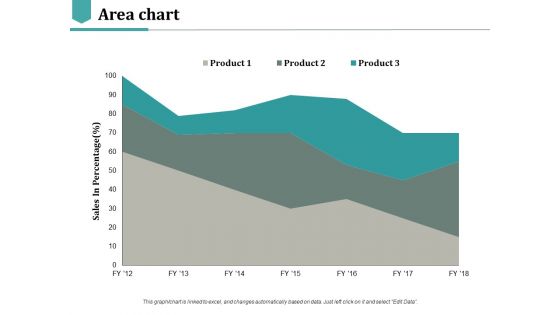
Area Chart Ppt PowerPoint Presentation Styles Ideas
This is a area chart ppt powerpoint presentation styles ideas. This is a three stage process. The stages in this process are percentage, product, business.

Line Chart Ppt PowerPoint Presentation File Sample
This is a line chart ppt powerpoint presentation file sample. This is a two stage process. The stages in this process are finance, marketing, management, investment, analysis.
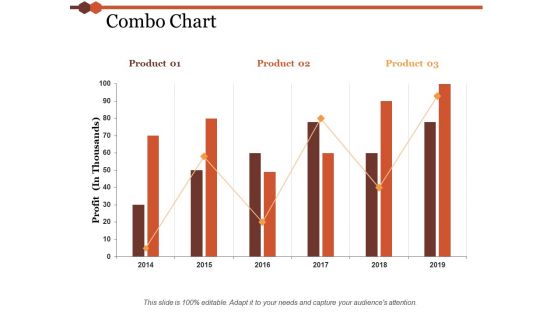
Combo Chart Ppt PowerPoint Presentation Model Professional
This is a combo chart ppt powerpoint presentation model professional. This is a three stage process. The stages in this process are finance, marketing, management, investment, analysis.
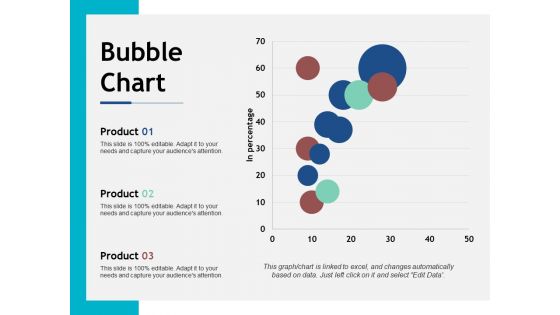
Bubble Chart Ppt PowerPoint Presentation Styles Show
This is a bubble chart ppt powerpoint presentation styles show. This is a three stage process. The stages in this process are finance, marketing, management, investment, analysis.
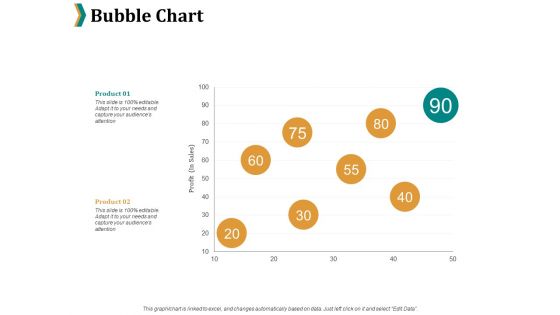
Bubble Chart Ppt PowerPoint Presentation Background Designs
This is a bubble chart ppt powerpoint presentation background designs. This is a two stage process. The stages in this process are product, percentage, marketing, business.
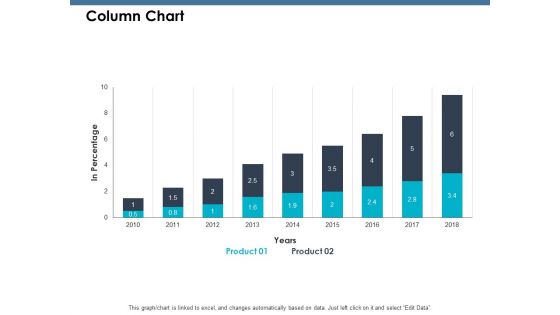
Column Chart Ppt PowerPoint Presentation Pictures Aids
This is a column chart ppt powerpoint presentation pictures aids. This is a two stage process. The stages in this process are Percentage, Product, Marketing, Management.
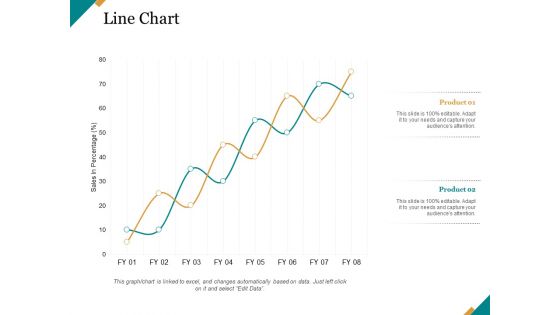
Line Chart Ppt PowerPoint Presentation Pictures Graphics
This is a line chart ppt powerpoint presentation pictures graphics. This is a two stage process. The stages in this process are finance, marketing, management, investment, analysis.
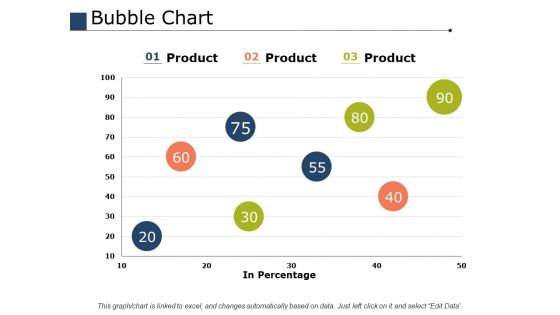
Bubble Chart Ppt PowerPoint Presentation Ideas Images
This is a bubble chart ppt powerpoint presentation ideas images. This is a three stage process. The stages in this process are percentage, product, marketing, business.
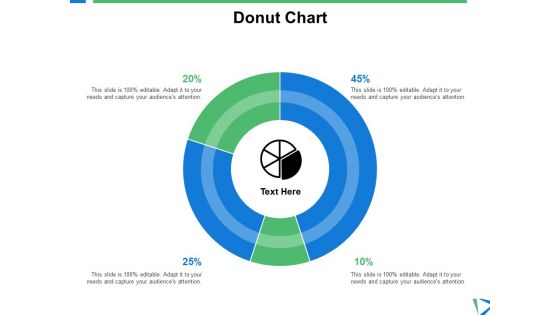
Donut Chart Investment Ppt PowerPoint Presentation Shapes
This is a donut chart investment ppt powerpoint presentation shapes. This is a four stage process. The stages in this process are finance, analysis, business, investment, marketing.
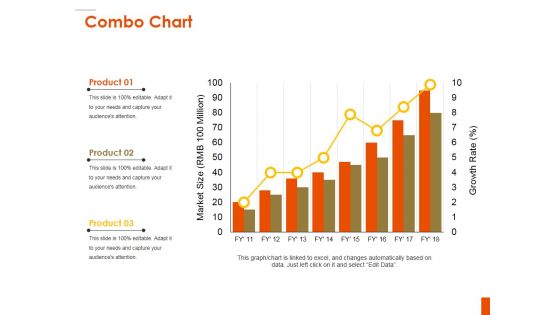
Combo Chart Ppt PowerPoint Presentation Inspiration Background
This is a combo chart ppt powerpoint presentation inspiration background. This is a three stage process. The stages in this process are product, bar graph, market size, growth, growth rate.
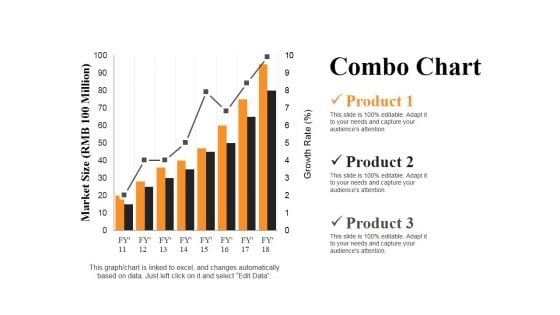
Combo Chart Ppt PowerPoint Presentation Summary Slides
This is a combo chart ppt powerpoint presentation summary slides. This is a three stage process. The stages in this process are market size, product, growth rate, bar graph, success.
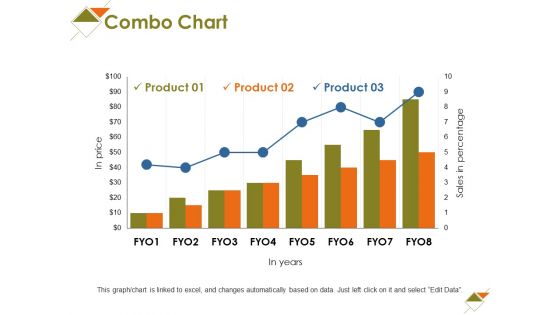
Combo Chart Ppt PowerPoint Presentation Show Elements
This is a combo chart ppt powerpoint presentation show elements. This is a three stage process. The stages in this process are in price, in years, business, marketing, growth.
Bar Chart Ppt PowerPoint Presentation Icon Information
This is a bar chart ppt powerpoint presentation icon information. This is a one stage process. The stages in this process are product, sales in percentage, financial years, bar graph, growth.
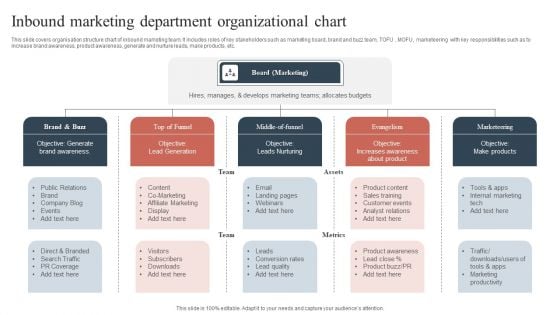
Inbound Marketing Department Organizational Chart Information PDF
This slide covers organisation structure chart of inbound marketing team. It includes roles of key stakeholders such as marketing board, brand and buzz team, TOFU , MOFU, marketeering with key responsibilities such as to increase brand awareness, product awareness, generate and nurture leads, make products, etc. Presenting Inbound Marketing Department Organizational Chart Information PDF to dispense important information. This template comprises three stages. It also presents valuable insights into the topics including Brand Awareness, Increases Awareness, Affiliate Marketing. This is a completely customizable PowerPoint theme that can be put to use immediately. So, download it and address the topic impactfully.
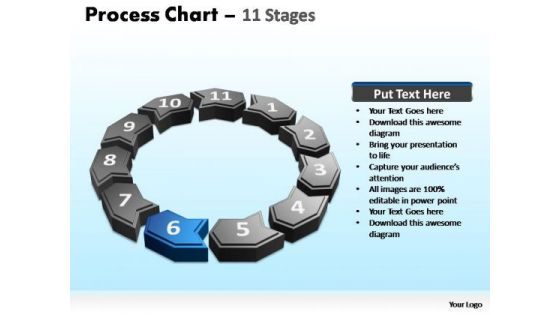
PowerPoint Layouts Graphic Process Chart Ppt Slides
PowerPoint Layouts Graphic process chart PPT Slides-These amazing PowerPoint pre-designed slides and PowerPoint templates have been carefully created by our team of experts to help you impress your audience. Our stunning collection of Powerpoint slides are 100% editable and can easily fit in any PowerPoint presentations. By using these animations and graphics in PowerPoint and you can easily make professional presentations. Any text can be entered at any point in the PowerPoint template or slide. Just DOWNLOAD our awesome PowerPoint templates and you are ready to go. Exceed estimates with our PowerPoint Layouts Graphic Process Chart Ppt Slides. Your ideas will deliver a breakthrough.
Combo Chart Ppt PowerPoint Presentation Icon Introduction
This is a combo chart ppt powerpoint presentation icon introduction. This is a three stage process. The stages in this process are combo chart, product, growth rate, market size, growth.
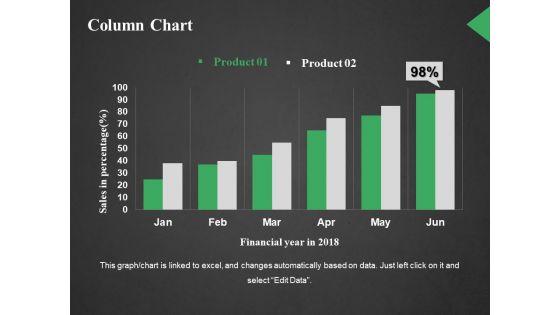
Column Chart Ppt PowerPoint Presentation Outline Styles
This is a column chart ppt powerpoint presentation outline styles. This is a two stage process. The stages in this process are sales in percentage, financial year in, business, marketing, graph.


 Continue with Email

 Home
Home


