Improvement Chart
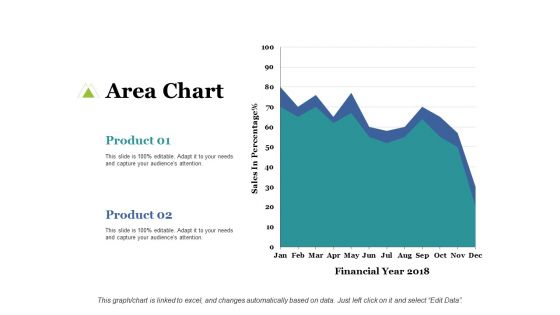
Area Chart Finance Ppt PowerPoint Presentation Ideas Slideshow
This is a area chart finance ppt powerpoint presentation ideas slideshow. This is a two stage process. The stages in this process are area chart, analysis, finance, marketing, management.
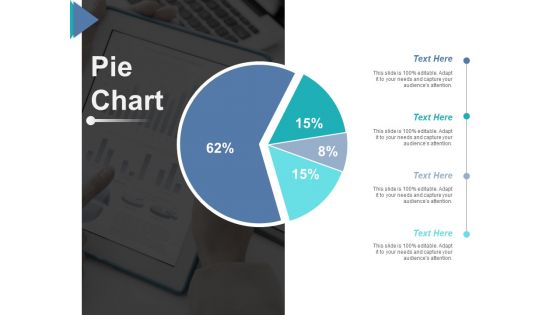
Pie Chart Ppt PowerPoint Presentation Inspiration Example File
This is a pie chart ppt powerpoint presentation inspiration example file. This is a four stage process. The stages in this process are pie chart, finance, percentage, business, marketing.
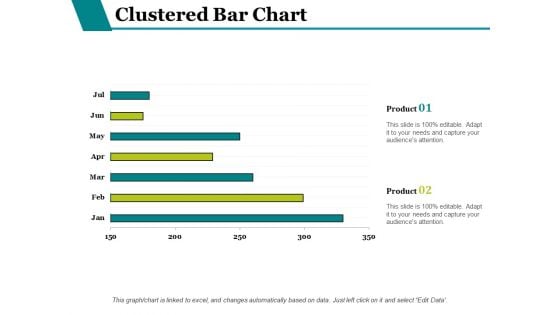
Clustered Bar Chart Finance Ppt PowerPoint Presentation Styles Design Inspiration
This is a clustered bar chart finance ppt powerpoint presentation styles design inspiration. This is a two stage process. The stages in this process are clustered bar chart, finance, business, analysis, investment.
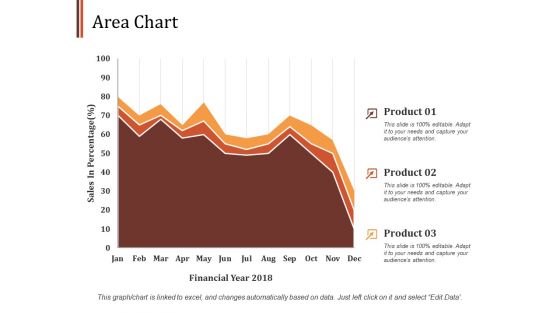
Area Chart Finance Ppt PowerPoint Presentation Infographics Design Ideas
This is a area chart finance ppt powerpoint presentation infographics design ideas. This is a three stage process. The stages in this process are area chart, finance, marketing, management, investment.
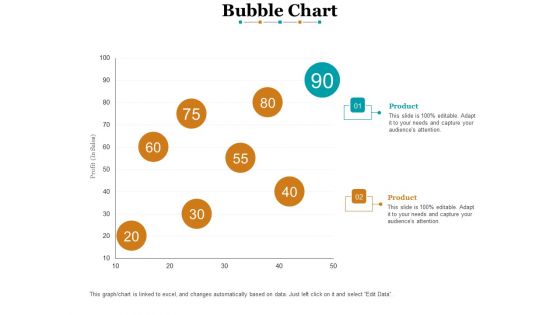
Bubble Chart Finance Ppt PowerPoint Presentation File Graphics
This is a bubble chart finance ppt powerpoint presentation file graphics. This is a two stage process. The stages in this process are bubble chart, finance, marketing, analysis, investment.
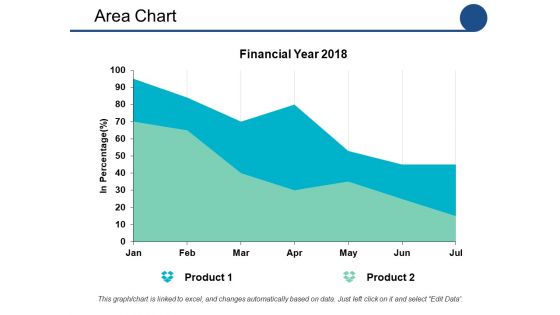
Area Chart Ppt PowerPoint Presentation Show Graphics Tutorials
This is a area chart ppt powerpoint presentation show graphics tutorials. This is a two stage process. The stages in this process are area chart, percentage, product, marketing, management.
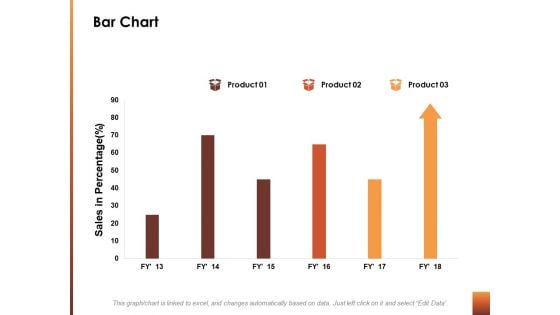
Bar Chart Finance Ppt Powerpoint Presentation Styles Skills
This is a bar chart finance ppt powerpoint presentation styles skills. This is a three stage process. The stages in this process are bar chart, finance, marketing, management, analysis.

Donut Chart Finance Ppt Powerpoint Presentation Infographic Template Slide Download
This is a donut chart finance ppt powerpoint presentation infographic template slide download. This is a three stage process. The stages in this process are donut chart, finance, marketing, management, analysis.
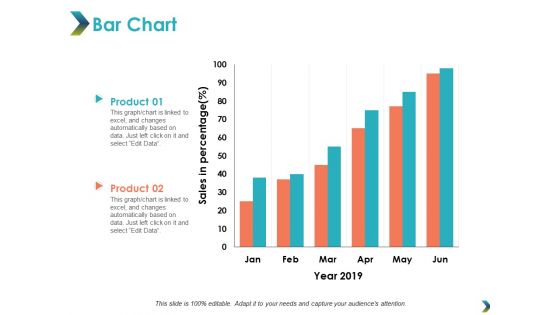
Bar Chart Finance Marketing Ppt PowerPoint Presentation Portfolio Slide
This is a bar chart finance marketing ppt powerpoint presentation portfolio slide. This is a two stage process. The stages in this process are bar chart, finance, marketing, business, analysis.
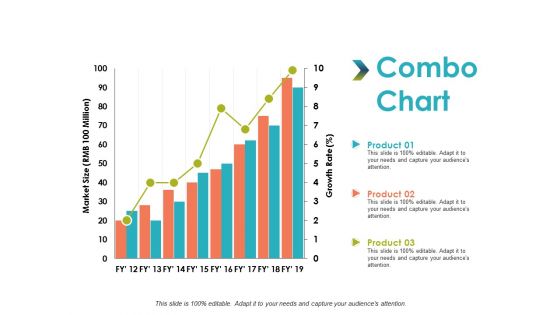
Combo Chart Analysis Management Ppt PowerPoint Presentation Professional Gridlines
This is a combo chart analysis management ppt powerpoint presentation professional gridlines. This is a three stage process. The stages in this process are combo chart, finance, marketing, business, analysis.
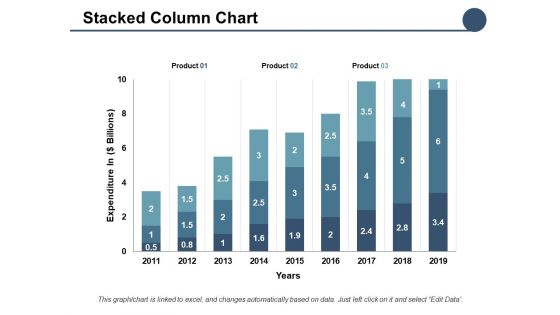
Stacked Column Chart Ppt PowerPoint Presentation Professional Aids
This is a stacked column chart ppt powerpoint presentation professional aids. This is a three stage process. The stages in this process are bar chart, finance, marketing, business, analysis.

Combo Chart Finance Marketing Ppt PowerPoint Presentation Layouts Design Templates
This is a combo chart finance marketing ppt powerpoint presentation layouts design templates. This is a three stage process. The stages in this process are combo chart, finance, marketing, business, analysis.
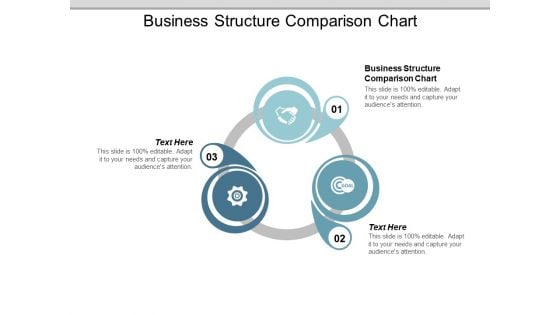
Business Structure Comparison Chart Ppt PowerPoint Presentation Infographic Template Vector
This is a business structure comparison chart ppt powerpoint presentation infographic template vector. This is a three stage process. The stages in this process are business structure comparison chart.

Area Chart Finance Ppt PowerPoint Presentation Professional File Formats
This is a area chart finance ppt powerpoint presentation professional file formats . This is a three stage process. The stages in this process are area chart, finance, marketing, management, investment.
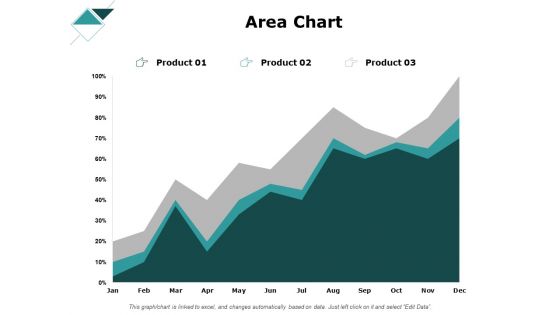
Area Chart Finance Ppt PowerPoint Presentation Gallery Pictures
This is a area chart finance ppt powerpoint presentation gallery pictures . This is a three stage process. The stages in this process are area chart, finance, marketing, management, investment.
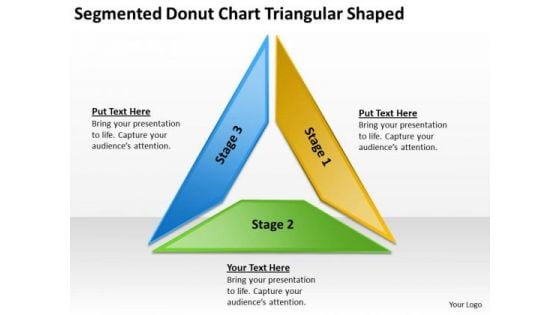
Segmented Donut Chart Triangular Shaped Catering Business Plan PowerPoint Templates
We present our segmented donut chart triangular shaped catering business plan PowerPoint templates.Use our Triangles PowerPoint Templates because It can Bubble and burst with your ideas. Download our Flow Charts PowerPoint Templates because Our PowerPoint Templates and Slides will let your ideas bloom. Create a bed of roses for your audience. Use our Process and Flows PowerPoint Templates because our PowerPoint Templates and Slides will give your ideas the shape. Present our Shapes PowerPoint Templates because Our PowerPoint Templates and Slides will embellish your thoughts. See them provide the desired motivation to your team. Download our Business PowerPoint Templates because Our PowerPoint Templates and Slides are created with admirable insight. Use them and give your group a sense of your logical mind.Use these PowerPoint slides for presentations relating to Design, color, background, layout, concept, vector, abstract, rectangle, advertise, business, blank, spectrum, presentation, bright, template, brochure, element, multicolor, marketing, shape, creative, illustration, object, decorative, composition, organization, banner, art, gradient. The prominent colors used in the PowerPoint template are Green, Blue, Yellow. Drop with our Segmented Donut Chart Triangular Shaped Catering Business Plan PowerPoint Templates. You will come out on top.
Bar Chart Ppt PowerPoint Presentation Icon Infographic Template
This is a bar chart ppt powerpoint presentation icon infographic template. This is a nine stage process. The stages in this process are product, marketing, management, business, success.

PowerPoint Templates Chart 3d Puzzle Process Ppt Slide
PowerPoint templates Chart 3D Puzzle Process PPT Slide-Puzzle diagram is a visual tool that allows you to create and visualize a sales process. -PowerPoint templates Chart 3D Puzzle Process PPT Slide Address the fears of the audience. Our PowerPoint Templates Chart 3d Puzzle Process Ppt Slide encourage bold action.
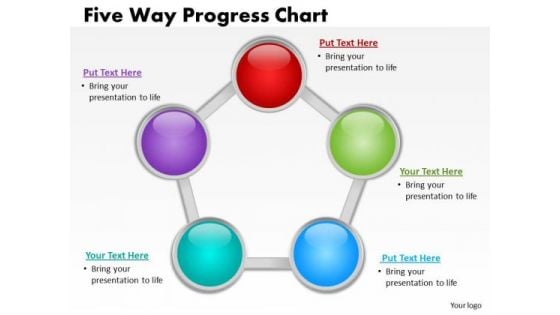
Business Finance Strategy Development Five Way Progress Chart Sales Diagram
Be the doer with our Business Finance Strategy Development Five Way Progress Chart Sales Diagram Powerpoint Templates. Put your thoughts into practice. Your ideas will do the trick. Wave the wand with our Business Finance Strategy Development Five Way Progress Chart Sales Diagram Powerpoint Templates.
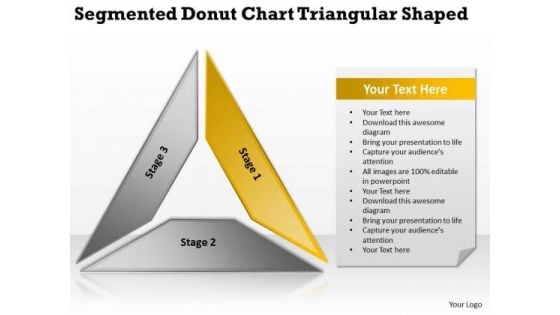
Segmented Donut Chart Triangular Shaped Ppt Business Plan PowerPoint Templates
We present our segmented donut chart triangular shaped ppt business plan PowerPoint templates.Present our Process and Flows PowerPoint Templates because It will mark the footprints of your journey. Illustrate how they will lead you to your desired destination. Download our Flow Charts PowerPoint Templates because Our PowerPoint Templates and Slides are designed to help you succeed. They have all the ingredients you need. Download and present our Triangles PowerPoint Templates because It will mark the footprints of your journey. Illustrate how they will lead you to your desired destination. Download and present our Marketing PowerPoint Templates because You are working at that stage with an air of royalty. Let our PowerPoint Templates and Slides be the jewels in your crown. Use our Future PowerPoint Templates because It can Conjure up grand ideas with our magical PowerPoint Templates and Slides. Leave everyone awestruck by the end of your presentation.Use these PowerPoint slides for presentations relating to Optical, shape, abstract, paradox, motion, symbol, mathematical, illusion, form, perspective, mathematics, liquid, triangle, amazing, flow, geometry,concept, sign, presentation, magic, infinity, bright, psychical, light, impossible, modern, fantasy, creative, geometric, figure, object, trick, futuristic, web,surreal, design, science, trendy, imagination, angle, space, strange, distorted. The prominent colors used in the PowerPoint template are Yellow, Gray, White. Beat the clock with our Segmented Donut Chart Triangular Shaped Ppt Business Plan PowerPoint Templates. They keep you ahead in the race.
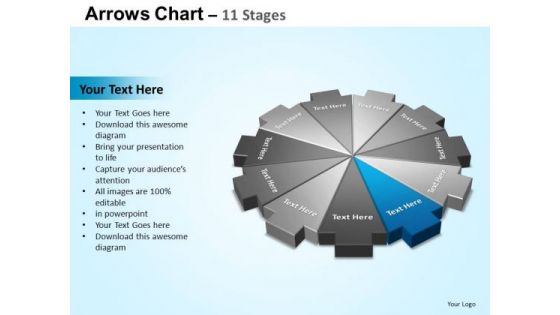
PowerPoint Slide Designs Editable Arrows Chart Ppt Design Slides
PowerPoint_Slide_Designs_Editable_Arrows_Chart_PPT_Design_SlidesBusiness Power Points-Explore the various directions and layers existing in your in your plans and processes. Unravel the desired and essential elements of your overall strategy. Explain the relevance of the different layers and stages and directions in getting down to your core competence, ability and desired result.- Be atypical with our PowerPoint Slide Designs Editable Arrows Chart Ppt Design Slides. Sometimes it's better not to confirm.
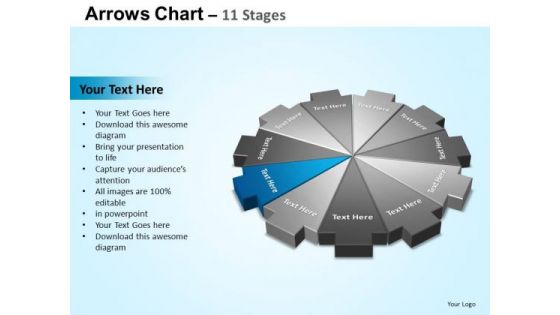
PowerPoint Slide Designs Strategy Arrows Chart Ppt Presentation
PowerPoint_Slide_Designs_Strategy_Arrows_Chart_PPT_PresentationBusiness Power Points-Explore the various directions and layers existing in your in your plans and processes. Unravel the desired and essential elements of your overall strategy. Explain the relevance of the different layers and stages and directions in getting down to your core competence, ability and desired result.- No idea is too far fetched for our PowerPoint Slide Designs Strategy Arrows Chart Ppt Presentation. They will help you think it through.
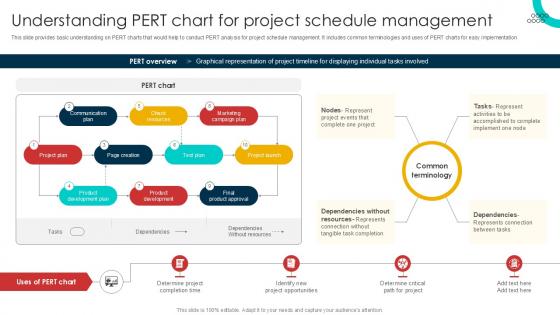
Understanding PERT Chart For Schedule Management Techniques PPT Presentation
This slide provides basic understanding on PERT charts that would help to conduct PERT analysis for project schedule management. It includes common terminologies and uses of PERT charts for easy implementation. Find highly impressive Understanding PERT Chart For Schedule Management Techniques PPT Presentation on Slidegeeks to deliver a meaningful presentation. You can save an ample amount of time using these presentation templates. No need to worry to prepare everything from scratch because Slidegeeks experts have already done a huge research and work for you. You need to download Understanding PERT Chart For Schedule Management Techniques PPT Presentation for your upcoming presentation. All the presentation templates are 100 percent editable and you can change the color and personalize the content accordingly. Download now This slide provides basic understanding on PERT charts that would help to conduct PERT analysis for project schedule management. It includes common terminologies and uses of PERT charts for easy implementation
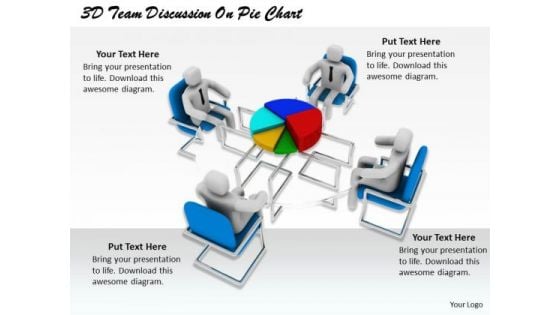
Innovative Marketing Concepts 3d Team Discussion Pie Chart Basic Business
Our innovative marketing concepts 3d team discussion pie chart basic business Powerpoint Templates Leave No One In Doubt. Provide A Certainty To Your Views.
Business Growth Trend Chart Vector Icon Ppt Ideas Aids PDF
Presenting business growth trend chart vector icon ppt ideas aids pdf to dispense important information. This template comprises three stages. It also presents valuable insights into the topics including business growth trend chart vector icon. This is a completely customizable PowerPoint theme that can be put to use immediately. So, download it and address the topic impactfully.
Business Revenue Growth Chart Vector Icon Ppt Layouts Summary PDF
Presenting business revenue growth chart vector icon ppt layouts summary pdf to dispense important information. This template comprises three stages. It also presents valuable insights into the topics including business revenue growth chart vector icon. This is a completely customizable PowerPoint theme that can be put to use immediately. So, download it and address the topic impactfully.
Bar Chart Icon Representing Trend Growth Information PDF
Presenting Bar Chart Icon Representing Trend Growth Information PDF to dispense important information. This template comprises Four stages. It also presents valuable insights into the topics including Bar Chart, Icon Representing, Trend Growth This is a completely customizable PowerPoint theme that can be put to use immediately. So, download it and address the topic impactfully.
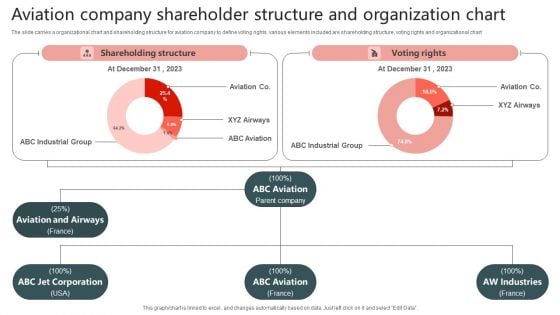
Aviation Company Shareholder Structure And Organization Chart Brochure PDF
The slide carries a organizational chart and shareholding structure for aviation company to define voting rights. various elements included are shareholding structure, voting rights and organizational chart. Showcasing this set of slides titled Aviation Company Shareholder Structure And Organization Chart Brochure PDF. The topics addressed in these templates are Aviation Company Shareholder Structure, Organization Chart. All the content presented in this PPT design is completely editable. Download it and make adjustments in color, background, font etc. as per your unique business setting.
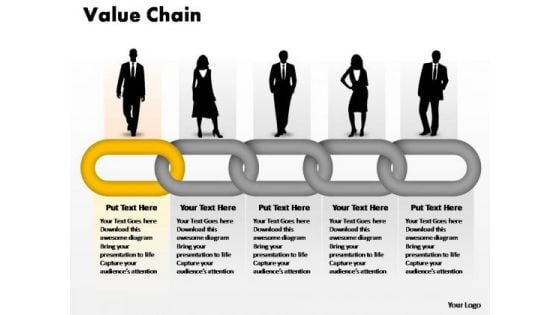
PowerPoint Presentation Chart Designs Business Value Chain Ppt Slide
PowerPoint Presentation Chart Designs Business Value Chain PPT Slide- By using this value chain diagram you can visualize events and the analysis of risks and uncertainties can be significantly explained. -PowerPoint Presentation Chart Designs Business Value Chain PPT Slide Develop a customer driven ethic for your team. Use our PowerPoint Presentation Chart Designs Business Value Chain Ppt Slide to convince them to display care.
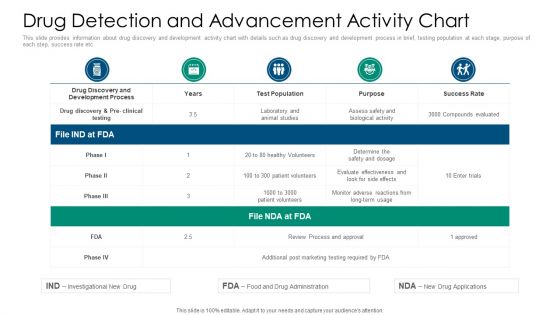
Drug Detection And Advancement Activity Chart Brochure PDF
This slide provides information about drug discovery and development activity chart with details such as drug discovery and development process in brief, testing population at each stage, purpose of each step, success rate etc. Deliver an awe inspiring pitch with this creative drug detection and advancement activity chart brochure pdf bundle. Topics like process, development, success rate, patient volunteers can be discussed with this completely editable template. It is available for immediate download depending on the needs and requirements of the user.

Financial Pie Chart Marketing PowerPoint Templates And PowerPoint Themes 0912
Financial pie Chart Marketing PowerPoint Templates And PowerPoint Themes 0912-Microsoft Powerpoint Templates and Background with pie chart Nest comfortably in success with our Financial Pie Chart Marketing PowerPoint Templates And PowerPoint Themes 0912. You will be at the top of your game.
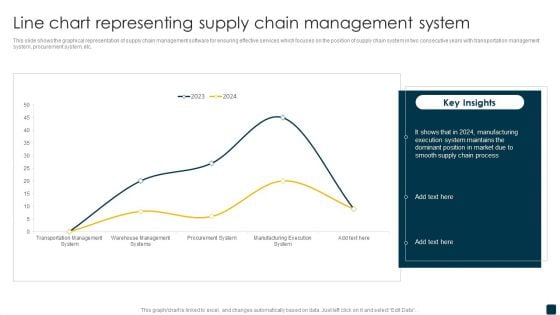
Line Chart Representing Supply Chain Management System Rules PDF
This slide shows the graphical representation of supply chain management software for ensuring effective services which focuses on the position of supply chain system in two consecutive years with transportation management system, procurement system, etc. Pitch your topic with ease and precision using this Line Chart Representing Supply Chain Management System Rules PDF. This layout presents information on Supply Chain Process, Manufacturing, Execution System. It is also available for immediate download and adjustment. So, changes can be made in the color, design, graphics or any other component to create a unique layout.
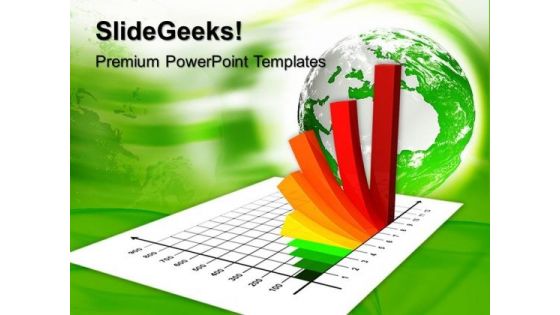
Growth Chart Business PowerPoint Templates And PowerPoint Themes 1012
Growth Chart Business PowerPoint Templates And PowerPoint Themes 1012-The above template displays a diagram of a colorful business chart outgoing. This image has been professionally designed to emphasize business concept. It signifies chart, finance, future, growth, profit, progress, statistics and success. Adjust the above image in your PPT presentations to visually support your content in your Marketing and Financial PPT slideshows. Our PPT images are so ideally designed that it reveals the very basis of our PPT template are an effective tool to make your clients understand.-Growth Chart Business PowerPoint Templates And PowerPoint Themes 1012-This PowerPoint template can be used for presentations relating to-Business growth and success graph, finance, business, success, competition, arrows Our Growth Chart Business PowerPoint Templates And PowerPoint Themes 1012 will get you all animated. You will become eager to assert your views.
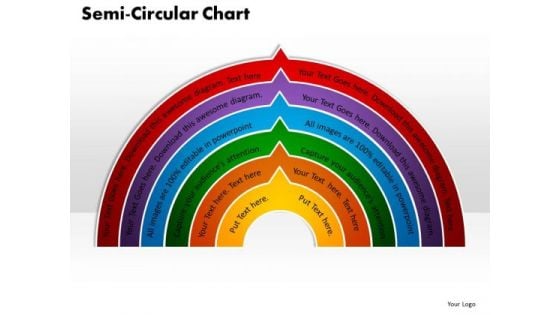
PowerPoint Template Semi Circular Chart Business Ppt Theme
PowerPoint Template Semi Circular Chart Business PPT Theme-This diagram can provide a graphical view of different aspects of a business plan and the relationships between them, this diagram shows an organized view of business services and processes.-PowerPoint Template Semi Circular Chart Business PPT Theme Whatever the nationality,our PowerPoint Template Semi Circular Chart Business Ppt Theme are relevant. They have no ethnic bias.
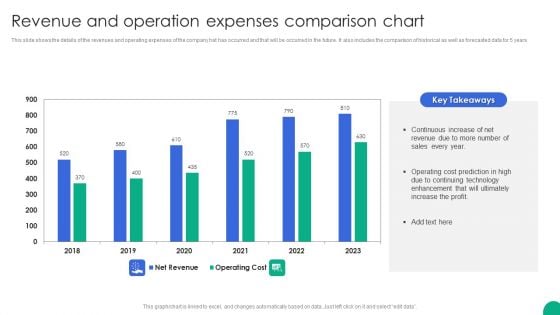
Revenue And Operation Expenses Comparison Chart Slides PDF
This slide shows the details of the revenues and operating expenses of the company hat has occurred and that will be occurred in the future. It also includes the comparison of historical as well as forecasted data for 5 years.Showcasing this set of slides titled Revenue And Operation Expenses Comparison Chart Slides PDF. The topics addressed in these templates are Continuous Increase, Operating Cost, Enhancement Ultimately. All the content presented in this PPT design is completely editable. Download it and make adjustments in color, background, font etc. as per your unique business setting.
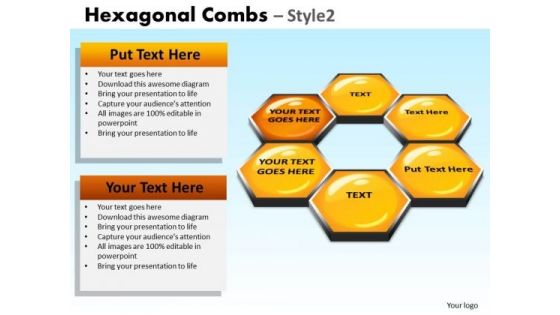
PowerPoint Chart Hexagon Graphic Hexagonal Combs Ppt Process
PowerPoint Chart Hexagon Graphic Hexagonal Combs PPT Process-These high quality powerpoint pre-designed slides and powerpoint templates have been carefully created by our professional team to help you impress your audience. All slides have been created and are 100% editable in powerpoint. Each and every property of any graphic - color, size, orientation, shading, outline etc. can be modified to help you build an effective powerpoint presentation. Any text can be entered at any point in the powerpoint template or slide. Simply DOWNLOAD, TYPE and PRESENT! You possess enterprising ideas. Display them with courage on our PowerPoint Chart Hexagon Graphic Hexagonal Combs Ppt Process.
Brand Equity Valuation Chart Icon Ppt Slides Templates PDF
Persuade your audience using this Brand Equity Valuation Chart Icon Ppt Slides Templates PDF. This PPT design covers four stages, thus making it a great tool to use. It also caters to a variety of topics including Brand Equity, Valuation Chart, Icon. Download this PPT design now to present a convincing pitch that not only emphasizes the topic but also showcases your presentation skills.
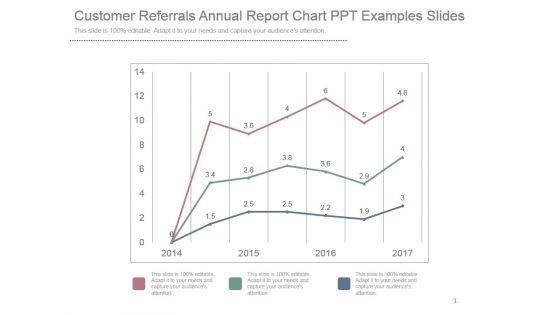
Customer Referrals Annual Report Chart Ppt Examples Slides
This is a customer referrals annual report chart ppt examples slides. This is a three stage process. The stages in this process are business, marketing, graph, success, years.
Six Months Business Valuation Chart Ppt Styles Icons PDF
This slide shows the 6 months graph to measure company valuation. It is representing that highest valuation of company was calculated in the month of June due to increase in sales. Pitch your topic with ease and precision using this Six Months Business Valuation Chart Ppt Styles Icons PDF. This layout presents information on Increase Sales, Company Valuation. It is also available for immediate download and adjustment. So, changes can be made in the color, design, graphics or any other component to create a unique layout.
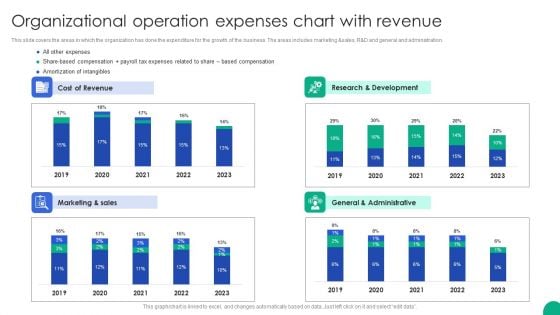
Organizational Operation Expenses Chart With Revenue Microsoft PDF
This slide covers the areas in which the organization has done the expenditure for the growth of the business. The areas includes marketing sales, R D and general and administration.Pitch your topic with ease and precision using this Organizational Operation Expenses Chart With Revenue Microsoft PDF. This layout presents information on Cost Revenue, Research Development, General Administrative. It is also available for immediate download and adjustment. So, changes can be made in the color, design, graphics or any other component to create a unique layout.
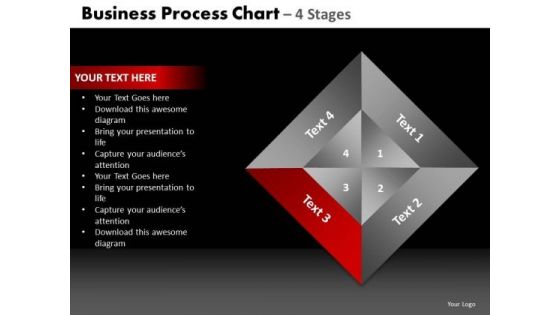
PowerPoint Slide Designs Chart Quadrant Diagram Ppt Design Slides
PowerPoint Slide Designs Chart Quadrant Diagram PPT Design Slides-These high quality powerpoint pre-designed slides and powerpoint templates have been carefully created by our professional team to help you impress your audience. All slides have been created and are 100% editable in powerpoint. Each and every property of any graphic - color, size, orientation, shading, outline etc. can be modified to help you build an effective powerpoint presentation. Any text can be entered at any point in the powerpoint template or slide. Simply DOWNLOAD, TYPE and PRESENT! Press fast forward with our PowerPoint Slide Designs Chart Quadrant Diagram Ppt Design Slides. Give your career a booster dose.
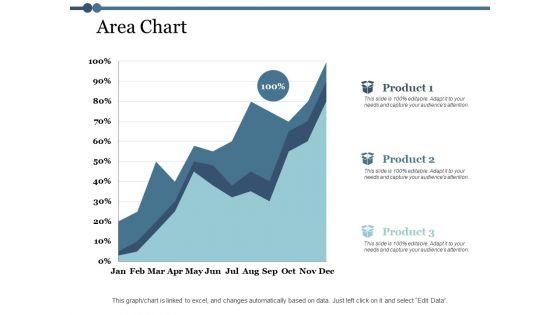
Area Chart Finance Ppt PowerPoint Presentation Outline Design Templates
This is a area chart finance ppt powerpoint presentation outline design templates. This is a three stage process. The stages in this process arefinance, marketing, management, investment, analysis.
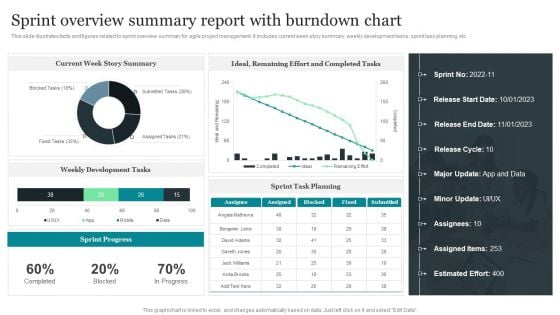
Sprint Overview Summary Report With Burndown Chart Rules PDF
This slide illustrates facts and figures related to sprint overview summary for agile project management. It includes current week story summary, weekly development tasks, sprint task planning, etc. Showcasing this set of slides titled Sprint Overview Summary Report With Burndown Chart Rules PDF. The topics addressed in these templates are Current Week Story Summary, Weekly Development Tasks, Sprint Task Planning. All the content presented in this PPT design is completely editable. Download it and make adjustments in color, background, font etc. as per your unique business setting.
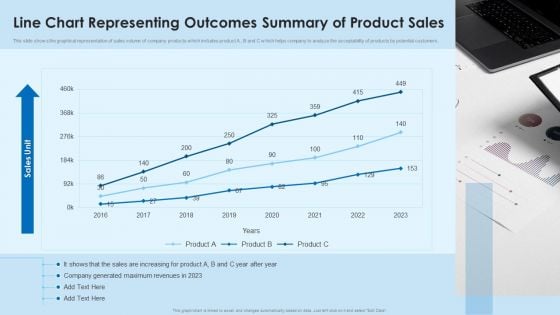
Line Chart Representing Outcomes Summary Of Product Sales Mockup PDF
This slide shows the graphical representation of sales volume of company products which includes product A , B and C which helps company to analyze the acceptability of products by potential customers.Pitch your topic with ease and precision using this Line Chart Representing Outcomes Summary Of Product Sales Mockup PDF This layout presents information on Company Generated, Maximum Revenues, Increasing For Product It is also available for immediate download and adjustment. So, changes can be made in the color, design, graphics or any other component to create a unique layout.
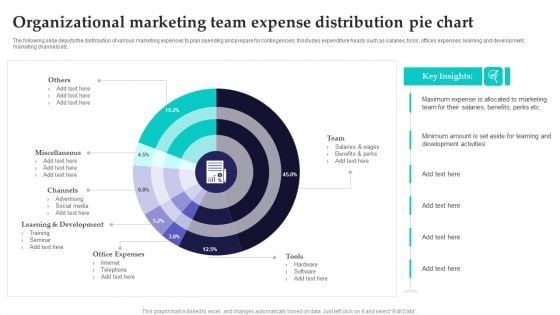
Organizational Marketing Team Expense Distribution Pie Chart Infographics PDF
The following slide depicts the distribution of various marketing expenses to plan spending and prepare for contingencies. It includes expenditure heads such as salaries, tools, offices expenses, learning and development, marketing channels etc. Pitch your topic with ease and precision using this Organizational Marketing Team Expense Distribution Pie Chart Infographics PDF. This layout presents information on Development, Office Expenses, Internet. It is also available for immediate download and adjustment. So, changes can be made in the color, design, graphics or any other component to create a unique layout.
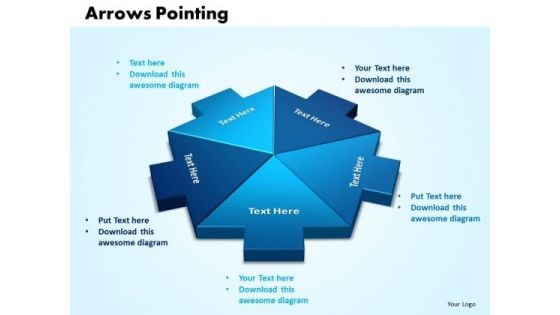
Business Company PowerPoint Templates Arrows Pointing Inwards Chart Ppt Slides
Business Company PowerPoint Templates arrows pointing inwards chart PPT Slides-Use this arrow pointing inward chart to determine your targets and sequence them as per your priorities. Unravel each one for your audience while setting key timelines as you go along-Business Company PowerPoint Templates arrows pointing inwards chart PPT Slides-This ppt can be used for concepts relating to-3d, Accounting, Arrow, Chart, Corporate, Data, Design, Diagram, Element, Graphic, Icon, Illustration etc. Our Business Company PowerPoint Templates Arrows Pointing Inwards Chart Ppt Slides are not a figment of imagination. They actually help in day to day aspects.
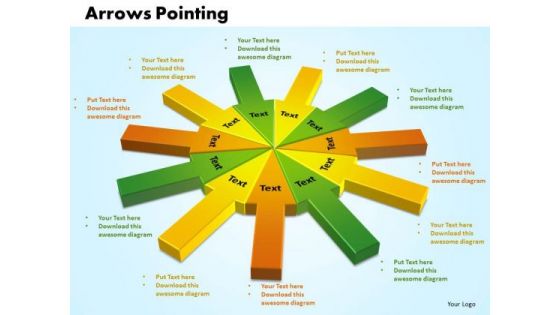
Business PowerPoint Templates Business Arrows Pointing Inwards Chart Ppt Slides
Business PowerPoint Templates Business Arrows pointing inwards chart PPT Slides-Use this arrow pointing inward chart to determine your targets and sequence them as per your priorities. Unravel each one for your audience while setting key timelines as you go along. -Business PowerPoint Templates Business Arrows pointing inwards chart PPT Slides-This ppt can be used for concepts relating to-3d, Accounting, Arrow, Blue, Button, Chart, Corporate, Crystal, Data, Design, Diagram, Element, Glass, Glowing, Graphic, Green, Icon, Illustration, Internet, Investment Etc Our Business PowerPoint Templates Business Arrows Pointing Inwards Chart Ppt Slides maintain equilibrium. Give your thoughts that balanced look.

Scatter Chart Ppt PowerPoint Presentation Infographic Template Objects
This is a scatter chart ppt powerpoint presentation infographic template objects. This is a nine stage process. The stages in this process are product, growth, success, graph.
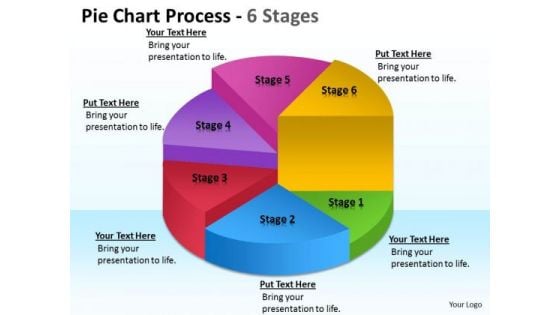
Business Framework Model Pie Chart Process 6 Stages Marketing Diagram
Document Your Views On Our Business Framework Model Pie Chart Process 6 Stages Marketing Diagram Powerpoint Templates. They Will Create A Strong Impression.
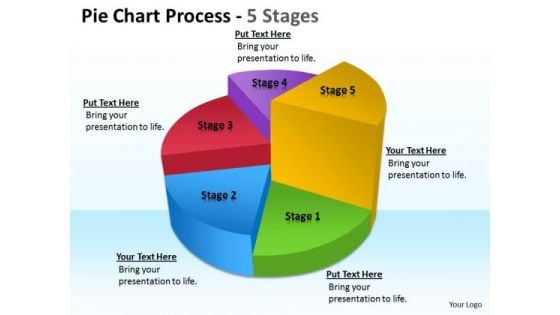
Consulting Diagram Pie Chart Process 5 Stages Business Framework Model
Our Consulting Diagram Pie Chart Process 5 Stages Business Framework Model Powerpoint Templates Team Are A Dogged Lot. They Keep At It Till They Get It Right.
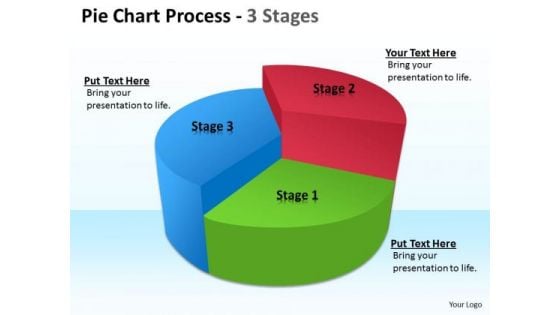
Strategic Management Pie Chart Process 3 Stages Consulting Diagram
Dominate Proceedings With Your Ideas. Our Strategic Management Pie Chart Process 3 Stages Consulting Diagram Powerpoint Templates Will Empower Your Thoughts.
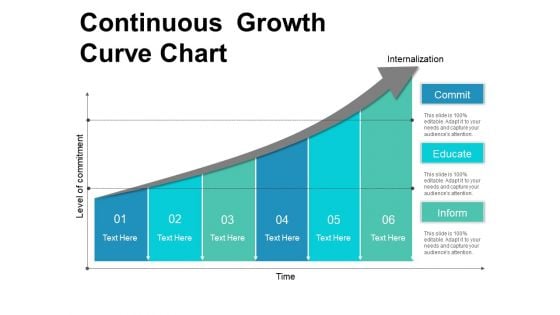
Continuous Growth Curve Chart Ppt PowerPoint Presentation Inspiration Slideshow
This is a continuous growth curve chart ppt powerpoint presentation inspiration slideshow. This is a six stage process. The stages in this process are circular, continuity, continuum.

Line Chart Ppt PowerPoint Presentation Styles Graphics Example
This is a line chart ppt powerpoint presentation styles graphics example. This is a two stage process. The stages in this process are graph, business, success, marketing, line.
Target Vs Accomplishment Evaluation Chart Of Sales Representatives Icons PDF
This slide showcases sales targets and achievements of sales presentative which helps track employee efficiency. It provides information regarding set targets for sales representatives which strategies and success factors. Showcasing this set of slides titled Target Vs Accomplishment Evaluation Chart Of Sales Representatives Icons PDF. The topics addressed in these templates are Effective Communication, Manage Sales Targets, Set Activity Goals. All the content presented in this PPT design is completely editable. Download it and make adjustments in color, background, font etc. as per your unique business setting.
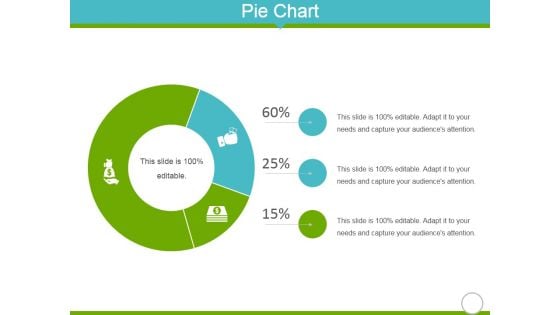
Pie Chart Ppt Powerpoint Presentation Infographic Template Diagrams
This is a pie chart ppt powerpoint presentation infographic template diagrams. This is a three stage process. The stages in this process are business, marketing, finance, icons, management.
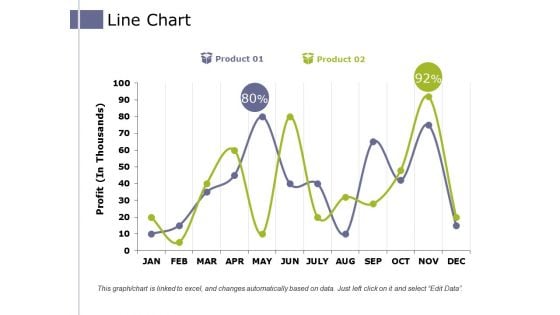
Line Chart Ppt PowerPoint Presentation Pictures Example Introduction
This is a line chart ppt powerpoint presentation pictures example introduction. This is a two stage process. The stages in this process are product, profit, business, growth, success.
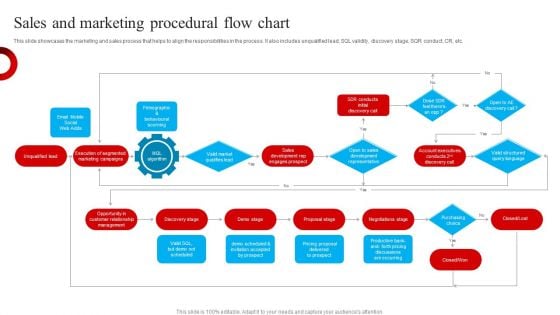
Sales And Marketing Procedural Flow Chart Themes PDF
This slide showcases the marketing and sales process that helps to align the responsibilities in the process. It also includes unqualified lead, SQL validity, discovery stage, SQR conduct, CR, etc. Presenting Sales And Marketing Procedural Flow Chart Themes PDF to dispense important information. This template comprises one stages. It also presents valuable insights into the topics including Discovery Stage, Demo Stage, Proposal Stage . This is a completely customizable PowerPoint theme that can be put to use immediately. So, download it and address the topic impactfully.
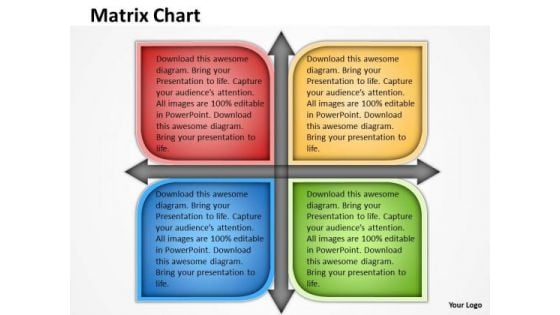
Business Finance Strategy Development Matrix Chart Business Diagram
Get The Domestics Right With Our Business Finance Strategy Development Matrix Chart Business Diagram Powerpoint Templates. Create The Base For Thoughts To Grow.
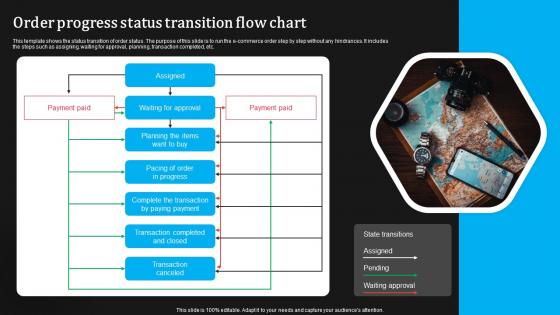
Order Progress Status Transition Flow Chart Formats Pdf
This template shows the status transition of order status. The purpose of this slide is to run the e commerce order step by step without any hindrances. It includes the steps such as assigning, waiting for approval, planning, transaction completed, etc.Pitch your topic with ease and precision using this Order Progress Status Transition Flow Chart Formats Pdf This layout presents information on Waiting Approval, Transaction Completed, Complete Transaction It is also available for immediate download and adjustment. So, changes can be made in the color, design, graphics or any other component to create a unique layout. This template shows the status transition of order status. The purpose of this slide is to run the e commerce order step by step without any hindrances. It includes the steps such as assigning, waiting for approval, planning, transaction completed, etc.
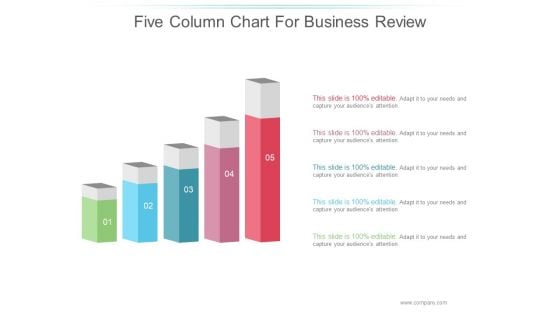
Five Column Chart For Business Review Ppt PowerPoint Presentation Diagrams
This is a five column chart for business review ppt powerpoint presentation diagrams. This is a five stage process. The stages in this process are business, marketing, bulb, icon, management.


 Continue with Email

 Home
Home


