Improvement Chart
Financial Planning With Investment Chart Vector Icon Inspiration PDF
Persuade your audience using this financial planning with investment chart vector icon inspiration pdf. This PPT design covers three stages, thus making it a great tool to use. It also caters to a variety of topics including financial planning with investment chart vector icon. Download this PPT design now to present a convincing pitch that not only emphasizes the topic but also showcases your presentation skills.
Quarterly Sales Revenue Generation Performance Chart Icon Slides PDF
This graph or chart is linked to excel, and changes automatically based on data. Just left click on it and select edit data. Persuade your audience using this Quarterly Sales Revenue Generation Performance Chart Icon Slides PDF. This PPT design covers four stages, thus making it a great tool to use. It also caters to a variety of topics including Quarterly Sales Revenue, Generation Performance, Chart Icon. Download this PPT design now to present a convincing pitch that not only emphasizes the topic but also showcases your presentation skills.

Strategy Diagram Process Chart 3 Stages For Business Marketing Diagram
Knock On The Door To Success With Our Strategy Diagram Process Chart 3 Stages For Business Marketing Diagram Powerpoint Templates. Be Assured Of Gaining Entry.
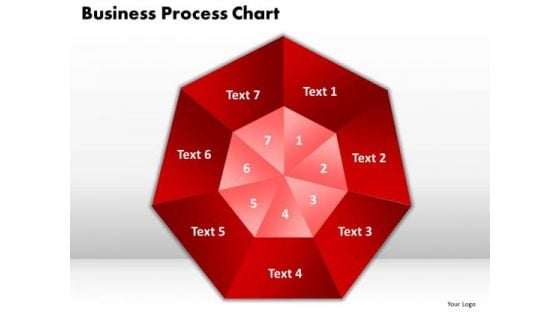
PowerPoint Process Business Process Chart Marketing Ppt Slides
PowerPoint Process Business Process Chart Marketing PPT Slides-This PowerPoint Diagram shows the seven Different Layers which should be followed in Business, Marketing and Finance. This Diagram is useful to represent seven different topics along with their Description.-PowerPoint Process Business Process Chart Marketing PPT Slides With our PowerPoint Process Business Process Chart Marketing Ppt Slides you will never be fed up. Each one is more attractive than the other.
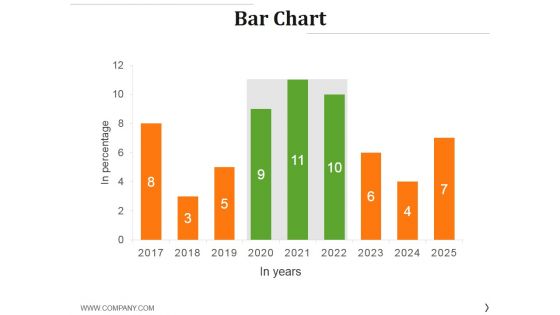
Bar Chart Ppt PowerPoint Presentation Styles Graphics Example
This is a bar chart ppt powerpoint presentation styles graphics example. This is a nine stage process. The stages in this process are graph, growth, success, business, finance.
Scatter Bubble Chart Ppt PowerPoint Presentation Icon Elements
This is a scatter bubble chart ppt powerpoint presentation icon elements. This is a six stage process. The stages in this process are highest profit, profit, financial year, product.

Company Growth Chart Business PowerPoint Templates And PowerPoint Themes 0912
Company Growth Chart Business PowerPoint Templates And PowerPoint Themes 0912-Microsoft Powerpoint Templates and Background with business growth-Business growth, arrows, people, success, marketing, business However faint their hopes may be. Buck them up with our Company Growth Chart Business PowerPoint Templates And PowerPoint Themes 0912.
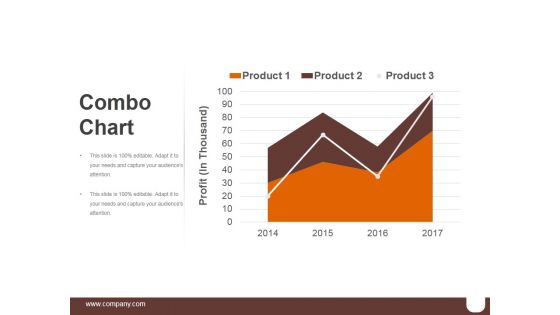
Combo Chart Template 2 Ppt PowerPoint Presentation Graphics
This is a combo chart template 2 ppt powerpoint presentation graphics. This is a three stage process. The stages in this process are business, marketing, finance, growth, management.
Linear Diamond Chart With Icons For Financial Progress Powerpoint Template
This PowerPoint template has been designed with linear diamond chart with icons. This diagram helps to exhibit financial progress. Present your views using this innovative slide and be assured of leaving a lasting impression.
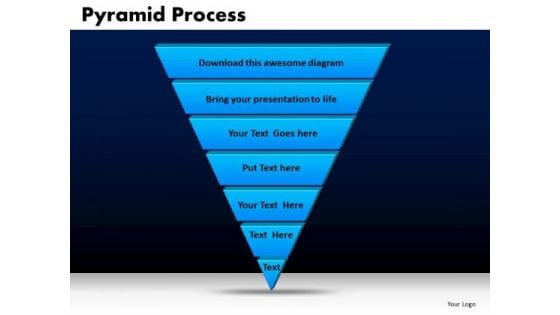
Business Triangles PowerPoint Templates Chart Pyramid Process Ppt Slides
Business Triangles PowerPoint Templates Chart Pyramid Process PPT Slides-A Pyramid Diagram may be defined as representation of data in the form of a triangle separated by horizontal lines. The widest section may contain the general topic while the narrowest section may contain a much more specific topic. -Business Triangles PowerPoint Templates Chart Pyramid Process PPT Slides-This template can be used for presentations relating to 3d, Bar, Business, Chart, Class, Conceptual, Corner, FInance, Graph, Graphic, Hierarchy, Investment, Layer, Level, Performance, Planner, Priority, Progress, Pyramid, Render, Status, Strategy, System, Triangle Earn the credits you do deserve. Answer the critics with our Business Triangles PowerPoint Templates Chart Pyramid Process Ppt Slides.
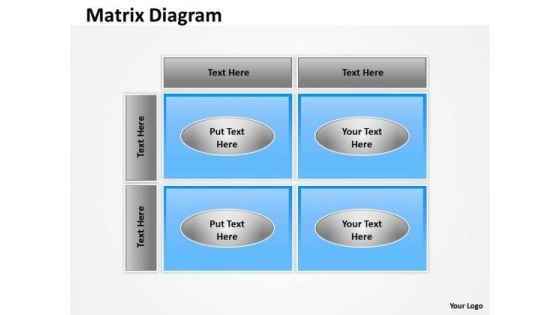
Business Finance Strategy Development Arrangement Chart Diagram Sales Diagram
Put In A Dollop Of Our Business Finance Strategy Development Arrangement Chart Diagram Sales Diagram Powerpoint Templates. Give Your Thoughts A Distinctive Flavor.
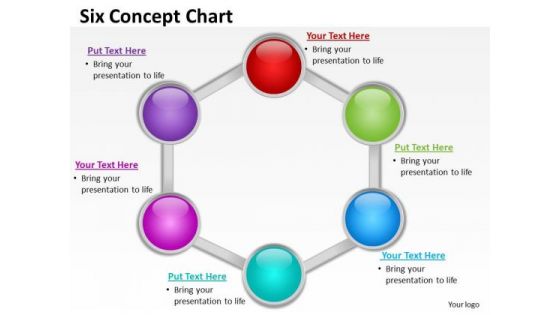
Sales Diagram Six Concept Diagrams Chart Business Finance Strategy Development
Your Listeners Will Never Doodle. Our Sales Diagram Six Concept Diagrams Chart Business Finance Strategy Development Powerpoint Templates Will Hold Their Concentration.
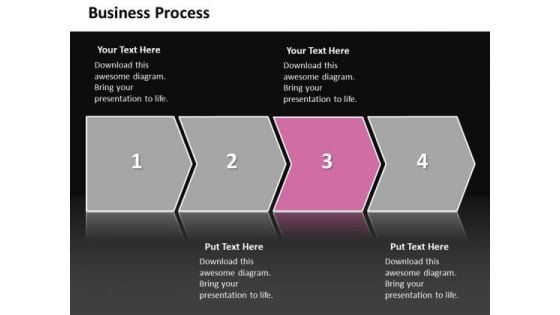
Ppt Linear Flow Business PowerPoint Theme Process Management Chart Templates
PPT linear flow business powerpoint theme process management chart Templates-Use this disarms to have a general understanding of representing an information system process. This diagram will enhance the essence of your viable ideas-PPT linear flow business powerpoint theme process management chart Templates-3d, Arrow, Background, Banner, Business, Chart, Colorful, Diagram, Direction, Element, Financial, Flow, Gradient, Illustration, Isolated, Mirrored, Placeholder, Presentation, Process, Steps Give a fillip to your plans with our Ppt Linear Flow Business PowerPoint Theme Process Management Chart Templates. They will get that extra attention you seek.
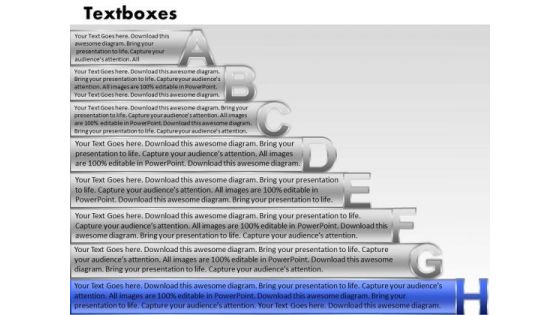
Ppt Colorful PowerPoint Presentations Textboxes With Alphabets Abcdefgh Chart Templates
PPT colorful powerpoint presentations textboxes with alphabets abcdefgh Chart Templates-This PowerPoint template shows eight stylish text boxes that are A, B, C, D, E, and F. It can be used to show grouped or related information. Use This PowerPoint diagram to represent stylish text boxes to list different approaches.-PPT colorful powerpoint presentations textboxes with alphabets abcdefgh Chart Templates Your plans will surely find favour. Our Ppt Colorful PowerPoint Presentations Textboxes With Alphabets Abcdefgh Chart Templates will acquire all the approvals you need.
Weekly Project Schedule Progress Tracking Gantt Chart Infographics PDF
The slide highlights the weekly project plan progress tracking Gantt chart depicting development phase, testing phase and launch phase. Showcasing this set of slides titled Weekly Project Schedule Progress Tracking Gantt Chart Infographics PDF. The topics addressed in these templates are Development, Increased Demand, Increased Anticipation. All the content presented in this PPT design is completely editable. Download it and make adjustments in color, background, font etc. as per your unique business setting.
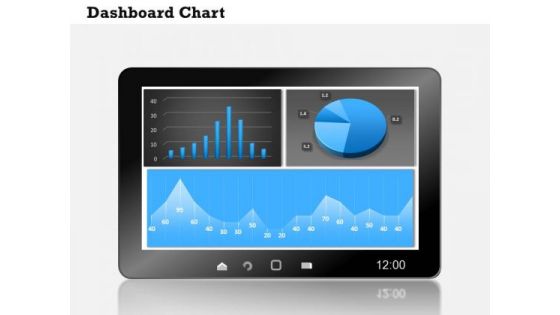
Consulting Diagram Dashboard Business Information Chart Business Diagram
Get The Domestics Right With Our Consulting Diagram Dashboard Business Information Chart Business Diagram Powerpoint Templates. Create The Base For Thoughts To Grow.
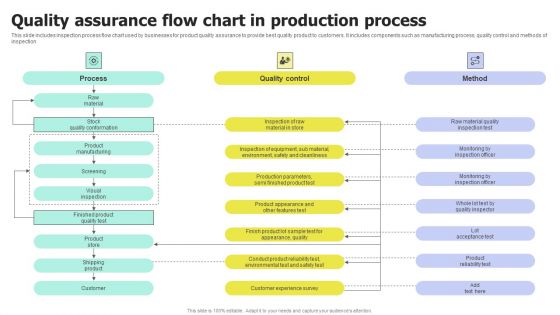
Quality Assurance Flow Chart In Production Process Guidelines PDF
Pitch your topic with ease and precision using this Quality Assurance Flow Chart In Production Process Guidelines PDF. This layout presents information on Quality Assurance, Flow Chart, Production Process. It is also available for immediate download and adjustment. So, changes can be made in the color, design, graphics or any other component to create a unique layout.

Financial Information Systems Chart Example Of Ppt Presentation
This is a financial information systems chart example of ppt presentation. This is a three stage process. The stages in this process are process, people, value, technology.
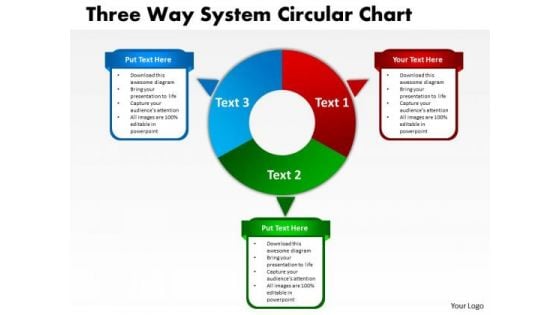
Business Framework Model Three Way System Circular Chart Strategy Diagram
Document The Process On Our Business Framework Model Three Way System Circular Chart Strategy Diagram Powerpoint Templates. Make A Record Of Every Detail.
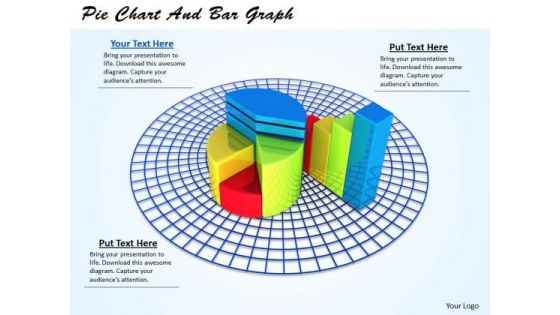
Stock Photo Pie Chart And Bar Graph PowerPoint Template
Put In A Dollop Of Our stock photo Pie Chart And Bar Graph powerpoint template Powerpoint Templates. Give Your Thoughts A Distinctive Flavor.
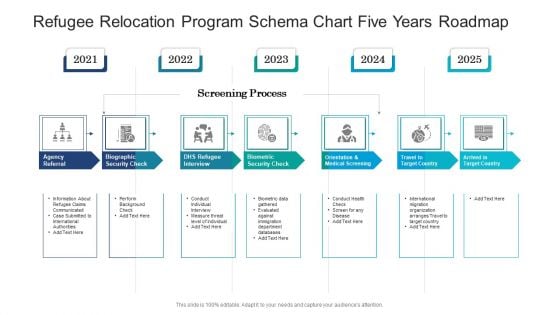
Refugee Relocation Program Schema Chart Five Years Roadmap Introduction
Presenting our innovatively structured refugee relocation program schema chart five years roadmap introduction Template. Showcase your roadmap process in different formats like PDF, PNG, and JPG by clicking the download button below. This PPT design is available in both Standard Screen and Widescreen aspect ratios. It can also be easily personalized and presented with modified font size, font type, color, and shapes to measure your progress in a clear way.
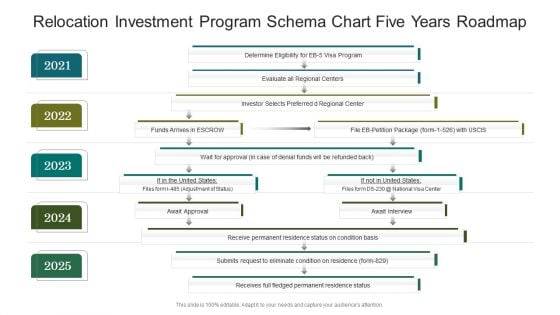
Relocation Investment Program Schema Chart Five Years Roadmap Portrait
Presenting our innovatively structured relocation investment program schema chart five years roadmap portrait Template. Showcase your roadmap process in different formats like PDF, PNG, and JPG by clicking the download button below. This PPT design is available in both Standard Screen and Widescreen aspect ratios. It can also be easily personalized and presented with modified font size, font type, color, and shapes to measure your progress in a clear way.
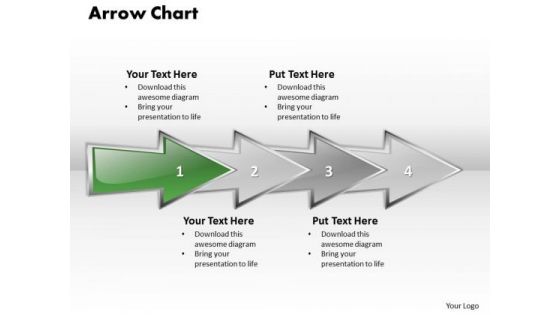
Ppt Linear Abstraction Arrow Gantt Chart PowerPoint Template Templates
PPT linear abstraction arrow gantt chart powerpoint template Templates-You have the ideas and plans on how to go about it. Use this diagram to illustrate your method step by step and interlock the whole process in the minds of your team and motivate them to cross all barriers.-PPT linear abstraction arrow gantt chart powerpoint template Templates-analysis, arrow, background, business, chart, communication, concept, construction, delivery, design, development, engineering, fabrication, feasibiliti, generated, growth, idea, industry, making, production, products, science, sequence, shape Crush your competition with our Ppt Linear Abstraction Arrow Gantt Chart PowerPoint Template Templates. Just download, type and present.
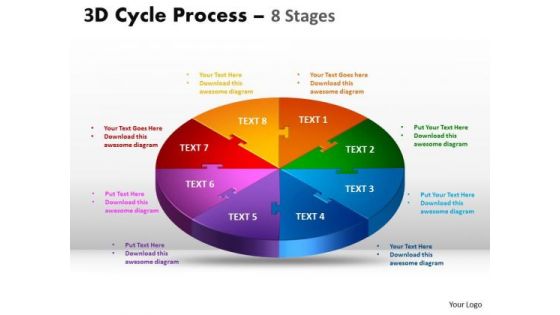
Strategic Management 3d Flow Chart Diagram Style Business Cycle Diagram
Get The Domestics Right With Our Strategic Management 3D Flow Chart Diagram Style Business Cycle Diagram Powerpoint Templates. Create The Base For Thoughts To Grow.
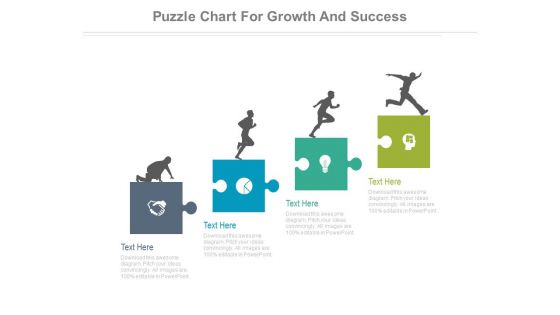
Puzzle Chart For Growth And Success Powerpoint Slides
This business slide has been designed with puzzle chart and icons. This diagram has been designed to display concepts of growth and success. Develop your strategy and communicate with your team with this professional slide design.
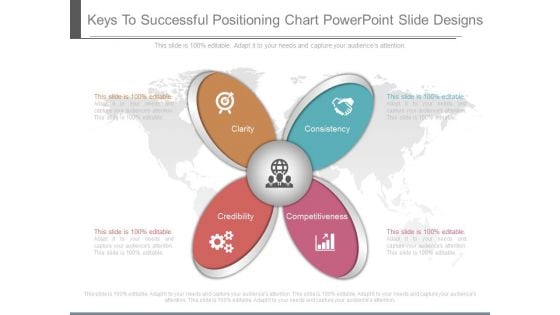
Keys To Successful Positioning Chart Powerpoint Slide Designs
This is a keys to successful positioning chart powerpoint slide designs. This is a four stage process. The stages in this process are clarity, consistency, credibility, competitiveness.
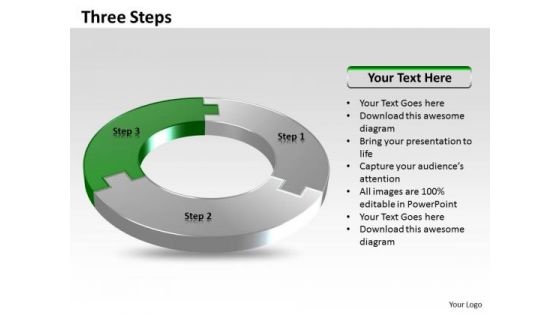
Ppt Three Step Process Editable Business Plan PowerPoint Chart Templates
PPT three step process editable business plan powerpoint chart Templates-Use this Appealing 3D PowerPoint Diagram to explain three step in Circular Process. This Diagram symbolizes Business, Victory, Happiness, laughter, lightheartedness, merriment, mirth, optimism, paradise, peace of mind. This is an animated Diagram.-PPT three step process editable business plan powerpoint chart Templates Our Ppt Three Step Process Editable Business Plan PowerPoint Chart Templates are exhaustively detailed. They pay close attention to each and every aspect.
Combo Chart Ppt PowerPoint Presentation Icon Design Templates
This is a combo chart ppt powerpoint presentation icon design templates. This is a three stage process. The stages in this process are market size, growth rate, product, business, success.
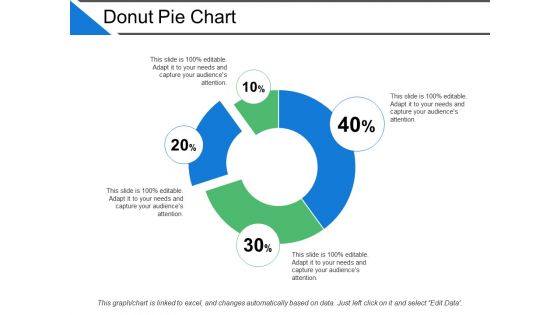
Donut Pie Chart Ppt PowerPoint Presentation Model Outline
This is a donut pie chart ppt powerpoint presentation model outline. This is a four stage process. The stages in this process are percentage, product, business.
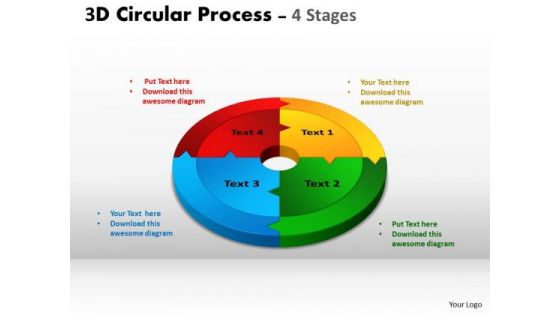
Strategic Management 3d Chart Ppt Templates Business Diagram
Get The Domestics Right With Our Strategic Management 3D Chart ppt Templates Business Diagram Powerpoint Templates. Create The Base For Thoughts To Grow.
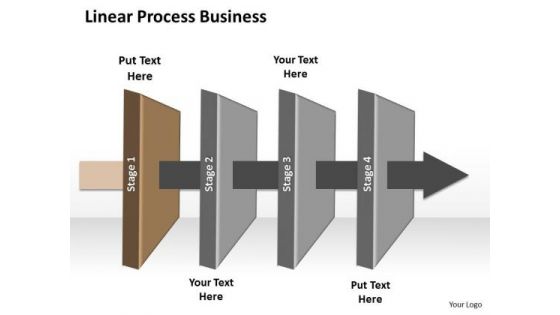
Ppt Linear Process New Business PowerPoint Presentation Relationship Chart Templates
PPT linear process new business powerpoint presentation relationship chart Templates-Use this diagram to show a progression or sequential steps in a task, process, or workflow. Clear thinking is your strength; transmit your thoughts to your eager team-PPT linear process new business powerpoint presentation relationship chart Templates-3d, Air, Arrow, Art, Business, Chart, Clip, Clipart, Cooling, Diagram, Drip, Drop, Dry, Energy, Eps10, Evaporate, Evaporating, Evaporation, Graphic, Heat, Icon, Illustration, Isolated, Isometric, Layers, Material, Moisture, Process Etch your thoughts in the minds of your audience. Engrave them with our Ppt Linear Process New Business PowerPoint Presentation Relationship Chart Templates.
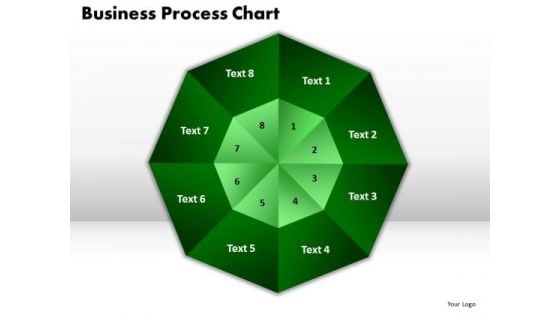
PowerPoint Template Business Process Chart Marketing Ppt Slides
PowerPoint Template Business Process Chart Marketing PPT Slides-The template offers an excellent background to build up the various stages of your business process. This PowerPoint Process Chart shows the eight Different Layers which are to be followed in any business. This Business Diagram can be used in Marketing, Banking, and Management etc. This Diagram explains eight different topics.-PowerPoint Template Business Process Chart Marketing PPT Slides Implement plans with our PowerPoint Template Business Process Chart Marketing Ppt Slides. Download without worries with our money back guaranteee.
Business Profit Growth Chart Vector Icon Ppt File Brochure PDF
Persuade your audience using this business profit growth chart vector icon ppt file brochure pdf. This PPT design covers three stages, thus making it a great tool to use. It also caters to a variety of topics including business profit growth chart vector icon. Download this PPT design now to present a convincing pitch that not only emphasizes the topic but also showcases your presentation skills.
Icon Of Businessman Presenting Growth Trend Chart Designs PDF
Persuade your audience using this Icon Of Businessman Presenting Growth Trend Chart Designs PDF This PPT design covers Four stages, thus making it a great tool to use. It also caters to a variety of topics including Icon Businessman, Presenting Growth, Trend Chart Download this PPT design now to present a convincing pitch that not only emphasizes the topic but also showcases your presentation skills.
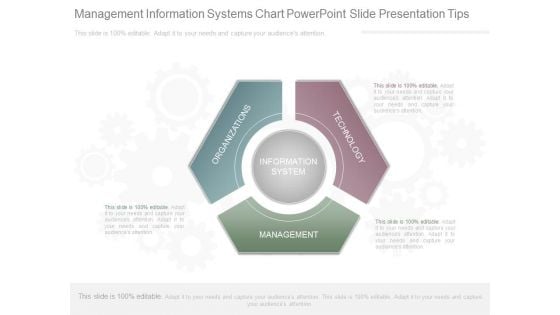
Management Information Systems Chart Powerpoint Slide Presentation Tips
This is a management information systems chart powerpoint slide presentation tips. This is a three stage process. The stages in this process are organizations, technology, management, information system.
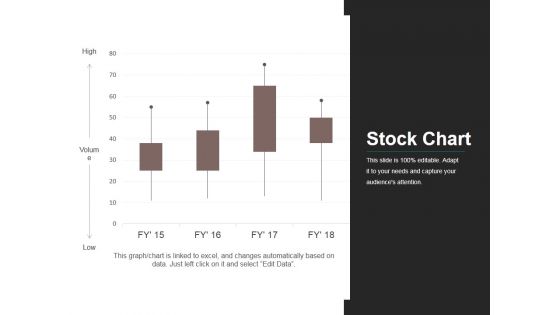
Stock Chart Ppt PowerPoint Presentation Infographic Template Elements
This is a stock chart ppt powerpoint presentation infographic template elements. This is a four stage process. The stages in this process are business, market, stock, finance, analysis.
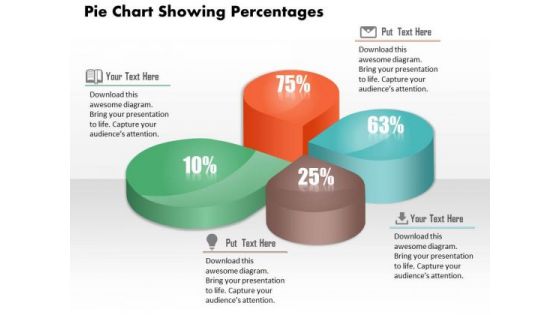
Business Diagram Pie Chart Showing Percentages Presentation Template
This image slide displays business consulting diagram of pie chart showing percentage. Pie Charts can be used to display a wide variety of information. When data is represented in the form of a pie chart the human eye finds it very easy to compare the data and quickly draw conclusions. In short they are a great visual aid and will add a touch of professionalism to any presentation which requires the display of data.
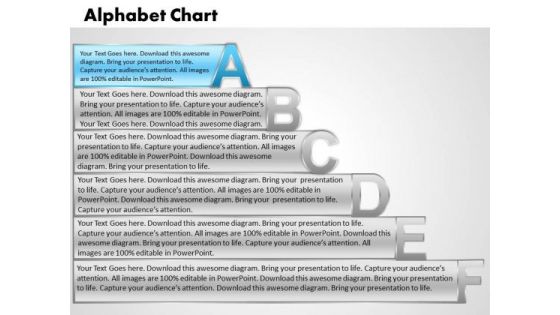
Ppt Alpahabet Chart With Textboxes Business Strategy PowerPoint Business Templates
PPT alpahabet chart with textboxes business strategy powerpoint Business Templates-Use this Amazing PowerPoint Diagram which shows the different way to represent your text and make your Presentation more interesting and impressive to watch for Audiences.-PPT alpahabet chart with textboxes business strategy powerpoint Business Templates They say appropriate facial expressions aid communication. Our Ppt Alpahabet Chart With Textboxes Business Strategy PowerPoint Business Templates can be effective too.

Ppt Alphabet Chart With Textboxes Time Management PowerPoint Business Templates
PPT alpahabet chart with textboxes time management powerpoint Business Templates-Use this Amazing PowerPoint Diagram which shows the different way to represent your text and make your Presentation more interesting and impressive to watch for Audiences.-PPT alpahabet chart with textboxes time management powerpoint Business Templates Make a fancy impression with our Ppt Alphabet Chart With Textboxes Time Management PowerPoint Business Templates. You will be at the top of your game.
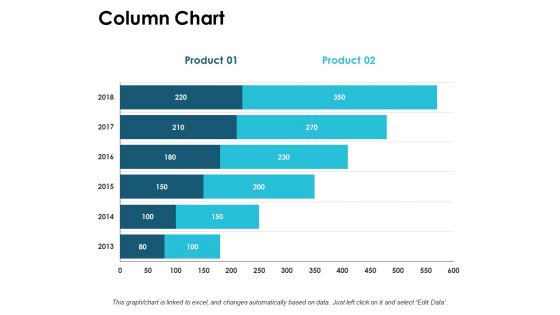
Column Chart Graph Ppt PowerPoint Presentation Outline Information
This is a column chart graph ppt powerpoint presentation outline information. This is a three stage process. The stages in this process are compare, marketing, business, management, planning.

Five Years Relocation Schema Chart Roadmap For Permanent Residence Graphics
Presenting our innovatively structured five years relocation schema chart roadmap for permanent residence graphics Template. Showcase your roadmap process in different formats like PDF, PNG, and JPG by clicking the download button below. This PPT design is available in both Standard Screen and Widescreen aspect ratios. It can also be easily personalized and presented with modified font size, font type, color, and shapes to measure your progress in a clear way.
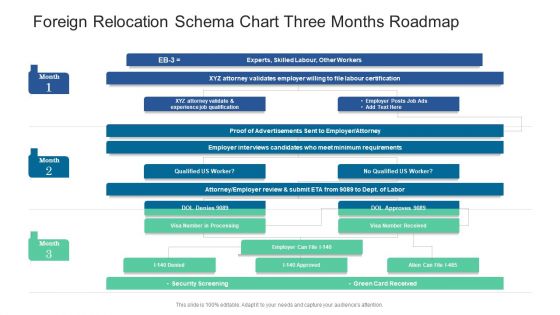
Foreign Relocation Schema Chart Three Months Roadmap Topics
Presenting our innovatively structured foreign relocation schema chart three months roadmap topics Template. Showcase your roadmap process in different formats like PDF, PNG, and JPG by clicking the download button below. This PPT design is available in both Standard Screen and Widescreen aspect ratios. It can also be easily personalized and presented with modified font size, font type, color, and shapes to measure your progress in a clear way.
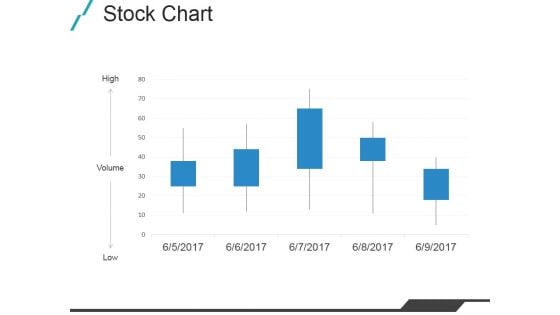
Stock Chart Ppt PowerPoint Presentation Outline Slide Portrait
This is a stock chart ppt powerpoint presentation outline slide portrait. This is a five stage process. The stages in this process are high, volume, low, business.

Donut Pie Chart Ppt PowerPoint Presentation Outline Graphics Example
This is a donut pie chart ppt powerpoint presentation outline graphics example. This is a five stage process. The stages in this process are percentage, finance, donut, business.
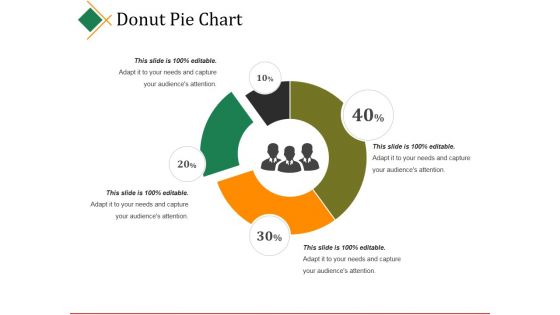
Donut Pie Chart Ppt PowerPoint Presentation Outline Microsoft
This is a donut pie chart ppt powerpoint presentation outline microsoft. This is a four stage process. The stages in this process are percentage, finance, donut, business.
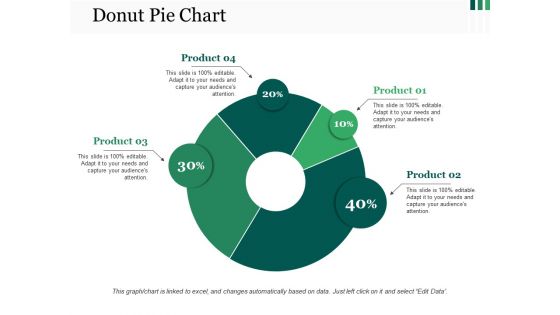
Donut Pie Chart Ppt PowerPoint Presentation Outline Mockup
This is a donut pie chart ppt powerpoint presentation outline mockup. This is a four stage process. The stages in this process are product, donut, percentage, finance, business.
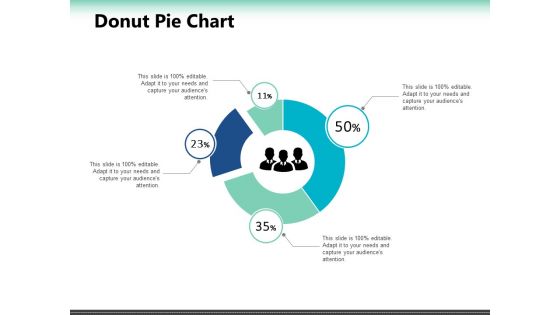
Donut Pie Chart Ppt PowerPoint Presentation Outline Deck
This is a donut pie chart ppt powerpoint presentation outline deck. This is a four stage process. The stages in this process are finance, business, marketing, management, percentage.
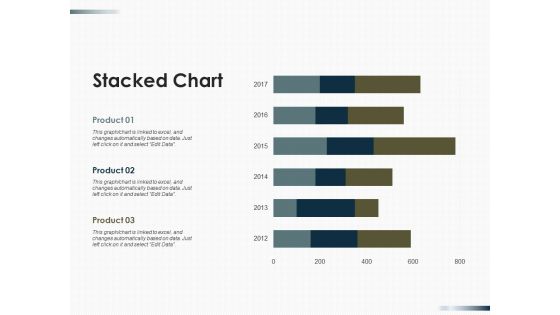
Stacked Chart Finance Ppt PowerPoint Presentation Outline Infographics
This is a stacked chart finance ppt powerpoint presentation outline infographics. This is a three stage process. The stages in this process are finance, marketing, management, investment, analysis.
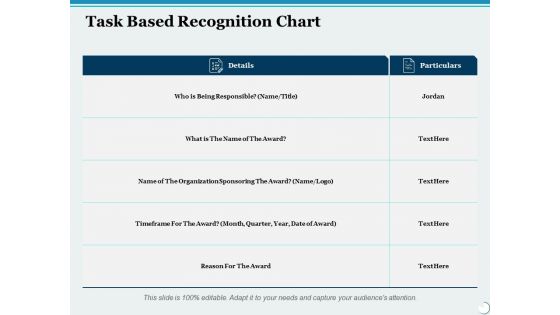
Task Based Recognition Chart Ppt PowerPoint Presentation Inspiration Outline
This is a task based recognition chart ppt powerpoint presentation inspiration outline. This is a two stage process. The stages in this process are compare, management, marketing, business.
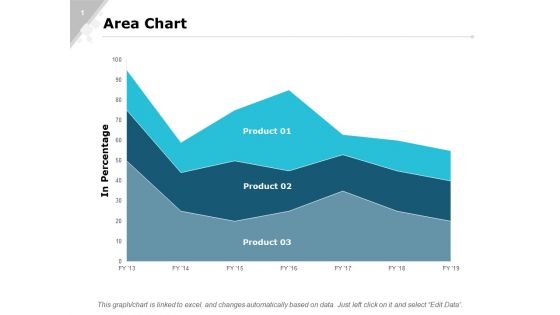
Area Chart Finance Ppt PowerPoint Presentation Outline Structure
This is a area chart finance ppt powerpoint presentation outline structure. This is a three stage process. The stages in this process are finance, marketing, analysis, investment, million.
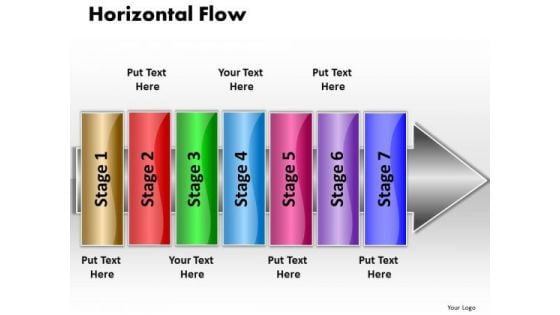
Ppt Linear Work Flow Chart PowerPoint 7 Stages5 Templates
PPT linear work flow chart powerpoint 7 stages5 Templates-You can easily collaborate this PowerPoint diagram with colleagues to create detailed process diagrams and use them as a key element in streamlining your processes. -PPT linear work flow chart powerpoint 7 stages5 Templates-Abstract, Arrow, Blank, Business, Chart, Concept, Conceptual, Design, Diagram, Executive, Icon, Idea, Illustration, Management, Model, Numbers, Organization, Procedure, Process, Progression, Resource, Sequence, Sequential, Stages, Steps, Strategy Delve on the cold facts in detail. Explain the factual analysis on our Ppt Linear Work Flow Chart PowerPoint 7 Stages5 Templates.

Project Progress Gannt Chart Report Ppt PowerPoint Presentation Outline Images
This is a project progress gannt chart report ppt powerpoint presentation outline images. This is a eight stage process. The stages in this process are activity tracker, business, marketing.
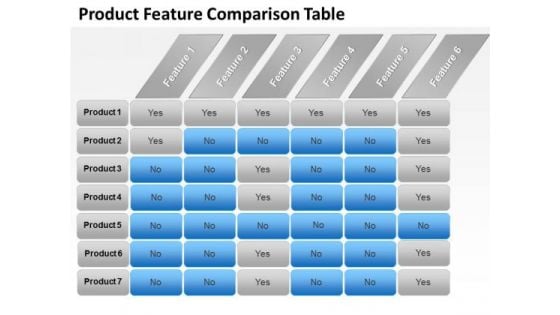
Strategic Management Product Features Comparison Chart Marketing Diagram
Double Your Chances With Our Strategic Management Product Features Comparison Chart Marketing Diagram Powerpoint Templates. The Value Of Your Thoughts Will Increase Two-Fold.
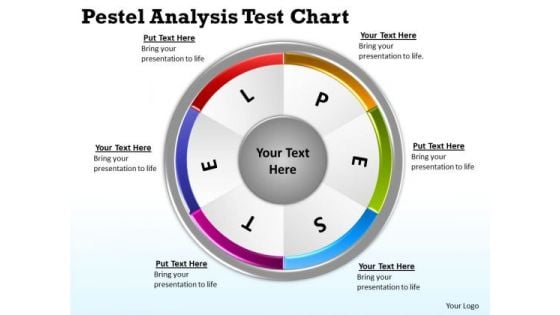
Mba Models And Frameworks Pestel Analysis Test Chart Business Diagram
Double Your Chances With Our Mba Models And Frameworks Pestel Analysis Test Chart Business Diagram Powerpoint Templates. The Value Of Your Thoughts Will Increase Two-Fold.
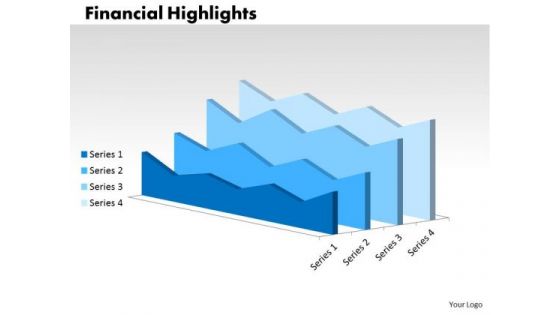
Strategy Diagram Growth Analysis Chart Diagram Consulting Diagram
Double Up Our Strategy Diagram Growth Analysis Chart Diagram Consulting Diagram Powerpoint Templates With Your Thoughts. They Will Make An Awesome Pair. When In Doubt Use Our Strategy Diagram Growth Analysis Chart Diagram Consulting Diagram Powerpoint Templates. The Way Ahead Will Become Crystal Clear.

Area Chart Ppt PowerPoint Presentation Show Graphic Images
This is a area chart ppt powerpoint presentation show graphic images. This is a two stage process. The stages in this process are business, marketing, management, finance, growth.
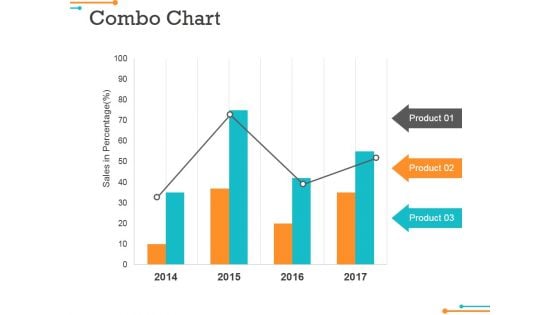
Combo Chart Ppt Powerpoint Presentation Infographic Template File Formats
This is a combo chart ppt powerpoint presentation infographic template file formats. This is a four stage process. The stages in this process are product, growth, management, business.
Psychometric Chart In Powerpoint And Google Slides Cpb
Presenting our innovatively designed set of slides titled Psychometric Chart In Powerpoint And Google Slides Cpb This completely editable PowerPoint graphic exhibits Psychometric Chart that will help you convey the message impactfully. It can be accessed with Google Slides and is available in both standard screen and widescreen aspect ratios. Apart from this, you can download this well structured PowerPoint template design in different formats like PDF, JPG, and PNG. So, click the download button now to gain full access to this PPT design. Our Psychometric Chart In Powerpoint And Google Slides Cpb are topically designed to provide an attractive backdrop to any subject. Use them to look like a presentation pro.
Antibiotics Chart In Powerpoint And Google Slides Cpb
Presenting our innovatively designed set of slides titled Antibiotics Chart In Powerpoint And Google Slides Cpb. This completely editable PowerPoint graphic exhibits Antibiotics Chart that will help you convey the message impactfully. It can be accessed with Google Slides and is available in both standard screen and widescreen aspect ratios. Apart from this, you can download this well structured PowerPoint template design in different formats like PDF, JPG, and PNG. So, click the download button now to gain full access to this PPT design. Our Antibiotics Chart In Powerpoint And Google Slides Cpb are topically designed to provide an attractive backdrop to any subject. Use them to look like a presentation pro.
Product Teardown Chart In Powerpoint And Google Slides Cpb
Presenting our innovatively-designed set of slides titled Product Teardown Chart In Powerpoint And Google Slides Cpb. This completely editable PowerPoint graphic exhibits Product Teardown Chart that will help you convey the message impactfully. It can be accessed with Google Slides and is available in both standard screen and widescreen aspect ratios. Apart from this, you can download this well-structured PowerPoint template design in different formats like PDF, JPG, and PNG. So, click the download button now to gain full access to this PPT design. Our Product Teardown Chart In Powerpoint And Google Slides Cpb are topically designed to provide an attractive backdrop to any subject. Use them to look like a presentation pro.


 Continue with Email

 Home
Home


