Improvement Chart
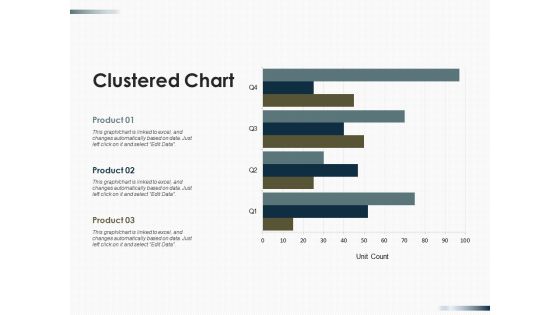
Clustered Chart Finance Ppt PowerPoint Presentation Summary Guide
This is a clustered chart finance ppt powerpoint presentation summary guide. This is a three stage process. The stages in this process are finance, marketing, management, investment, analysis.

Combo Chart Finance Ppt PowerPoint Presentation Portfolio Guidelines
This is a combo chart finance ppt powerpoint presentation portfolio guidelines. This is a three stage process. The stages in this process are finance, marketing, management, investment, analysis.
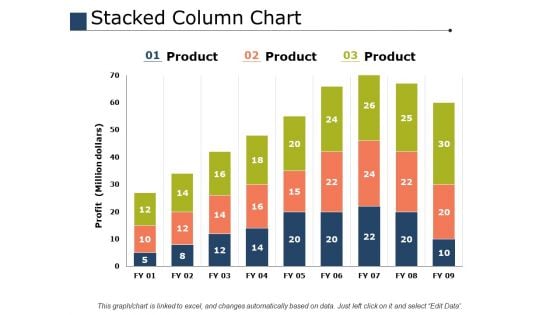
Stacked Column Chart Ppt PowerPoint Presentation Slides Files
This is a stacked column chart ppt powerpoint presentation slides files. This is a three stage process. The stages in this process are percentage, product, business, marketing.
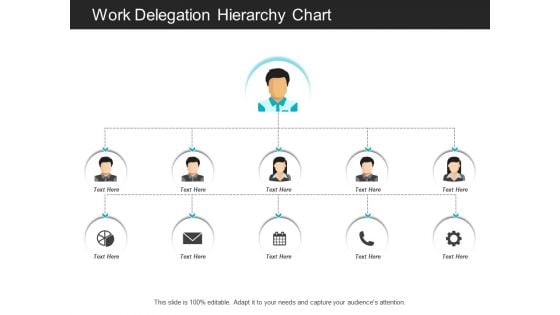
Work Delegation Hierarchy Chart Ppt PowerPoint Presentation File Graphic Images
This is a work delegation hierarchy chart ppt powerpoint presentation file graphic images. This is a five stage process. The stages in this process are delegation, deputation, delegacy.
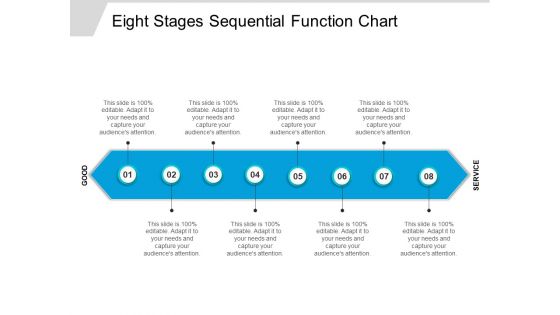
Eight Stages Sequential Function Chart Ppt PowerPoint Presentation Professional Maker
This is a eight stages sequential function chart ppt powerpoint presentation professional maker. This is a eight stage process. The stages in this process are circular, continuity, continuum.
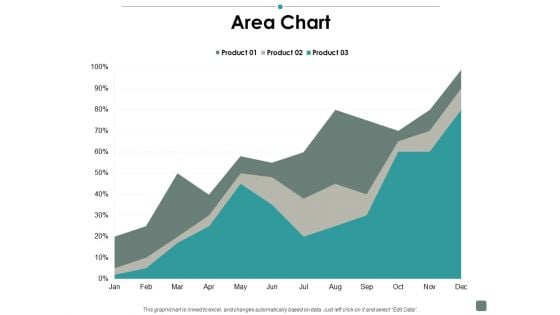
Area Chart Contribution Ppt PowerPoint Presentation Gallery Structure
This is a area chart contribution ppt powerpoint presentation gallery structure. This is a three stage process. The stages in this process are business, management, strategy, analysis, marketing.
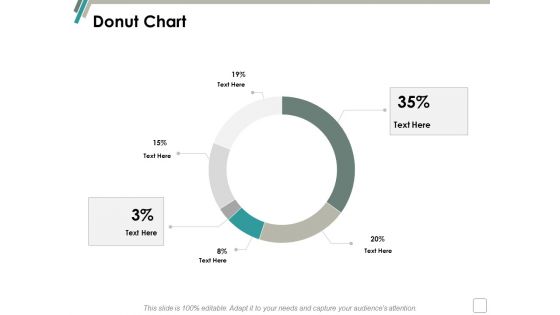
Donut Chart Management Ppt Powerpoint Presentation Slides Aids
This is a donut chart management ppt powerpoint presentation slides aids. This is a six stage process. The stages in this process are finance, marketing, management, investment, analysis.
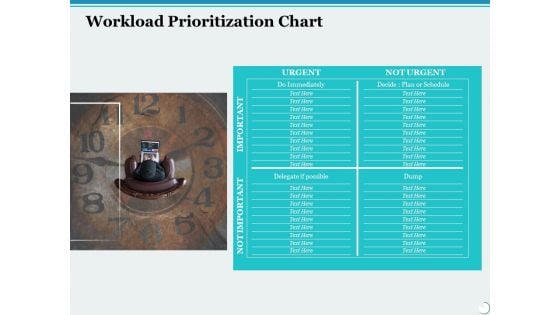
Workload Prioritization Chart Ppt PowerPoint Presentation Infographic Template Images
This is a workload prioritization chart ppt powerpoint presentation infographic template images. This is a four stage process. The stages in this process are business, management, marketing.
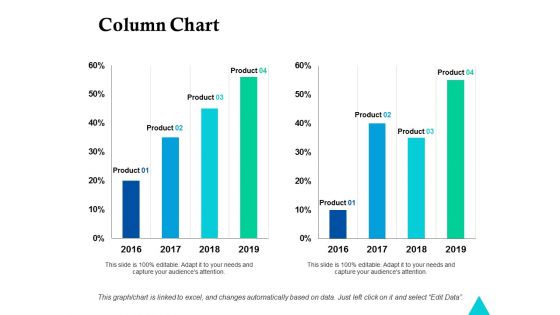
Column Chart Finance Ppt Powerpoint Presentation Summary Visuals
This is a column chart finance ppt powerpoint presentation summary visuals. This is a four stage process. The stages in this process are finance, marketing, management, investment, analysis.

area chart finance ppt powerpoint presentation layouts ideas
This is a area chart finance ppt powerpoint presentation layouts ideas. This is a three stage process. The stages in this process are finance, marketing, management, investment, analysis.
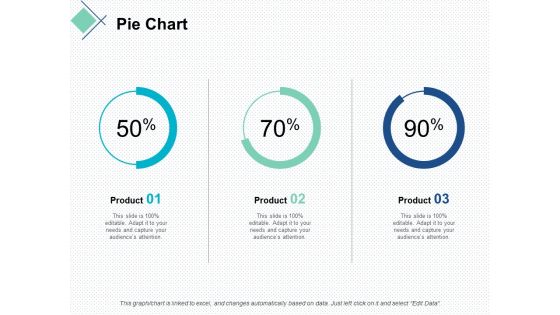
pie chart finance marketing ppt powerpoint presentation slides demonstration
This is a pie chart finance marketing ppt powerpoint presentation slides demonstration. This is a stage process. The stages in this process are finance, marketing, management, investment, analysis.
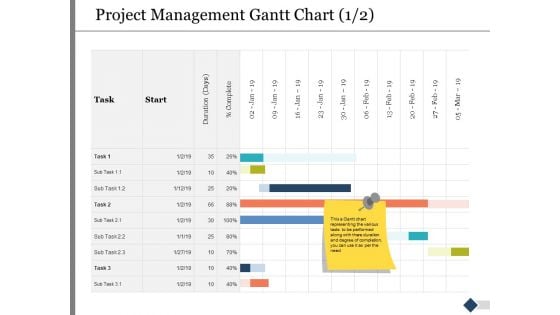
Project Management Gantt Chart Ppt PowerPoint Presentation Summary Images
This is a project management gantt chart ppt powerpoint presentation summary images. This is a two stage process. The stages in this process are marketing, business, management, compare.
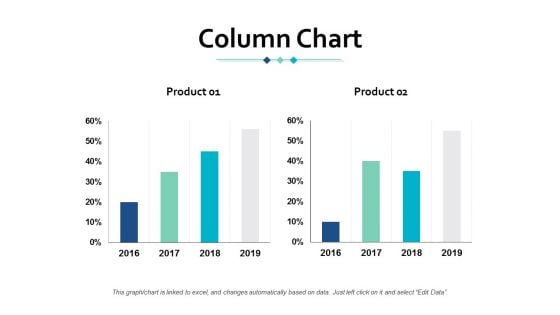
Column Chart Finance Ppt Powerpoint Presentation Gallery Maker
This is a column chart finance ppt powerpoint presentation gallery maker. This is a two stage process. The stages in this process are finance, marketing, management, investment, analysis.
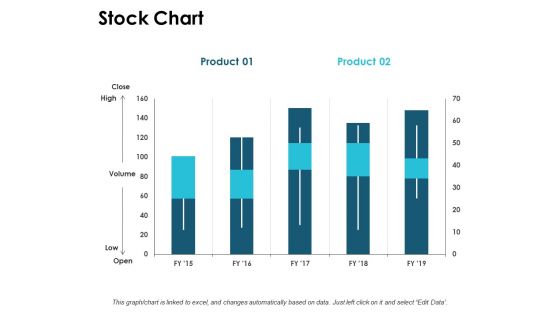
Stock Chart Graph Ppt PowerPoint Presentation Ideas Demonstration
This is a stock chart graph ppt powerpoint presentation ideas demonstration. This is a three stage process. The stages in this process are finance, marketing, management, investment, analysis.
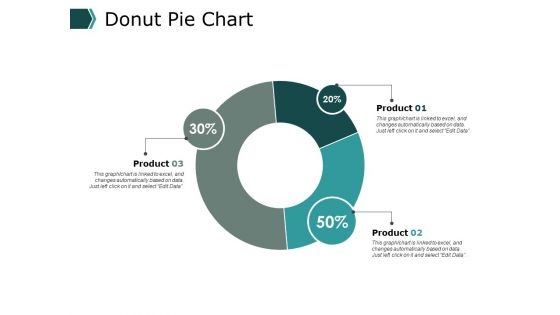
Donut Pie Chart Ppt PowerPoint Presentation Model Deck
This is a donut pie chart ppt powerpoint presentation model deck. This is a three stage process. The stages in this process are finance, marketing, management, investment, analysis.
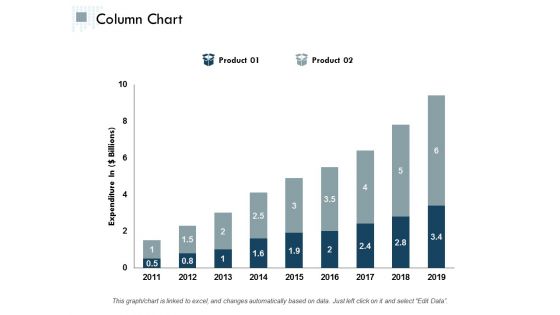
Column Chart Finance Ppt Powerpoint Presentation Styles Examples
This is a column chart finance ppt powerpoint presentation styles examples. This is a two stage process. The stages in this process are finance, marketing, management, investment, analysis.
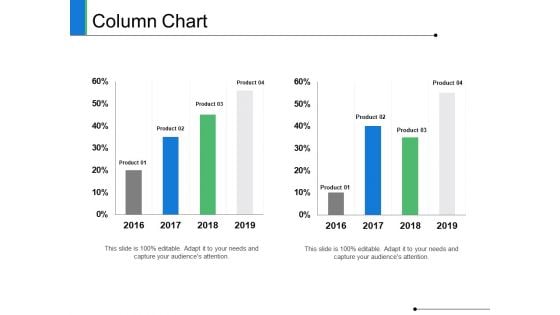
Column Chart Finance Ppt PowerPoint Presentation Summary Grid
This is a column chart finance ppt powerpoint presentation summary grid. This is a three stage process. The stages in this process are finance, marketing, management, investment, analysis.
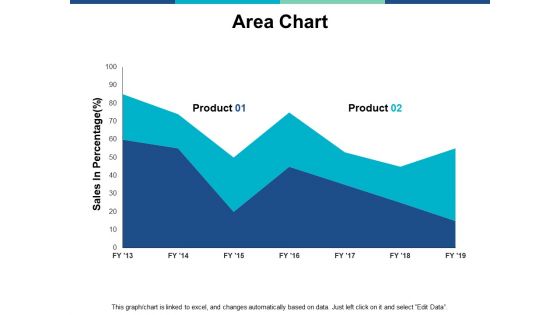
Area Chart Finance Ppt PowerPoint Presentation Summary Structure
This is a area chart finance ppt powerpoint presentation summary structure. This is a two stage process. The stages in this process are finance, marketing, management, investment, analysis.
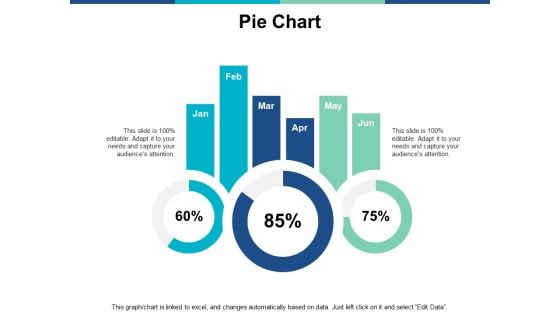
Pie Chart Finance Ppt PowerPoint Presentation Ideas Templates
This is a pie chart finance ppt powerpoint presentation ideas templates. This is a three stage process. The stages in this process are finance, marketing, management, investment, analysis.
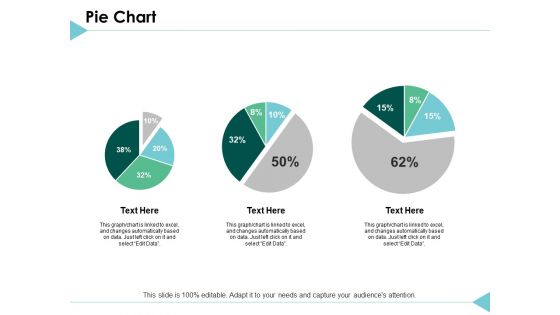
Pie Chart Finance Ppt PowerPoint Presentation Styles Templates
This is a pie chart finance ppt powerpoint presentation styles templates. This is a three stage process. The stages in this process are finance, marketing, analysis, investment, million.
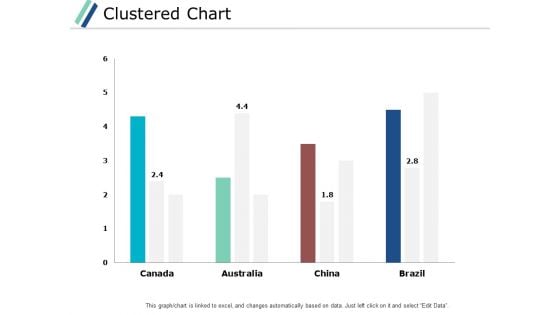
Clustered Chart Graph Ppt PowerPoint Presentation Gallery Backgrounds
This is a clustered chart graph ppt powerpoint presentation gallery backgrounds. This is a three stage process. The stages in this process are finance, marketing, analysis, investment, million.
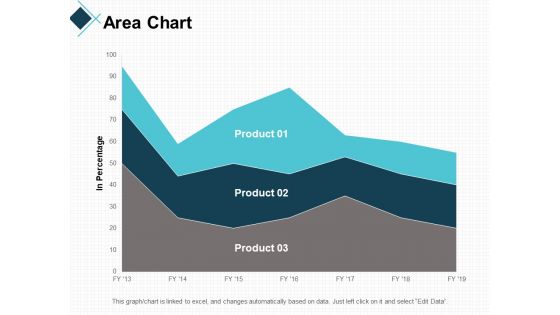
Area Chart Finance Ppt PowerPoint Presentation Gallery Information
This is a area chart finance ppt powerpoint presentation gallery information. This is a three stage process. The stages in this process are finance, marketing, analysis, investment, million.
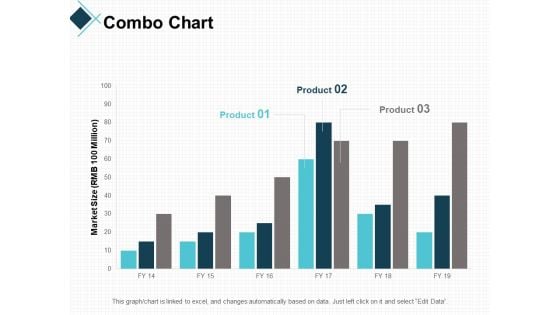
Combo Chart Graph Ppt PowerPoint Presentation Professional Guidelines
This is a combo chart graph ppt powerpoint presentation professional guidelines. This is a three stage process. The stages in this process are finance, marketing, analysis, investment, million.
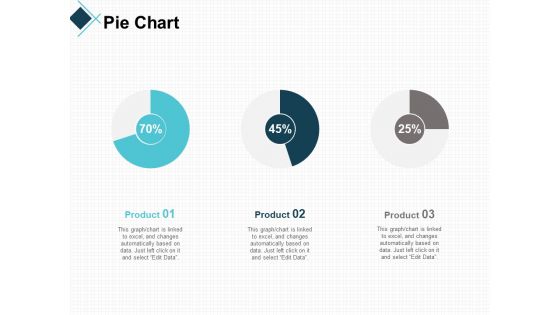
Pie Chart Bar Ppt PowerPoint Presentation Layouts Examples
This is a pie chart bar ppt powerpoint presentation layouts examples. This is a three stage process. The stages in this process are finance, marketing, analysis, investment, million.
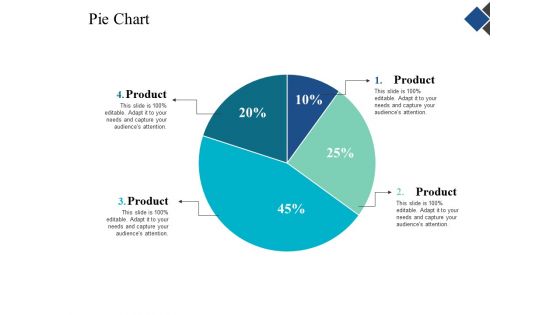
Pie Chart Finance Ppt Powerpoint Presentation Gallery Templates
This is a pie chart finance ppt powerpoint presentation gallery templates. This is a four stage process. The stages in this process are finance, marketing, management, investment, analysis.
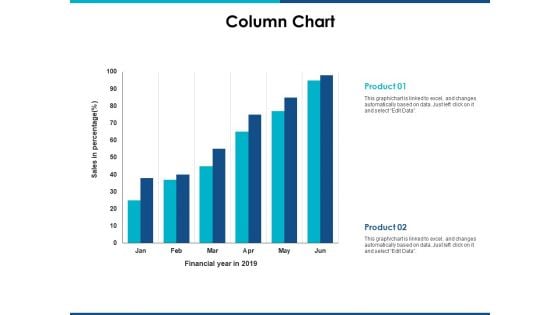
Column Chart Finance Ppt Powerpoint Presentation Inspiration Images
This is a column chart finance ppt powerpoint presentation inspiration images. This is a two stage process. The stages in this process are finance, marketing, management, investment, analysis.
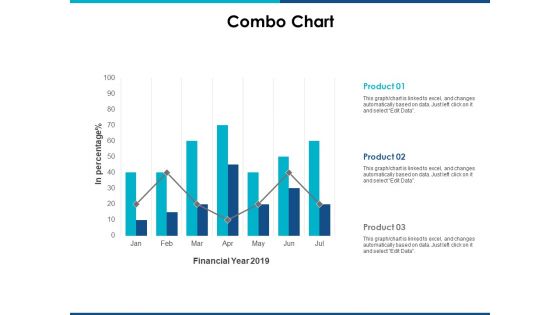
Combo Chart Finance Ppt Powerpoint Presentation Ideas Slides
This is a combo chart finance ppt powerpoint presentation ideas slides. This is a three stage process. The stages in this process are finance, marketing, management, investment, analysis.
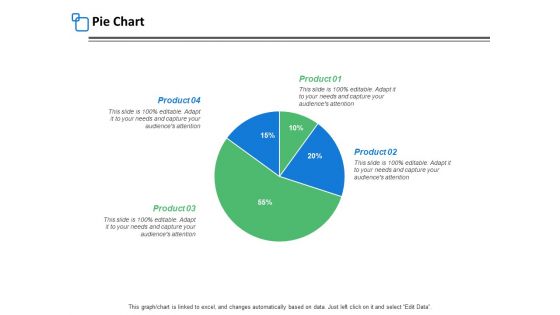
Pie Chart Finance Ppt PowerPoint Presentation Inspiration Templates
This is a pie chart finance ppt powerpoint presentation inspiration templates. This is a four stage process. The stages in this process are finance, marketing, management, investment, analysis.
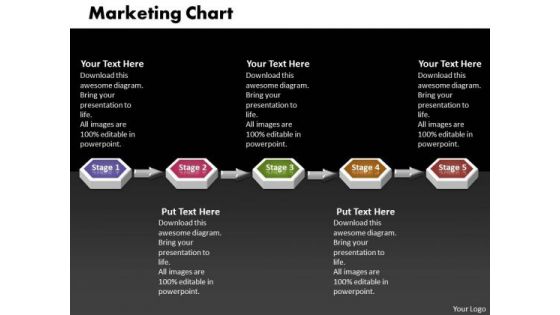
Ppt 3d Linear Mobile Marketing PowerPoint Presentation Flow Chart Templates
PPT 3d linear mobile marketing powerpoint presentation flow chart Templates-Use this 3D Animated PowerPoint Diagram to demonstrate the Marketing Flow Process step wise step. This Diagram imitates the following concept: connected, consecutive, continued, day and night, endless, everlasting, extended etc.-PPT 3d linear mobile marketing powerpoint presentation flow chart Templates-Abstract, Action, Attention, Business, Chart, Clipart, Commerce, Concept, Conceptual, Corporate, Customer, Design, Desire, Diagram, Flow, Goals, Guide, Icon, Idea, Illustration, Interest, Manage, Management, Map, Marketing, Mind, Mission, Model, Organization, Performance, Planning, Plans, Process When in doubt fall back on our Ppt 3d Linear Mobile Marketing PowerPoint Presentation Flow Chart Templates. All your apprehensions will fall away.
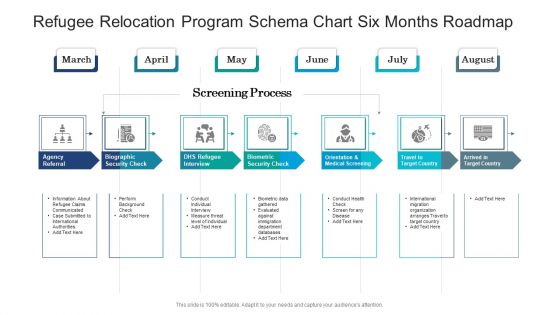
Refugee Relocation Program Schema Chart Six Months Roadmap Professional
Presenting our jaw dropping refugee relocation program schema chart six months roadmap professional. You can alternate the color, font size, font type, and shapes of this PPT layout according to your strategic process. This PPT presentation is compatible with Google Slides and is available in both standard screen and widescreen aspect ratios. You can also download this well researched PowerPoint template design in different formats like PDF, JPG, and PNG. So utilize this visually appealing design by clicking the download button given below.
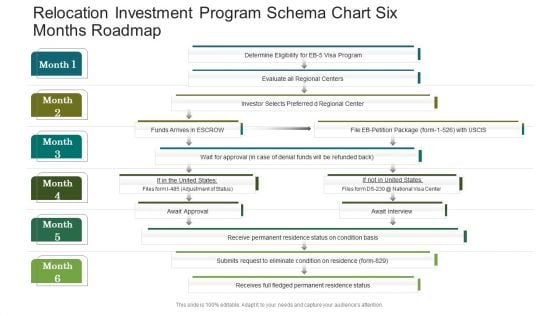
Relocation Investment Program Schema Chart Six Months Roadmap Topics
Presenting our jaw dropping relocation investment program schema chart six months roadmap topics. You can alternate the color, font size, font type, and shapes of this PPT layout according to your strategic process. This PPT presentation is compatible with Google Slides and is available in both standard screen and widescreen aspect ratios. You can also download this well researched PowerPoint template design in different formats like PDF, JPG, and PNG. So utilize this visually appealing design by clicking the download button given below.
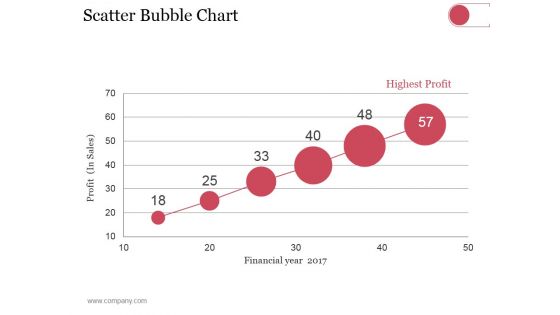
Scatter Bubble Chart Ppt PowerPoint Presentation Summary Pictures
This is a scatter bubble chart ppt powerpoint presentation summary pictures. This is a six stage process. The stages in this process are highest profit, financial year, profit in sales.
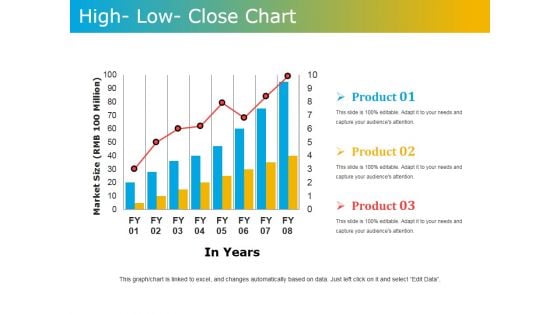
High Low Close Chart Ppt PowerPoint Presentation Model Graphics Tutorials
This is a high low close chart ppt powerpoint presentation model graphics tutorials. This is a three stage process. The stages in this process are market size, in years, product.
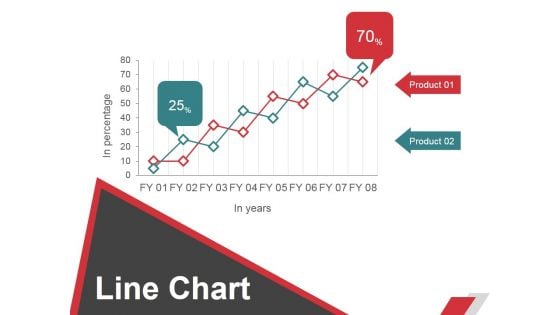
Line Chart Ppt PowerPoint Presentation File Graphic Images
This is a line chart ppt powerpoint presentation file graphic images. This is a two stage process. The stages in this process are business, strategy, marketing, planning, growth strategy, finance.
Financial Chart For Investment Portfolio Management Vector Icon Rules PDF
Persuade your audience using this financial chart for investment portfolio management vector icon rules pdf. This PPT design covers three stages, thus making it a great tool to use. It also caters to a variety of topics including financial chart for investment portfolio management vector icon. Download this PPT design now to present a convincing pitch that not only emphasizes the topic but also showcases your presentation skills.
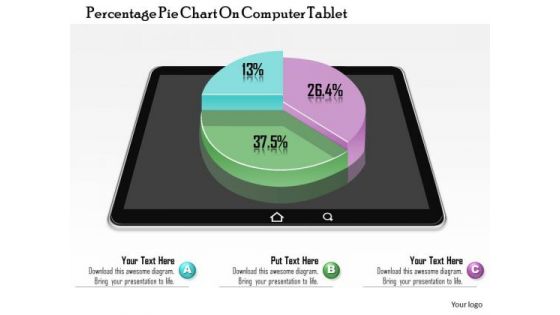
Business Diagram Percentage Pie Chart On Computer Tablet Presentation Template
This image slide displays business consulting diagram of percentage pie chart on computer tablet. This image has been made with 3d colorful graphic of pie chart on black tablet. Use this PowerPoint template, in your presentations to express various views like growth, achievements, success in business. This image slide will make your presentations outshine.

Profits Bar Chart Finance PowerPoint Templates And PowerPoint Themes 0612
Profits Bar Chart Finance PowerPoint Templates And PowerPoint Themes PPT Slides-Microsoft Powerpoint Templates and Background with graph with arrow Augment your adeptness with our Profits Bar Chart Finance PowerPoint Templates And PowerPoint Themes 0612. Give a boost to your decisive character.
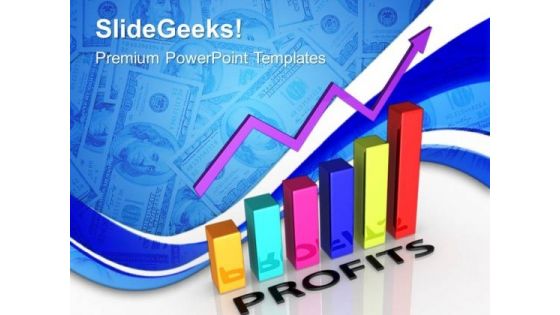
Profits Bar Chart Sales PowerPoint Templates And PowerPoint Themes 0612
Profits Bar Chart Sales PowerPoint Templates And PowerPoint Themes PPT Slides-Microsoft Powerpoint Templates and Background with graph with arrow Let our Profits Bar Chart Sales PowerPoint Templates And PowerPoint Themes 0612 do your errands. They will bring in the goodies for you.
Human Resource Metrics Icon With Bar Chart Elements PDF
Presenting Human Resource Metrics Icon With Bar Chart Elements PDF to dispense important information. This template comprises three stages. It also presents valuable insights into the topics including Human Resource Metrics Icon, Bar Chart. This is a completely customizable PowerPoint theme that can be put to use immediately. So, download it and address the topic impactfully.
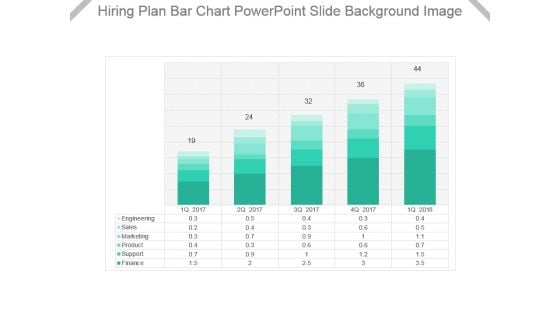
Hiring Plan Bar Chart Powerpoint Slide Background Image
This is a hiring plan bar chart powerpoint slide background image. This is a five stage process. The stages in this process are engineering, sales, marketing, product, support, finance.
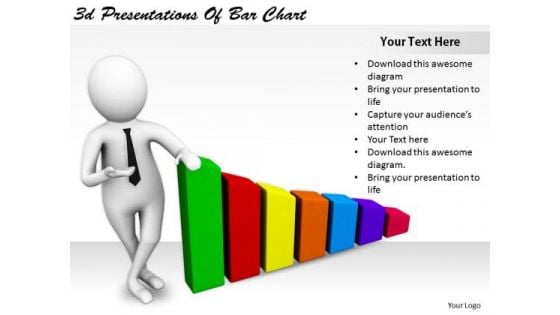
Business Strategy Innovation 3d Presentations Of Bar Chart Character Modeling
Your Thoughts Will Be The Main Course. Provide The Dressing With Our business strategy innovation 3d presentations of bar chart character modeling Powerpoint Templates. Dress Up Your Views With Our Marketing Powerpoint Templates. Deliver Your Ideas With Aplomb.
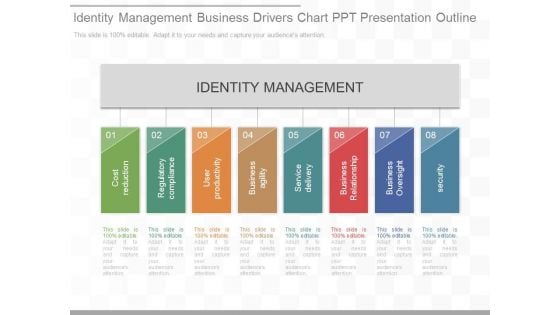
Identity Management Business Drivers Chart Ppt Presentation Outline
This is a identity management business drivers chart ppt presentation outline. This is a eight stage process. The stages in this process are identity management, cost reduction, regulatory compliance, user productivity, business agility, service delivery, business relationship, business oversight, security.
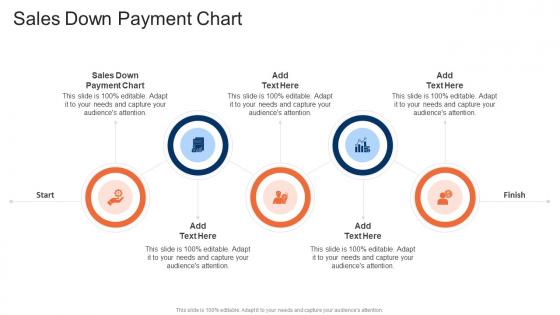
Sales Down Payment Chart In Powerpoint And Google Slides Cpb
Presenting our innovatively-designed set of slides titled Sales Down Payment Chart In Powerpoint And Google Slides Cpb. This completely editable PowerPoint graphic exhibits Sales Down Payment Chart that will help you convey the message impactfully. It can be accessed with Google Slides and is available in both standard screen and widescreen aspect ratios. Apart from this, you can download this well-structured PowerPoint template design in different formats like PDF, JPG, and PNG. So, click the download button now to gain full access to this PPT design. Our Sales Down Payment Chart In Powerpoint And Google Slides Cpb are topically designed to provide an attractive backdrop to any subject. Use them to look like a presentation pro.
Icon For Gender Comparative Assessment Proportion Pie Chart Elements PDF
Showcasing this set of slides titled icon for gender comparative assessment proportion pie chart elements pdf. The topics addressed in these templates are icon for gender comparative assessment proportion pie chart. All the content presented in this PPT design is completely editable. Download it and make adjustments in color, background, font etc. as per your unique business setting.
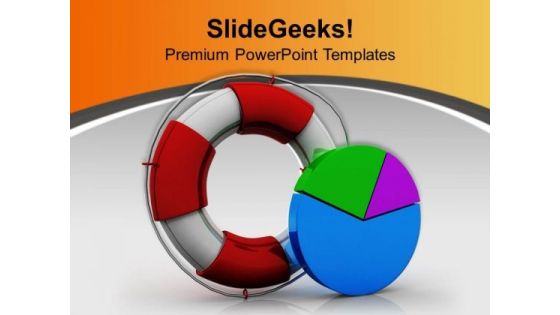
Rescue Pie Chart Business PowerPoint Templates And PowerPoint Themes 1112
Rescue Pie Chart Business PowerPoint Templates And PowerPoint Themes 1112-This Awesome PowerPoint template contains a diagram of lifesaver and pie chart. This image depicts the concept of statistics. Adjust the above image in your PPT presentations to visually support your content in your Business and Marketing PPT slideshows. Present your views using our innovative slides and be assured of leaving a lasting impression.-Rescue Pie Chart Business PowerPoint Templates And PowerPoint Themes 1112-This PowerPoint template can be used for presentations relating to-Lifesaver and Pie Chart, Symbol, Finance, Marketing, Business, Metaphor Get success delivered on a platter with our Rescue Pie Chart Business PowerPoint Templates And PowerPoint Themes 1112. Dont pass up this opportunity to shine.
Bar Chart Icon For Financial Ratios Comparison Elements PDF
Presenting bar chart icon for financial ratios comparison elements pdf to dispense important information. This template comprises four stages. It also presents valuable insights into the topics including bar chart icon for financial ratios comparison. This is a completely customizable PowerPoint theme that can be put to use immediately. So, download it and address the topic impactfully.
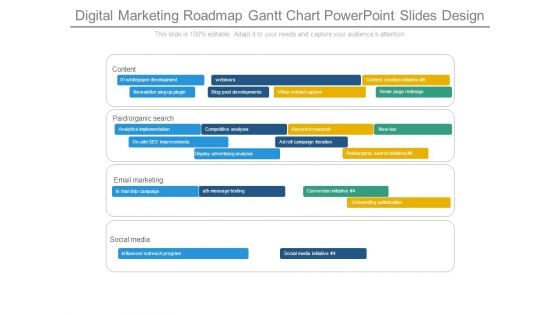
Digital Marketing Roadmap Gantt Chart Powerpoint Slides Design
This is a digital marketing roadmap gantt chart powerpoint slides design. This is a four stage process. The stages in this process are content, whitepaper development, webinars, content creation initiative, newsletter sing up plugin, blog post developments, video lead capture, home page redesign, paid organic search, analytics implementation, competitive analysis, keyword research, new bar, on site seo improvements, ad roll campaign iteration, display advertising analysis, paid organic search initiative, email marketing, trial drip campaign, a b message testing, conversion initiative, onboarding optimization, social media, influencer outreach program , social media initiative.
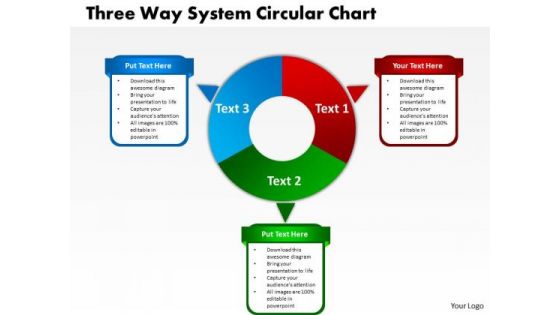
Strategic Management Three Way System Circular Chart Sales Diagram
Brace yourself, arm your thoughts. Prepare for the hustle with our Strategic Management Three Way System Circular Chart Sales Diagram Powerpoint Templates. Generate ecstasy with our Strategic Management Three Way System Circular Chart Sales Diagram Powerpoint Templates. Your thoughts will delight your audience.
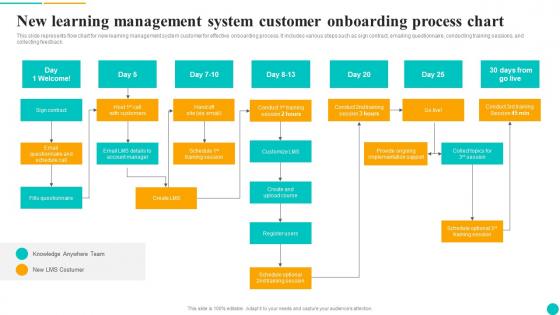
New Learning Management System Customer Onboarding Process Chart Introduction Pdf
This slide represents flow chart for new learning management system customer for effective onboarding process. It includes various steps such as sign contract, emailing questionnaire, conducting training sessions, and collecting feedback. Pitch your topic with ease and precision using this New Learning Management System Customer Onboarding Process Chart Introduction Pdf. This layout presents information on Fills Questionnaire, Create, Register Users. It is also available for immediate download and adjustment. So, changes can be made in the color, design, graphics or any other component to create a unique layout. This slide represents flow chart for new learning management system customer for effective onboarding process. It includes various steps such as sign contract, emailing questionnaire, conducting training sessions, and collecting feedback.
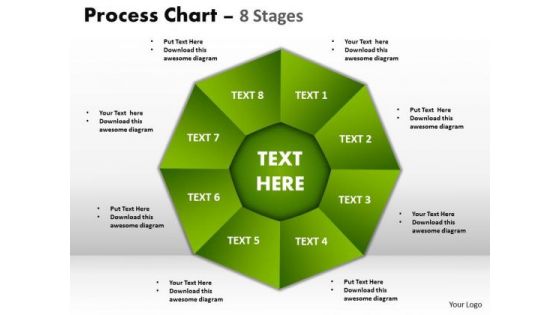
Marketing Diagram Process Chart 8 Stages Consulting Diagram
Get out of the dock with our Marketing Diagram Process Chart 8 Stages Consulting Diagram Powerpoint Templates. Your mind will be set free. Play the doctor with our Marketing Diagram Process Chart 8 Stages Consulting Diagram Powerpoint Templates. Control operations with your ideas.
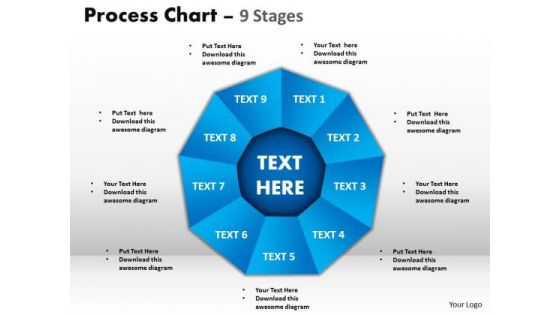
Business Diagram Process Chart 9 Stages Sales Diagram
Get out of the dock with our Business Diagram Process Chart 9 Stages Sales Diagram Powerpoint Templates. Your mind will be set free. Play the doctor with our Business Diagram Process Chart 9 Stages Sales Diagram Powerpoint Templates. Control operations with your ideas.
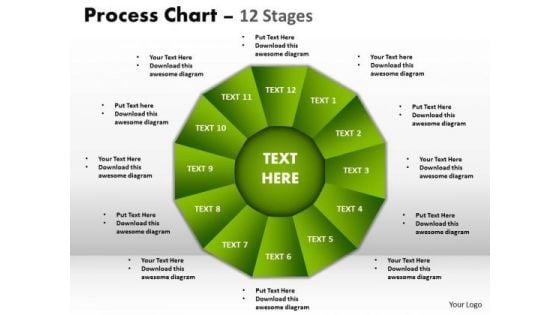
Marketing Diagram Process Chart 12 Stages Consulting Diagram
Get out of the dock with our Marketing Diagram Process Chart 12 Stages Consulting Diagram Powerpoint Templates. Your mind will be set free. Play the doctor with our Marketing Diagram Process Chart 12 Stages Consulting Diagram Powerpoint Templates. Control operations with your ideas.
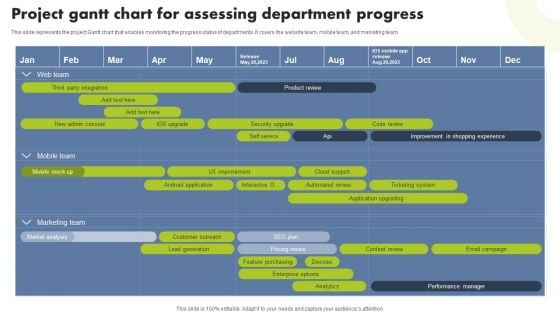
Project Gantt Chart For Assessing Department Progress Brochure PDF
This slide represents the project Gantt chart that enables monitoring the progress status of departments. It covers the website team, mobile team, and marketing team. Showcasing this set of slides titled Project Gantt Chart For Assessing Department Progress Brochure PDF. The topics addressed in these templates are Third Party Integration, New Admin Console, Security Upgrade. All the content presented in this PPT design is completely editable. Download it and make adjustments in color, background, font etc. as per your unique business setting.
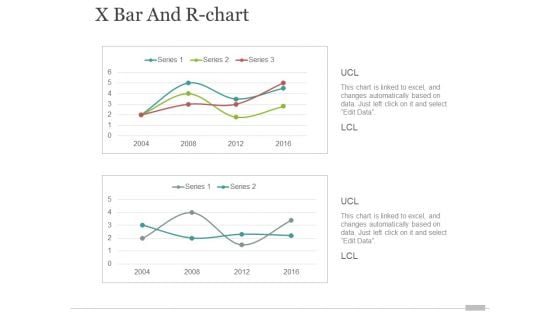
x bar and r chart ppt powerpoint presentation portfolio elements
This is a x bar and r chart ppt powerpoint presentation portfolio elements. This is a two stage process. The stages in this process are finance, business, marketing, growth.
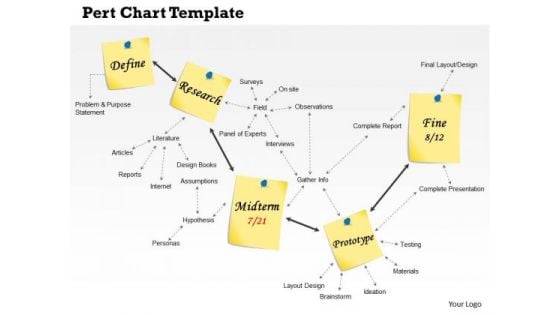
Business Framework Pert Chart Template Diagram PowerPoint Presentation
This business framework image slide displays Pert chart template. Use this image slide to depict PERT chart which is a project management tool used to schedule, organize, and coordinate tasks within a project. This image slide will enhance the quality of your presentations.
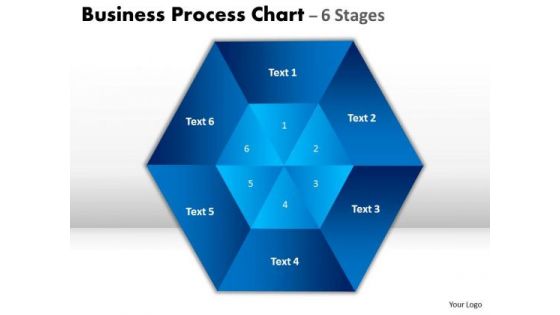
Business Framework Model Business Process Chart 6 Stages Strategy Diagram
Get out of the dock with our Business Framework Model Business Process Chart 6 Stages Strategy Diagram Powerpoint Templates. Your mind will be set free. Play the doctor with our Business Framework Model Business Process Chart 6 Stages Strategy Diagram Powerpoint Templates. Control operations with your ideas.
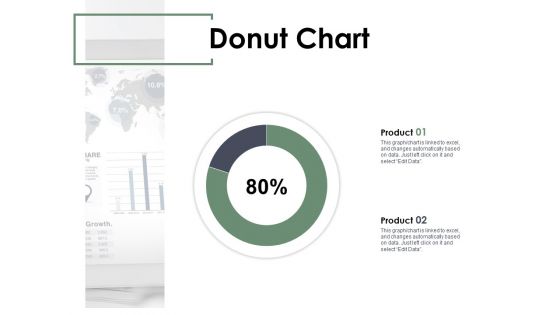
Donut Chart Analysis Ppt PowerPoint Presentation Summary Elements
Presenting this set of slides with name donut chart analysis ppt powerpoint presentation summary elements. The topics discussed in these slides are donut chart, finance, marketing, management, investment. This is a completely editable PowerPoint presentation and is available for immediate download. Download now and impress your audience.
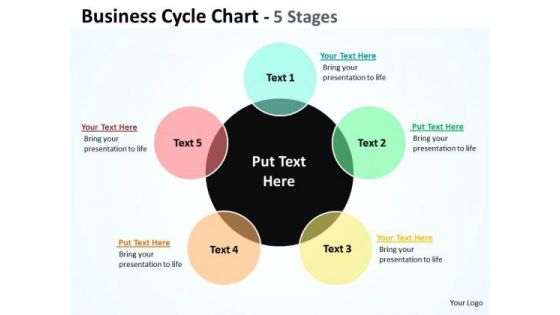
Consulting Diagram Business Cycle Chart Diagrams Mba Models And Frameworks
Get the domestics right with our Consulting diagram Business Cycle Chart diagrams MBA models and frameworks Powerpoint Templates. Create the base for thoughts to grow. Do away with dogmatic approaches. Establish the value of reason with our Consulting diagram Business Cycle Chart diagrams MBA models and frameworks Powerpoint Templates.
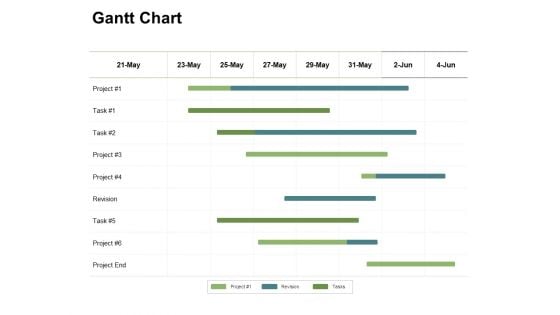
Gantt Chart Business Marketing Ppt PowerPoint Presentation Outline Influencers
Presenting this set of slides with name gantt chart business marketing ppt powerpoint presentation outline influencers. The topics discussed in these slides are gantt chart, business, management, planning, strategy. This is a completely editable PowerPoint presentation and is available for immediate download. Download now and impress your audience.
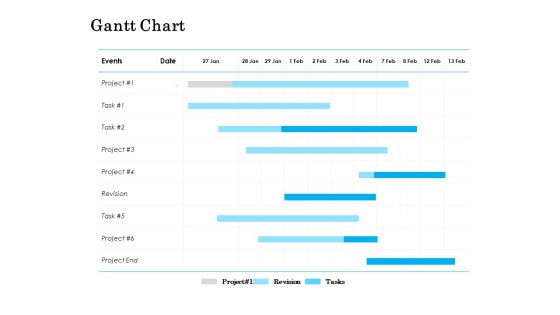
Gantt Chart Marketing Ppt PowerPoint Presentation Slides Outline
Presenting this set of slides with name gantt chart marketing ppt powerpoint presentation slides outline. The topics discussed in these slide is gantt chart. This is a completely editable PowerPoint presentation and is available for immediate download. Download now and impress your audience.


 Continue with Email

 Home
Home


