Improvement Chart
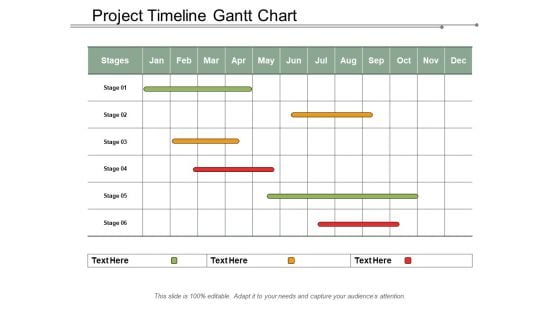
Project Timeline Gantt Chart Ppt PowerPoint Presentation Gallery
This is a project timeline gantt chart ppt powerpoint presentation gallery. This is a three stage process. The stages in this process are project management, project progress, project growth.
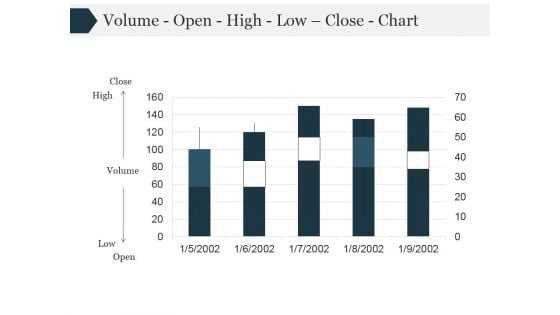
Volume Open High Low Close Chart Ppt PowerPoint Presentation Themes
This is a volume open high low close chart ppt powerpoint presentation themes. This is a five stage process. The stages in this process are high, volume, close, low.
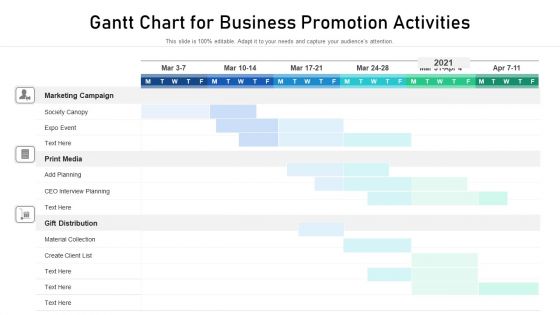
Gantt Chart For Business Promotion Activities Sample PDF
Design a highly optimized project management report using this well-researched gantt chart for business promotion activities sample pdf. This layout can be used to present the professional details of a task or activity. Showcase the activities allocated to the business executives with this Gantt Chart PowerPoint theme. List down the column tasks in various timeframes and allocate time for each. In addition, also monitor the actual time and make comparisons to interpret the final progress using this innovative Gantt Chart Template. Showcase the work breakdown structure to attract your audience. Download and share it using Google Slides, if it suits your requirement.
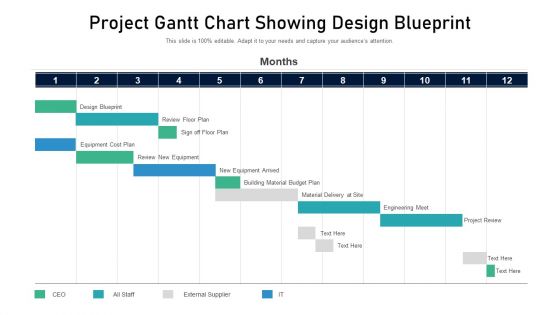
Project Gantt Chart Showing Design Blueprint Rules PDF
Design a highly optimized project management report using this well-researched project gantt chart showing design blueprint rules pdf. This layout can be used to present the professional details of a task or activity. Showcase the activities allocated to the business executives with this Gantt Chart PowerPoint theme. List down the column tasks in various timeframes and allocate time for each. In addition, also monitor the actual time and make comparisons to interpret the final progress using this innovative Gantt Chart Template. Showcase the work breakdown structure to attract your audience. Download and share it using Google Slides, if it suits your requirement.
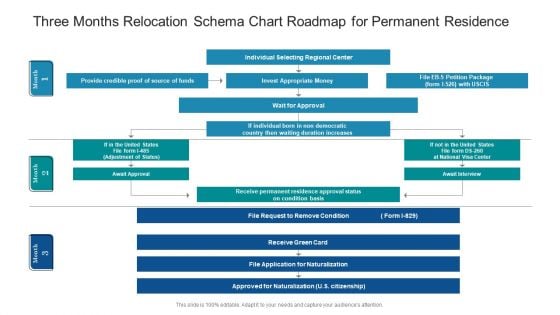
Three Months Relocation Schema Chart Roadmap For Permanent Residence Guidelines
Presenting our jaw dropping three months relocation schema chart roadmap for permanent residence guidelines. You can alternate the color, font size, font type, and shapes of this PPT layout according to your strategic process. This PPT presentation is compatible with Google Slides and is available in both standard screen and widescreen aspect ratios. You can also download this well researched PowerPoint template design in different formats like PDF, JPG, and PNG. So utilize this visually appealing design by clicking the download button given below.
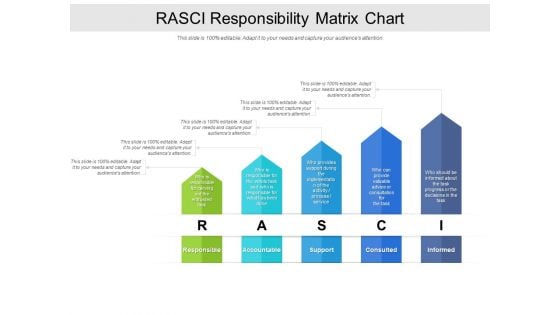
RASCI Responsibility Matrix Chart Ppt PowerPoint Presentation Outline Model
Presenting this set of slides with name rasci responsibility matrix chart ppt powerpoint presentation outline model. The topics discussed in these slides are responsible, accountable, support, consulted, informed. This is a completely editable PowerPoint presentation and is available for immediate download. Download now and impress your audience.
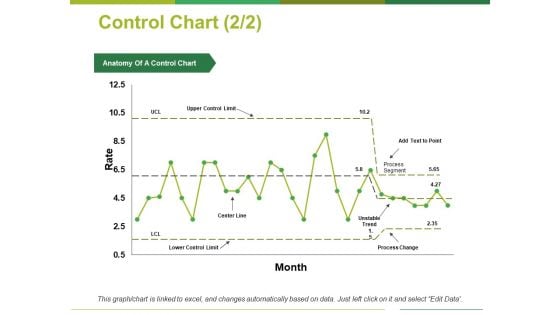
Control Chart Template 2 Ppt PowerPoint Presentation Portfolio Summary
This is a control chart template 2 ppt powerpoint presentation portfolio summary. This is a one stage process. The stages in this process are upper control limit, process segment, process change, unstable trend, lower control limit.
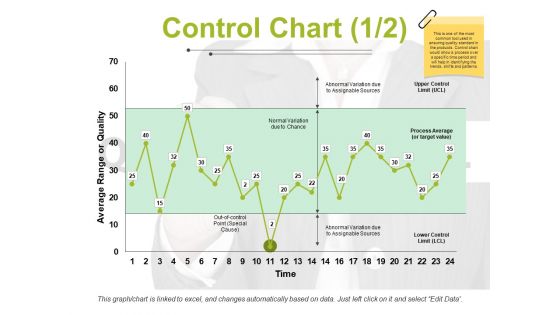
Control Chart Template 1 Ppt PowerPoint Presentation Ideas Images
This is a control chart template 1 ppt powerpoint presentation ideas images. This is a two stage process. The stages in this process are average range or quality, upper control limit, lower control limit, time, process average.
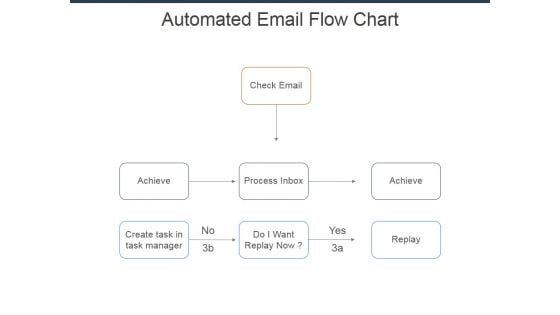
Automated Email Flow Chart Ppt Powerpoint Presentation Infographics Show
This is a automated email flow chart ppt powerpoint presentation infographics show. This is a three stage process. The stages in this process are check email, achieve, process inbox, do i want replay now, create task in task manager.

Organization Chart Template Ppt PowerPoint Presentation Infographic Template Styles
This is a organization chart template ppt powerpoint presentation infographic template styles. This is a four stage process. The stages in this process are john smith, anita carol, merry doe, jess parker.
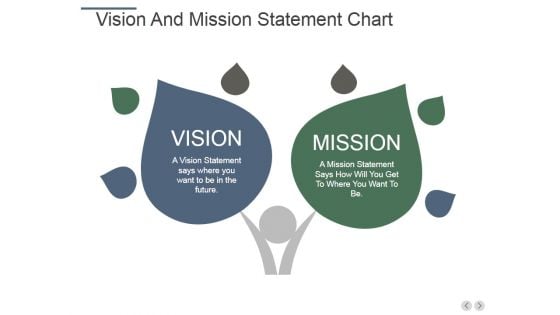
Vision And Mission Statement Chart Ppt PowerPoint Presentation Model Demonstration
This is a vision and mission statement chart ppt powerpoint presentation model demonstration. This is a two stage process. The stages in this process are vision, mission, business, strategy, management.
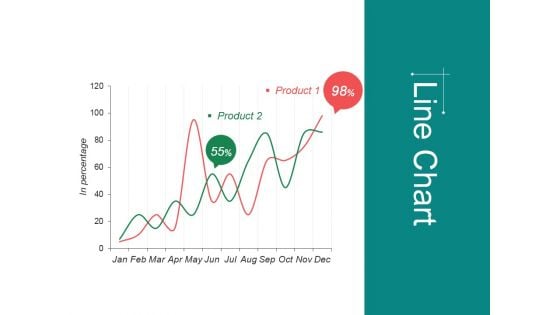
Line Chart Ppt Powerpoint Presentation Infographic Template Format
This is a line chart ppt powerpoint presentation infographic template format. This is a two stage process. The stages in this process are jan, feb, mar, apr, may, financial.
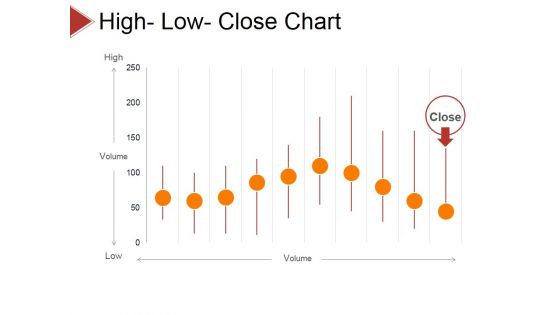
High Low Close Chart Ppt PowerPoint Presentation Layouts Visual Aids
This is a high low close chart ppt powerpoint presentation layouts visual aids. This is a ten stage process. The stages in this process are volume, high, low, close.
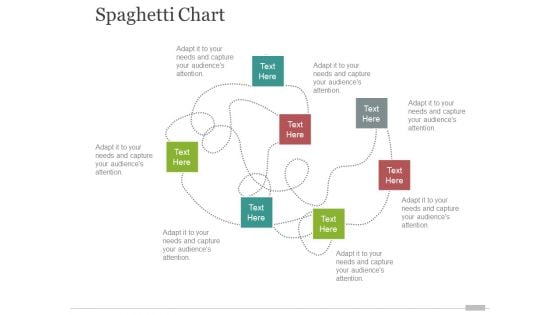
spaghetti chart template 2 ppt powerpoint presentation inspiration portfolio
This is a spaghetti chart template 2 ppt powerpoint presentation inspiration portfolio. This is a seven stage process. The stages in this process are business, marketing, management, analysis, strategy.
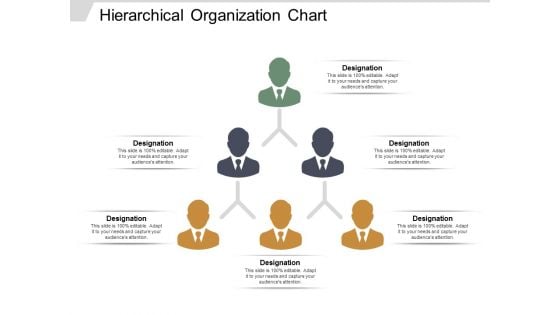
Hierarchical Organization Chart Ppt PowerPoint Presentation Ideas Skills
This is a hierarchical organization chart ppt powerpoint presentation ideas skills. This is a three stage process. The stages in this process are business ownership, family business, owned business.
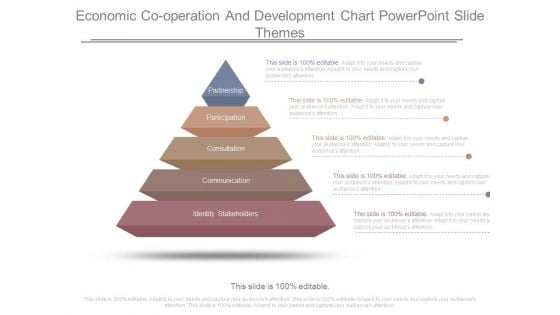
Economic Cooperation And Development Chart Powerpoint Slide Themes
This is a economic cooperation and development chart powerpoint slide themes. This is a five stage process. The stages in this process are partnership, participation, consultation, communication, identify, stakeholders.

SAP Implementation Process Gantt Chart Ppt Slides Sample Pdf
This slide represents the timeline or Gantt chart of the SAP implementation process. It further includes various stages of process such as build team and identify business goal, evaluate business process, implement business blueprint, etc. Pitch your topic with ease and precision using this SAP Implementation Process Gantt Chart Ppt Slides Sample Pdf. This layout presents information on Business Goal, Evaluate Business Process, Implement Business Blueprint. It is also available for immediate download and adjustment. So, changes can be made in the color, design, graphics or any other component to create a unique layout. This slide represents the timeline or Gantt chart of the SAP implementation process. It further includes various stages of process such as build team and identify business goal, evaluate business process, implement business blueprint, etc.
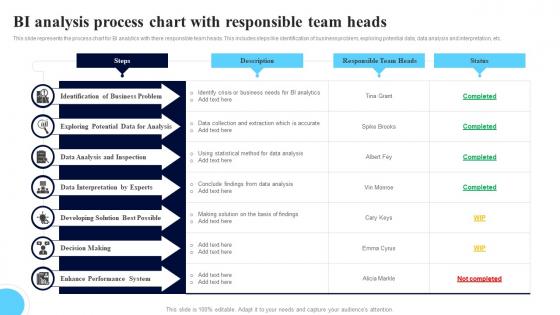
BI Analysis Process Chart With Responsible Team Heads Mockup Pdf
This slide represents the process chart for BI analytics with there responsible team heads. This includes steps like identification of business problem, exploring potential data, data analysis and interpretation, etc. Showcasing this set of slides titled BI Analysis Process Chart With Responsible Team Heads Mockup Pdf. The topics addressed in these templates are Identification Of Business, Data Analysis, Data Interpretation. All the content presented in this PPT design is completely editable. Download it and make adjustments in color, background, font etc. as per your unique business setting. This slide represents the process chart for BI analytics with there responsible team heads. This includes steps like identification of business problem, exploring potential data, data analysis and interpretation, etc.
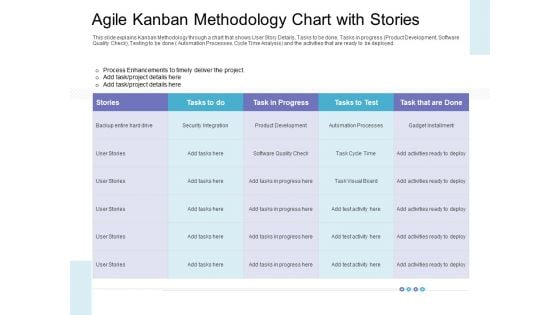
Agile Kanban Methodology Chart With Stories Formats PDF
This slide explains Kanban Methodology through a chart that shows User Story Details, Tasks to be done, Tasks in progress Product Development, Software Quality Check, Testing to be done Automation Processes, Cycle Time Analysis and the activities that are ready to be deployed. Deliver an awe-inspiring pitch with this creative agile kanban methodology chart with stories formats pdf bundle. Topics like agile kanban methodology chart with stories can be discussed with this completely editable template. It is available for immediate download depending on the needs and requirements of the user.
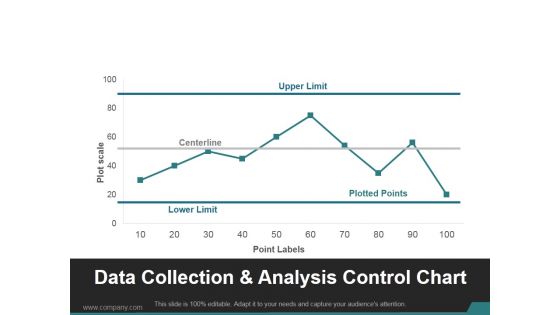
Data Collection And Analysis Control Chart Ppt PowerPoint Presentation Visuals
This is a data collection and analysis control chart ppt powerpoint presentation visuals. This is a ten stage process. The stages in this process are upper limit, centerline, lower limit, plotted points.
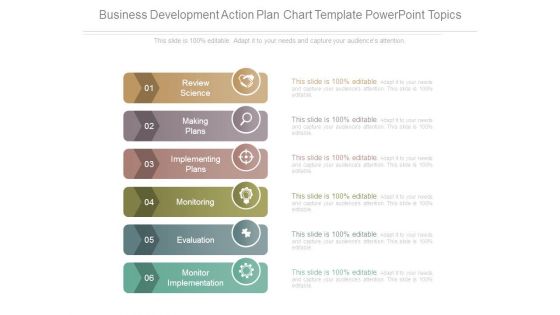
Business Development Action Plan Chart Template Powerpoint Topics
This is a business development action plan chart template powerpoint topics. This is a six stage process. The stages in this process are review science, making plans, implementing plans, monitoring, evaluation, monitor implementation.
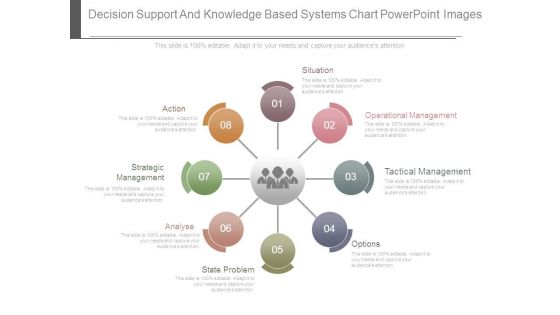
Decision Support And Knowledge Based Systems Chart Powerpoint Images
This is a decision support and knowledge based systems chart powerpoint images. This is a eight stage process. The stages in this process are situation, operational management, tactical management, options, state problem, analyse, strategic management, action.
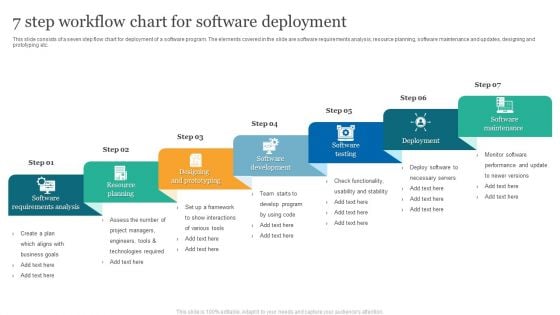
7 Step Workflow Chart For Software Deployment Introduction PDF
This slide consists of a seven step flow chart for deployment of a software program. The elements covered in the slide are software requirements analysis, resource planning, software maintenance and updates, designing and prototyping etc. Persuade your audience using this 7 Step Workflow Chart For Software Deployment Introduction PDF. This PPT design covers Seven stages, thus making it a great tool to use. It also caters to a variety of topics including Software Requirements Analysis, Resource Planning, Designing And Prototyping. Download this PPT design now to present a convincing pitch that not only emphasizes the topic but also showcases your presentation skills.
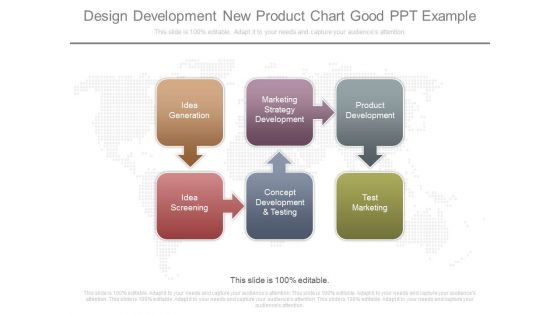
Design Development New Product Chart Good Ppt Example
This is a design development new product chart good ppt example. This is a six stage process. The stages in this process are idea generation, marketing strategy development, product development, idea screening, concept development and testing, test marketing.
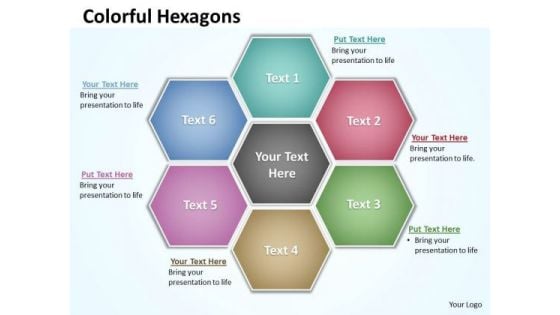
Ppt Hexagon Shapes Chart Presentation PowerPoint Tips Free Download Templates
PPT hexagon shapes chart presentation powerpoint tips free download Templates-This Hexagon diagram is a graphical illustration of the relationships between and among sets of data, groups of objects. . Present your views using this innovative slide and be assured of leaving a lasting impression.-PPT hexagon shapes chart presentation powerpoint tips free download Templates-Abstract, Background, Design, Digital, Elements, Graphic, Grey, Hexagon, Illustration, Light, Modern, Perspective, Triangles, Shapes, Shiny, Style, Technology, Template, Vector, Vertical, Virtual, Wallpaper, Web Experience the aesthetics of our Ppt Hexagon Shapes Chart Presentation PowerPoint Tips Free Download Templates. They are created with brilliant design sense.
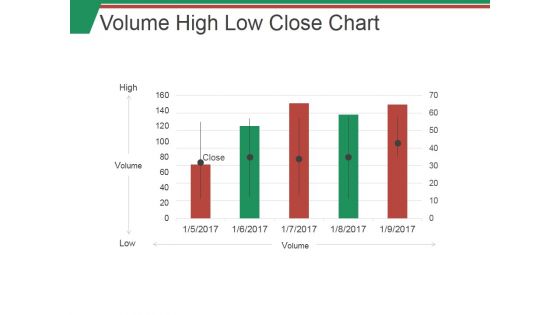
Volume High Low Close Chart Ppt PowerPoint Presentation Outline Examples
This is a volume high low close chart ppt powerpoint presentation outline examples. This is a five stage process. The stages in this process are high, low, volume, graph, business.
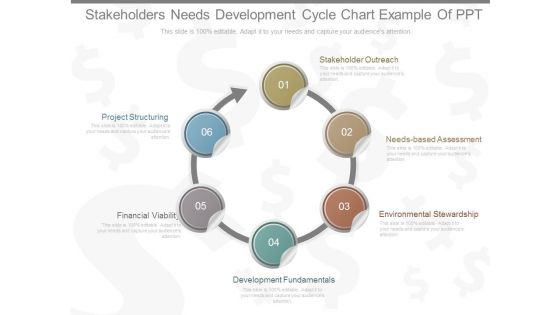
Stakeholders Needs Development Cycle Chart Example Of Ppt
This is a stakeholders needs development cycle chart example of ppt. This is a six stage process. The stages in this process are stakeholder outreach, needs based assessment, environmental stewardship,, development fundamentals, financial viability, project structuring.
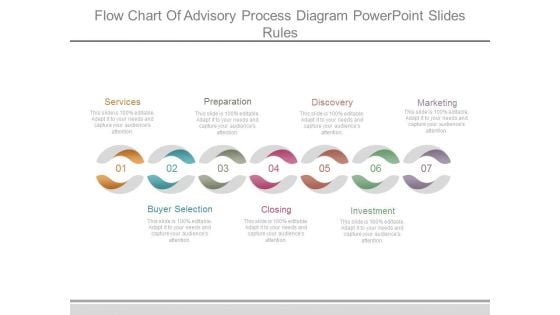
Flow Chart Of Advisory Process Diagram Powerpoint Slides Rules
This is a flow chart of advisory process diagram powerpoint slides rules. This is a seven stage process. The stages in this process are services, buyer selection, preparation, closing, discovery, investment, marketing.
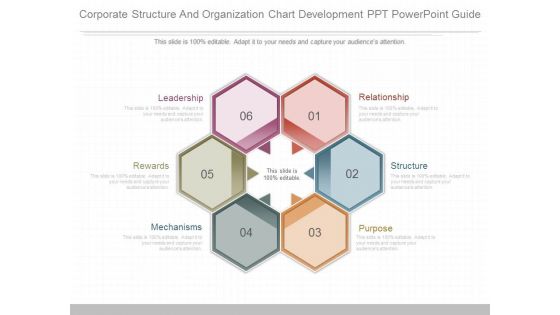
Corporate Structure And Organization Chart Development Ppt Powerpoint Guide
This is a corporate structure and organization chart development ppt powerpoint guide. This is a six stage process. The stages in this process are relationship, structure, purpose, mechanisms, rewards, leadership.
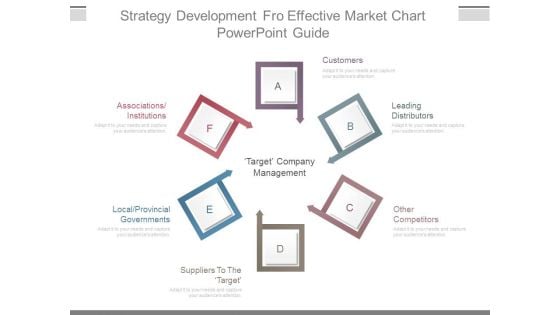
Strategy Development Fro Effective Market Chart Powerpoint Guide
This is a strategy development fro effective market chart powerpoint guide. This is a six stage process. The stages in this process are customers, leading distributors, other competitors, suppliers to the target, local provincial governments, associations institutions, target company management.
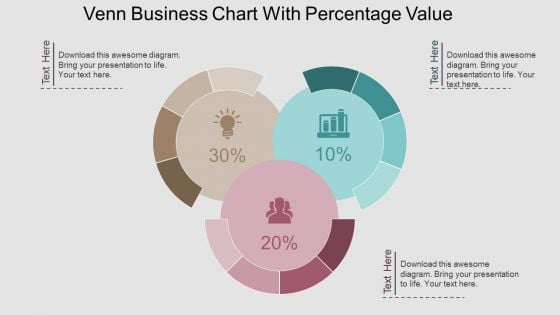
Venn Business Chart With Percentage Value Powerpoint Template
This PPT slide contains Venn business chart with percentage values. This PPT diagram is suitable to present data comparison and analysis. Enlighten others on the process with this innovative PowerPoint template.
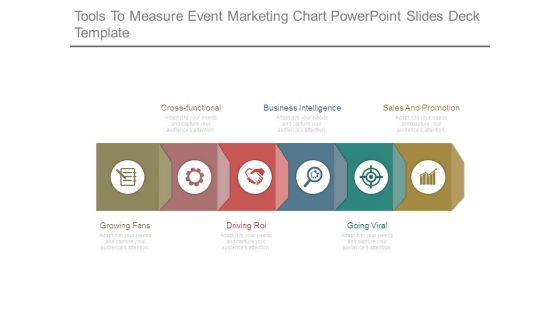
Tools To Measure Event Marketing Chart Powerpoint Slides Deck Template
This is a tools to measure event marketing chart powerpoint slides deck template. This is a six stage process. The stages in this process are cross functional, business intelligence, sales and promotion, going viral, driving roi, growing fans.
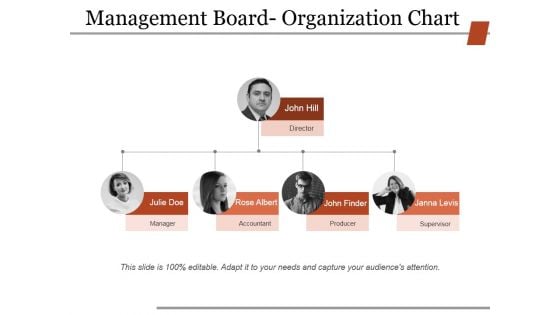
Management Board Organization Chart Ppt PowerPoint Presentation Slides Infographics
This is a management board organization chart ppt powerpoint presentation slides infographics. This is a four stage process. The stages in this process are manager, accountant, producer, supervisor, director.
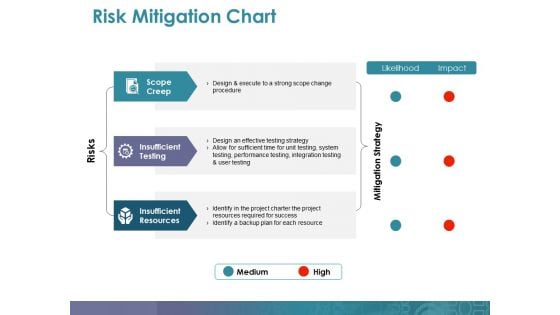
Risk Mitigation Chart Ppt PowerPoint Presentation Professional Guidelines
This is a risk mitigation chart ppt powerpoint presentation professional guidelines. This is a three stage process. The stages in this process are scope creep, insufficient testing, insufficient resources, mitigation strategy, risks.
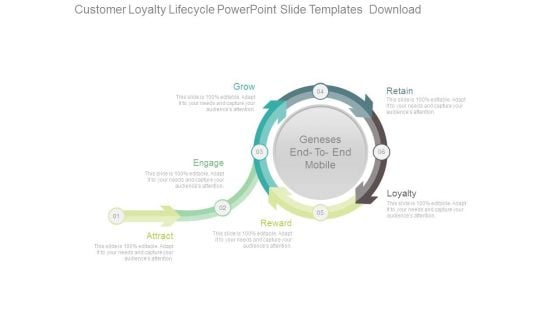
Customer Loyalty Circle Chart Powerpoint Slide Templates Download
This is a customer loyalty circle chart powerpoint slide templates download. This is a six stage process. The stages in this process are grow, engage, attract, reward, retain, loyalty.

Business Chart Marketing PowerPoint Templates And PowerPoint Backgrounds 0211
Microsoft PowerPoint Template and Background with up arrow showing increase in money Our Business Chart Marketing PowerPoint Templates And PowerPoint Backgrounds 0211 will never fight shy. They are confident of addressing any and every issue.
Triptans Comparison Chart In Powerpoint And Google Slides Cpb
Presenting our innovatively designed set of slides titled Triptans Comparison Chart In Powerpoint And Google Slides Cpb This completely editable PowerPoint graphic exhibits Triptans Comparison Chart that will help you convey the message impactfully. It can be accessed with Google Slides and is available in both standard screen and widescreen aspect ratios. Apart from this, you can download this well structured PowerPoint template design in different formats like PDF, JPG, and PNG. So, click the download button now to gain full access to this PPT design. Our Triptans Comparison Chart In Powerpoint And Google Slides Cpb are topically designed to provide an attractive backdrop to any subject. Use them to look like a presentation pro.
Sound Quality Chart In Powerpoint And Google Slides Cpb
Presenting our innovatively designed set of slides titled Sound Quality Chart In Powerpoint And Google Slides Cpb. This completely editable PowerPoint graphic exhibits Sound Quality Chart that will help you convey the message impactfully. It can be accessed with Google Slides and is available in both standard screen and widescreen aspect ratios. Apart from this, you can download this well structured PowerPoint template design in different formats like PDF, JPG, and PNG. So, click the download button now to gain full access to this PPT design. Our Sound Quality Chart In Powerpoint And Google Slides Cpb are topically designed to provide an attractive backdrop to any subject. Use them to look like a presentation pro.
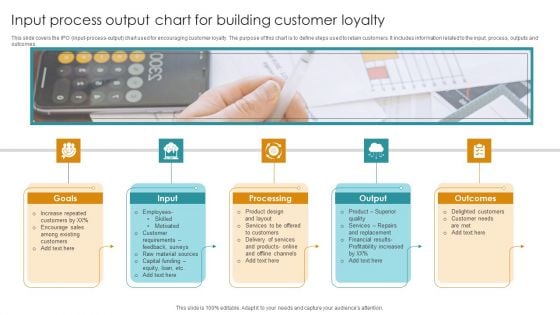
Input Process Output Chart For Building Customer Loyalty Formats PDF
This slide covers the IPO input-process-output chart used for encouraging customer loyalty. The purpose of this chart is to define steps used to retain customers. It includes information related to the input, process, outputs and outcomes. Persuade your audience using this Input Process Output Chart For Building Customer Loyalty Formats PDF. This PPT design covers Five stages, thus making it a great tool to use. It also caters to a variety of topics including Goals, Input, Processing. Download this PPT design now to present a convincing pitch that not only emphasizes the topic but also showcases your presentation skills.
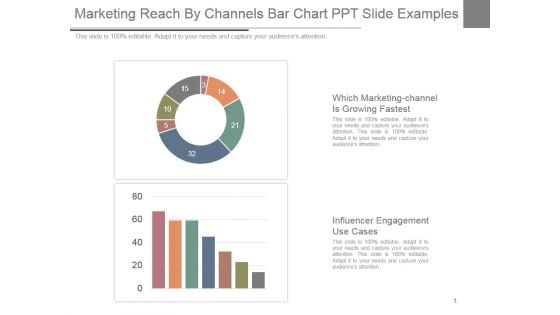
Marketing Reach By Channels Bar Chart Ppt Slide Examples
This is a marketing reach by channels bar chart ppt slide examples. This is a two stage process. The stages in this process are which marketing-channel is growing fastest, influencer engagement use cases.
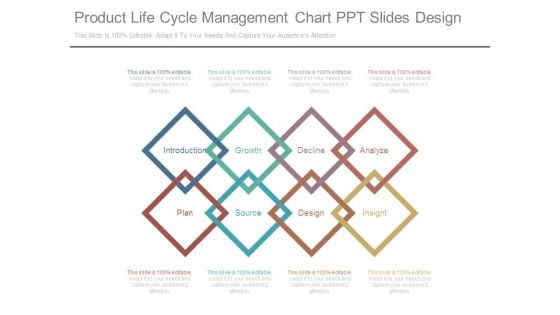
Product Life Cycle Management Chart Ppt Slides Design
This is a product life cycle management chart ppt slides design. This is a eight stage process. The stages in this process are introduction, growth, decline, analyze, plan, source, design, insight.
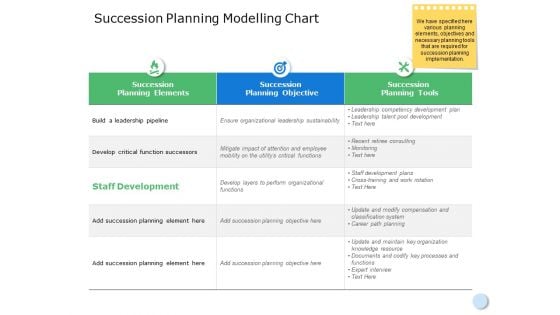
Succession Planning Modelling Chart Ppt Powerpoint Presentation File Professional
This is a succession planning modelling chart ppt powerpoint presentation file professional.The topics discussed in this diagram aresuccession planning elements, compare, planning, business, management. This is a completely editable PowerPoint presentation, and is available for immediate download.
Chart Business PowerPoint Templates And PowerPoint Backgrounds 0511
Microsoft PowerPoint Template and Background with orange bar on screen business conceptual illustration Enhance your charisma with our Chart Business PowerPoint Templates And PowerPoint Backgrounds 0511. Allow your aura to flow around.
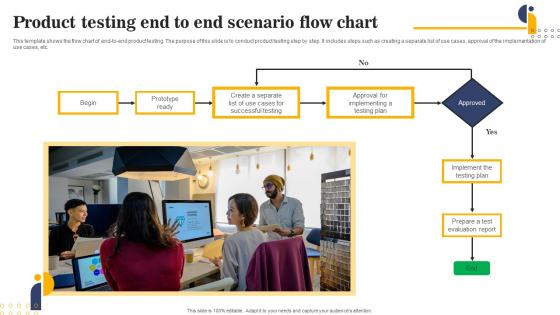
Product Testing End To End Scenario Flow Chart Download Pdf
This template shows the flow chart of end-to-end product testing. The purpose of this slide is to conduct product testing step by step. It includes steps such as creating a separate list of use cases, approval of the implementation of use cases, etc.Pitch your topic with ease and precision using this Product Testing End To End Scenario Flow Chart Download Pdf This layout presents information on Successful Testing, Prototype Ready, Approval Implementing It is also available for immediate download and adjustment. So, changes can be made in the color, design, graphics or any other component to create a unique layout. This template shows the flow chart of end to end product testing. The purpose of this slide is to conduct product testing step by step. It includes steps such as creating a separate list of use cases, approval of the implementation of use cases, etc.
Ppt Slide Business Illustration Umbrella Chart Strategic Planning
Get The Domestics Right With Our PPT Slide business illustration umbrella chart strategic planning Powerpoint Templates. Create The Base For Thoughts To Grow. Do Away With Dogmatic Approaches. Establish The Value Of Reason With Our Business Plan Powerpoint Templates.
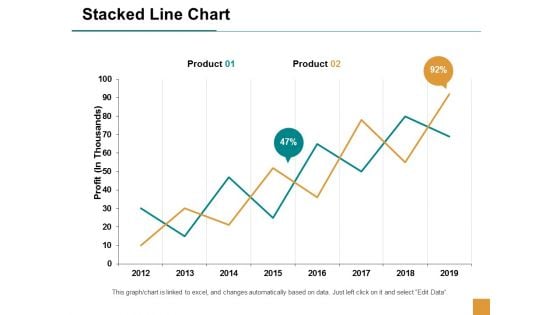
Stacked Line Chart Finance Ppt Powerpoint Presentation Outline Themes
This is a stacked line chart finance ppt powerpoint presentation outline themes. This is a two stage process. The stages in this process are finance, marketing, management, investment, analysis.
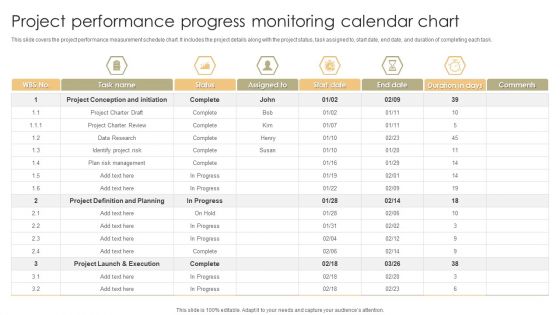
Project Performance Progress Monitoring Calendar Chart Pictures PDF
This slide covers the project performance measurement schedule chart. It includes the project details along with the project status, task assigned to, start date, end date, and duration of completing each task. Showcasing this set of slides titled Project Performance Progress Monitoring Calendar Chart Pictures PDF. The topics addressed in these templates are Plan Risk Management, Project Definition And Planning, Execution. All the content presented in this PPT design is completely editable. Download it and make adjustments in color, background, font etc. as per your unique business setting.
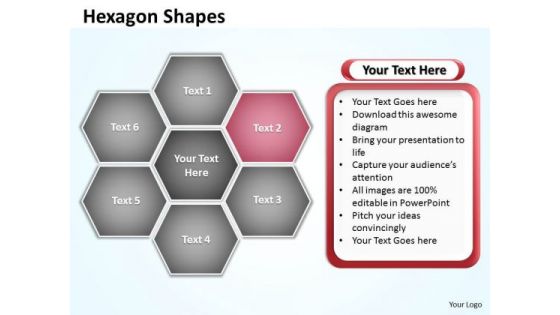
Ppt Hexagon Angles Shaped Chart Editable PowerPoint Templates 2007
PPT hexagon angles shaped chart editable powerpoint templates 2007-Use this Hexagon diagram to explain complex and difficult business strategic planning & staff development. This is an amazing tool to ensure that strategic planning sessions contribute to teambuilding, and are interesting too.-PPT hexagon angles shaped chart editable powerpoint templates 2007-Abstract, Background, Design, Digital, Elements, Graphic, Grey, Hexagon, Illustration, Light, Modern, Perspective, Triangles, Shapes, Shiny, Style, Technology, Template, Vector, Vertical, Virtual, Wallpaper, Web Our Ppt Hexagon Angles Shaped Chart Editable PowerPoint Templates 2007 impress people. With our money back guarantee you have nothing to lose.
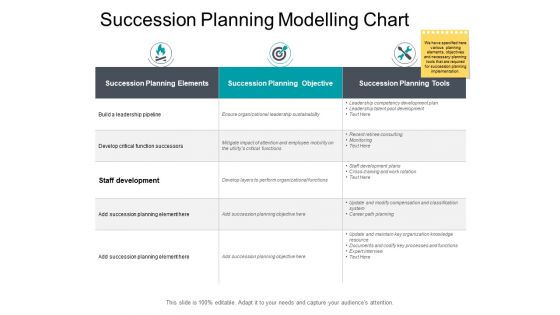
Succession Planning Modelling Chart Ppt PowerPoint Presentation Professional Gridlines
This is a succession planning modelling chart ppt powerpoint presentation professional gridlines. This is a three stage process. The stages in this process are compare, marketing, business, management, planning.
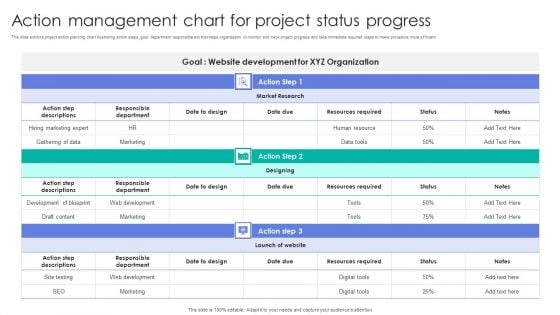
Action Management Chart For Project Status Progress Background PDF
This slide exhibits project action planning chart illustrating action steps, goal, department responsible etc that helps organization to monitor and track project progress and take immediate required steps to make procedure more efficient. Showcasing this set of slides titled Action Management Chart For Project Status Progress Background PDF. The topics addressed in these templates are Web Development, Marketing, Resources Required. All the content presented in this PPT design is completely editable. Download it and make adjustments in color, background, font etc. as per your unique business setting.
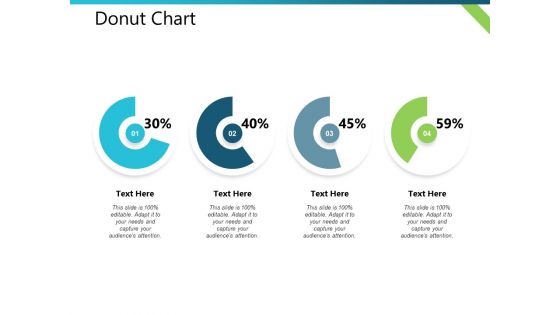
Donut Chart Distribution Plan Ppt PowerPoint Presentation Visual Aids Outline
This is a donut chart distribution plan ppt powerpoint presentation visual aids outline. This is a four stage process. The stages in this process are business, management, financial, marketing, strategy.
Colorful Bar Chart Business PowerPoint Templates And PowerPoint Backgrounds 0811
Microsoft PowerPoint Template and Background with of a three-dimensional multi-colored bar graph on a white background Address baseless allegations with our Colorful Bar Chart Business PowerPoint Templates And PowerPoint Backgrounds 0811. Give appropriate answers to clear all doubts.

Bar Chart Business PowerPoint Templates And PowerPoint Backgrounds 0411
Microsoft PowerPoint Template and Background with arrow pointing up in bar chat If you have doubts about the effort required? Be assured our Bar Chart Business PowerPoint Templates And PowerPoint Backgrounds 0411 will make it fairly easy.
Colorful Bar Chart Business PowerPoint Themes And PowerPoint Slides 0811
Microsoft PowerPoint Theme and Slide with of a three-dimensional multi-colored bar graph on a white Slide Don't leave your career to chance. Let our Colorful Bar Chart Business PowerPoint Themes And PowerPoint Slides 0811 help you take charge.
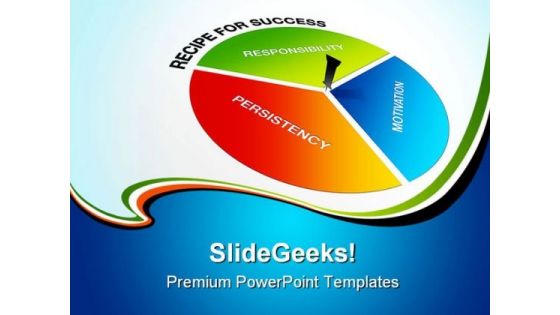
Chart For Success Business PowerPoint Themes And PowerPoint Slides 0411
Microsoft PowerPoint Theme and Slide with perspective graphic of a pie with words recipe for succes Access our Chart For Success Business PowerPoint Themes And PowerPoint Slides 0411 anytime,anywhere. They are available around the clock.
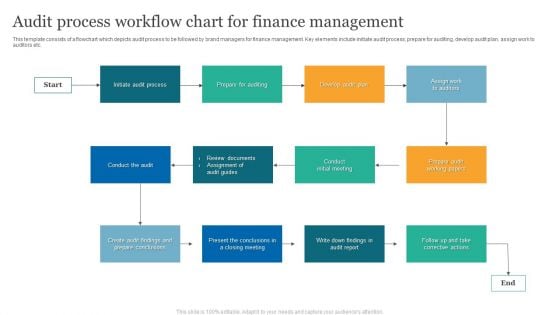
Audit Process Workflow Chart For Finance Management Summary PDF
This template consists of a flowchart which depicts audit process to be followed by brand managers for finance management. Key elements include initiate audit process, prepare for auditing, develop audit plan, assign work to auditors etc.
Emotions Synonyms Chart In Powerpoint And Google Slides Cpb
Presenting our innovatively designed set of slides titled Emotions Synonyms Chart In Powerpoint And Google Slides Cpb. This completely editable PowerPoint graphic exhibits Emotions Synonyms Chart that will help you convey the message impactfully. It can be accessed with Google Slides and is available in both standard screen and widescreen aspect ratios. Apart from this, you can download this well structured PowerPoint template design in different formats like PDF, JPG, and PNG. So, click the download button now to gain full access to this PPT design. Our Emotions Synonyms Chart In Powerpoint And Google Slides Cpb are topically designed to provide an attractive backdrop to any subject. Use them to look like a presentation pro.
CPU Hierarchy Chart Toms In Powerpoint And Google Slides Cpb
Presenting our innovatively-designed set of slides titled CPU Hierarchy Chart Toms In Powerpoint And Google Slides Cpb. This completely editable PowerPoint graphic exhibits CPU Hierarchy Chart Toms that will help you convey the message impactfully. It can be accessed with Google Slides and is available in both standard screen and widescreen aspect ratios. Apart from this, you can download this well-structured PowerPoint template design in different formats like PDF, JPG, and PNG. So, click the download button now to gain full access to this PPT design. Our CPU Hierarchy Chart Toms In Powerpoint And Google Slides Cpb are topically designed to provide an attractive backdrop to any subject. Use them to look like a presentation pro.
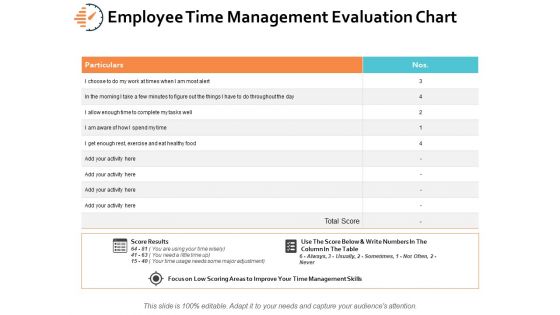
Employee Time Management Evaluation Chart Ppt PowerPoint Presentation Outline Guidelines
This is a employee time management evaluation chart ppt powerpoint presentation outline guidelines. This is a two stage process. The stages in this process are business, planning, strategy, marketing, management.
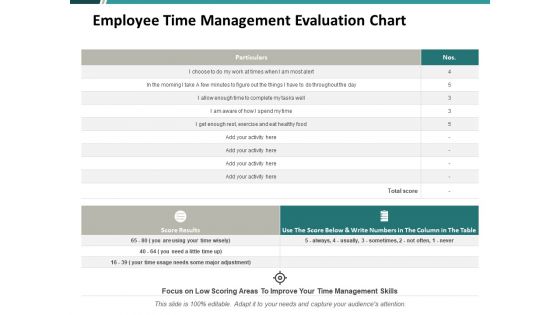
Employee Time Management Evaluation Chart Ppt PowerPoint Presentation Outline Slides
This is a employee time management evaluation chart ppt powerpoint presentation outline slides. This is a three stage process. The stages in this process are compare, marketing, business, management, planning.


 Continue with Email

 Home
Home


