Infographic Icons
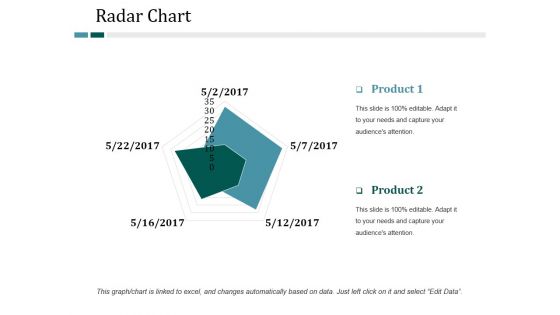
Radar Chart Ppt PowerPoint Presentation Infographic Template Backgrounds
This is a radar chart ppt powerpoint presentation infographic template backgrounds. This is a two stage process. The stages in this process are radar chart, finance, marketing, strategy, business.

Column Chart Ppt PowerPoint Presentation Infographic Template Slides
This is a column chart ppt powerpoint presentation infographic template slides. This is a two stage process. The stages in this process are column chart, finance, marketing, strategy, business.
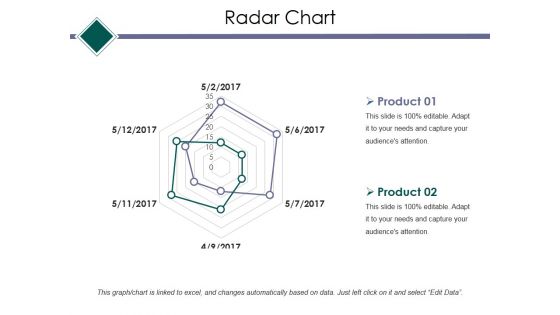
Radar Chart Ppt PowerPoint Presentation Infographic Template Example Topics
This is a radar chart ppt powerpoint presentation infographic template example topics. This is a two stage process. The stages in this process are radar chart, finance, marketing, strategy, business.
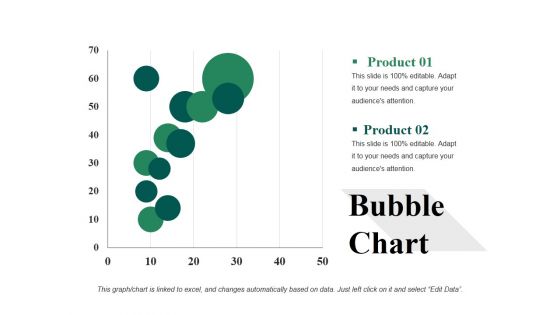
Bubble Chart Ppt PowerPoint Presentation Infographic Template Example 2015
This is a bubble chart ppt powerpoint presentation infographic template example 2015. This is a two stage process. The stages in this process are analysis, strategy, finance, business, bubble chart.
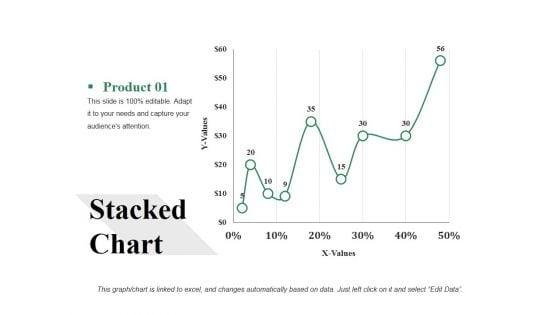
Stacked Chart Ppt PowerPoint Presentation Gallery Infographic Template
This is a stacked chart ppt powerpoint presentation gallery infographic template. This is a one stage process. The stages in this process are stacked chart, finance, analysis, marketing, business.
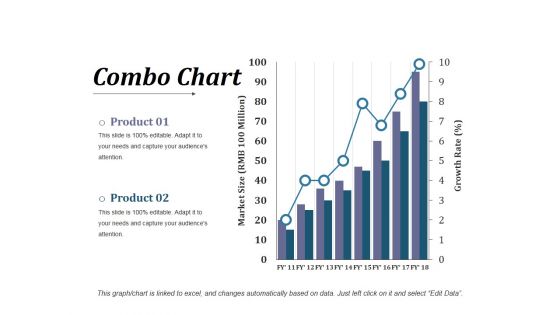
Combo Chart Ppt PowerPoint Presentation Infographic Template Visuals
This is a combo chart ppt powerpoint presentation infographic template visuals. This is a three stage process. The stages in this process are business, finance, strategy, analysis, combo chart.
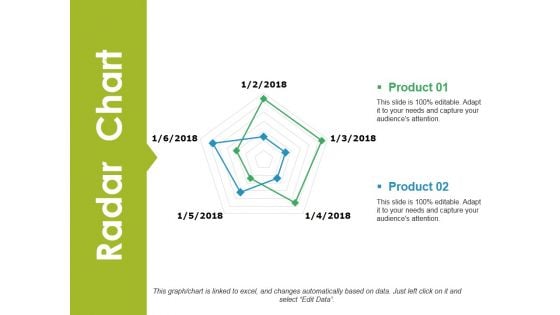
Radar Chart Ppt PowerPoint Presentation Infographic Template Tips
This is a radar chart ppt powerpoint presentation infographic template tips. This is a two stage process. The stages in this process are radar chart, business, finance, analysis, strategy.
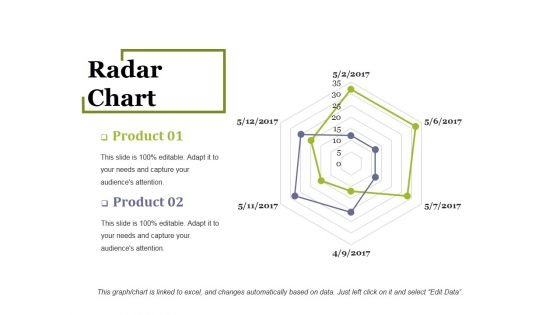
Radar Chart Ppt PowerPoint Presentation Infographic Template Outline
This is a radar chart ppt powerpoint presentation infographic template outline. This is a two stage process. The stages in this process are radar chart, finance, analysis, management, business.
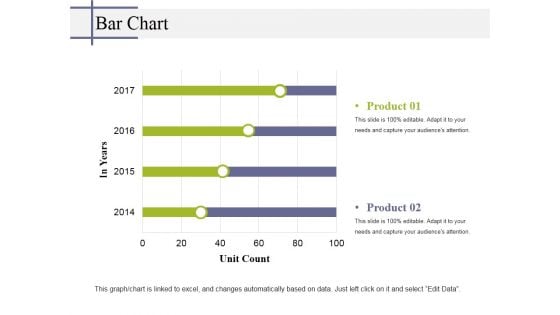
Bar Chart Ppt PowerPoint Presentation Infographic Template Tips
This is a bar chart ppt powerpoint presentation infographic template tips. This is a two stage process. The stages in this process are bar chart, finance, marketing, strategy, business.
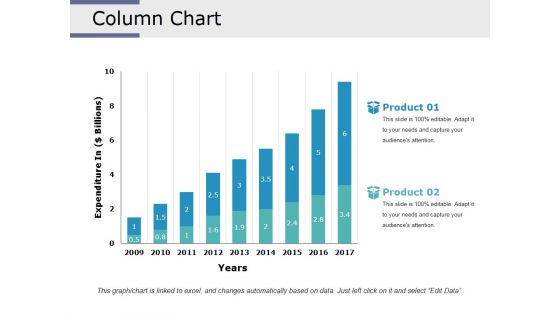
Column Chart Ppt PowerPoint Presentation Infographic Template Designs Download
This is a column chart ppt powerpoint presentation infographic template designs download. This is a two stage process. The stages in this process are column chart, analysis, finance, marketing, strategy, business.
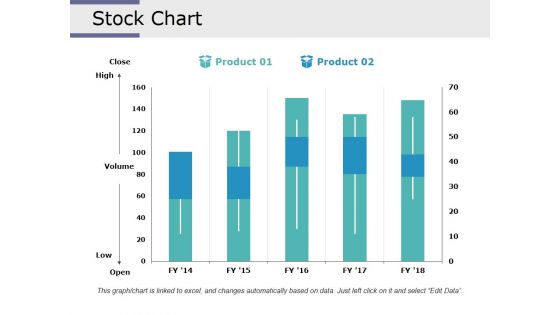
Stock Chart Ppt PowerPoint Presentation Infographic Template Design Inspiration
This is a stock chart ppt powerpoint presentation infographic template design inspiration. This is a two stage process. The stages in this process are stock chart, finance, analysis, business, marketing.
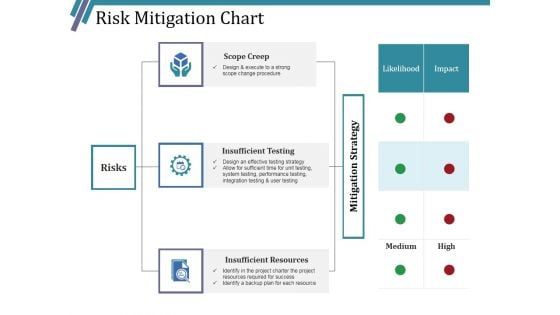
Risk Mitigation Chart Ppt PowerPoint Presentation Infographic Template Layouts
This is a risk mitigation chart ppt powerpoint presentation infographic template layouts. This is a three stage process. The stages in this process are scope creep, insufficient testing, insufficient resources, risks.
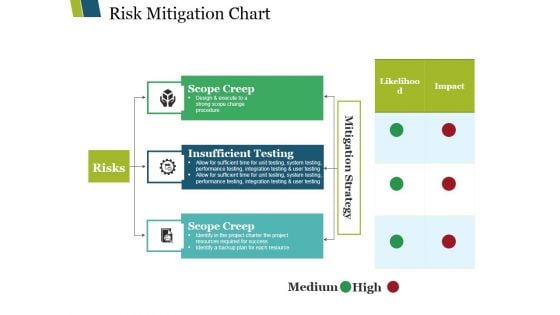
Risk Mitigation Chart Ppt PowerPoint Presentation Infographic Template Elements
This is a risk mitigation chart ppt powerpoint presentation infographic template elements. This is a three stage process. The stages in this process are scope creep, insufficient testing, insufficient resources, risks.
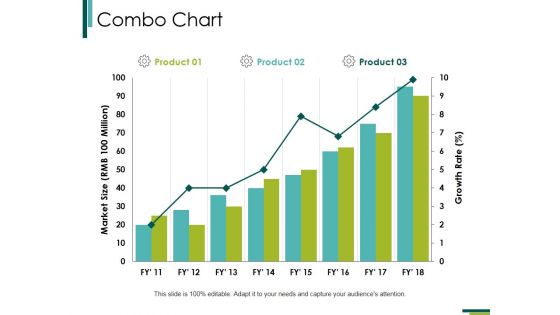
Combo Chart Ppt PowerPoint Presentation Infographic Template Slide Portrait
This is a combo chart ppt powerpoint presentation infographic template slide portrait. This is a three stage process. The stages in this process are combo chart, finance, marketing, strategy, business, growth.
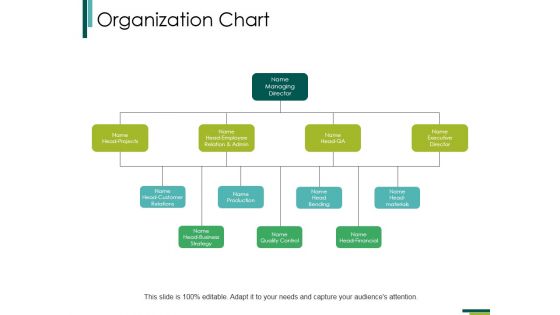
Organization Chart Ppt PowerPoint Presentation Infographic Template Files
This is a organization chart ppt powerpoint presentation infographic template files. This is a four stage process. The stages in this process are managing director, head projects, head business strategy, quality control.
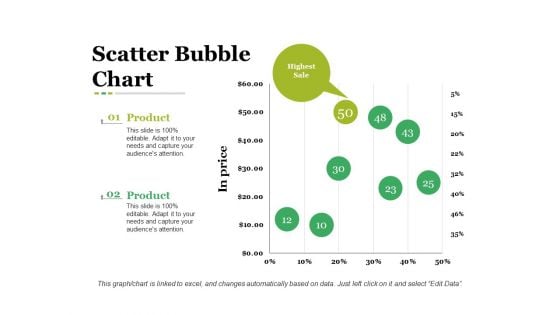
Scatter Bubble Chart Ppt PowerPoint Presentation Infographic Template Graphic Images
This is a scatter bubble chart ppt powerpoint presentation infographic template graphic images. This is a two stage process. The stages in this process are business, in price, bubble chart, marketing, strategy.
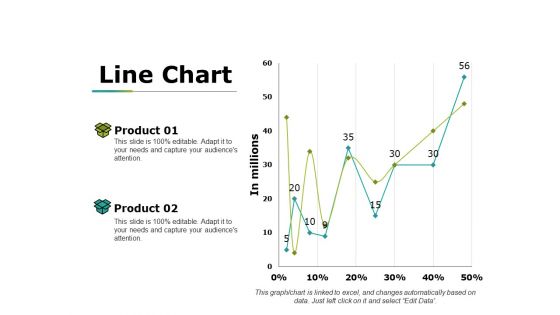
Line Chart Ppt PowerPoint Presentation Infographic Template Design Ideas
This is a line chart ppt powerpoint presentation infographic template design ideas. This is a two stage process. The stages in this process are product, in millions, percentage, line chart, success.
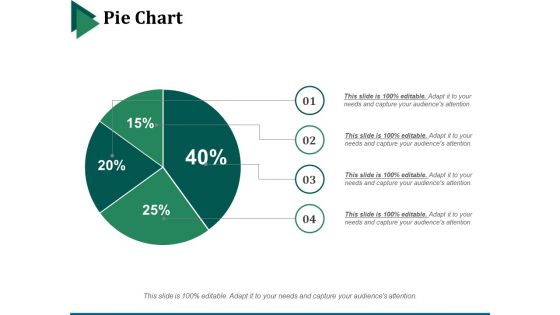
Pie Chart Ppt PowerPoint Presentation Infographic Template Backgrounds
This is a pie chart ppt powerpoint presentation infographic template backgrounds. This is a four stage process. The stages in this process are pie chart, marketing, strategy, finance, analysis.
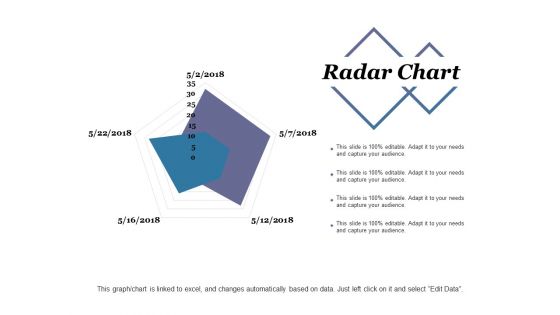
Radar Chart Ppt PowerPoint Presentation Infographic Template Sample
This is a radar chart ppt powerpoint presentation infographic template sample. This is a two stage process. The stages in this process are radar chart, finance, marketing, strategy, analysis.
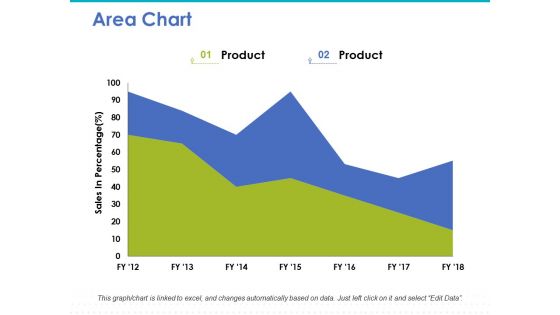
Area Chart Ppt PowerPoint Presentation Infographic Template Inspiration
This is a area chart ppt powerpoint presentation infographic template inspiration. This is a two stage process. The stages in this process are area chart, marketing, strategy, finance, planning.
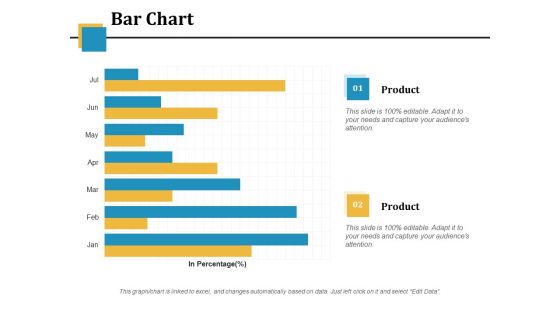
Bar Chart Ppt PowerPoint Presentation Infographic Template Picture
This is a bar chart ppt powerpoint presentation infographic template picture. This is a two stage process. The stages in this process are financial, in percentage, business, marketing, bar chart.
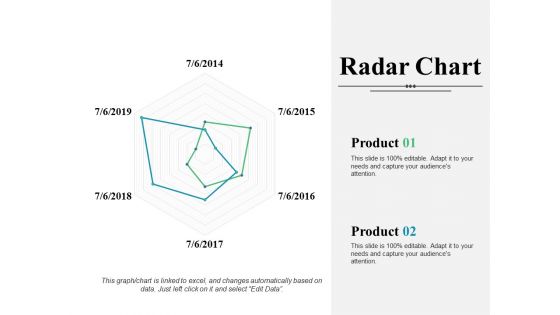
Radar Chart Ppt PowerPoint Presentation Infographic Template Introduction
This is a radar chart ppt powerpoint presentation infographic template introduction. This is a two stage process. The stages in this process are radar chart, finance, marketing, strategy, analysis, business.

Area Chart Ppt PowerPoint Presentation Infographic Template Designs
This is a area chart ppt powerpoint presentation infographic template designs. This is a two stage process. The stages in this process are area chart, finance, marketing, strategy, business.
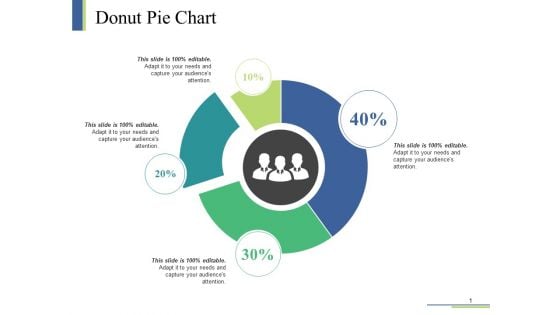
Donut Pie Chart Ppt PowerPoint Presentation Visual Aids Infographic Template
This is a donut pie chart ppt powerpoint presentation visual aids infographic template. This is a four stage process. The stages in this process are donut pie chart, finance, planning, management, marketing.
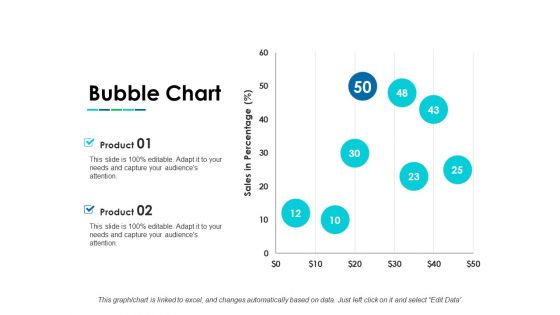
Bubble Chart Ppt PowerPoint Presentation Infographic Template Layouts
This is a bubble chart ppt powerpoint presentation infographic template layouts. This is a two stage process. The stages in this process are bubble chart, product, sales in percentage, growth.
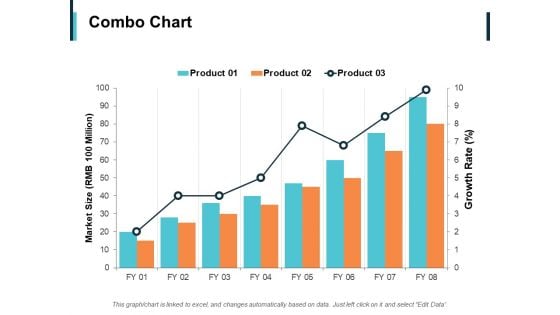
Combo Chart Finance Ppt PowerPoint Presentation Infographic Template Outline
This is a combo chart finance ppt powerpoint presentation infographic template outline. This is a three stage process. The stages in this process are combo chart, finance, analysis, business, investment.
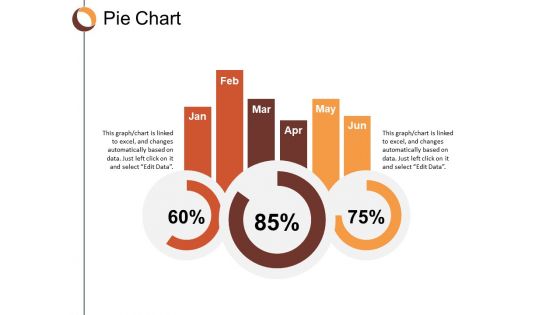
Pie Chart Finance Ppt Powerpoint Presentation Infographic Template Clipart
This is a pie chart finance ppt powerpoint presentation infographic template clipart. This is a three stage process. The stages in this process are pie chart, finance, marketing, business, analysis.

Area Chart Product Percentage Ppt PowerPoint Presentation Infographic Template Slide
This is a area chart product percentage ppt powerpoint presentation infographic template slide. This is a four stage process. The stages in this process are area chart, finance, marketing, management, investment.
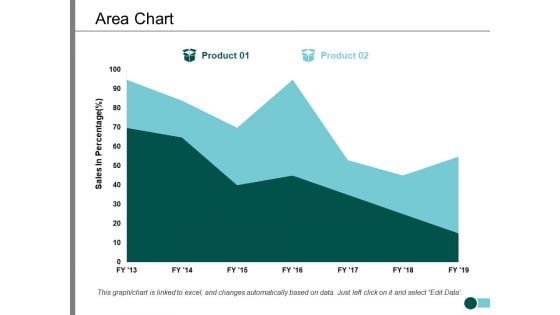
Area Chart Percentage Product Ppt PowerPoint Presentation Infographic Template Slide
This is a area chart percentage product ppt powerpoint presentation infographic template slide. This is a two stage process. The stages in this process are area chart, finance, marketing, management, investment.
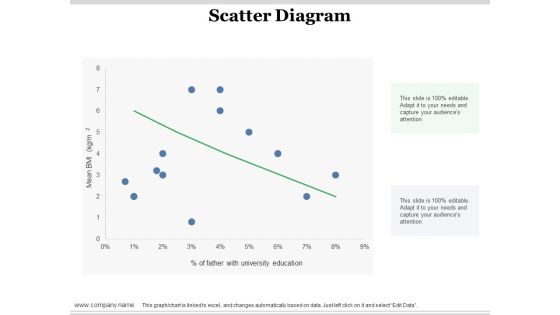
Scatter Diagram Ppt PowerPoint Presentation Infographic Template Design Ideas
This is a scatter diagram ppt powerpoint presentation infographic template design ideas. This is a one stage process. The stages in this process are scatter diagram, finance, in percentage, business, bar graph.
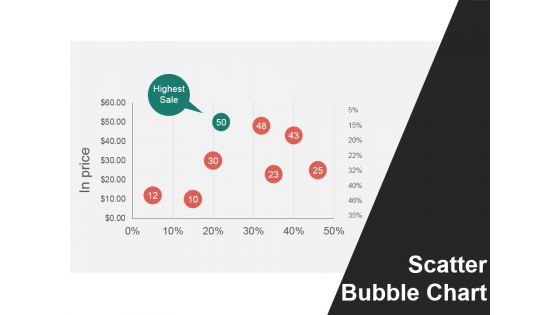
Scatter Bubble Chart Ppt PowerPoint Presentation Show Infographic Template
This is a scatter bubble chart ppt powerpoint presentation show infographic template. This is a six stage process. The stages in this process are in price, scatter bubble chart, highest sale.
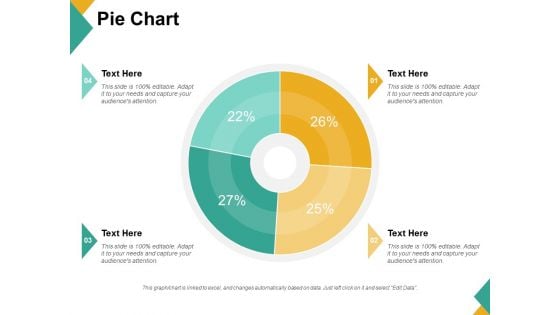
Pie Chart Ppt PowerPoint Presentation Infographic Template Graphics Example
This is a pie chart ppt powerpoint presentation infographic template graphics example. This is a four stage process. The stages in this process are pie chart, finance, marketing, strategy, business.
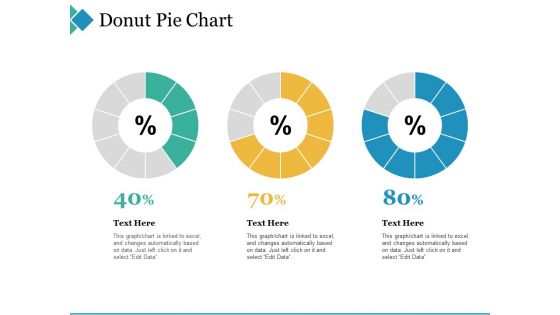
Donut Pie Chart Ppt PowerPoint Presentation Infographic Template Example 2015
This is a donut pie chart ppt powerpoint presentation infographic template example 2015. This is a three stage process. The stages in this process are donut pie chart, finance, marketing, strategy, business.
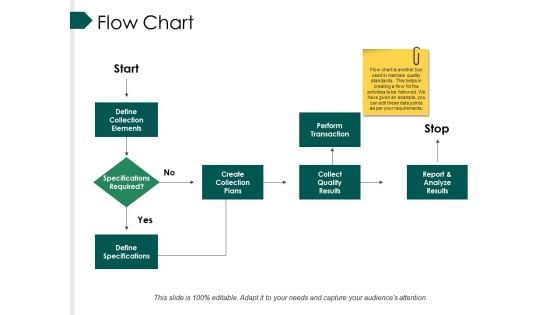
Flow Chart Ppt PowerPoint Presentation Infographic Template Mockup
This is a flow chart ppt powerpoint presentation infographic template mockup. This is a four stage process. The stages in this process are define collection elements, create collection plans, perform, transaction, collect quality results.
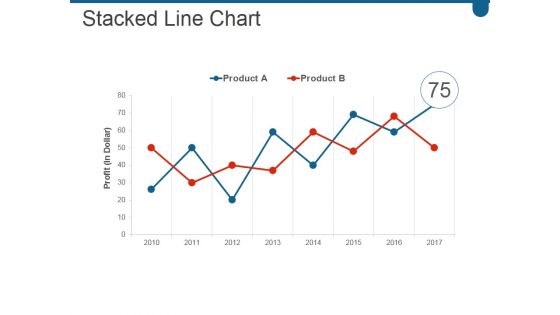
Stacked Line Chart Ppt PowerPoint Presentation Infographic Template Show
This is a stacked line chart ppt powerpoint presentation infographic template show. This is a two stage process. The stages in this process are business, marketing, growth, success, line.
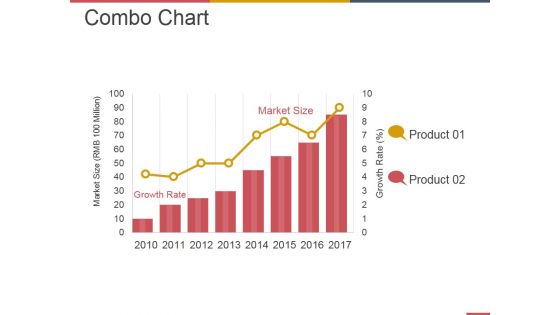
Combo Chart Ppt PowerPoint Presentation Infographic Template Deck
This is a combo chart ppt powerpoint presentation infographic template deck. This is a eight stage process. The stages in this process are business, strategy, marketing, analysis, growth strategy, market size.

Combo Chart Ppt PowerPoint Presentation Infographic Template Influencers
This is a combo chart ppt powerpoint presentation infographic template influencers. This is a three stage process. The stages in this process are market size rmb million, growth rate.
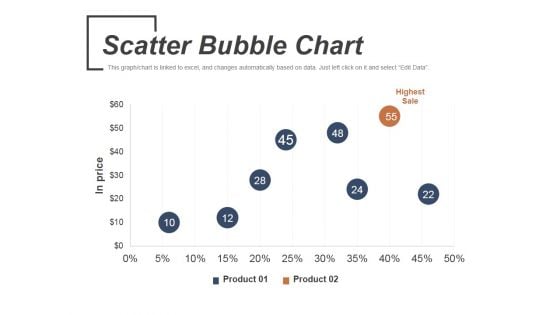
Scatter Bubble Chart Ppt PowerPoint Presentation Infographic Template Graphics
This is a scatter bubble chart ppt powerpoint presentation infographic template graphics. This is a two stage process. The stages in this process are highest sale, product, in price.
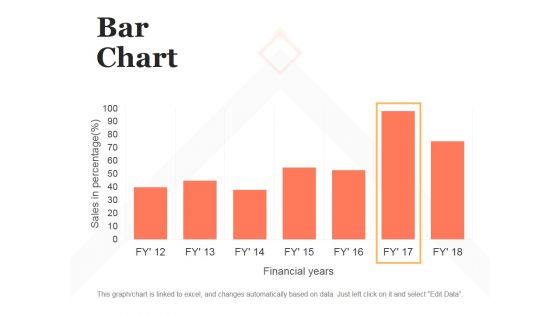
Bar Chart Ppt PowerPoint Presentation Infographic Template Brochure
This is a bar chart ppt powerpoint presentation infographic template brochure. This is a seven stage process. The stages in this process are bar graph, finance, marketing, strategy, analysis, business.
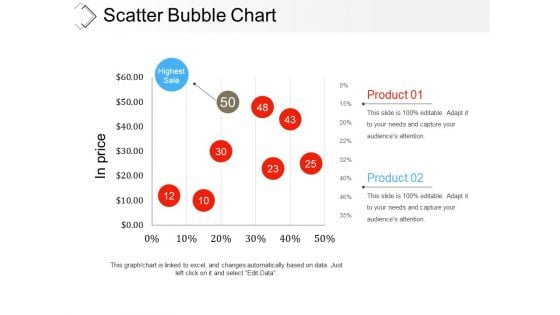
Scatter Bubble Chart Ppt PowerPoint Presentation Infographic Template Examples
This is a scatter bubble chart ppt powerpoint presentation infographic template examples. This is a two stage process. The stages in this process are highest sale, product, in price, finance, business.
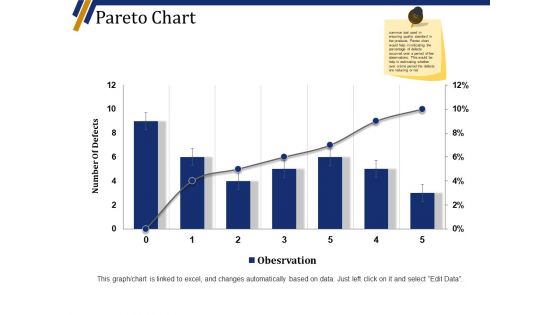
Pareto Chart Ppt PowerPoint Presentation File Infographic Template
This is a pareto chart ppt powerpoint presentation file infographic template. This is a six stage process. The stages in this process are number of defects, business, marketing, graph.
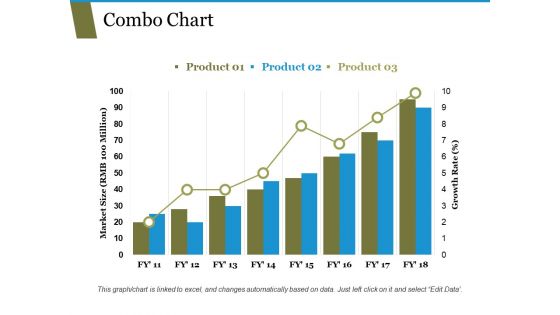
Combo Chart Ppt PowerPoint Presentation Ideas Infographic Template
This is a combo chart ppt powerpoint presentation ideas infographic template. This is a three stage process. The stages in this process are market size growth rate, graph, business, strategy.
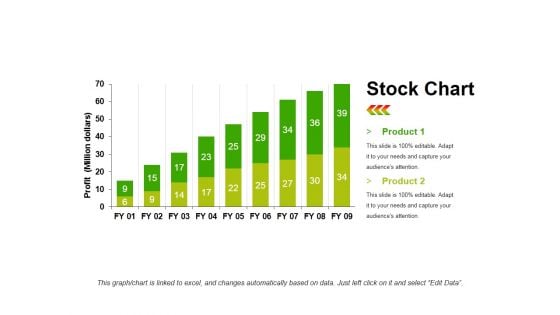
Stock Chart Template 1 Ppt PowerPoint Presentation Infographic Template Objects
This is a stock chart template 1 ppt powerpoint presentation infographic template objects. This is a two stage process. The stages in this process are product, profit, bar graph, growth, success.
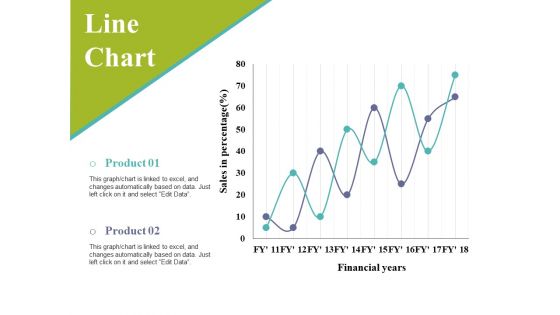
Line Chart Ppt PowerPoint Presentation Infographic Template Slides
This is a line chart ppt powerpoint presentation infographic template slides. This is a two stage process. The stages in this process are sales in percentage, financial years, business, marketing, graph.
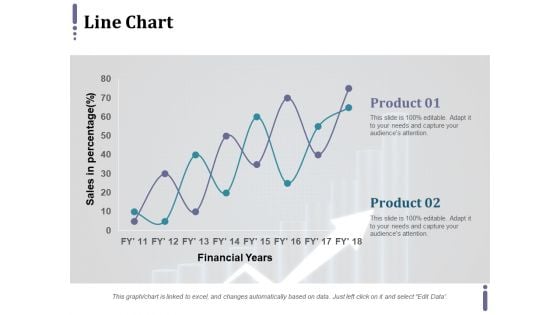
Line Chart Ppt PowerPoint Presentation Infographic Template Master Slide
This is a line chart ppt powerpoint presentation infographic template master slide. This is a two stage process. The stages in this process are product, financial years, sales in percentage.
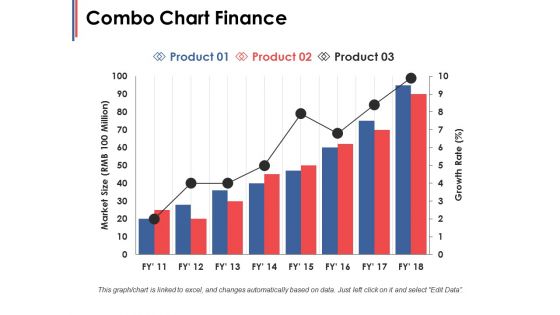
Combo Chart Finance Ppt PowerPoint Presentation Infographic Template Microsoft
This is a combo chart finance ppt powerpoint presentation infographic template microsoft. This is a three stage process. The stages in this process are finance, marketing, management, investment, analysis.
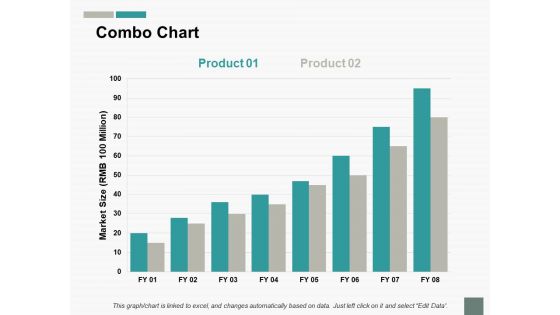
Combo Chart Finance Ppt PowerPoint Presentation Infographic Template Graphics
This is a combo chart finance ppt powerpoint presentation infographic template graphics. This is a two stage process. The stages in this process are growth, finance, marketing, management, investment.
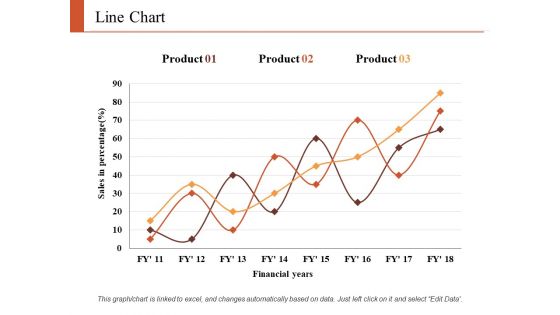
Line Chart Finance Ppt PowerPoint Presentation Infographic Template Graphics Tutorials
This is a line chart finance ppt powerpoint presentation infographic template graphics tutorials. This is a three stage process. The stages in this process are finance, marketing, analysis, business, investment.
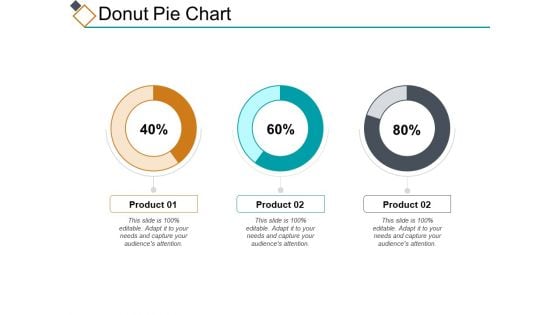
Donut Pie Chart Ppt PowerPoint Presentation Infographic Template Slides
This is a donut pie chart ppt powerpoint presentation infographic template slides. This is a three stage process. The stages in this process are percentage, product, business, management, marketing.
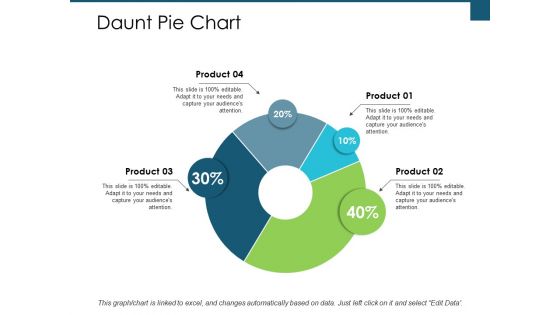
Daunt Pie Chart Investment Ppt PowerPoint Presentation Infographic Template Aids
This is a daunt pie chart investment ppt powerpoint presentation infographic template aids. This is a four stage process. The stages in this process are finance, analysis, business, investment, marketing.
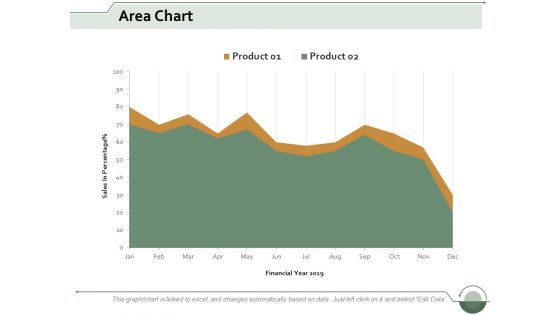
Area Chart Finance Ppt Powerpoint Presentation Infographic Template Clipart Images
This is a area chart finance ppt powerpoint presentation infographic template clipart images. This is a two stage process. The stages in this process are area bar, finance, marketing, management, analysis.
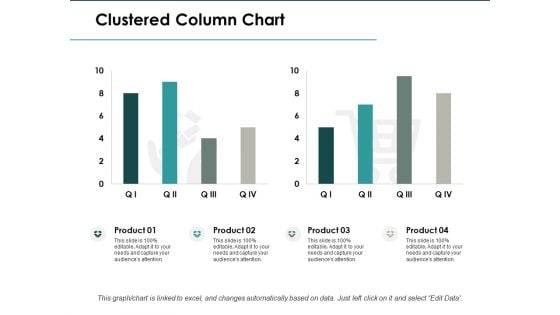
Clustered Column Chart Investment Ppt PowerPoint Presentation Infographic Template Clipart
This is a clustered column chart investment ppt powerpoint presentation infographic template clipart. This is a four stage process. The stages in this process are finance, analysis, business, investment, marketing.
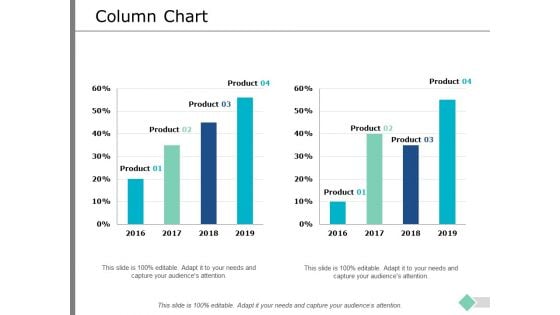
Column Chart Marketing Finance Ppt PowerPoint Presentation Infographic Template Rules
This is a column chart marketing finance ppt powerpoint presentation infographic template rules. This is a two stage process. The stages in this process are finance, analysis, business, investment, marketing.
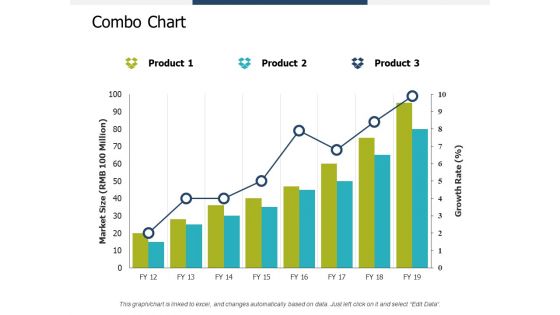
Combo Chart Investment Ppt PowerPoint Presentation Summary Infographic Template
This is a combo chart investment ppt powerpoint presentation summary infographic template. This is a three stage process. The stages in this process are finance, analysis, business, investment, marketing.
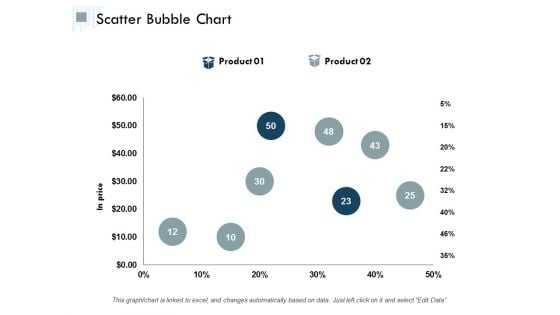
Scatter Bubble Chart Ppt PowerPoint Presentation Infographic Template Graphics Design
This is a scatter bubble chart ppt powerpoint presentation infographic template graphics design. This is a two stage process. The stages in this process are finance, analysis, business, investment, marketing.
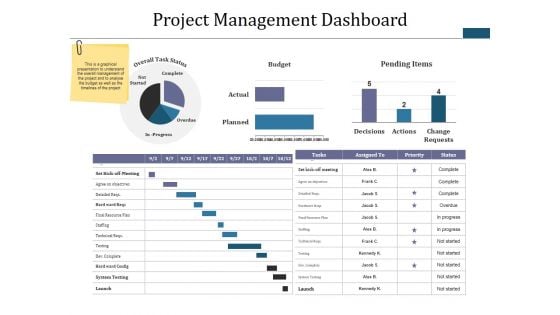
Project Management Dashboard Ppt PowerPoint Presentation Infographic Template Diagrams
This is a project management dashboard ppt powerpoint presentation infographic template diagrams. This is a three stage process. The stages in this process are budget, pending items, complete, overdue, not started.
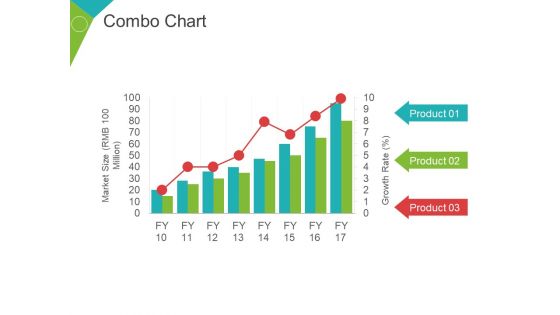
Combo Chart Ppt PowerPoint Presentation Infographic Template Graphic Images
This is a combo chart ppt powerpoint presentation infographic template graphic images. This is a three stage process. The stages in this process are market size, growth rate, percentage, business, marketing.
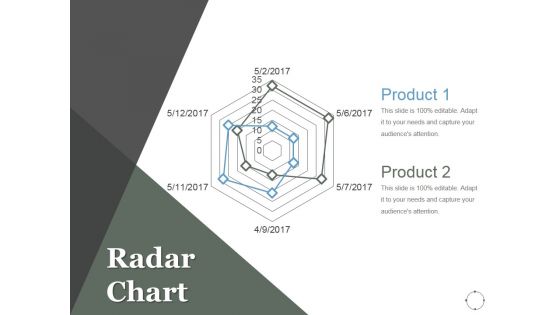
Radar Chart Ppt PowerPoint Presentation Layouts Infographic Template
This is a radar chart ppt powerpoint presentation layouts infographic template. This is a two stage process. The stages in this process are business, marketing, product, radar chart, strategy.
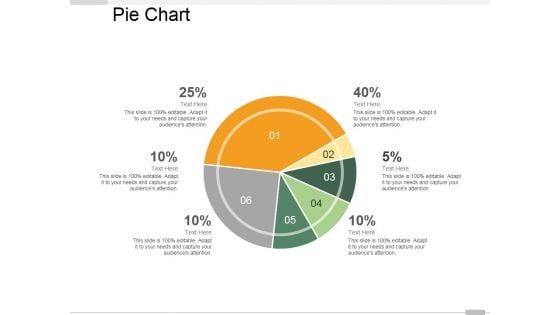
Pie Chart Ppt PowerPoint Presentation Infographic Template Master Slide
This is a pie chart ppt powerpoint presentation infographic template master slide. This is a six stage process. The stages in this process are pie chart, marketing, finance, analysis, business.

Pie Chart Ppt PowerPoint Presentation Infographic Template Example 2015
This is a pie chart ppt powerpoint presentation infographic template example 2015. This is a five stage process. The stages in this process are pie chart, finance, marketing, strategy, business.

 Home
Home