Infographic Icons
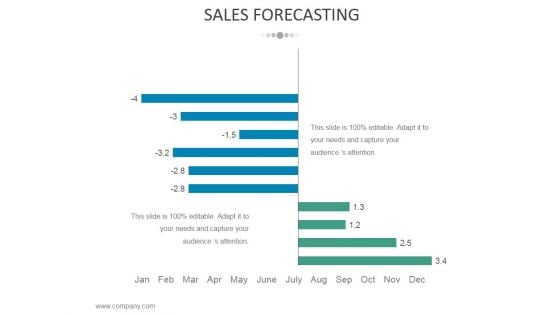
Sales Forecasting Template 1 Ppt PowerPoint Presentation Infographic Template Maker
This is a sales forecasting template 1 ppt powerpoint presentation infographic template maker. This is a two stage process. The stages in this process are business, strategy, marketing, analysis, finance.
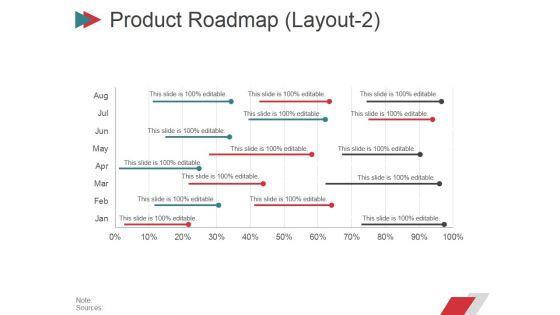
Product Roadmap Layout2 Ppt PowerPoint Presentation Infographic Template Clipart
This is a product roadmap layout2 ppt powerpoint presentation infographic template clipart. This is a five stage process. The stages in this process are business, marketing, graph, finance, planning.
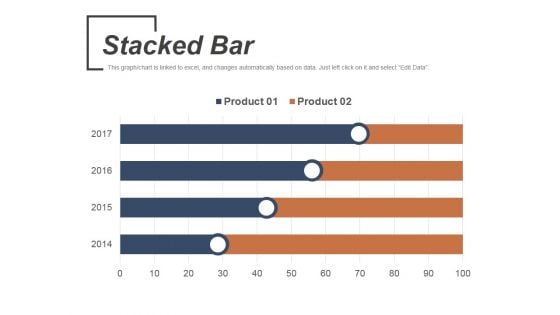
Stacked Bar Template 1 Ppt PowerPoint Presentation Infographic Template Format
This is a stacked bar template 1 ppt powerpoint presentation infographic template format. This is a four stage process. The stages in this process are product, stacked bar, business, marketing, bar graph.
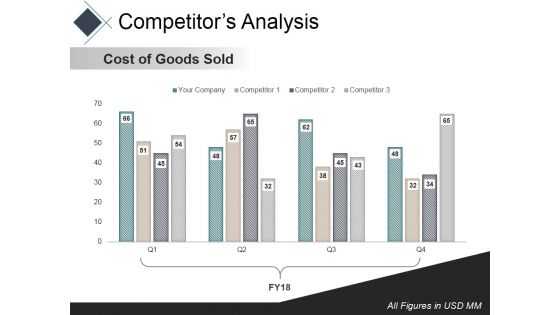
Competitors Analysis Template Ppt PowerPoint Presentation Infographic Template Rules
This is a competitors analysis template ppt powerpoint presentation infographic template rules. This is a four stage process. The stages in this process are net profit margin, finance, marketing, bar, success.
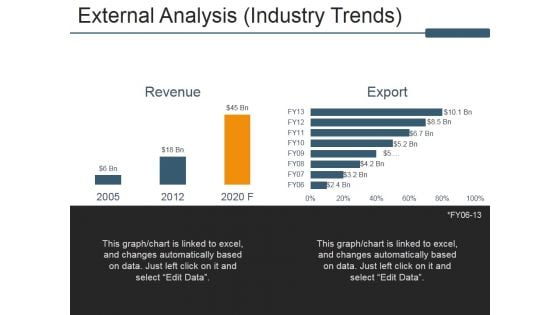
External Analysis Industry Trends Ppt PowerPoint Presentation Infographic Template Summary
This is a external analysis industry trends ppt powerpoint presentation infographic template summary. This is a two stage process. The stages in this process are revenue, export, external analysis, business, marketing.
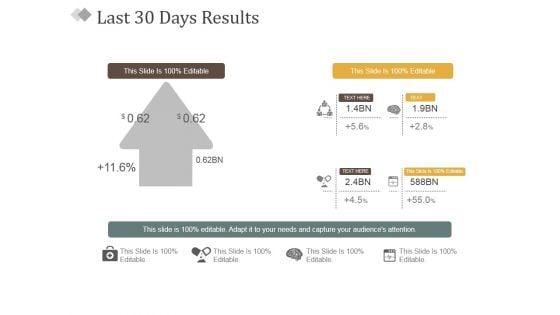
Last 30 Days Results Ppt PowerPoint Presentation Infographic Template Example
This is a last 30 days results ppt powerpoint presentation infographic template example. This is a two stage process. The stages in this process are results, business, presentation, marketing, success.
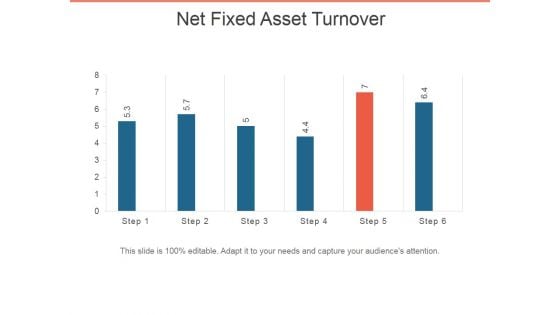
Net Fixed Asset Turnover Ppt PowerPoint Presentation Infographic Template Pictures
This is a net fixed asset turnover ppt powerpoint presentation infographic template pictures. This is a six stage process. The stages in this process are bar graph, business, marketing, presentation, success.
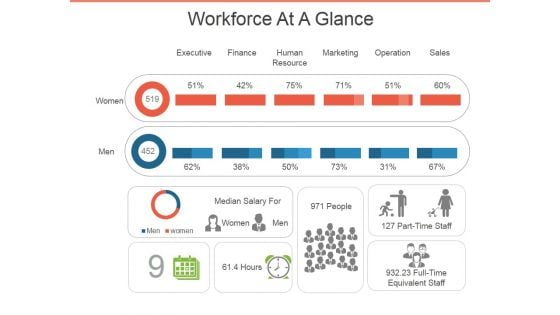
Workforce At A Glance Ppt PowerPoint Presentation Infographic Template Topics
This is a workforce at a glance ppt powerpoint presentation infographic template topics. This is a eight stage process. The stages in this process are executive, finance, human resource, marketing, operation, sales.
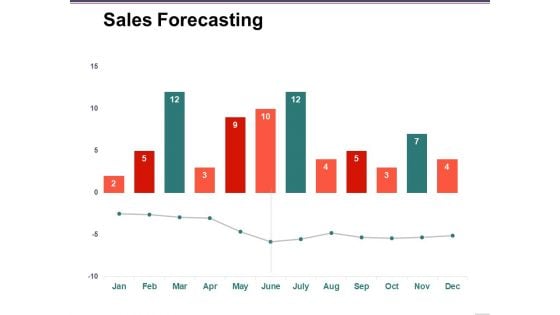
Sales Forecasting Template 2 Ppt PowerPoint Presentation Infographic Template Examples
This is a sales forecasting template 2 ppt powerpoint presentation infographic template examples. This is a two stage process. The stages in this process are forecasting, business, marketing, finance, graph.
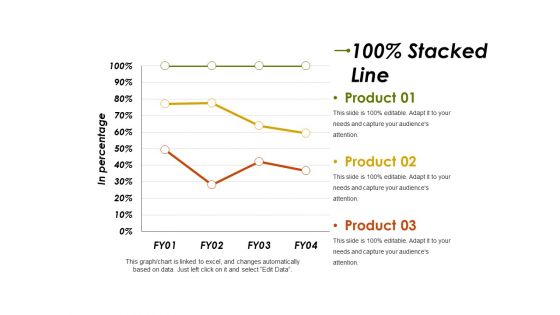
Stacked Line Ppt PowerPoint Presentation Infographic Template Graphics Template
This is a stacked line ppt powerpoint presentation infographic template graphics template. This is a three stage process. The stages in this process are product, in percentage, business, marketing, finance.
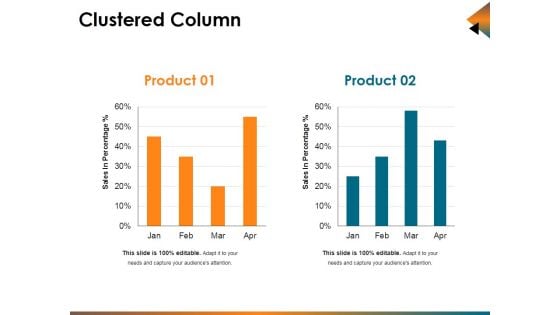
Clustered Column Ppt PowerPoint Presentation Infographic Template Background Designs
This is a clustered column ppt powerpoint presentation infographic template background designs. This is a two stage process. The stages in this process are sales in percentage, bar, business, marketing, planning.
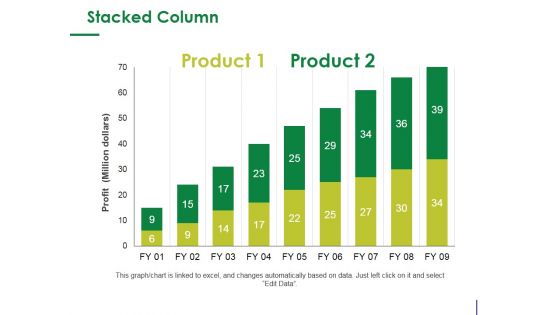
Stacked Column Ppt PowerPoint Presentation Infographic Template Design Ideas
This is a stacked column ppt powerpoint presentation infographic template design ideas. This is a two stage process. The stages in this process are product, profit, bar graph, growth, success.
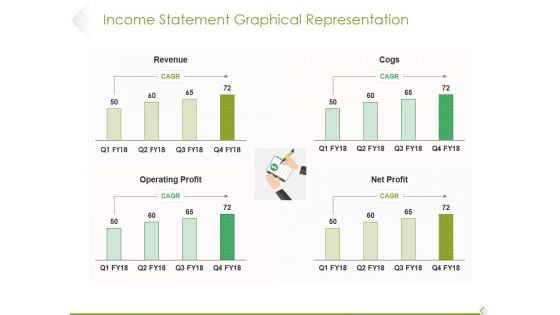
Income Statement Graphical Representation Ppt PowerPoint Presentation Infographic Template Influencers
This is a income statement graphical representation ppt powerpoint presentation infographic template influencers. This is a four stage process. The stages in this process are revenue, cogs, operating profit, profit.
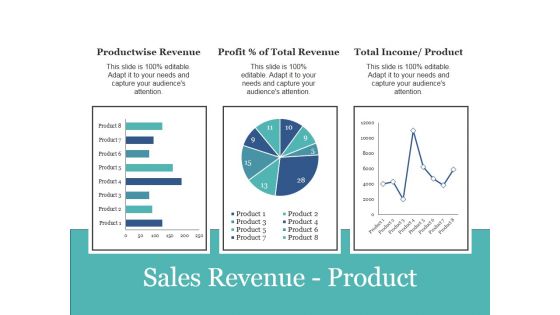
Sales Revenue Product Ppt PowerPoint Presentation Infographic Template Backgrounds
This is a sales revenue product ppt powerpoint presentation infographic template backgrounds. This is a three stage process. The stages in this process are product wise revenue, profit percent of total revenue, total income product.
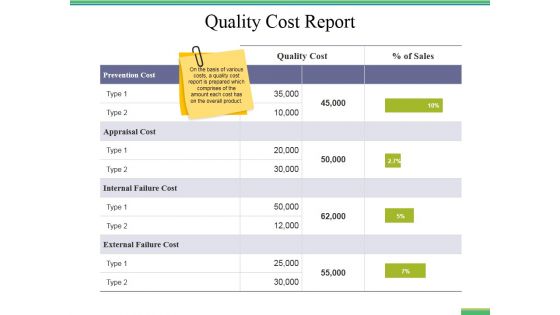
Quality Cost Report Ppt PowerPoint Presentation Styles Infographic Template
This is a quality cost report ppt powerpoint presentation styles infographic template. This is a five stage process. The stages in this process are business, finance, marketing, strategy, bar graph, analysis.
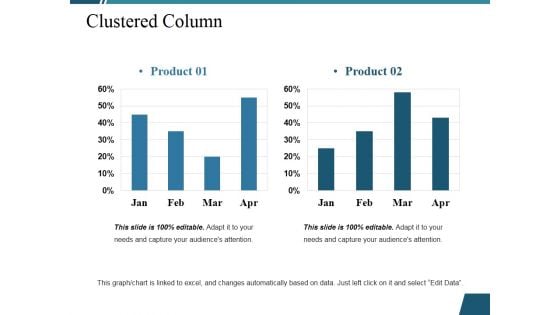
Clustered Column Ppt PowerPoint Presentation Infographic Template Slide Portrait
This is a clustered column ppt powerpoint presentation infographic template slide portrait. This is a two stage process. The stages in this process are clustered column, finance, marketing, strategy, analysis, business.
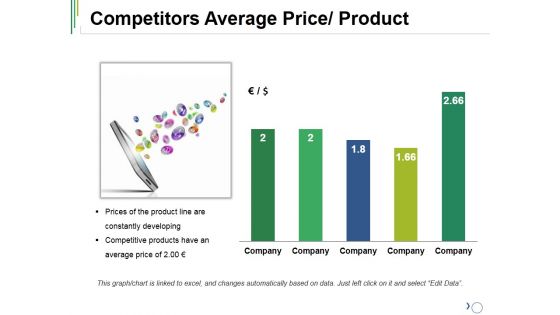
Competitors Average Price Product Ppt PowerPoint Presentation Layouts Infographic Template
This is a competitors average price product ppt powerpoint presentation layouts infographic template. This is a five stage process. The stages in this process are company, bar graph, success, growth, business.
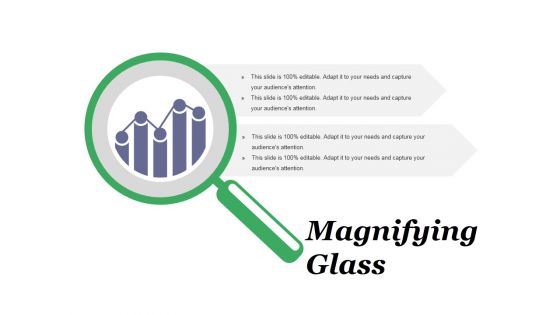
Magnifying Glass Ppt PowerPoint Presentation Infographic Template Example File
This is a magnifying glass ppt powerpoint presentation infographic template example file. This is a two stage process. The stages in this process are magnifying glass, gears, technology, marketing, strategy, business.
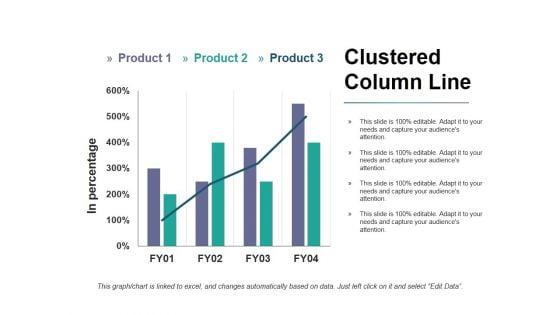
Clustered Column Line Ppt PowerPoint Presentation Infographic Template Pictures
This is a clustered column line ppt powerpoint presentation infographic template pictures. This is a three stage process. The stages in this process are product, in percentage, bar graph, growth, success.
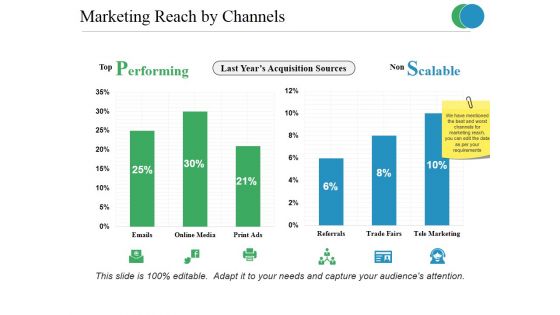
Marketing Reach By Channels Ppt PowerPoint Presentation Infographic Template Background
This is a marketing reach by channels ppt powerpoint presentation infographic template background. This is a two stage process. The stages in this process are performing, scalable, finance, marketing, strategy, business.
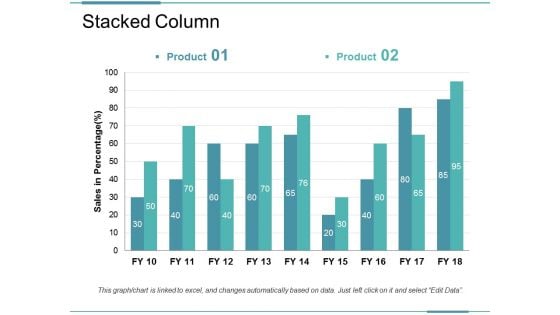
Stacked Column Ppt PowerPoint Presentation Infographic Template Example Introduction
This is a stacked column ppt powerpoint presentation infographic template example introduction. This is a two stage process. The stages in this process are business, marketing, strategy, planning, finance.
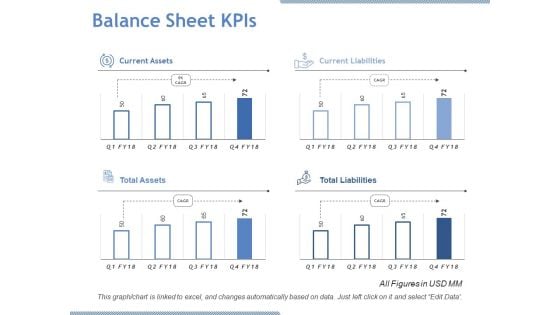
Balance Sheet Kpis Ppt PowerPoint Presentation Infographic Template Inspiration
This is a balance sheet kpis ppt powerpoint presentation infographic template inspiration. This is a four stage process. The stages in this process are current assets, current liabilities, total assets, total liabilities.
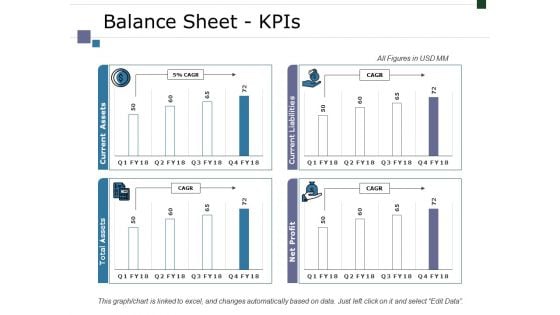
Balance Sheet Kpis Ppt PowerPoint Presentation Infographic Template Designs
This is a balance sheet kpis ppt powerpoint presentation infographic template designs. This is a four stage process. The stages in this process are business, marketing, finance, graph, strategy.
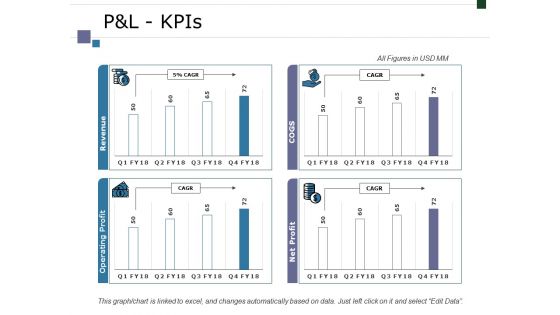
Pandl Kpis Ppt PowerPoint Presentation Infographic Template Graphics Tutorials
This is a pandl kpis ppt powerpoint presentation infographic template graphics tutorials. This is a four stage process. The stages in this process are business, marketing, finance, graph, strategy.
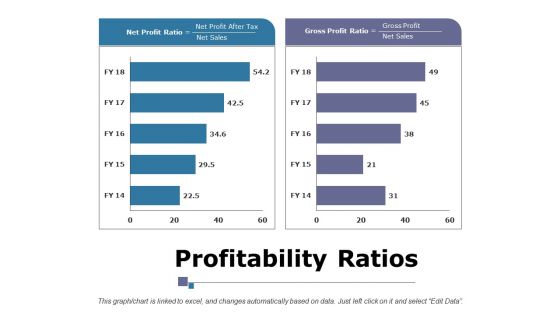
Profitability Ratios Ppt PowerPoint Presentation Infographic Template Portrait
This is a profitability ratios ppt powerpoint presentation infographic template portrait. This is a two stage process. The stages in this process are business, marketing, finance, net profit ratio, gross profit ratio.
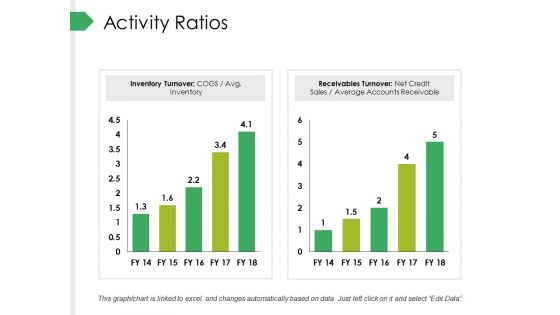
Activity Ratios Ppt PowerPoint Presentation Styles Infographic Template
This is a activity ratios ppt powerpoint presentation styles infographic template. This is a two stage process. The stages in this process are inventory turnover, receivables turnover, business, marketing, finance.
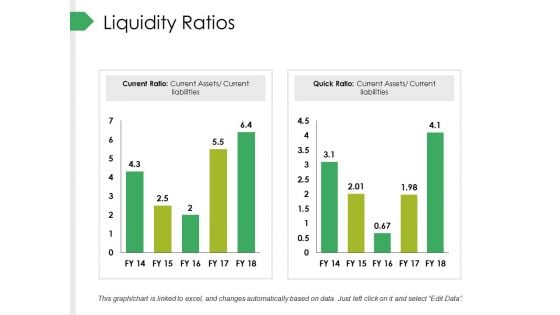
Liquidity Ratios Ppt PowerPoint Presentation Infographic Template Ideas
This is a liquidity ratios ppt powerpoint presentation infographic template ideas. This is a two stage process. The stages in this process are business, marketing, current ratio, quick ratio, finance.
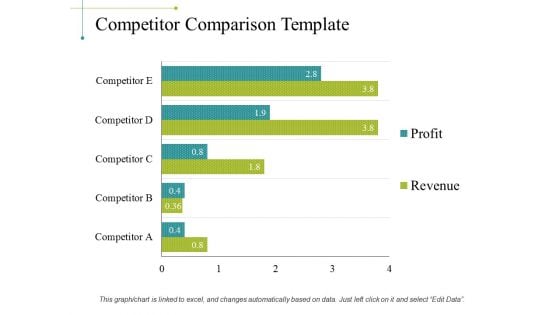
Competitor Comparison Template 1 Ppt PowerPoint Presentation Infographic Template Mockup
This is a competitor comparison template 1 ppt powerpoint presentation infographic template mockup. This is a five stage process. The stages in this process are business, marketing, graph, finance, strategy.
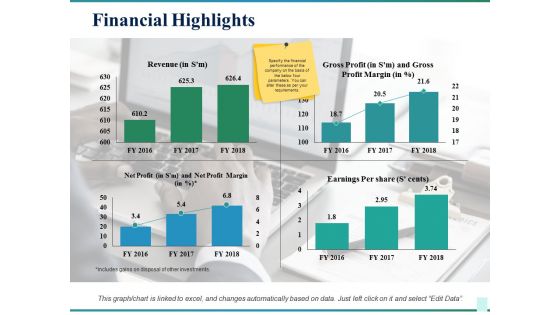
Financial Highlights Ppt PowerPoint Presentation Infographic Template Slide Download
This is a financial highlights ppt powerpoint presentation infographic template slide download. This is a four stage process. The stages in this process are business, revenue, gross profit, earnings per share, net profit, marketing.
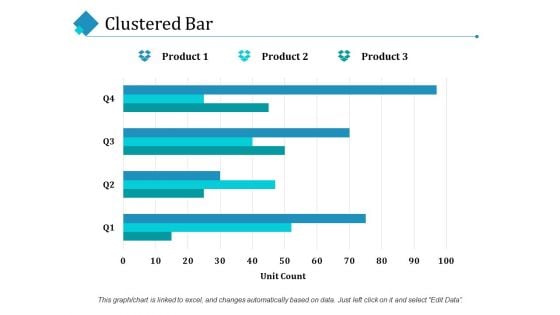
Clustered Bar Ppt PowerPoint Presentation Infographic Template Mockup
This is a clustered bar ppt powerpoint presentation infographic template mockup. This is a four stage process. The stages in this process are clustered bar, finance, marketing, planning, business.
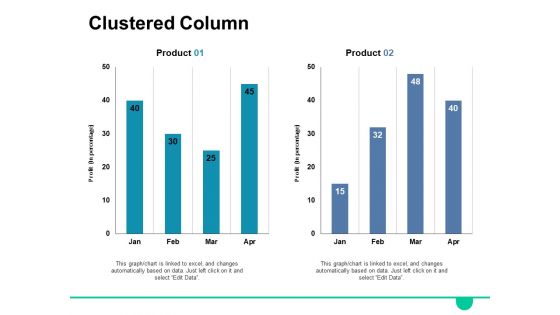
Clustered Column Ppt PowerPoint Presentation Infographic Template Background Images
This is a clustered column ppt powerpoint presentation infographic template background images. This is a eight stage process. The stages in this process are clustered column, finance, planning, marketing, strategy.
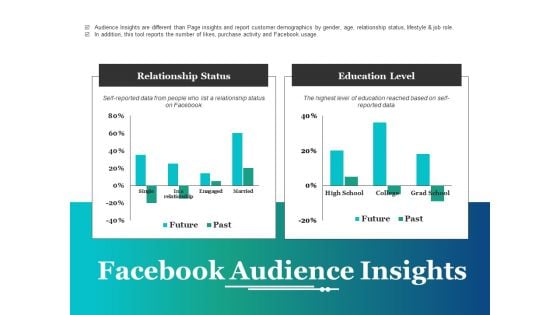
Facebook Audience Insights Ppt PowerPoint Presentation Outline Infographic Template
This is a facebook audience insights ppt powerpoint presentation outline infographic template. This is a two stage process. The stages in this process are facebook, relationship status, education level, future, past.
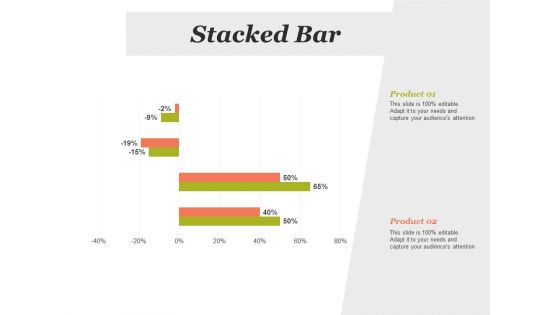
Stacked Bar Financial Analysis Ppt PowerPoint Presentation Infographic Template Slides
This is a stacked bar financial analysis ppt powerpoint presentation infographic template slides. This is a two stage process. The stages in this process are stacked bar, finance, marketing, strategy, analysis.
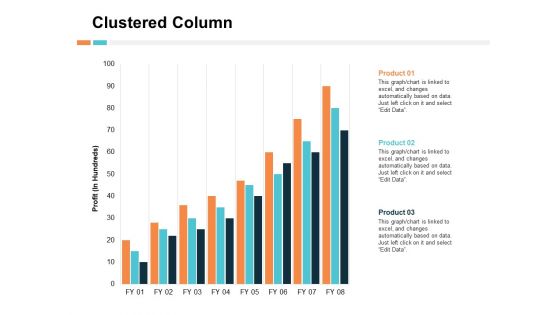
Clustered Column Product Ppt PowerPoint Presentation Outline Infographic Template
This is a clustered column product ppt powerpoint presentation outline infographic template. This is a three stage process. The stages in this process are product, percentage, business, management, marketing.
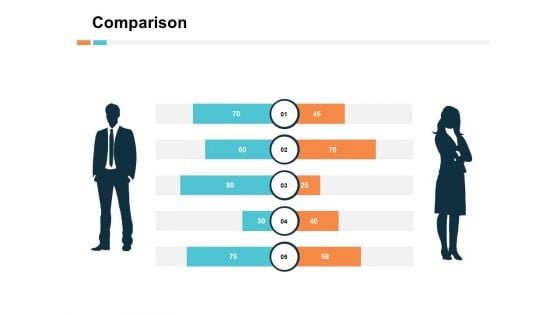
Comparison Male And Female Ppt PowerPoint Presentation Infographic Template Layouts
This is a comparison male and female ppt powerpoint presentation infographic template layouts. This is a five stage process. The stages in this process are business, management, marketing, compare.
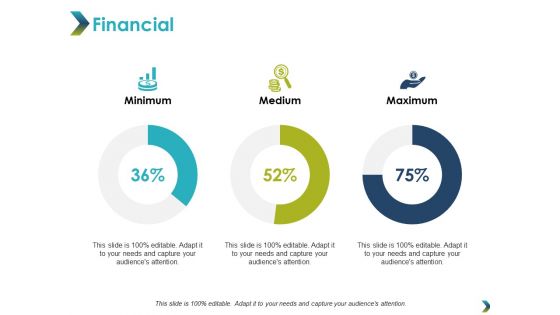
Financial Minimum Maximum Ppt PowerPoint Presentation Infographic Template Picture
This is a financial minimum maximum ppt powerpoint presentation infographic template picture. This is a three stage process. The stages in this process are financial, minimum, maximum, marketing, strategy.
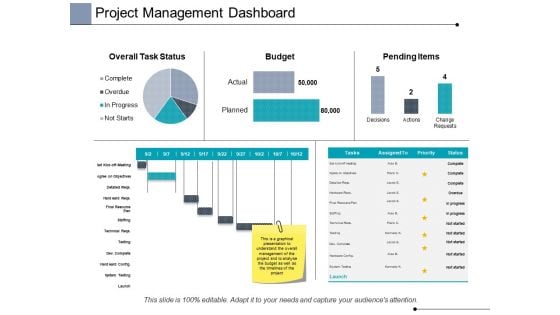
Project Management Dashboard Ppt PowerPoint Presentation Infographic Template Graphics
This is a project management dashboard ppt powerpoint presentation infographic template graphics. This is a three stage process. The stages in this process are finance, analysis, business, investment, marketing.
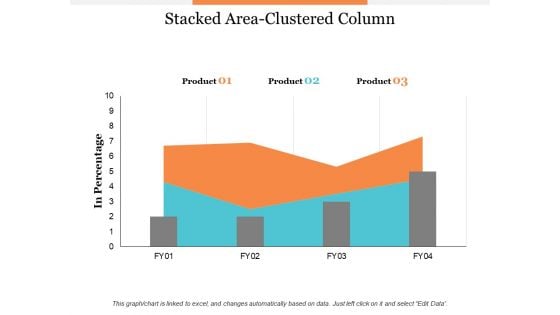
Stacked Area Clustered Column Ppt PowerPoint Presentation Infographic Template Summary
This is a stacked area clustered column ppt powerpoint presentation infographic template summary. This is a three stage process. The stages in this process are business, management, marketing, percentage, product.
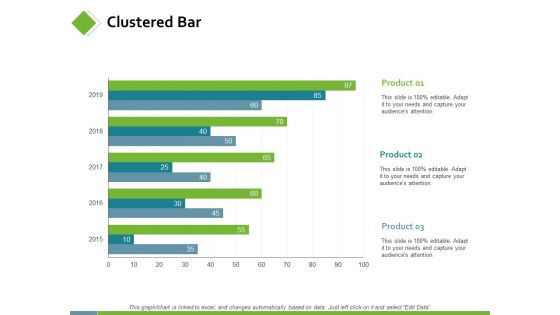
Clustered Bar Investment Planning Ppt PowerPoint Presentation Infographic Template Deck
This is a clustered bar investment planning ppt powerpoint presentation infographic template deck. This is a three stage process. The stages in this process are finance, analysis, business, investment, marketing.
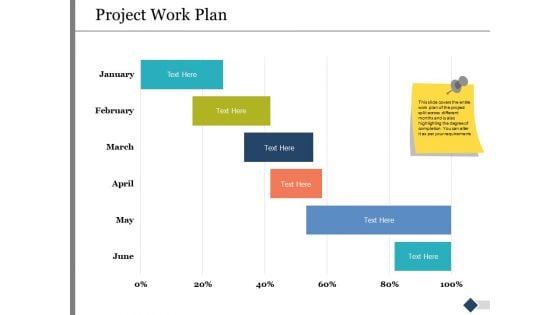
Project Work Plan Ppt PowerPoint Presentation Infographic Template Slides
This is a project work plan ppt powerpoint presentation infographic template slides. This is a six stage process. The stages in this process are finance, marketing, management, investment, analysis.
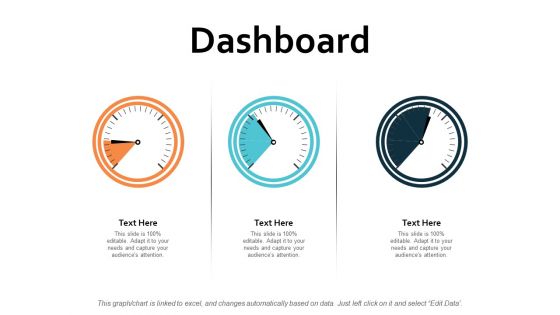
Dashboard Finance Ppt PowerPoint Presentation Infographic Template Graphic Tips
This is a dashboard finance ppt powerpoint presentation infographic template graphic tips. This is a three stage process. The stages in this process are dashboard, finance, analysis, business, investment.
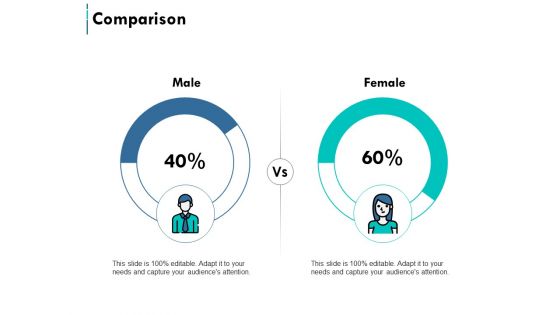
Comparison Male And Female Ppt PowerPoint Presentation Styles Infographic Template
This is a comparison male and female ppt powerpoint presentation styles infographic template. This is a two stage process. The stages in this process are business, management, marketing, comparison.
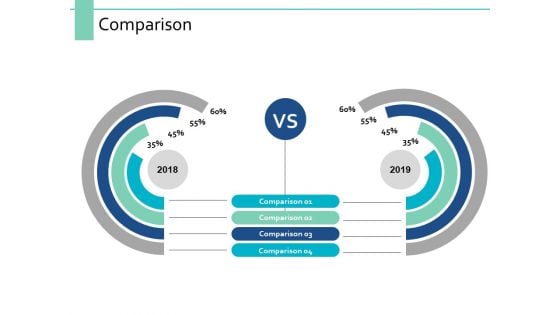
Comparison Marketing Strategy Ppt PowerPoint Presentation Infographic Template Example 2015
This is a comparison marketing strategy ppt powerpoint presentation infographic template example 2015. This is a two stage process. The stages in this process are finance, marketing, management, investment, analysis.
Icons Slide Implementing On Site Seo Strategy To Expand Customer Reach Infographics PDF
Introducing our well designed Icons Slide Implementing On Site Seo Strategy To Expand Customer Reach Infographics PDF set of slides. The slide displays editable icons to enhance your visual presentation. The icons can be edited easily. So customize according to your business to achieve a creative edge. Download and share it with your audience.
Icons Slide Guide To Creating A Project Stakeholder Engagement Plan Infographics PDF
Introducing our well designed Icons Slide Guide To Creating A Project Stakeholder Engagement Plan Infographics PDF set of slides. The slide displays editable icons to enhance your visual presentation. The icons can be edited easily. So customize according to your business to achieve a creative edge. Download and share it with your audience.

Improving Business Revenue Bar Graph Ppt PowerPoint Presentation Infographic Template
This is a improving business revenue bar graph ppt powerpoint presentation infographic template. This is a six stage process. The stages in this process are graph, arrow, finance, percentage, success.
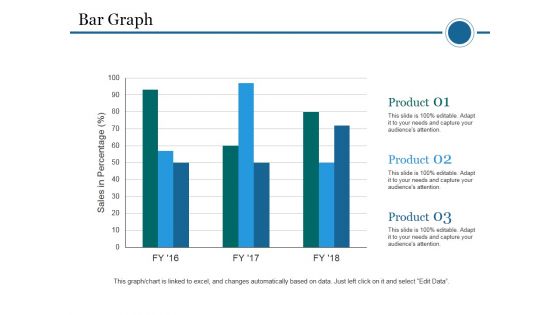
Bar Graph Ppt PowerPoint Presentation Infographic Template Template
This is a bar graph ppt powerpoint presentation infographic template template. This is a three stage process. The stages in this process are bar graph, sales in percentage, product, planning, business.
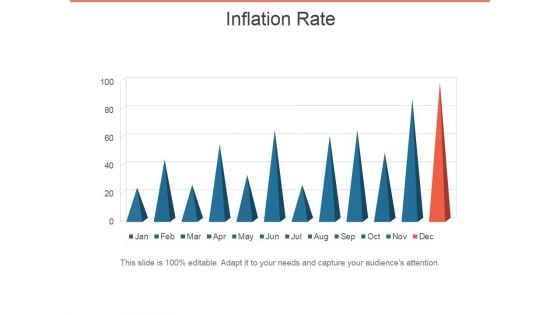
Inflation Rate Ppt PowerPoint Presentation Infographic Template Design Inspiration
This is a inflation rate ppt powerpoint presentation infographic template design inspiration. This is a twelve stage process. The stages in this process are inflation rate, process, business, marketing, success.
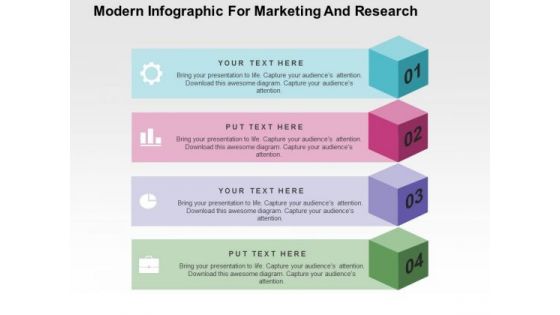
Modern Infographic For Marketing And Research PowerPoint Template
The above template displays modern infographic design. This diagram has been professionally designed to display marketing function and research. Grab centre stage with this slide. Capture the attention of your audience.
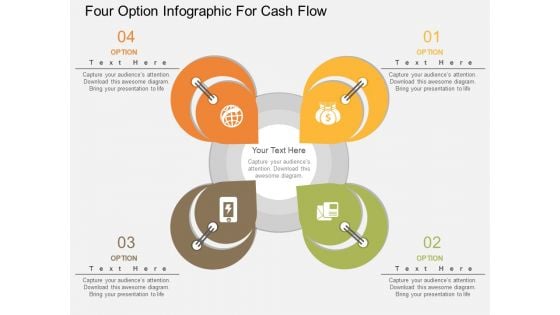
Four Option Infographic For Cash Flow Powerpoint Template
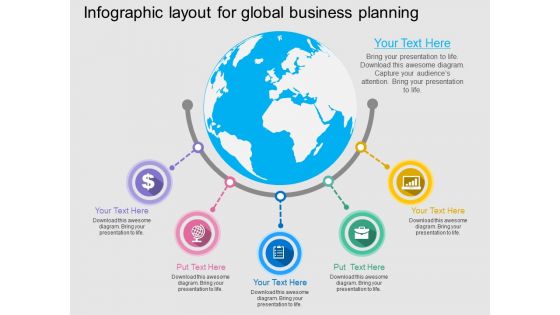
Infographic Layout For Global Business Planning Powerpoint Template
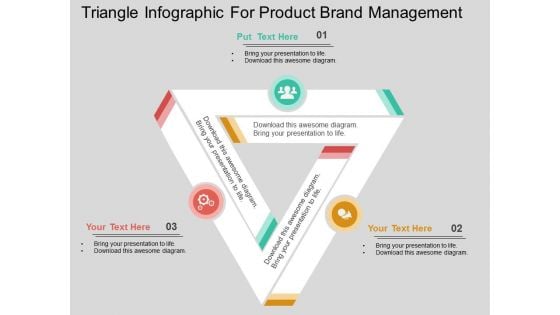
Triangle Infographic For Product Brand Management Powerpoint Template
This business diagram has been designed with triangle infographic design. You may use this slide to display product brand management. Make your mark with this unique slide and create an impression that will endure.
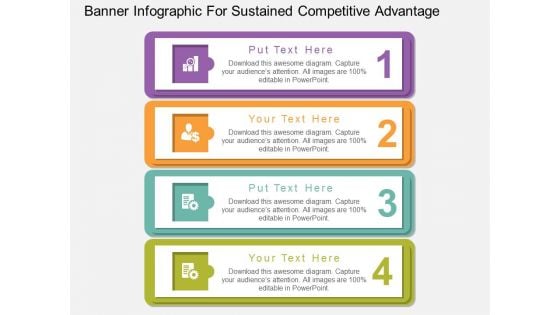
Banner Infographic For Sustained Competitive Advantage Powerpoint Template
Create visually amazing presentations with this diagram of four infographic banners. Use this business slide to depict sustained competitive advantages. You may use this slide to share a plan to achieve the desired goals.
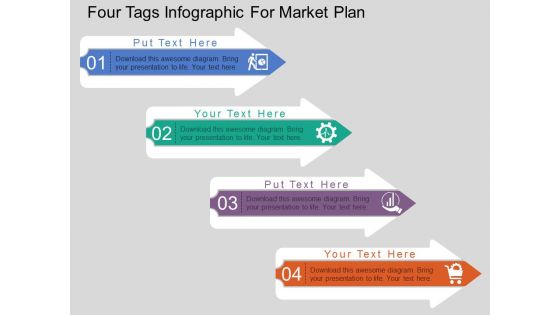
Four Tags Infographic For Market Plan Powerpoint Template
Create dynamic presentations with our professional template containing four tags infographic layout. This diagram is useful to display market plan. Download this template to leave permanent impression on your audience.
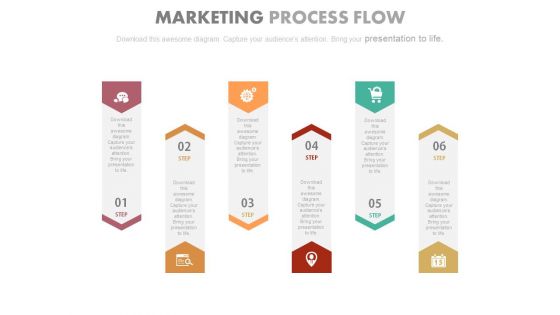
Six Infographic Tags For Integration Strategy Powerpoint Template
Deliver amazing presentations with our above template showing six infographic tags. You may download this PPT slide to display business integration strategy. Capture the attention of your audience using this PPT diagram slide.
Gears Infographic For Financial Process Control Powerpoint Slides
This PowerPoint template contains gears infographic diagram. You may download this PPT slide design to display financial strategy and process control. You can easily customize this template to make it more unique as per your need.
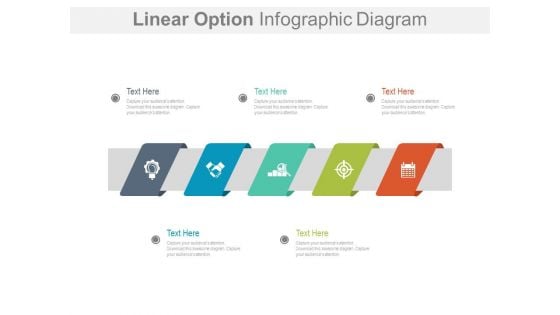
Linear Options Infographic For Qualitative Market Research Powerpoint Slides
This PowerPoint template contains linear options infographic diagram. You may download this PPT slide design to display qualitative market research. You can easily customize this template to make it more unique as per your need.
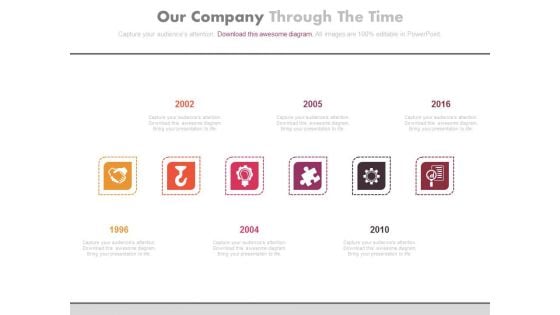
Year Based Timeline Infographic For Organizational Strategies Powerpoint Slides
This PowerPoint template has been designed with year based infographic timeline diagram. This PPT slide may be helpful to display organizational strategies. Download this PowerPoint timeline template to make impressive presentations.
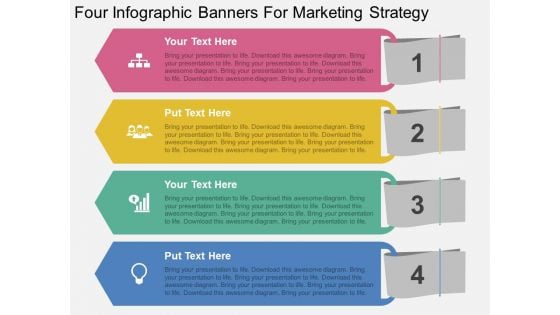
Four Infographic Banners For Marketing Strategy Powerpoint Template
This PowerPoint slide has been designed with four infographic banners. This diagram is designed to display four steps of marketing strategy. This professional slide helps in making an instant impact on viewers.
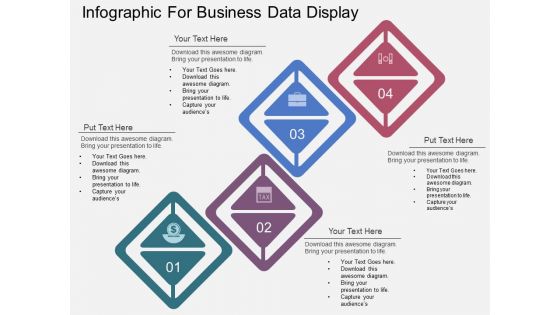
Four Steps Infographic For Business Data Display Powerpoint Template
This PowerPoint template has been designed with four steps infographic layout. This diagram can be used to display business data in visual manner. Capture the attention of your audience with this slide.

 Home
Home