Infographic Icons

Image Of Fuel Station On Road Ppt PowerPoint Presentation Infographic Template Graphics Example
Presenting this set of slides with name image of fuel station on road ppt powerpoint presentation infographic template graphics example. The topics discussed in these slides are fuel, petroleum icon, oil and gas. This is a completely editable PowerPoint presentation and is available for immediate download. Download now and impress your audience.

Junk Food Burger With Cold Drink Ppt PowerPoint Presentation Summary Infographic Template
Presenting this set of slides with name junk food burger with cold drink ppt powerpoint presentation summary infographic template. The topics discussed in these slides are food background, vector icon, cold drink. This is a completely editable PowerPoint presentation and is available for immediate download. Download now and impress your audience.

Tall Buildings Urban Infrastructure Ppt PowerPoint Presentation Infographic Template Master Slide
Presenting this set of slides with name tall buildings urban infrastructure ppt powerpoint presentation infographic template master slide. This is a three stage process. The stages in this process are infrastructure icon, infrastructure development, maintenance. This is a completely editable PowerPoint presentation and is available for immediate download. Download now and impress your audience.

Vector Of Truck With Wifi Symbol Ppt PowerPoint Presentation Infographic Template Format
Presenting this set of slides with name vector of truck with wifi symbol ppt powerpoint presentation infographic template format. This is a four stage process. The stages in this process are iot icon, smartphone vector, headphones. This is a completely editable PowerPoint presentation and is available for immediate download. Download now and impress your audience.

Seven Stages Communication System Circular Infographic Layout Ppt PowerPoint Presentation Pictures Design Ideas
Presenting this set of slides with name seven stages communication system circular infographic layout ppt powerpoint presentation pictures design ideas. This is a seven stage process. The stages in this process are communication process, information flow char, conversation vector icon. This is a completely editable PowerPoint presentation and is available for immediate download. Download now and impress your audience.

Job Responsibilities Of Project Head Ppt PowerPoint Presentation Infographic Template Gallery
Presenting this set of slides with name job responsibilities of project head ppt powerpoint presentation infographic template gallery. This is a five stage process. The stages in this process are role description icon, role description steps, corporate relationship. This is a completely editable PowerPoint presentation and is available for immediate download. Download now and impress your audience.
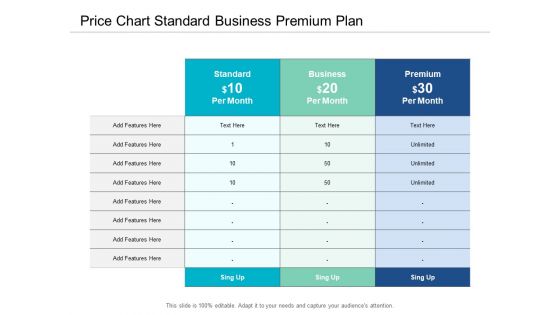
Price Chart Standard Business Premium Plan Ppt Powerpoint Presentation Visual Aids Infographic Template
This is a price chart standard business premium plan ppt powerpoint presentation visual aids infographic template. This is a three stage process. The stages in this process are comparison chart, comparison table, comparison matrix.
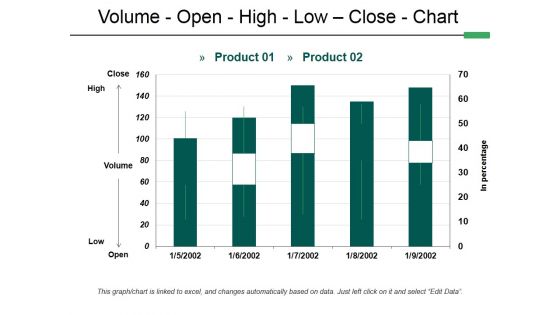
Volume Open High Low Close Chart Ppt PowerPoint Presentation Infographic Template Guidelines
This is a volume open high low close chart ppt powerpoint presentation infographic template guidelines. This is a two stage process. The stages in this process are volume, open, high, low, close, chart.
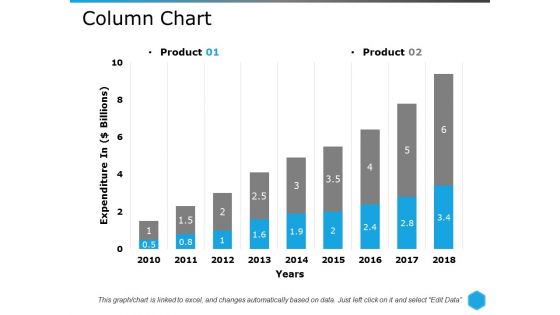
Column Chart Template 2 Ppt PowerPoint Presentation Infographic Template Example Introduction
This is a column chart template 2 ppt powerpoint presentation infographic template example introduction. This is a two stage process. The stages in this process are column chart, finance, analysis, marketing, strategy.
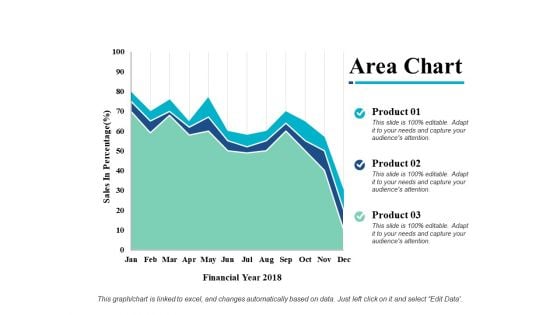
Area Chart Finance Marketing Ppt PowerPoint Presentation Infographic Template Master Slide
This is a area chart finance marketing ppt powerpoint presentation infographic template master slide. This is a three stage process. The stages in this process are area chart, finance, marketing, analysis, investment.
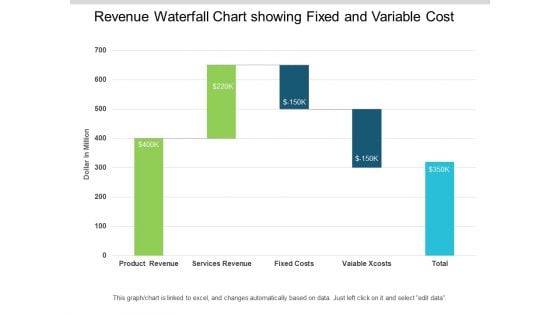
Revenue Waterfall Chart Showing Fixed And Variable Cost Ppt PowerPoint Presentation Infographic Template Images
This is a revenue waterfall chart showing fixed and variable cost ppt powerpoint presentation infographic template images. This is a five stage process. The stages in this process are sales waterfall, waterfall chart, business.
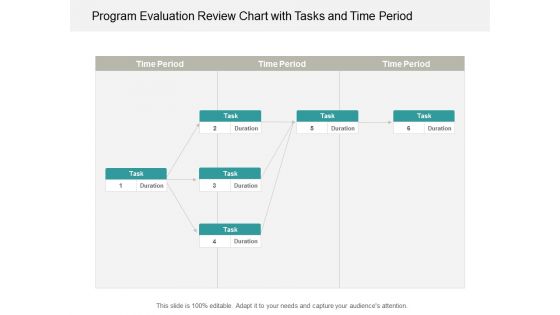
Program Evaluation Review Chart With Tasks And Time Period Ppt Powerpoint Presentation Portfolio Infographic Template
This is a program evaluation review chart with tasks and time period ppt powerpoint presentation portfolio infographic template. This is a six stage process. The stages in this process are pert chart, program evaluation and review technique, pert graph.
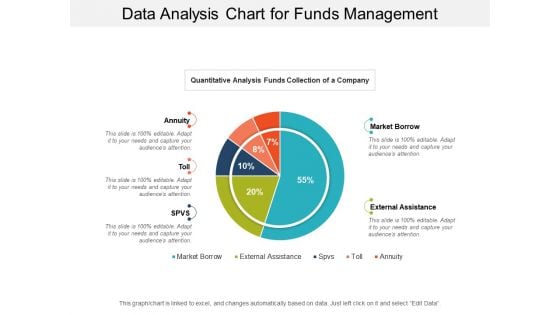
Data Analysis Chart For Funds Management Ppt PowerPoint Presentation Infographic Template Files
This is a data analysis chart for funds management ppt powerpoint presentation infographic template files. This is a five stage process. The stages in this process are financial analysis, quantitative, statistical modelling.
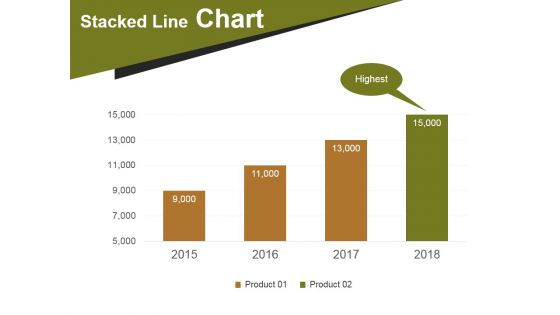
Stacked Line Chart Template 1 Ppt PowerPoint Presentation Infographic Template Layout
This is a stacked line chart template 1 ppt powerpoint presentation infographic template layout. This is a four stage process. The stages in this process are stacked line chart, highest, product.
Sales Marketing Organization Chart Ppt PowerPoint Presentation Infographic Template Template Cpb
This is a sales marketing organization chart ppt powerpoint presentation infographic template template cpb. This is a five stage process. The stages in this process are sales marketing organization chart.
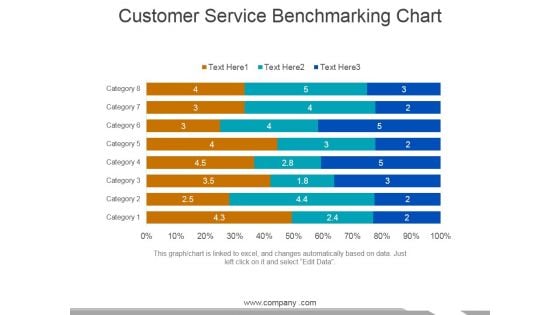
Customer Service Benchmarking Chart Ppt PowerPoint Presentation Infographic Template Graphics Tutorials
This is a customer service benchmarking chart ppt powerpoint presentation infographic template graphics tutorials. This is a eight stage process. The stages in this process are category, business, marketing, management.

Process Mapping Flow Charting Ppt PowerPoint Presentation Infographic Template Graphics Pictures
This is a process mapping flow charting ppt powerpoint presentation infographic template graphics pictures. This is a five stage process. The stages in this process are start, end, business, marketing, management.
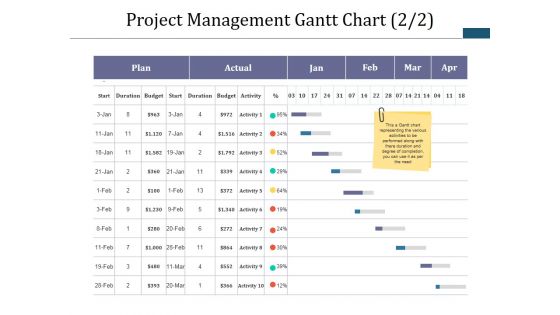
Project Management Gantt Chart Template 2 Ppt PowerPoint Presentation Infographic Template Master Slide
This is a project management gantt chart template 2 ppt powerpoint presentation infographic template master slide. This is a five stage process. The stages in this process are table, business, marketing, strategy, compare.

Bulb Or Idea Chart Ppt PowerPoint Presentation Infographic Template Design Ideas
This is a bulb or idea chart ppt powerpoint presentation infographic template design ideas. This is a one stages process. The stages in this process are bulb or idea, technology, strategy, management, planning.
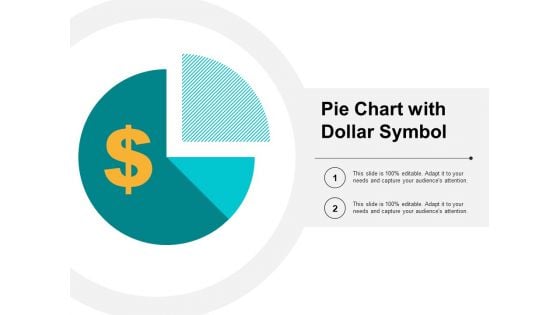
Pie Chart With Dollar Symbol Ppt PowerPoint Presentation Infographic Template Graphics Design
This is a pie chart with dollar symbol ppt powerpoint presentation infographic template graphics design. This is a two stage process. The stages in this process are sectioned circle, segmented circle, partitioned circle.
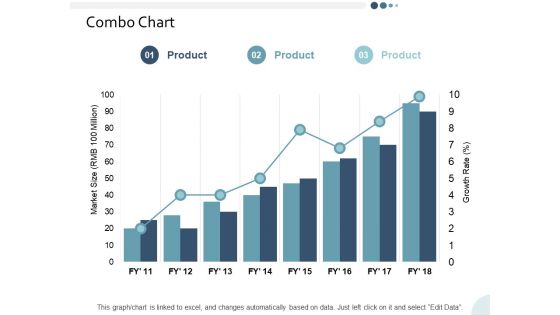
Combo Chart Yearly Operating Plan Ppt PowerPoint Presentation Infographic Template Skills
This is a combo chart yearly operating plan ppt powerpoint presentation infographic template skills. This is a three stage process. The stages in this process are business, management, strategy, analysis, marketing.
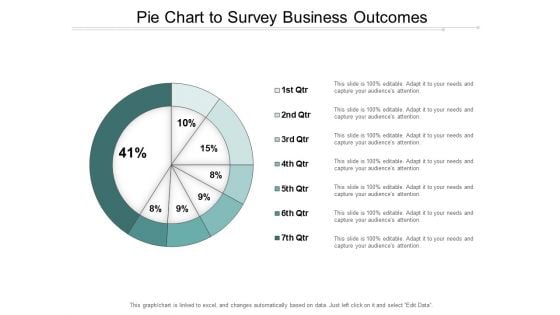
Pie Chart To Survey Business Outcomes Ppt Powerpoint Presentation Infographic Template Gridlines
This is a pie chart to survey business outcomes ppt powerpoint presentation infographic template gridlines. This is a seven stage process. The stages in this process are business outcomes, business results, business output.
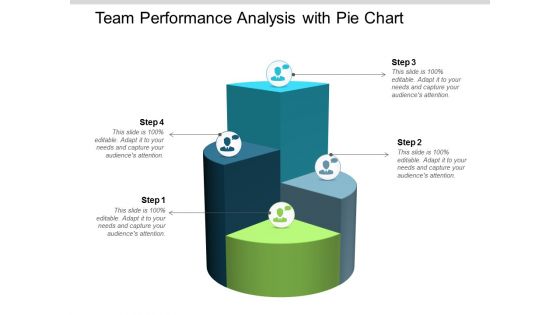
Team Performance Analysis With Pie Chart Ppt Powerpoint Presentation Infographic Template Slideshow
This is a team performance analysis with pie chart ppt powerpoint presentation infographic template slideshow. This is a four stage process. The stages in this process are team performance, member performance, group performance.
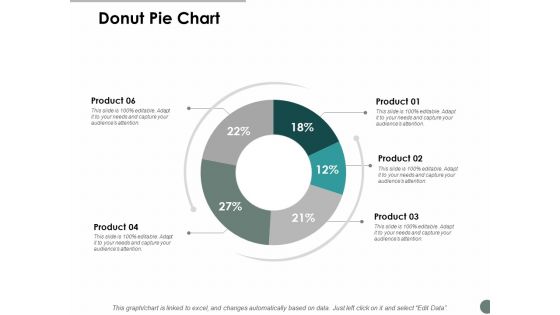
Donut Pie Chart Marketing Ppt Powerpoint Presentation Infographic Template Graphics Template
This is a donut pie chart marketing ppt powerpoint presentation infographic template graphics template. This is a six stage process. The stages in this process are finance, marketing, management, investment, analysis.
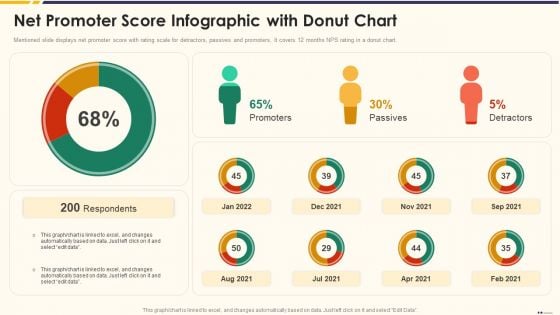
Promotion Standard Practices Tools And Templates Net Promoter Score Infographic With Donut Chart Inspiration PDF
Mentioned slide displays net promoter score with rating scale for detractors, passives and promoters, It covers 12 months NPS rating in a donut chart.Deliver an awe inspiring pitch with this creative promotion standard practices tools and templates net promoter score infographic with donut chart inspiration pdf bundle. Topics like net promoter score infographic with donut chart can be discussed with this completely editable template. It is available for immediate download depending on the needs and requirements of the user.
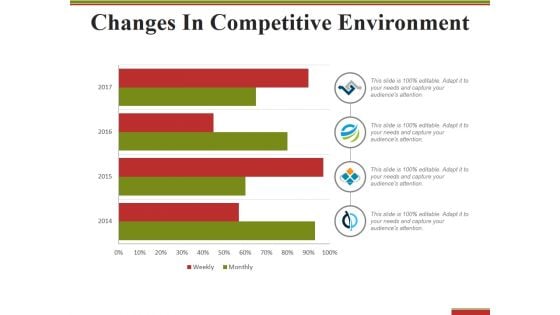
Changes In Competitive Environment Template 2 Ppt PowerPoint Presentation Infographic Template Themes
This is a changes in competitive environment template 2 ppt powerpoint presentation infographic template themes. This is a four stage process. The stages in this process are weekly, monthly, year, finance, percentage.
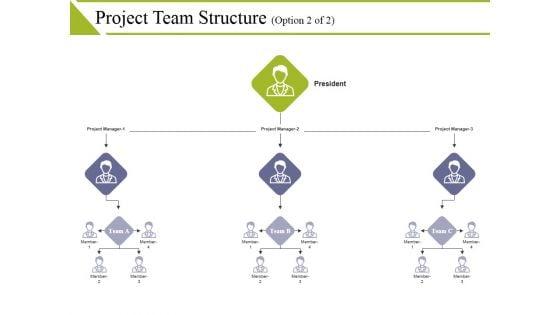
Project Team Structure Template 2 Ppt PowerPoint Presentation Infographic Template Themes
This is a project team structure template 2 ppt powerpoint presentation infographic template themes. This is a four stage process. The stages in this process are project manager, president, team, member.
Public Administration Politics Analyst Investment Ppt PowerPoint Presentation Infographic Template Themes
This is a public administration politics analyst investment ppt powerpoint presentation infographic template themes. This is a six stage process. The stages in this process are public, administration, interpersonal, negotiation, skills.
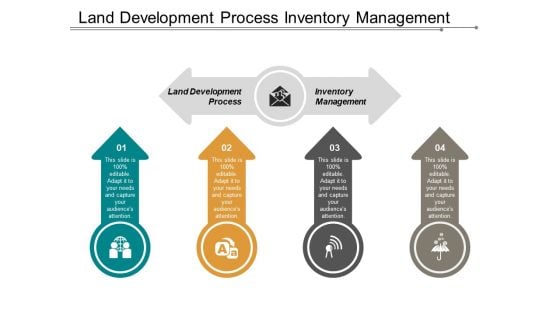
Land Development Process Inventory Management Business Commerce Ppt PowerPoint Presentation Infographic Template Themes
This is a land development process inventory management business commerce ppt powerpoint presentation infographic template themes. This is a four stage process. The stages in this process are land development process, inventory management, business commerce.
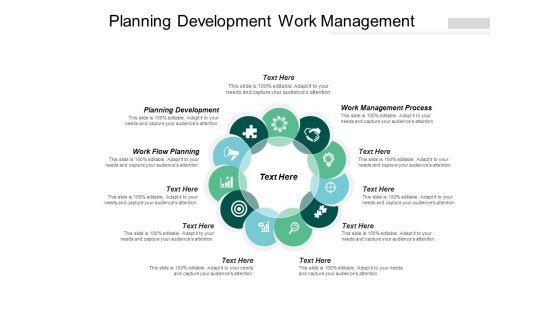
Planning Development Work Management Process Work Flow Planning Ppt PowerPoint Presentation Infographic Template Themes
This is a planning development work management process work flow planning ppt powerpoint presentation infographic template themes. This is a eleven stage process. The stages in this process are planning development, work management process, work flow planning.
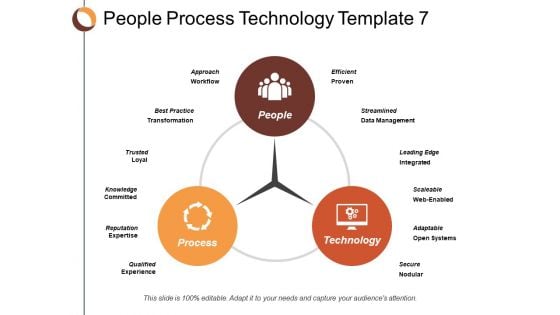
People Process Technology Approach Workflow Ppt Powerpoint Presentation Infographic Template Themes
This is a people process technology approach workflow ppt powerpoint presentation infographic template themes. This is a three stage process. The stages in this process are business, management, strategy, process, technology.
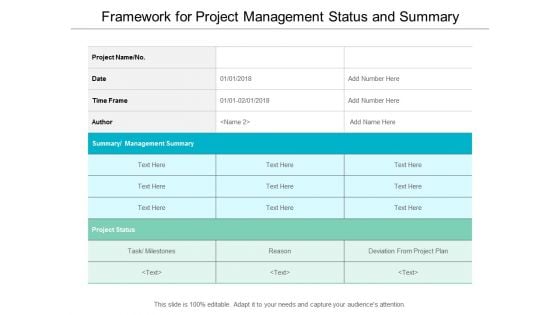
Framework For Project Management Status And Summary Ppt Powerpoint Presentation Infographic Template Themes
This is a framework for project management status and summary ppt powerpoint presentation infographic template themes. This is a three stage process. The stages in this process are project management, program governance, governance model, project approach.
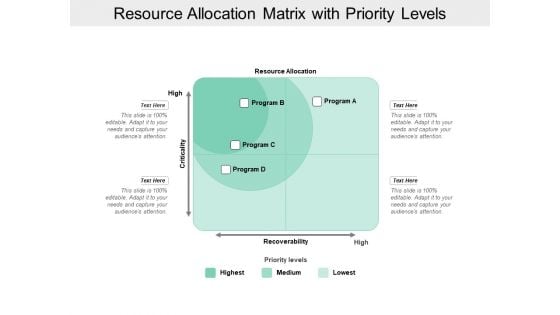
Resource Allocation Matrix With Priority Levels Ppt Powerpoint Presentation Infographic Template Themes
This is a resource allocation matrix with priority levels ppt powerpoint presentation infographic template themes. This is a four stage process. The stages in this process are resource management, wealth management, capital management.
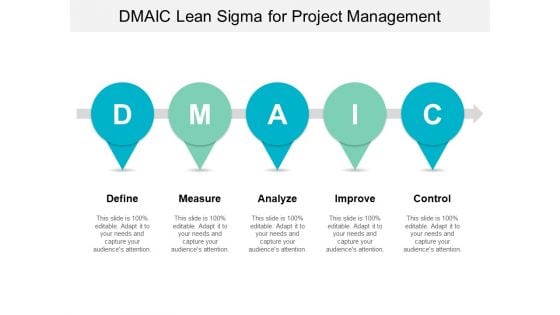
Dmaic Lean Sigma For Project Management Ppt PowerPoint Presentation Infographic Template Graphics Download
This is a dmaic lean sigma for project management ppt powerpoint presentation infographic template graphics download. This is a five stage process. The stages in this process are dmaic, improvement process, five phases of lean six sigma.
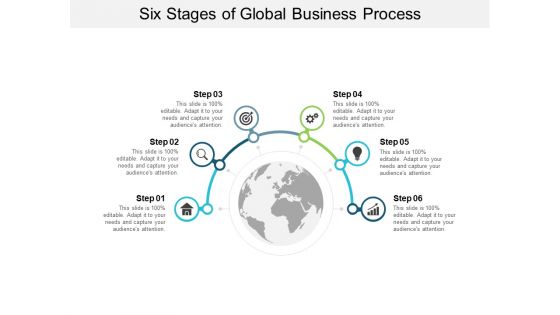
Six Stages Of Global Business Process Ppt PowerPoint Presentation Show Infographic Template
This is a six stages of global business process ppt powerpoint presentation show infographic template. This is a six stage process. The stages in this process are 6 steps, 6 phases, 6 segments.

Four Stages Of Talent Management System Ppt PowerPoint Presentation Infographic Template Background Image
This is a four stages of talent management system ppt powerpoint presentation infographic template background image. This is a four stage process. The stages in this process are 4 phases, process, planning.
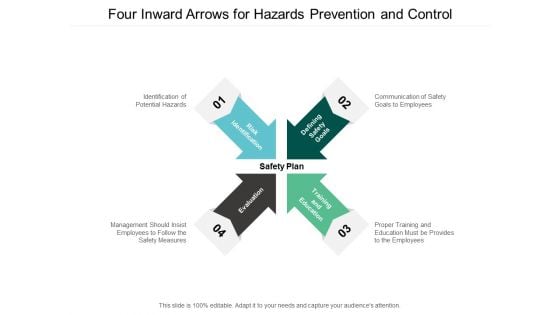
Four Inward Arrows For Hazards Prevention And Control Ppt Powerpoint Presentation Infographic Template Inspiration
This is a four inward arrows for hazards prevention and control ppt powerpoint presentation infographic template inspiration. This is a four stage process. The stages in this process are arrow steps, arrow stages, arrow phases.
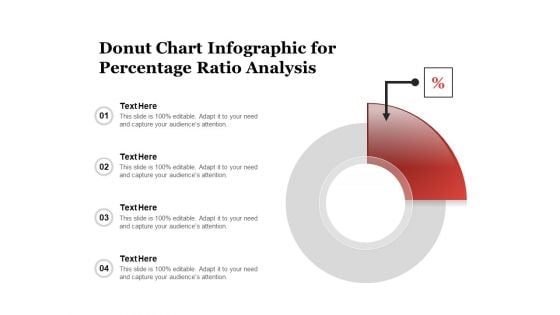
Donut Chart Infographic For Percentage Ratio Analysis Ppt PowerPoint Presentation File Graphics Example PDF
Persuade your audience using this donut chart infographic for percentage ratio analysis ppt powerpoint presentation file graphics example pdf. This PPT design covers four stages, thus making it a great tool to use. It also caters to a variety of topics including donut chart infographic for percentage ratio analysis. Download this PPT design now to present a convincing pitch that not only emphasizes the topic but also showcases your presentation skills.
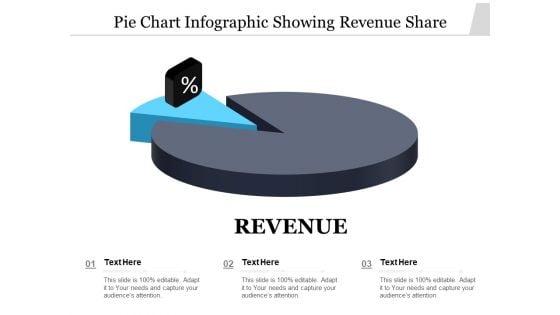
Pie Chart Infographic Showing Revenue Share Ppt Styles Graphics Pictures PDF
Persuade your audience using this pie chart infographic showing revenue share ppt styles graphics pictures pdf. This PPT design covers three stages, thus making it a great tool to use. It also caters to a variety of topics including pie chart infographic showing revenue share. Download this PPT design now to present a convincing pitch that not only emphasizes the topic but also showcases your presentation skills.
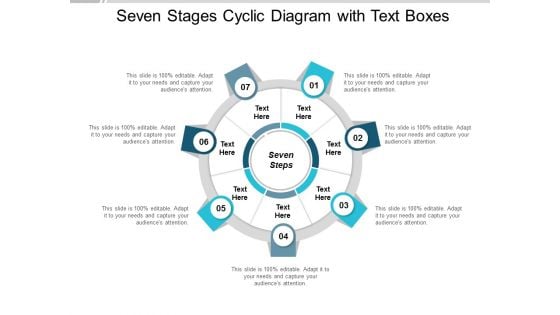
Seven Stages Cyclic Diagram With Text Boxes Ppt Powerpoint Presentation Infographic Template Gridlines
This is a seven stages cyclic diagram with text boxes ppt powerpoint presentation infographic template gridlines. This is a seven stage process. The stages in this process are cycle diagram, circular process, cyclical process.
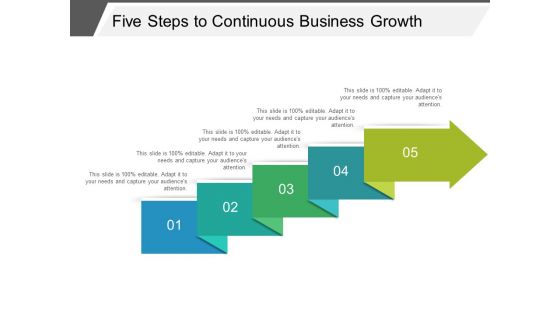
Five Steps To Continuous Business Growth Ppt PowerPoint Presentation Infographic Template Diagrams
This is a five steps to continuous business growth ppt powerpoint presentation infographic template diagrams. This is a five stage process. The stages in this process are circular, continuity, continuum.
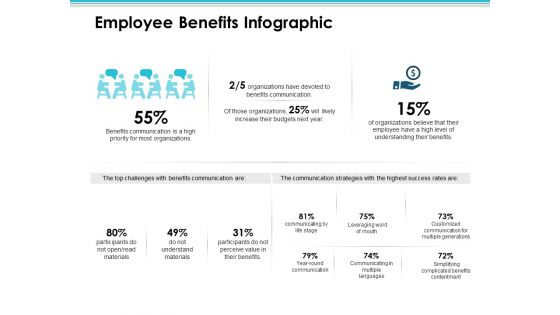
Employee Benefits Infographic Employee Value Proposition Ppt PowerPoint Presentation Styles Diagrams
This is a employee benefits infographic employee value proposition ppt powerpoint presentation styles diagrams. This is a three stage process. The stages in this process are business, management, strategy, analysis, marketing.
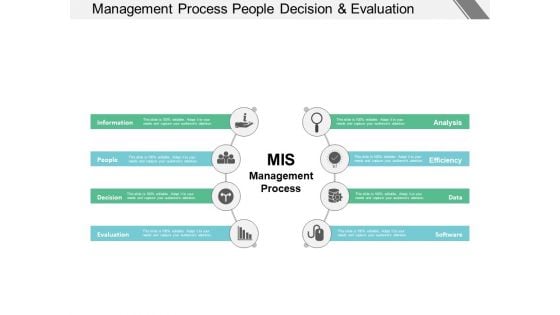
Management Process People Decision And Evaluation Ppt PowerPoint Presentation Infographic Template Diagrams
This is a management process people decision and evaluation ppt powerpoint presentation infographic template diagrams. This is a eight stage process. The stages in this process are management information system, mis, decision making system.
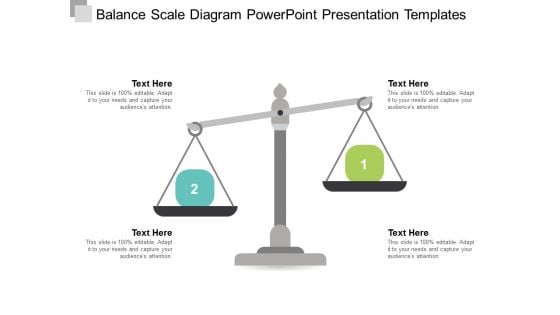
Balance Scale Diagram Powerpoint Presentation Templates Ppt Powerpoint Presentation Infographic Template
This is a balance scale diagram powerpoint presentation templates ppt powerpoint presentation infographic template. This is a four stage process. The stages in this process are balance scale, weighing scale, measuring scale.

Nine Points Agenda Diagram With Text Boxes Ppt PowerPoint Presentation Gallery Infographic Template
This is a nine points agenda diagram with text boxes ppt powerpoint presentation gallery infographic template. This is a nine stage process. The stages in this process are 12 bullet points, 12 points, 12 points checklist.

Meet Our Best Team Communication Management Ppt PowerPoint Presentation Infographic Template Diagrams
This is a meet our best team communication management ppt powerpoint presentation infographic template diagrams. This is a four stage process. The stages in this process are our team, communication, management, planning, business.
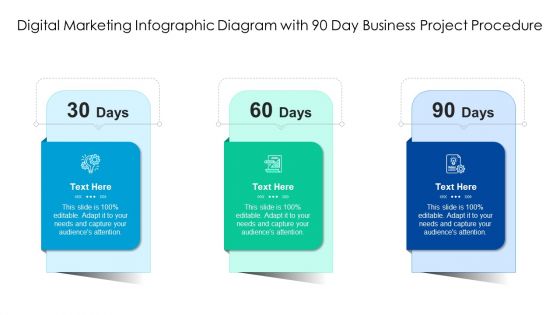
Digital Marketing Infographic Diagram With 90 Day Business Project Procedure Ppt PowerPoint Presentation File Vector PDF
Presenting digital marketing infographic diagram with 90 day business project procedure ppt powerpoint presentation file vector pdf to dispense important information. This template comprises three stages. It also presents valuable insights into the topics including digital marketing infographic diagram with 90 day business project procedure. This is a completely customizable PowerPoint theme that can be put to use immediately. So, download it and address the topic impactfully.
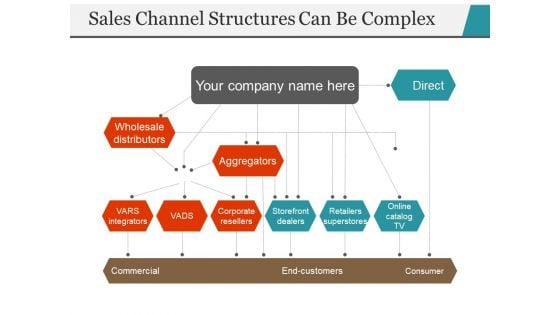
Sales Channel Structures Can Be Complex Ppt PowerPoint Presentation Infographic Template Example File
This is a sales channel structures can be complex ppt powerpoint presentation infographic template example file. This is a three stage process. The stages in this process are aggregators, integrators, corporate, resellers, storefront.

Product Line Strategy Ppt PowerPoint Presentation Infographic Template Design Inspiration Cpb
This is a product line strategy ppt powerpoint presentation infographic template design inspiration cpb. This is a six stage process. The stages in this process are product line strategy.
Reporting Financial Statements Ppt PowerPoint Presentation Infographic Template Layout Ideas Cpb
This is a reporting financial statements ppt powerpoint presentation infographic template layout ideas cpb. This is a seven stage process. The stages in this process are reporting financial statements.

6 Stage Infographic Visual For Pulling Out A Business Loan Ppt PowerPoint Presentation Gallery Themes PDF
Presenting 6 stage infographic visual for pulling out a business loan ppt powerpoint presentation gallery themes pdf to dispense important information. This template comprises six stages. It also presents valuable insights into the topics including 6 stage infographic visual for pulling out a business loan. This is a completely customizable PowerPoint theme that can be put to use immediately. So, download it and address the topic impactfully.
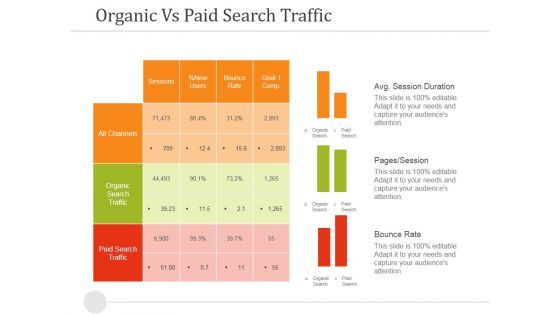
Organic Vs Paid Search Traffic Ppt PowerPoint Presentation Infographic Template Influencers
This is a organic vs paid search traffic ppt powerpoint presentation infographic template influencers. This is a three stage process. The stages in this process are avg session duration, pages session, bounce rate.
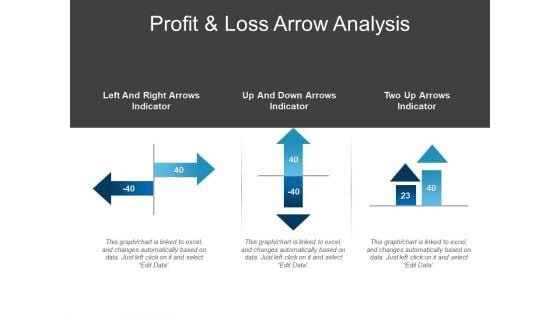
Profit And Loss Arrow Analysis Ppt PowerPoint Presentation Infographic Template Model
This is a profit and loss arrow analysis ppt powerpoint presentation infographic template model. This is a three stage process. The stages in this process are comparison chart, comparison table, comparison matrix.
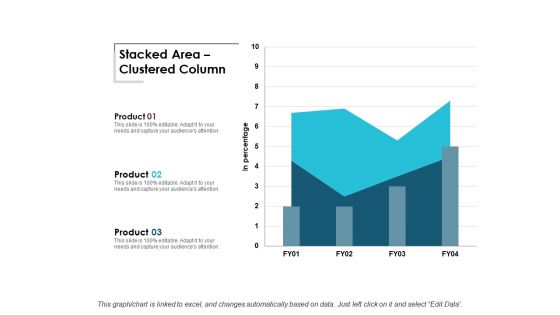
Stacked Area Clustered Column Ppt Powerpoint Presentation Infographic Template Background Images
This is a stacked area clustered column ppt powerpoint presentation infographic template background images. This is a three stage process. The stages in this process are area chart, finance, marketing, management, investment.
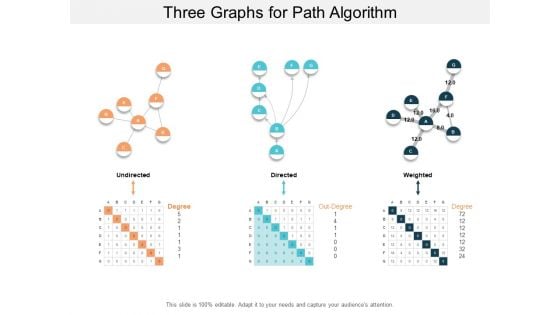
Three Graphs For Path Algorithm Ppt PowerPoint Presentation Infographic Template Templates
This is a three graphs for path algorithm ppt powerpoint presentation infographic template templates. This is a three stage process. The stages in this process are graph theory, chart theory, business.
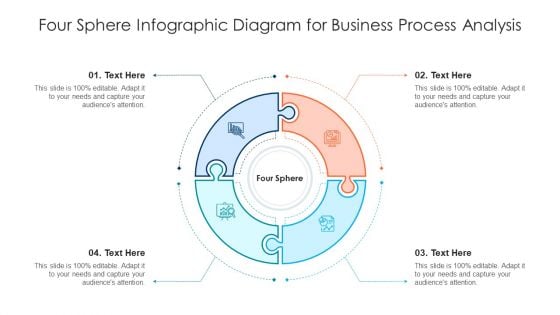
Four Sphere Infographic Diagram For Business Process Analysiss Ppt PowerPoint Presentation Professional Backgrounds PDF
Persuade your audience using this four sphere infographic diagram for business process analysiss ppt powerpoint presentation professional backgrounds pdf. This PPT design covers four stages, thus making it a great tool to use. It also caters to a variety of topics including four sphere infographic diagram for business process analysis. Download this PPT design now to present a convincing pitch that not only emphasizes the topic but also showcases your presentation skills.
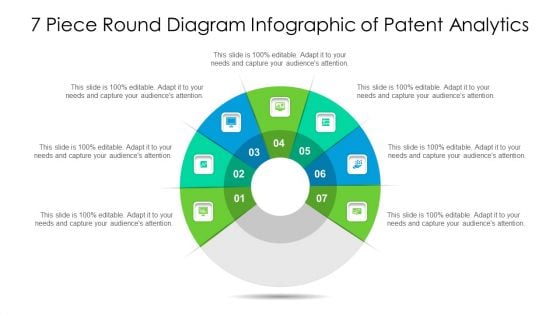
7 Piece Round Diagram Infographic Of Patent Analytics Ppt PowerPoint Presentation File Samples PDF
Persuade your audience using this 7 piece round diagram infographic of patent analytics ppt powerpoint presentation file samples pdf. This PPT design covers seven stages, thus making it a great tool to use. It also caters to a variety of topics including 7 piece round diagram infographic of patent analytics. Download this PPT design now to present a convincing pitch that not only emphasizes the topic but also showcases your presentation skills.
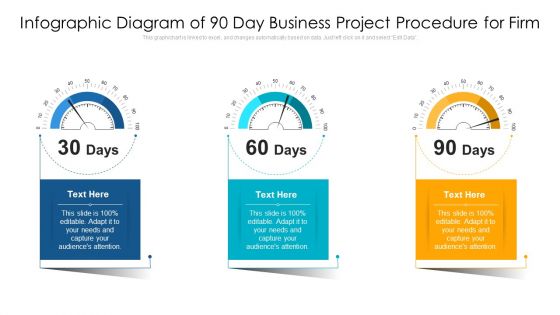
Infographic Diagram Of 90 Day Business Project Procedure For Firm Ppt PowerPoint Presentation Gallery Inspiration PDF
Showcasing this set of slides titled infographic diagram of 90 day business project procedure for firm ppt powerpoint presentation gallery inspiration pdf. The topics addressed in these templates are infographic diagram of 90 day business project procedure for firm. All the content presented in this PPT design is completely editable. Download it and make adjustments in color, background, font etc. as per your unique business setting.
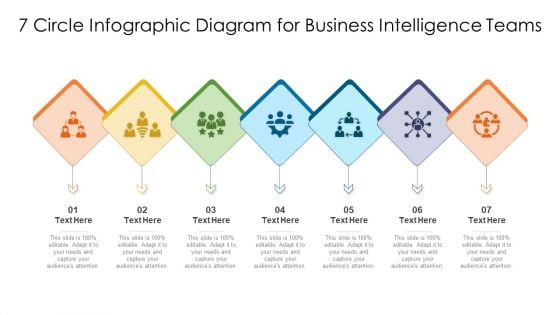
7 Circle Infographic Diagram For Business Intelligence Teams Ppt PowerPoint Presentation Sample PDF
Persuade your audience using this 7 circle infographic diagram for business intelligence teams ppt powerpoint presentation sample pdf. This PPT design covers seven stages, thus making it a great tool to use. It also caters to a variety of topics including 7 circle infographic diagram for business intelligence teams. Download this PPT design now to present a convincing pitch that not only emphasizes the topic but also showcases your presentation skills.
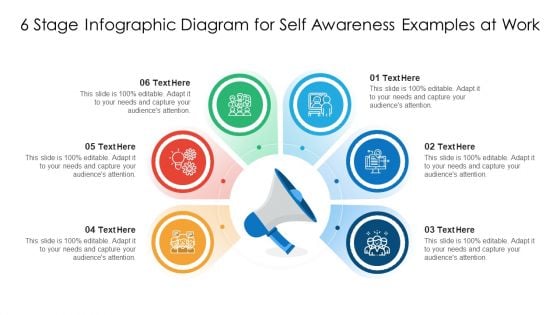
6 Stage Infographic Diagram For Self Awareness Examples At Work Ppt PowerPoint Presentation File Mockup PDF
Persuade your audience using this 6 stage infographic diagram for self awareness examples at work ppt powerpoint presentation file mockup pdf. This PPT design covers six stages, thus making it a great tool to use. It also caters to a variety of topics including 6 stage infographic diagram for self awareness examples at work. Download this PPT design now to present a convincing pitch that not only emphasizes the topic but also showcases your presentation skills.
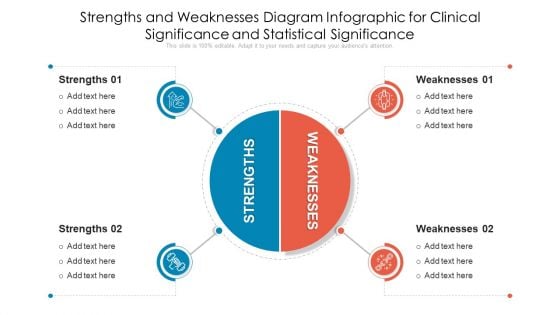
Strengths And Weaknesses Diagram Infographic For Clinical Significance And Statistical Significance Brochure PDF
Persuade your audience using this strengths and weaknesses diagram infographic for clinical significance and statistical significance brochure pdf. This PPT design covers two stages, thus making it a great tool to use. It also caters to a variety of topics including strengths and weaknesses diagram infographic for clinical significance and statistical significance. Download this PPT design now to present a convincing pitch that not only emphasizes the topic but also showcases your presentation skills.
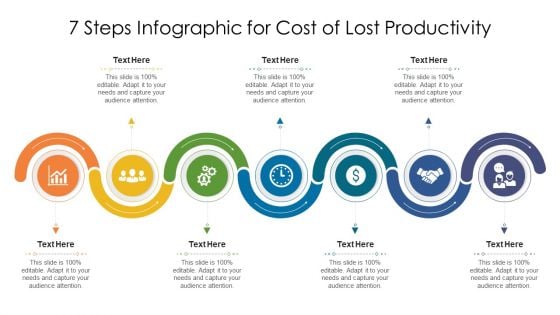
7 Steps Infographic For Cost Of Lost Productivity Ppt PowerPoint Presentation Summary Diagrams PDF
Persuade your audience using this 7 steps infographic for cost of lost productivity ppt powerpoint presentation summary diagrams pdf. This PPT design covers seven stages, thus making it a great tool to use. It also caters to a variety of topics including 7 steps infographic for cost of lost productivity. Download this PPT design now to present a convincing pitch that not only emphasizes the topic but also showcases your presentation skills.
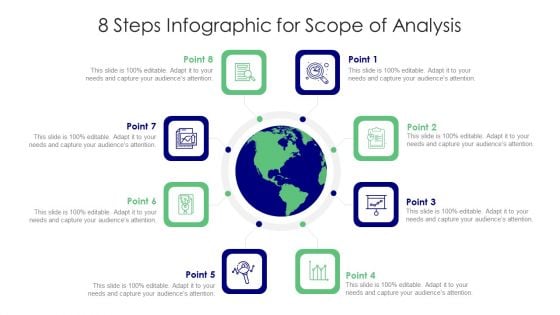
8 Steps Infographic For Scope Of Analysis Ppt Powerpoint Presentation Diagram Templates Pdf
Persuade your audience using this 8 steps infographic for scope of analysis ppt powerpoint presentation diagram templates pdf. This PPT design covers eight stages, thus making it a great tool to use. It also caters to a variety of topics including 8 steps infographic for scope of analysis. Download this PPT design now to present a convincing pitch that not only emphasizes the topic but also showcases your presentation skills.
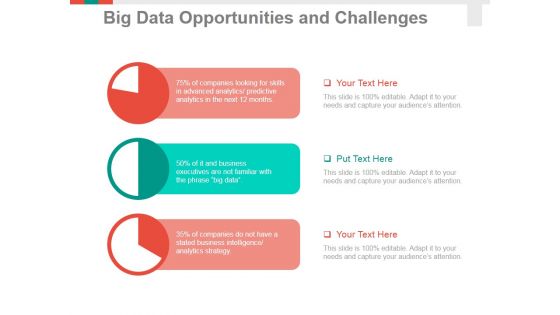
Big Data Opportunities And Challenges Template 1 Ppt PowerPoint Presentation Infographic Template Summary
This is a big data opportunities and challenges template 1 ppt powerpoint presentation infographic template summary. This is a three stage process. The stages in this process are business, pie chart, finance, marketing, analysis, strategy.
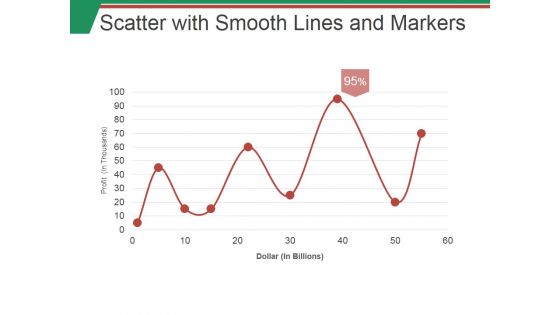
Scatter With Smooth Lines And Markers Ppt PowerPoint Presentation Infographic Template Images
This is a scatter with smooth lines and markers ppt powerpoint presentation infographic template images. This is a nine stage process. The stages in this process are business, marketing, finance, planning, success.
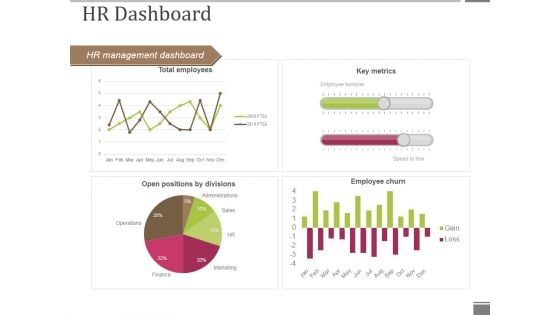
Hr Dashboard Template 1 Ppt PowerPoint Presentation Infographic Template Format Ideas
This is a hr dashboard template 1 ppt powerpoint presentation infographic template format ideas. This is a four stage process. The stages in this process are hr management dashboard, key metrics, employee churn, open positions by divisions, total employees.
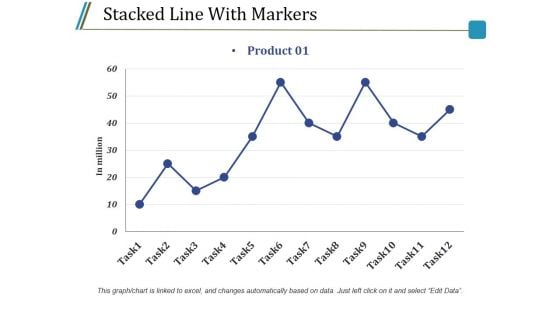
Stacked Line With Markers Ppt PowerPoint Presentation Infographic Template Graphics Example
This is a stacked line with markers ppt powerpoint presentation infographic template graphics example. This is a one stage process. The stages in this process are in million, task, product, finance, line graph.
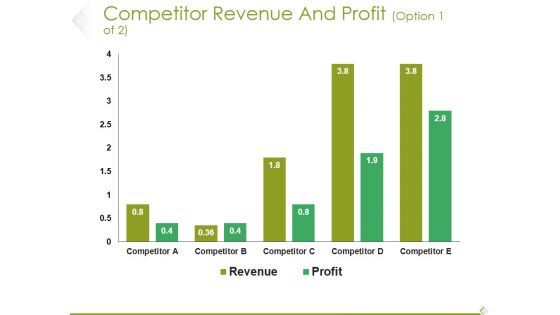
Competitor Revenue And Profit Template 2 Ppt PowerPoint Presentation Infographic Template Format Ideas
This is a competitor revenue and profit template 2 ppt powerpoint presentation infographic template format ideas. This is a five stage process. The stages in this process are competitor, revenue, profit, graph, growth.
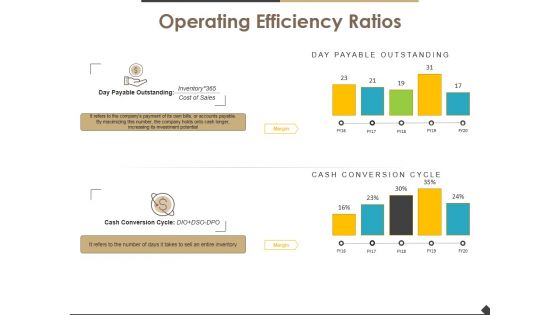
Operating Efficiency Ratios Template 2 Ppt PowerPoint Presentation Infographic Template Guide
This is a operating efficiency ratios template 2 ppt powerpoint presentation infographic template guide. This is a two stage process. The stages in this process are operating efficiency ratios, finance, marketing, strategy, business.
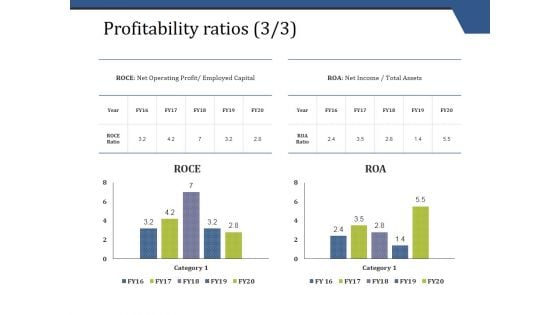
Profitability Ratios Template 3 Ppt PowerPoint Presentation Infographic Template Visual Aids
This is a profitability ratios template 3 ppt powerpoint presentation infographic template visual aids. This is a two stage process. The stages in this process are business, finance, marketing, analysis, investment.
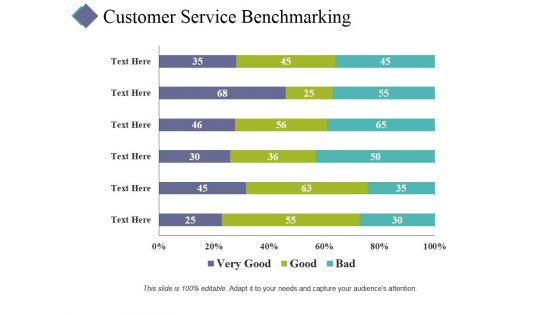
Customer Service Benchmarking Template 1 Ppt PowerPoint Presentation Infographic Template Shapes
This is a customer service benchmarking template 1 ppt powerpoint presentation infographic template shapes. This is a three stage process. The stages in this process are business, finance, marketing, strategy, analysis.
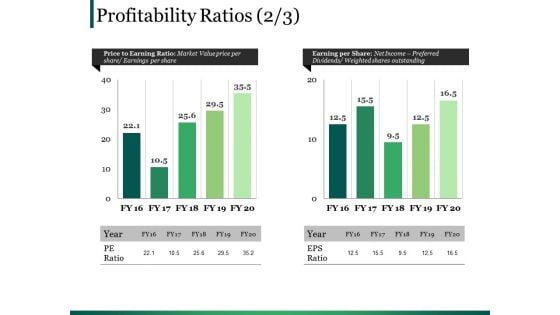
Profitability Ratios Template 4 Ppt PowerPoint Presentation Infographic Template Clipart Images
This is a profitability ratios template 4 ppt powerpoint presentation infographic template clipart images. This is a two stage process. The stages in this process are business, marketing, bar, finance, planning.
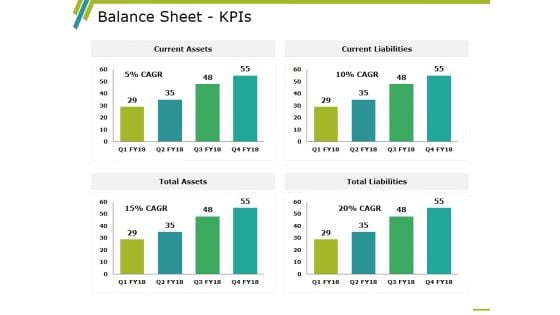
Balance Sheet Kpis Template 3 Ppt PowerPoint Presentation Infographic Template Demonstration
This is a balance sheet kpis template 3 ppt powerpoint presentation infographic template demonstration. This is a four stage process. The stages in this process are balance sheet, finance, marketing, strategy, analysis.
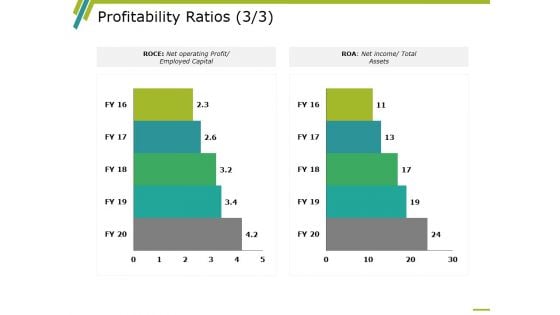
Profitability Ratios Template 5 Ppt PowerPoint Presentation Infographic Template Clipart Images
This is a profitability ratios template 5 ppt powerpoint presentation infographic template clipart images. This is a two stage process. The stages in this process are business, marketing, graph, roce, roa.
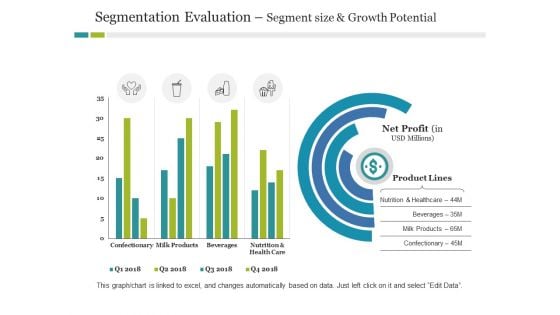
Segmentation Evaluation Segment Size And Growth Potential Ppt PowerPoint Presentation Infographic Template Outline
This is a segmentation evaluation segment size and growth potential ppt powerpoint presentation infographic template outline. This is a two stage process. The stages in this process are business, product lines, finance, marketing, strategy.
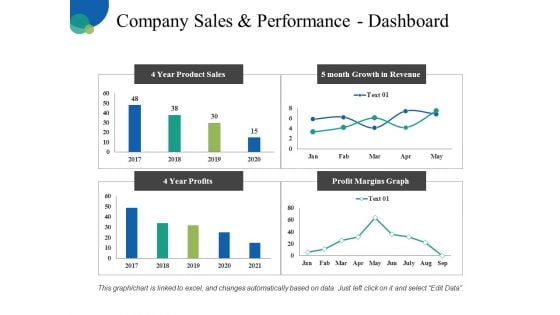
Company Sales And Performance Dashboard Ppt PowerPoint Presentation Pictures Infographic Template
This is a company sales and performance dashboard ppt powerpoint presentation pictures infographic template. This is a four stage process. The stages in this process are business, finance, analysis, management, marketing.
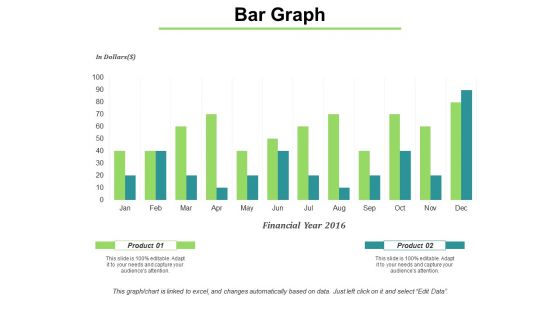
Bar Graph Shows Financial Values Ppt PowerPoint Presentation Infographic Template Gridlines
This is a bar graph shows financial values ppt powerpoint presentation infographic template gridlines. This is a two stage process. The stages in this process are bar, marketing, strategy, finance, planning.
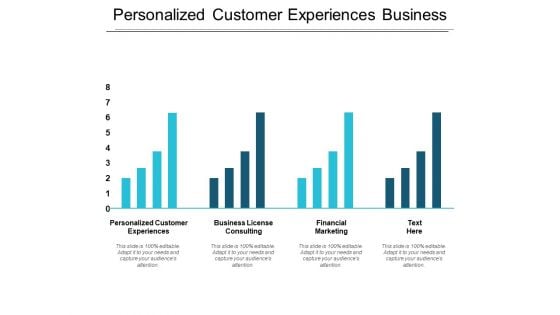
Personalized Customer Experiences Business License Consulting Finance Marketing Ppt PowerPoint Presentation Infographic Template Professional
This is a personalized customer experiences business license consulting finance marketing ppt powerpoint presentation infographic template professional. This is a four stage process. The stages in this process are personalized customer experiences, business license consulting, finance marketing.
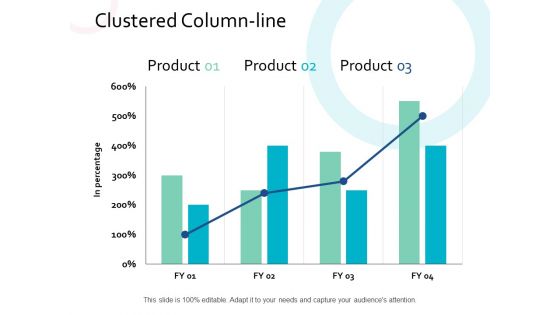
Clustered Column Line Investment Ppt PowerPoint Presentation Infographic Template File Formats
This is a clustered column line investment ppt powerpoint presentation infographic template file formats. This is a three stage process. The stages in this process are finance, analysis, business, investment, marketing.
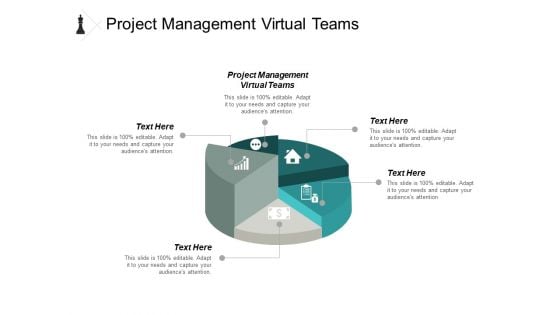
Project Management Virtual Teams Ppt PowerPoint Presentation Infographic Template Display Cpb
This is a project management virtual teams ppt powerpoint presentation infographic template display cpb. This is a six stage process. The stages in this process are project management virtual teams, business, management, marketing.

Stacked Area Clustered Column Marketing Ppt PowerPoint Presentation Infographic Template Vector
This is a stacked area clustered column marketing ppt powerpoint presentation infographic template vector. This is a three stage process. The stages in this process are business, management, marketing, product, percentage.
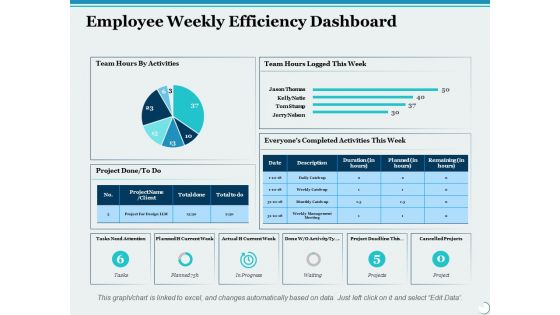
Employee Weekly Efficiency Dashboard Ppt PowerPoint Presentation Infographic Template Graphic Images
This is a employee weekly efficiency dashboard ppt powerpoint presentation infographic template graphic images. This is a six stage process. The stages in this process are percentage, product, business, management, marketing.

Stack Of Gold Bars In Shape Of Triangle Ppt Powerpoint Presentation Infographic Template Guidelines
This is a stack of gold bars in shape of triangle ppt powerpoint presentation infographic template guidelines. This is a four stage process. The stages in this process are stacked bar, pile bar, heap bar.
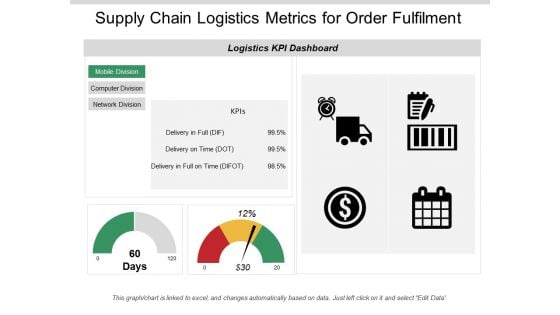
Supply Chain Logistics Metrics For Order Fulfilment Ppt PowerPoint Presentation Infographic Template Information
This is a supply chain logistics metrics for order fulfilment ppt powerpoint presentation infographic template information. This is a two stage process. The stages in this process are logistics performance, logistics dashboard, logistics kpis.

Future Trends In Multi Channel Retailing Ppt PowerPoint Presentation Infographic Template Rules
This is a future trends in multi channel retailing ppt powerpoint presentation infographic template rules. This is a four stage process. The stages in this process are mobile commerce, online shopping, planning, marketing, business.
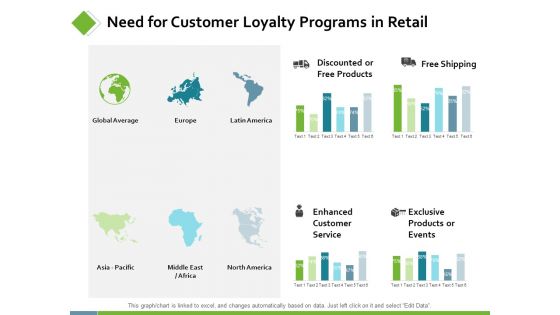
Need For Customer Loyalty Programs In Retail Ppt PowerPoint Presentation Infographic Template Introduction
This is a need for customer loyalty programs in retail ppt powerpoint presentation infographic template introduction. This is a four stage process. The stages in this process are finance, analysis, business, investment, marketing.
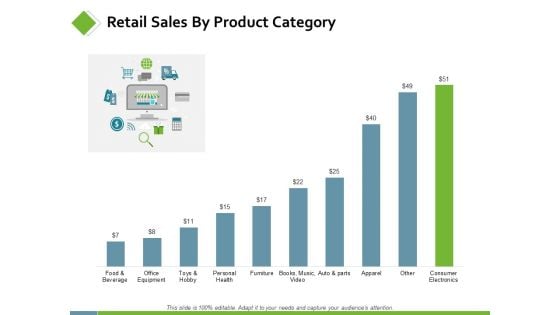
Retail Sales By Product Category Ppt PowerPoint Presentation Infographic Template Images
This is a retail sales by product category ppt powerpoint presentation infographic template images. This is a two stage process. The stages in this process are finance, analysis, business, investment, marketing.
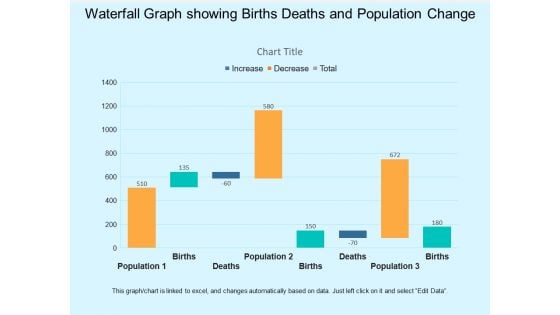
Waterfall Graph Showing Births Deaths And Population Change Ppt PowerPoint Presentation Infographic Template Visual Aids
This is a waterfall graph showing births deaths and population change ppt powerpoint presentation infographic template visual aids. This is a three stage process. The stages in this process are profit and loss, balance sheet, income statement, benefit and loss.
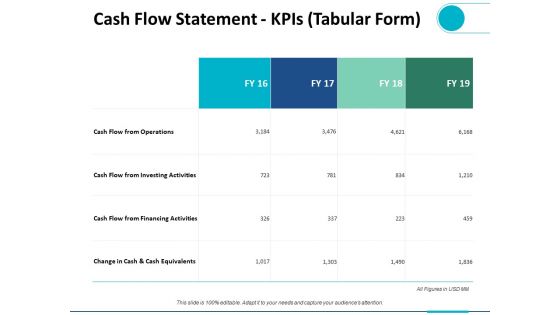
Cash Flow Statement Kpis Tabular Form Ppt PowerPoint Presentation Summary Infographic Template
This is a cash flow statement kpis tabular form ppt powerpoint presentation summary infographic template. This is a four stage process. The stages in this process are finance, analysis, business, investment, marketing.
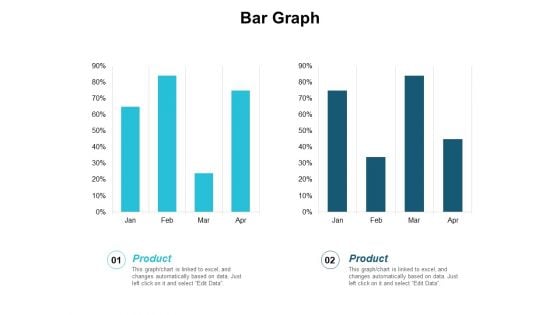
Bar Graph Finance Planning Ppt PowerPoint Presentation Infographic Template Master Slide
This is a bar graph finance planning ppt powerpoint presentation infographic template master slide. This is a two stage process. The stages in this process are finance, analysis, business, investment, marketing.
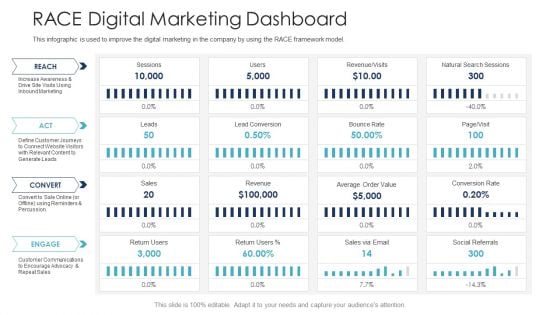
B2C Marketing Initiatives Strategies For Business RACE Digital Marketing Dashboard Ppt Infographic Template Objects PDF
This infographic is used to improve the digital marketing in the company by using the RACE framework model. Deliver an awe inspiring pitch with this creative B2C marketing initiatives strategies for business RACE digital marketing dashboard ppt infographic template objects pdf bundle. Topics like revenue, customer communications, inbound marketing, social referrals, conversion rate can be discussed with this completely editable template. It is available for immediate download depending on the needs and requirements of the user.
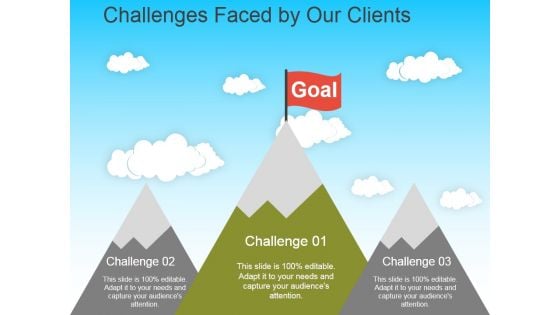
Challenges Faced By Our Clients Template 2 Ppt PowerPoint Presentation Infographic Template Gridlines
This is a challenges faced by our clients template 2 ppt powerpoint presentation infographic template gridlines. This is a three stage process. The stages in this process are goal, challenge, business, marketing, growth.
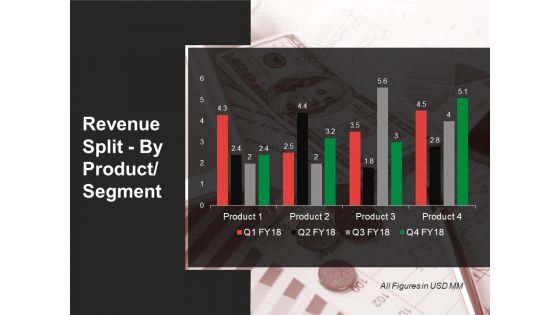
Revenue Split By Product Segment Template 2 Ppt PowerPoint Presentation Infographic Template Smartart
This is a revenue split by product segment template 2 ppt powerpoint presentation infographic template smartart. This is a four stage process. The stages in this process are Product, Business, Marketing, Strategy, Management.
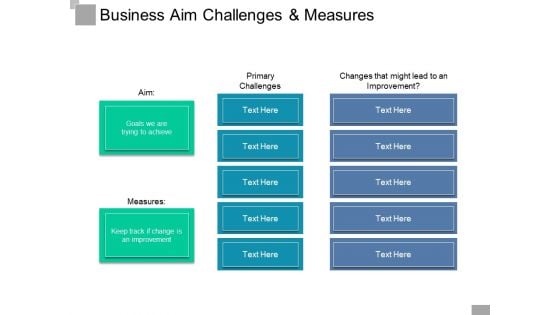
Business Aim Challenges And Measures Ppt PowerPoint Presentation Infographic Template Influencers
This is a business aim challenges and measures ppt powerpoint presentation infographic template influencers. This is a three stage process. The stages in this process are decision tree, decision point, driver diagram.
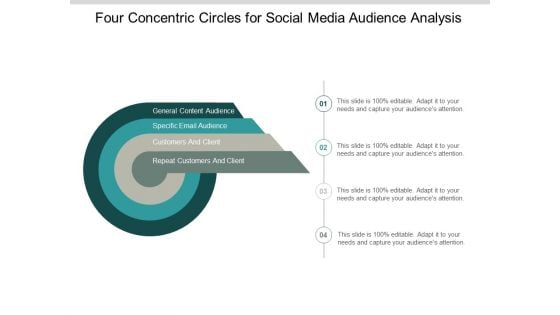
Four Concentric Circles For Social Media Audience Analysis Ppt PowerPoint Presentation Infographic Template Graphics
This is a Four Concentric Circles For Social Media Audience Analysis Ppt PowerPoint Presentation Infographic Template Graphics. This is a stage process. The stages in this process are 7 concentric circles, 7 circular cycle, 7 circular diagram.

Six Concentric Circles With Arrows And Text Boxes Ppt Powerpoint Presentation Infographic Template Gridlines
This is a six concentric circles with arrows and text boxes ppt powerpoint presentation infographic template gridlines. This is a stage process. The stages in this process are 7 concentric circles, 7 circular cycle, 7 circular diagram.
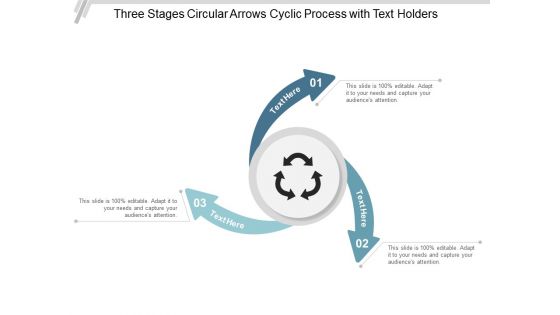
Three Stages Circular Arrows Cyclic Process With Text Holders Ppt Powerpoint Presentation Infographic Template Graphics Download
This is a three stages circular arrows cyclic process with text holders ppt powerpoint presentation infographic template graphics download. This is a three stage process. The stages in this process are cycle diagram, circular process, cyclical process.
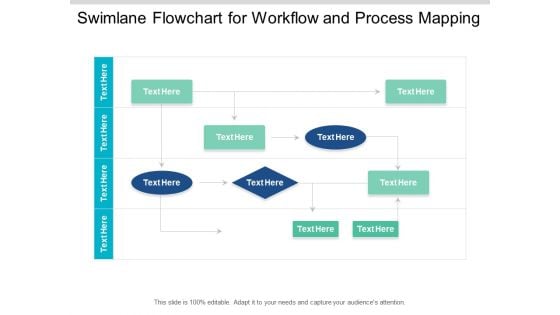
Swimlane Flowchart For Workflow And Process Mapping Ppt PowerPoint Presentation Infographic Template Graphics
This is a swimlane flowchart for workflow and process mapping ppt powerpoint presentation infographic template graphics. This is a four stage process. The stages in this process are swim lane diagram, flowchart, management.
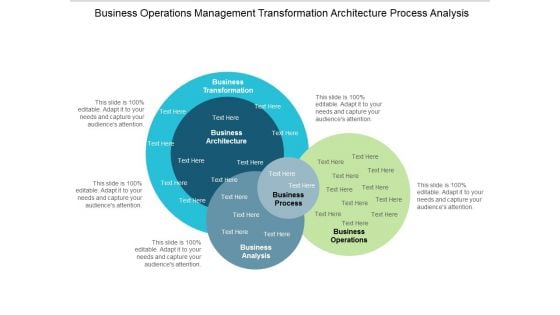
Business Operations Management Transformation Architecture Process Analysis Ppt Powerpoint Presentation Infographic Template Show
This is a business operations management transformation architecture process analysis ppt powerpoint presentation infographic template show. This is a five stage process. The stages in this process are context diagram, context shapes, context visuals.
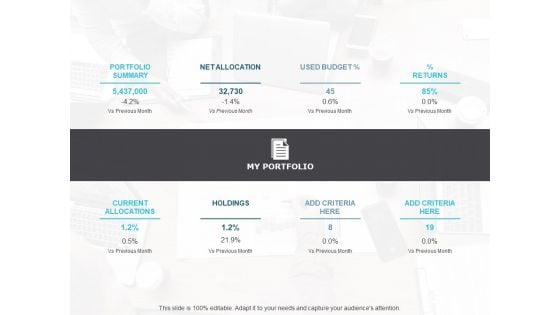
Portfolio Management Investment Allocation Kpis Ppt PowerPoint Presentation Infographic Template Templates
This is a portfolio management investment allocation kpis ppt powerpoint presentation infographic template templates. The topics discussed in this diagram are business, marketing, management. This is a completely editable PowerPoint presentation, and is available for immediate download.
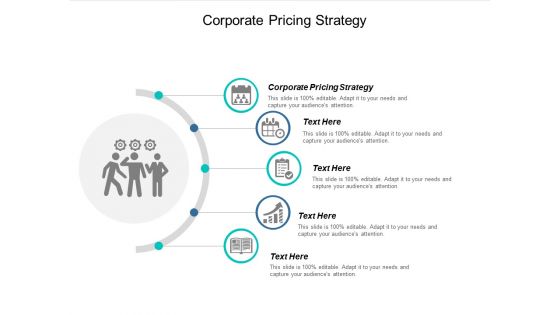
Corporate Pricing Strategy Ppt PowerPoint Presentation Infographic Template Graphics Download Cpb
This is a corporate pricing strategy ppt powerpoint presentation infographic template graphics download cpb. The topics discussed in this diagram are corporate pricing strategy. This is a completely editable PowerPoint presentation, and is available for immediate download.
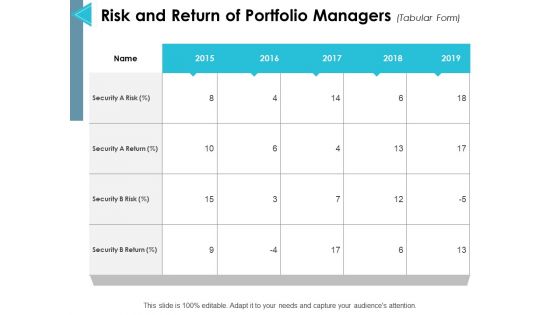
Risk And Return Of Portfolio Managers Ppt PowerPoint Presentation Infographic Template Introduction
This is a risk and return of portfolio managers ppt powerpoint presentation infographic template introduction. The topics discussed in this diagram are management, marketing, business, strategy, planning. This is a completely editable PowerPoint presentation, and is available for immediate download.

Dried Red Chili In Bowl Ppt PowerPoint Presentation Infographic Template Introduction
This is a dried red chili in bowl ppt powerpoint presentation infographic template introduction. The topics discussed in this diagram are spices, red chilli, chilli pepper. This is a completely editable PowerPoint presentation, and is available for immediate download.

Image Of Three Red Chilies Ppt PowerPoint Presentation Infographic Template Objects
This is a image of three red chilies ppt powerpoint presentation infographic template objects. The topics discussed in this diagram are spices, red chilli, chilli pepper. This is a completely editable PowerPoint presentation, and is available for immediate download.
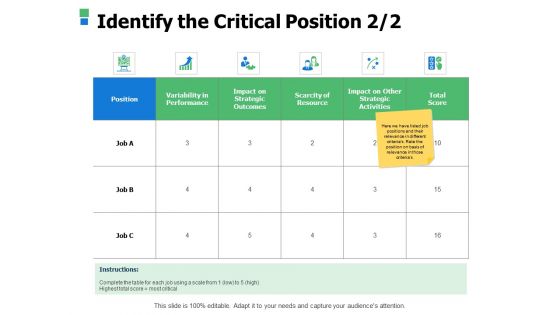
Identify The Critical Position Marketing Ppt Powerpoint Presentation Styles Infographic Template
This is a identify the critical position marketing ppt powerpoint presentation styles infographic template. The topics discussed in this diagram are business, management, planning, strategy, marketing. This is a completely editable PowerPoint presentation, and is available for immediate download.
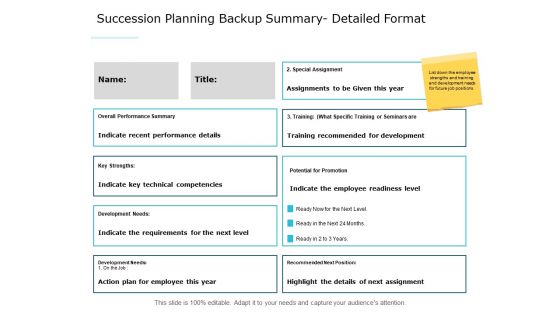
Succession Planning Backup Summary Detailed Format Ppt PowerPoint Presentation Infographic Template Structure
This is a succession planning backup summary detailed format ppt powerpoint presentation infographic template structure. The topics discussed in this diagram are marketing, business, management, planning, strategy This is a completely editable PowerPoint presentation, and is available for immediate download.
Briefcase Vector With Text Holders Ppt Powerpoint Presentation Infographic Template Graphic Images
This is a briefcase vector with text holders ppt powerpoint presentation infographic template graphic images. The topics discussed in this diagram are bag, briefcase, suitcase. This is a completely editable PowerPoint presentation, and is available for immediate download.
Major Roles And Responsibility Planning Ppt PowerPoint Presentation Infographic Template Slide
This is a major roles and responsibility planning ppt powerpoint presentation infographic template slide. The topics discussed in this diagram are marketing, business, management, planning, strategy This is a completely editable PowerPoint presentation and is available for immediate download.
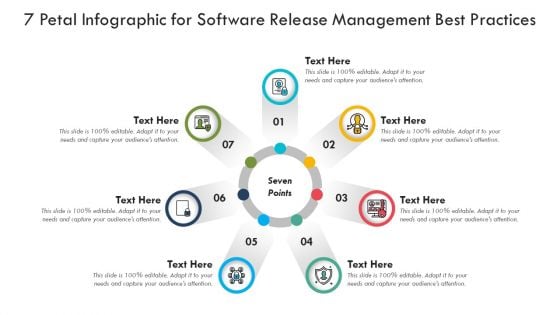
7 Petal Infographic For Software Release Management Best Practices Ppt PowerPoint Presentation File Portrait PDF
Presenting 7 petal infographic for software release management best practices ppt powerpoint presentation file portrait pdf to dispense important information. This template comprises seven stages. It also presents valuable insights into the topics including 7 petal infographic for software release management best practices. This is a completely customizable PowerPoint theme that can be put to use immediately. So, download it and address the topic impactfully.
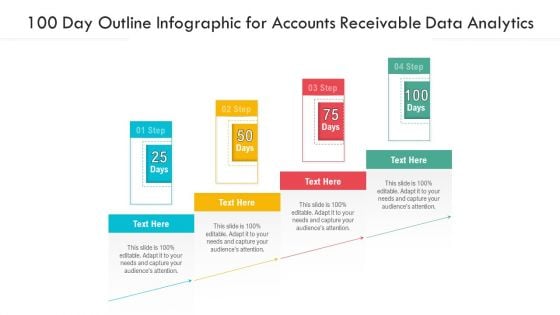
100 Day Outline Infographic For Accounts Receivable Data Analytics Ppt PowerPoint Presentation Gallery Picture PDF
Presenting 100 day outline infographic for accounts receivable data analytics ppt powerpoint presentation gallery picture pdf to dispense important information. This template comprises four stages. It also presents valuable insights into the topics including 100 day outline infographic for accounts receivable data analytics. This is a completely customizable PowerPoint theme that can be put to use immediately. So, download it and address the topic impactfully.
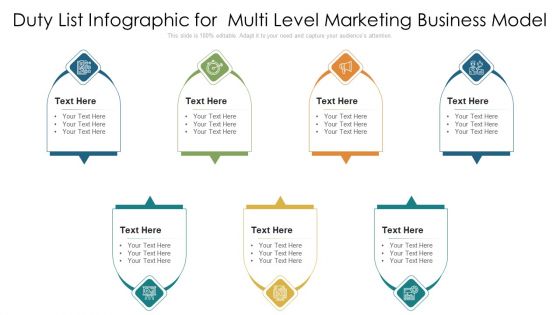
Duty List Infographic For Multi Level Marketing Business Model Ppt PowerPoint Presentation Pictures Graphic Tips PDF
Presenting duty list infographic for multi level marketing business model ppt powerpoint presentation pictures graphic tips pdf to dispense important information. This template comprises seven stages. It also presents valuable insights into the topics including duty list infographic for multi level marketing business model. This is a completely customizable PowerPoint theme that can be put to use immediately. So, download it and address the topic impactfully.

Ten Point Infographic Slide For Low Interest Business Startup Loans Ppt PowerPoint Presentation Outline Template PDF
Presenting ten point infographic slide for low interest business startup loans ppt powerpoint presentation outline template pdf to dispense important information. This template comprises ten stages. It also presents valuable insights into the topics including ten point infographic slide for low interest business startup loans. This is a completely customizable PowerPoint theme that can be put to use immediately. So, download it and address the topic impactfully.
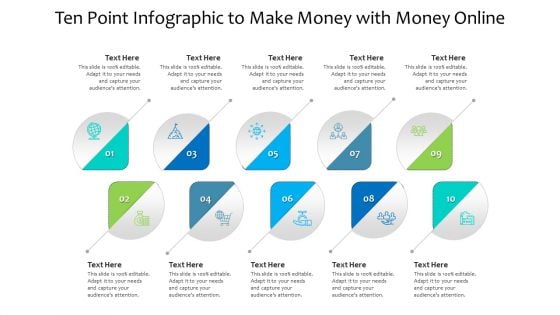
Ten Point Infographic To Make Money With Money Online Ppt PowerPoint Presentation Summary Format Ideas PDF
Presenting ten point infographic to make money with money online ppt powerpoint presentation summary format ideas pdf to dispense important information. This template comprises ten stages. It also presents valuable insights into the topics including ten point infographic to make money with money online. This is a completely customizable PowerPoint theme that can be put to use immediately. So, download it and address the topic impactfully.
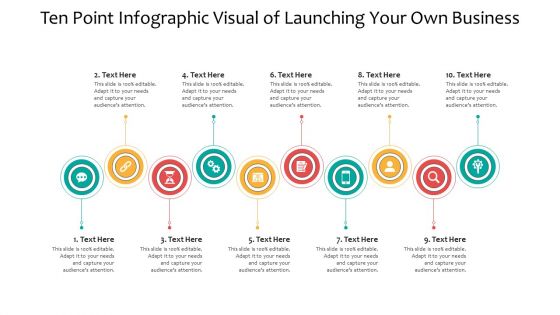
Ten Point Infographic Visual Of Launching Your Own Business Ppt PowerPoint Presentation Model Example PDF
Presenting ten point infographic visual of launching your own business ppt powerpoint presentation model example pdf to dispense important information. This template comprises ten stages. It also presents valuable insights into the topics including ten point infographic visual of launching your own business. This is a completely customizable PowerPoint theme that can be put to use immediately. So, download it and address the topic impactfully.
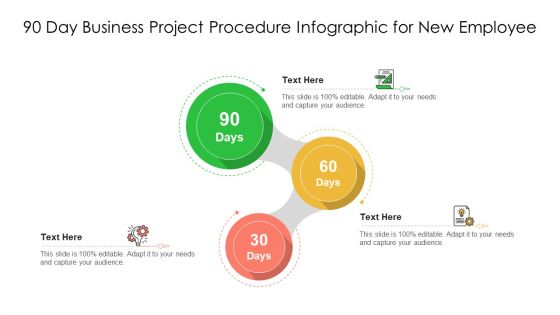
90 Day Business Project Procedure Infographic For New Employee Ppt PowerPoint Presentation File Picture PDF
Presenting 90 day business project procedure infographic for new employee ppt powerpoint presentation file picture pdf to dispense important information. This template comprises three stages. It also presents valuable insights into the topics including 90 day business project procedure infographic for new employee. This is a completely customizable PowerPoint theme that can be put to use immediately. So, download it and address the topic impactfully.
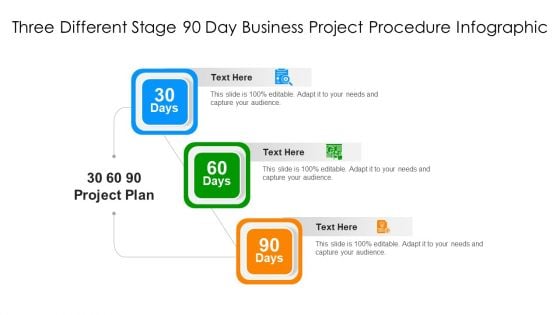
Three Different Stage 90 Day Business Project Procedure Infographic Ppt PowerPoint Presentation File Example PDF
Presenting three different stage 90 day business project procedure infographic ppt powerpoint presentation file example pdf to dispense important information. This template comprises three stages. It also presents valuable insights into the topics including three different stage 90 day business project procedure infographic. This is a completely customizable PowerPoint theme that can be put to use immediately. So, download it and address the topic impactfully.
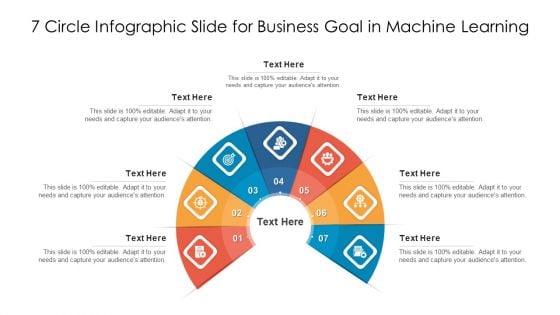
7 Circle Infographic Slide For Business Goal In Machine Learning Ppt PowerPoint Presentation Pictures Show PDF
Presenting 7 circle infographic slide for business goal in machine learning ppt powerpoint presentation pictures show pdf to dispense important information. This template comprises seven stages. It also presents valuable insights into the topics including 7 circle infographic slide for business goal in machine learning. This is a completely customizable PowerPoint theme that can be put to use immediately. So, download it and address the topic impactfully.
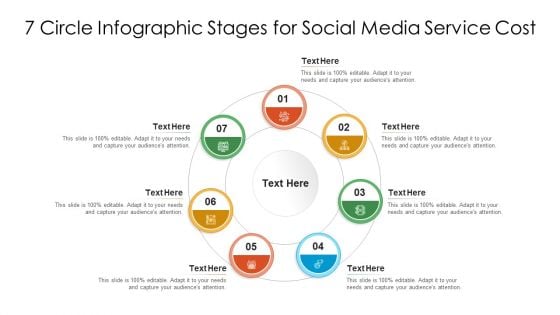
7 Circle Infographic Stages For Social Media Service Cost Ppt PowerPoint Presentation Outline Summary PDF
Presenting 7 circle infographic stages for social media service cost ppt powerpoint presentation outline summary pdf to dispense important information. This template comprises seven stages. It also presents valuable insights into the topics including 7 circle infographic stages for social media service cost. This is a completely customizable PowerPoint theme that can be put to use immediately. So, download it and address the topic impactfully.
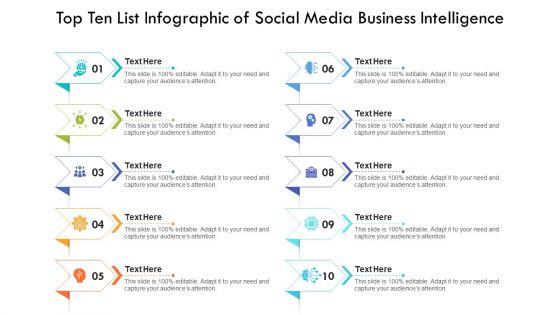
Top Ten List Infographic Of Social Media Business Intelligence Ppt PowerPoint Presentation Professional Elements PDF
Presenting top ten list infographic of social media business intelligence ppt powerpoint presentation professional elements pdf to dispense important information. This template comprises ten stages. It also presents valuable insights into the topics including top ten list infographic of social media business intelligence. This is a completely customizable PowerPoint theme that can be put to use immediately. So, download it and address the topic impactfully.
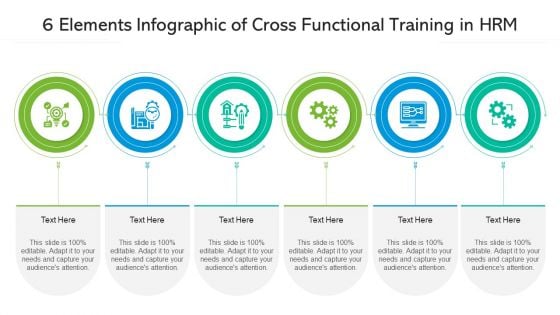
6 Elements Infographic Of Cross Functional Training In HRM Ppt PowerPoint Presentation File Influencers PDF
Presenting 6 elements infographic of cross functional training in hrm ppt powerpoint presentation file influencers pdf to dispense important information. This template comprises six stages. It also presents valuable insights into the topics including 6 elements infographic of cross functional training in hrm. This is a completely customizable PowerPoint theme that can be put to use immediately. So, download it and address the topic impactfully.

 Home
Home