Infographic Icons
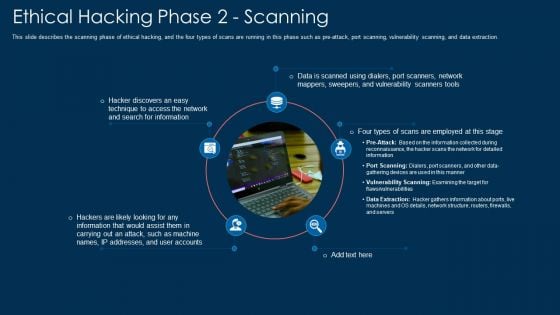
Ethical Hacking Phase 2 Scanning Ppt Infographic Template Design Templates PDF
This slide describes the scanning phase of ethical hacking, and the four types of scans are running in this phase such as pre-attack, port scanning, vulnerability scanning, and data extraction. This is a ethical hacking phase 2 scanning ppt infographic template design templates pdf template with various stages. Focus and dispense information on five stages using this creative set, that comes with editable features. It contains large content boxes to add your information on topics like information, network, technique. You can also showcase facts, figures, and other relevant content using this PPT layout. Grab it now.
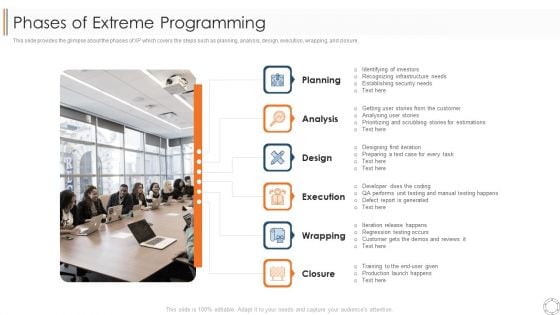
Various Agile Methodologies Phases Of Extreme Programming Ppt Infographic Template Graphics PDF
This slide provides the glimpse about the phases of XP which covers the steps such as planning, analysis, design, execution, wrapping, and closure. This is a various agile methodologies phases of extreme programming ppt infographic template graphics pdf template with various stages. Focus and dispense information on six stages using this creative set, that comes with editable features. It contains large content boxes to add your information on topics like planning, analysis, design, execution, wrapping, closure. You can also showcase facts, figures, and other relevant content using this PPT layout. Grab it now.
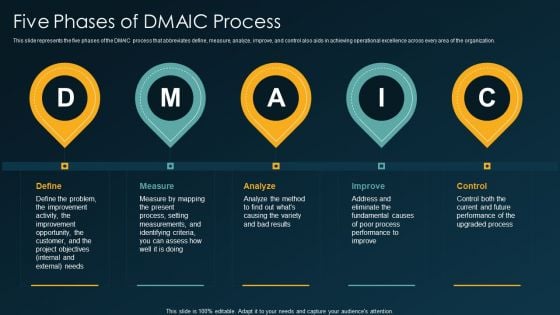
Six Sigma Methodology IT Five Phases Of DMAIC Process Ppt Infographic Template Graphic Images PDF
This slide represents the five phases of the DMAIC process that abbreviates define, measure, analyze, improve, and control also aids in achieving operational excellence across every area of the organization. Presenting six sigma methodology it five phases of dmaic process ppt infographic template graphic images pdf to provide visual cues and insights. Share and navigate important information on five stages that need your due attention. This template can be used to pitch topics like define, measure, analyze, improve, control. In addtion, this PPT design contains high resolution images, graphics, etc, that are easily editable and available for immediate download.
Enterprise Risk Management About Us Ppt Infographic Template Slide Portrait PDF
Whether you have daily or monthly meetings, a brilliant presentation is necessary. Enterprise Risk Management About Us Ppt Infographic Template Slide Portrait PDF can be your best option for delivering a presentation. Represent everything in detail using Enterprise Risk Management About Us Infographics PDF and make yourself stand out in meetings. The template is versatile and follows a structure that will cater to your requirements. All the templates prepared by Slidegeeks are easy to download and edit. Our research experts have taken care of the corporate themes as well. So, give it a try and see the results.
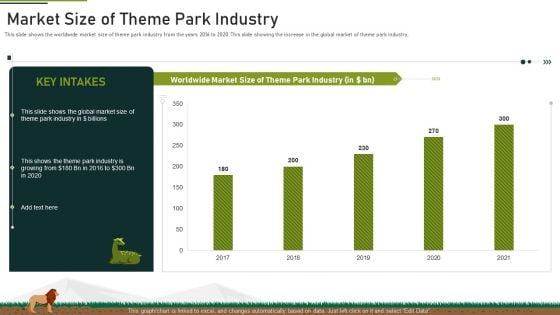
Market Size Of Theme Park Industry Ppt Infographic Template Microsoft PDF
This slide shows the worldwide market size of theme park industry from the years 2016 to 2020. This slide showing the increase in the global market of theme park industry. Deliver and pitch your topic in the best possible manner with this market size of theme park industry ppt infographic template microsoft pdf. Use them to share invaluable insights on market size of theme park industry and impress your audience. This template can be altered and modified as per your expectations. So, grab it now.
Nestle Performance Management Report Venn Diagram Ppt Infographic Template Master Slide PDF
This modern and well-arranged Nestle Performance Management Report Venn Diagram Ppt Infographic Template Master Slide PDF provides lots of creative possibilities. It is very simple to customize and edit with the Powerpoint Software. Just drag and drop your pictures into the shapes. All facets of this template can be edited with Powerpoint, no extra software is necessary. Add your own material, put your images in the places assigned for them, adjust the colors, and then you can show your slides to the world, with an animated slide included.
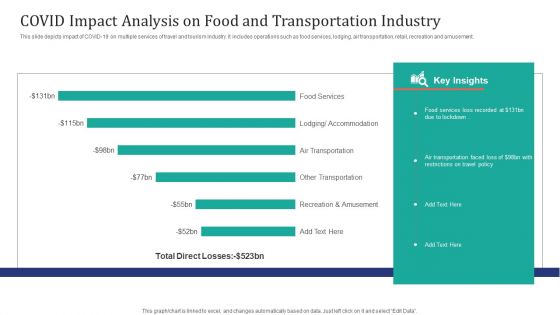
COVID Impact Analysis On Food And Transportation Industry Ppt Infographic Template Diagrams PDF
This slide depicts impact of COVID-19 on multiple services of travel and tourism industry. It includes operations such as food services, lodging, air transportation, retail, recreation and amusement. Showcasing this set of slides titled COVID Impact Analysis On Food And Transportation Industry Ppt Infographic Template Diagrams PDF. The topics addressed in these templates are Food Services, Air Transportation Faced, Restrictions Travel Policy. All the content presented in this PPT design is completely editable. Download it and make adjustments in color, background, font etc. as per your unique business setting.
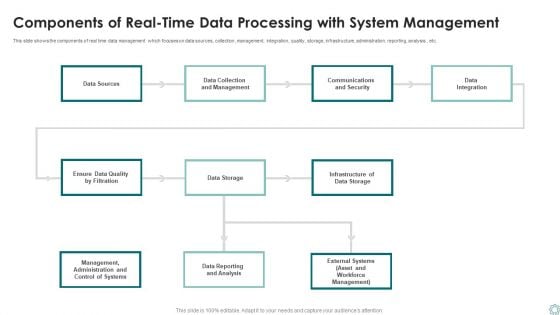
Components Of Real Time Data Processing With System Management Ppt Infographic Template Diagrams PDF
This slide shows the components of real time data management which focuses on data sources, collection, management, integration, quality, storage, infrastructure, administration, reporting, analysis, etc. Presenting Components Of Real Time Data Processing With System Management Ppt Infographic Template Diagrams PDF to dispense important information. This template comprises one stages. It also presents valuable insights into the topics including Data Storage, Data Sources, Data Integration. This is a completely customizable PowerPoint theme that can be put to use immediately. So, download it and address the topic impactfully.
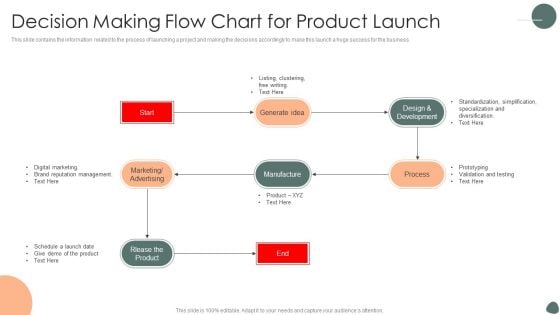
Decision Making Flow Chart For Product Launch Ppt Infographic Template Picture PDF
This slide contains the information related to the process of launching a project and making the decisions accordingly to make this launch a huge success for the business. Presenting Decision Making Flow Chart For Product Launch Ppt Infographic Template Picture PDF to dispense important information. This template comprises one stages. It also presents valuable insights into the topics including Generate Idea, Manufacture, Marketing, Advertising. This is a completely customizable PowerPoint theme that can be put to use immediately. So, download it and address the topic impactfully.
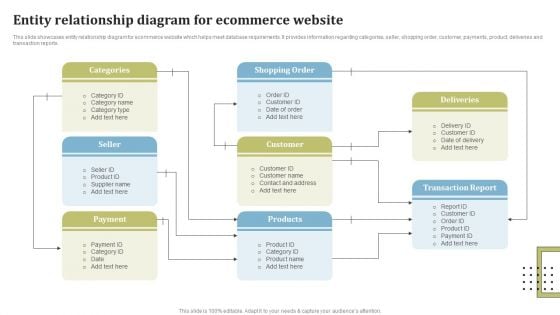
Entity Relationship Diagram For Ecommerce Website Ppt Infographic Template Samples PDF
This slide showcases entity relationship diagram for ecommerce website which helps meet database requirements. It provides information regarding categories, seller, shopping order, customer, payments, product, deliveries and transaction reports. Persuade your audience using this Entity Relationship Diagram For Ecommerce Website Ppt Infographic Template Samples PDF. This PPT design covers one stages, thus making it a great tool to use. It also caters to a variety of topics including Categories, Shopping Order, Deliveries, Transaction Report. Download this PPT design now to present a convincing pitch that not only emphasizes the topic but also showcases your presentation skills.

Business Restructuring Organization Chart After Restructuring Ppt Infographic Template Graphic Images PDF
This slide is covering organizational chart where chairman is at the top of the hierarchy and the other key board members with sub members. Presenting Business Restructuring Organization Chart After Restructuring Ppt Infographic Template Graphic Images PDF to provide visual cues and insights. Share and navigate important information on eight stages that need your due attention. This template can be used to pitch topics like Board Audit Committee, Board Safety Quality, Recruitment And Remuneration. In addtion, this PPT design contains high resolution images, graphics, etc, that are easily editable and available for immediate download.
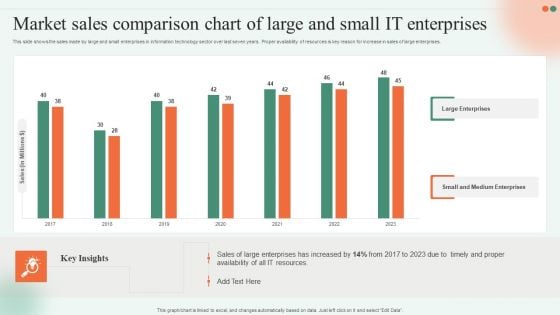
Market Sales Comparison Chart Of Large And Small IT Enterprises Ppt Infographic Template Background Image PDF
This slide shows the sales made by large and small enterprises in information technology sector over last seven years . Proper availability of resources is key reason for increase in sales of large enterprises. Showcasing this set of slides titled Market Sales Comparison Chart Of Large And Small IT Enterprises Ppt Infographic Template Background Image PDF. The topics addressed in these templates are Large Enterprises, Small And Medium, IT Resources. All the content presented in this PPT design is completely editable. Download it and make adjustments in color, background, font etc. as per your unique business setting.
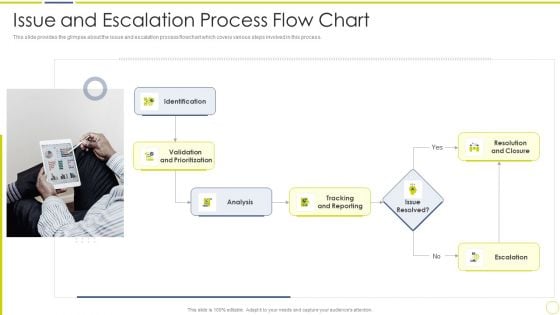
Incident And Issue Management Procedure Issue And Escalation Process Flow Chart Ppt Infographic Template Gridlines PDF
This slide provides the glimpse about the issue and escalation process flowchart which covers various steps involved in this process. Presenting incident and issue management procedure issue and escalation process flow chart ppt infographic template gridlines pdf to provide visual cues and insights. Share and navigate important information on seven stages that need your due attention. This template can be used to pitch topics like issue and escalation process flow chart. In addtion, this PPT design contains high resolution images, graphics, etc, that are easily editable and available for immediate download.
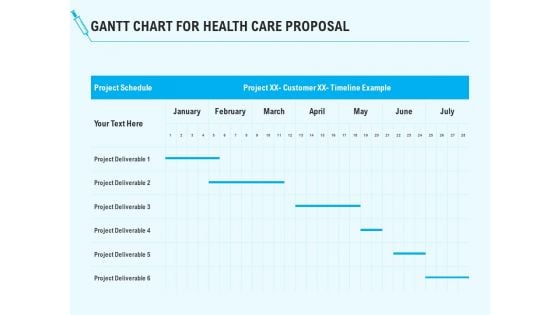
Health Care Gantt Chart For Health Care Proposal Ppt Infographic Template Topics PDF
Elucidate your project plan using our health care gantt chart for health care proposal ppt infographic template topics pdf. Capture the timeframe for every release by outlining crucial details like project beginning and end date, status, and assigned team. Establish coordination with other team members share your product plans, and discuss the project progress with the executives - using this template. Furthermore, this task management chart helps you align your activities efficiently. Utilize the versatile nature of this template to initiate high-level resource planning and implement it flexibly for the benefit of your business. The slide is easy-to-edit so download it and schedule your projects resourcefully.
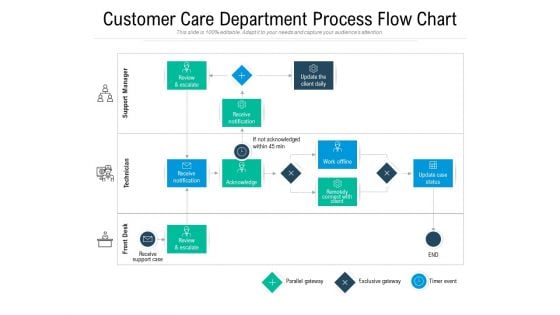
Customer Care Department Process Flow Chart Ppt PowerPoint Presentation Infographic Template Styles PDF
Persuade your audience using this customer care department process flow chart ppt powerpoint presentation infographic template styles pdf. This PPT design covers three stages, thus making it a great tool to use. It also caters to a variety of topics including review and escalate, receive notification, receive notification, acknowledge, remotely connect with client, work offline, update case status, parallel gateway, exclusive gateway, timer event. Download this PPT design now to present a convincing pitch that not only emphasizes the topic but also showcases your presentation skills.

Brand Customer Lifecycle Chart With Engage And Succeed Ppt PowerPoint Presentation File Infographic Template PDF
This slide exhibits matrix to evaluate brand customer journey. It includes major elements such as- build and test new solutions, analyze value and success insights etc. Pitch your topic with ease and precision using this brand customer lifecycle chart with engage and succeed ppt powerpoint presentation file infographic template pdf. This layout presents information on evaluation, adoption, mastery. It is also available for immediate download and adjustment. So, changes can be made in the color, design, graphics or any other component to create a unique layout.
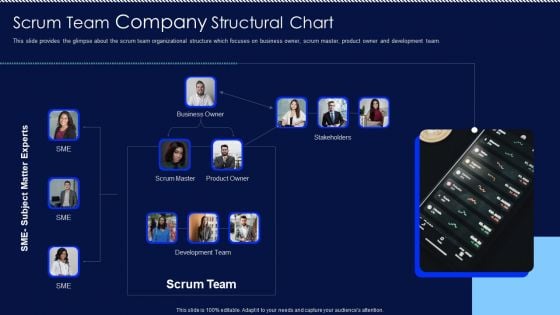
Scrum Team Company Structural Chart Ppt PowerPoint Presentation File Infographic Template PDF
This slide provides the glimpse about the scrum team organizational structure which focuses on business owner, scrum master, product owner and development team. From laying roadmaps to briefing everything in detail, our templates are perfect for you. You can set the stage with your presentation slides. All you have to do is download these easy to edit and customizable templates. Scrum Team Company Structural Chart Ppt PowerPoint Presentation File Infographic Template PDF will help you deliver an outstanding performance that everyone would remember and praise you for. Do download this presentation today.
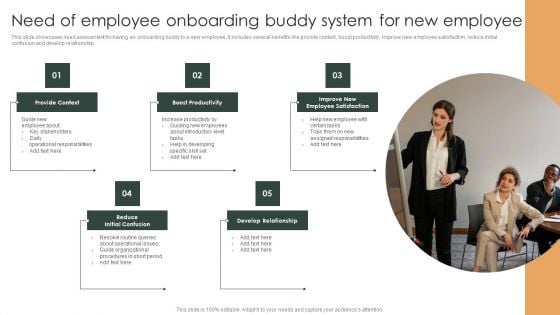
Need Of Employee Onboarding Buddy System For New Employee Ppt Infographic Template Diagrams PDF
This slide showcases need assessment for having an onboarding buddy to a new employee. It includes several benefits like provide context, boost productivity, improve new employee satisfaction, reduce initial confusion and develop relationship. Presenting Need Of Employee Onboarding Buddy System For New Employee Ppt Infographic Template Diagrams PDF to dispense important information. This template comprises five stages. It also presents valuable insights into the topics including Provide Context, Boost Productivity, Develop Relationship. This is a completely customizable PowerPoint theme that can be put to use immediately. So, download it and address the topic impactfully.
Consumer Packaged Goods Why Invest With Us Ppt Infographic Template Themes PDF
Purpose of this slide is to convince the potential investors to invest in the company by highlighting companys vision and growth potential. Presenting consumer packaged goods why invest with us ppt infographic template themes pdf to provide visual cues and insights. Share and navigate important information on two stages that need your due attention. This template can be used to pitch topics like investor, performing, growth, strategy, customer. In addtion, this PPT design contains high resolution images, graphics, etc, that are easily editable and available for immediate download.
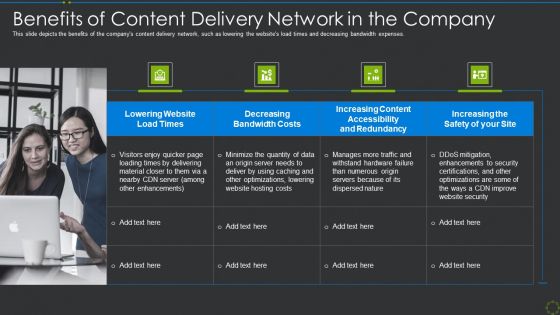
Benefits Of Content Delivery Network In The Company Ppt Infographic Template Themes PDF
This slide depicts the benefits of the companys content delivery network, such as lowering the websites load times and decreasing bandwidth expenses. This is a benefits of content delivery network in the company ppt infographic template themes pdf template with various stages. Focus and dispense information on four stages using this creative set, that comes with editable features. It contains large content boxes to add your information on topics like lowering website, decreasing bandwidth costs, accessibility and redundancy. You can also showcase facts, figures, and other relevant content using this PPT layout. Grab it now.
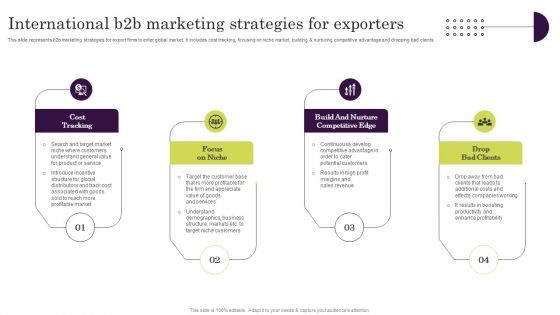
International B2B Marketing Strategies For Exporters Ppt Infographic Template Themes PDF
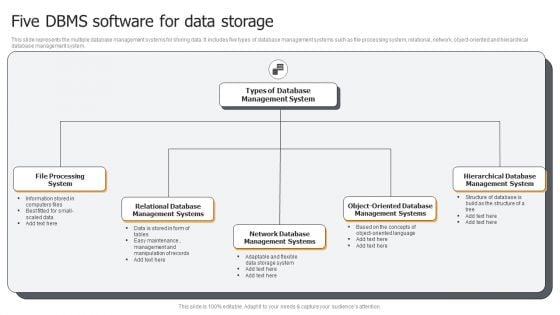
Five DBMS Software For Data Storage Ppt PowerPoint Presentation Gallery Infographic Template PDF
This slide represents the multiple database management systems for storing data. It includes five types of database management systems such as file processing system, relational, network, object-oriented and hierarchical database management system. Presenting Five DBMS Software For Data Storage Ppt PowerPoint Presentation Gallery Infographic Template PDF to dispense important information. This template comprises three stages. It also presents valuable insights into the topics including Types Database Management System, File Processing System, Relational Database, Management Systems. This is a completely customizable PowerPoint theme that can be put to use immediately. So, download it and address the topic impactfully.
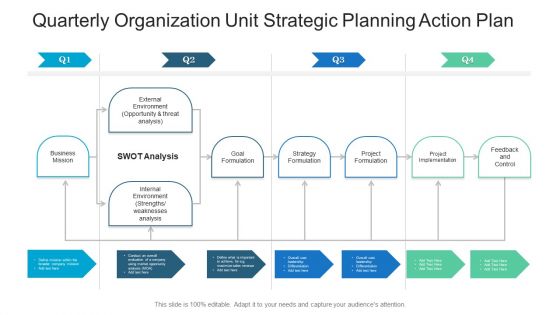
Quarterly Organization Unit Strategic Planning Action Plan Ppt Infographic Template Format Ideas PDF
Presenting our jaw-dropping quarterly organization unit strategic planning action plan ppt infographic template format ideas pdf. You can alternate the color, font size, font type, and shapes of this PPT layout according to your strategic process. This PPT presentation is compatible with Google Slides and is available in both standard screen and widescreen aspect ratios. You can also download this well-researched PowerPoint template design in different formats like PDF, JPG, and PNG. So utilize this visually-appealing design by clicking the download button given below.
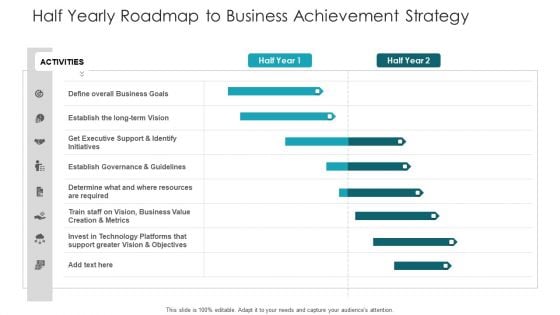
Half Yearly Roadmap To Business Achievement Strategy Ppt Infographic Template Guide PDF
Presenting the half yearly roadmap to business achievement strategy ppt infographic template guide pdf. The template includes a roadmap that can be used to initiate a strategic plan. Not only this, the PowerPoint slideshow is completely editable and you can effortlessly modify the font size, font type, and shapes according to your needs. This PPT slide can be easily reached in standard screen and widescreen aspect ratios. The set is also available in various formats like PDF, PNG, and JPG. So download and use it multiple times as per your knowledge.
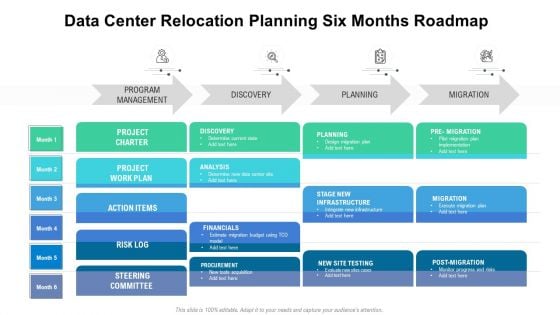
Data Center Relocation Planning Six Months Roadmap Ppt Infographic Template Background Images PDF
Presenting the data center relocation planning six months roadmap ppt infographic template background images pdf. The template includes a roadmap that can be used to initiate a strategic plan. Not only this, the PowerPoint slideshow is completely editable and you can effortlessly modify the font size, font type, and shapes according to your needs. This PPT slide can be easily reached in standard screen and widescreen aspect ratios. The set is also available in various formats like PDF, PNG, and JPG. So download and use it multiple times as per your knowledge.
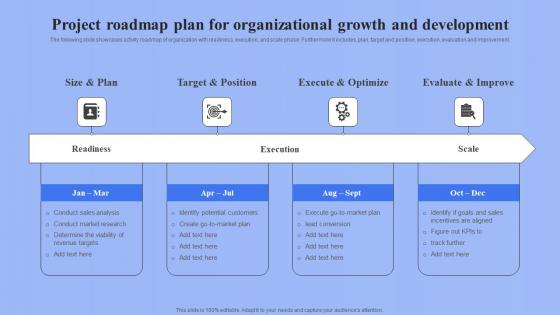
Project Roadmap Plan For Organizational Growth And Development Ppt Infographic Template pdf
The following slide showcases activity roadmap of organization with readiness, execution, and scale phase. Furthermore it includes, plan, target and position, execution, evaluation and improvement. Pitch your topic with ease and precision using this Project Roadmap Plan For Organizational Growth And Development Ppt Infographic Template pdf. This layout presents information on Target And Position, Execution, Evaluation And Improvement. It is also available for immediate download and adjustment. So, changes can be made in the color, design, graphics or any other component to create a unique layout. The following slide showcases activity roadmap of organization with readiness, execution, and scale phase. Furthermore it includes, plan, target and position, execution, evaluation and improvement.
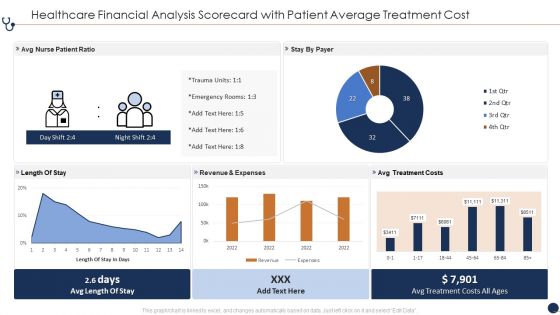
Healthcare Financial Analysis Scorecard With Patient Average Treatment Cost Ppt Infographic Template Slide Portrait PDF
This graph or chart is linked to excel, and changes automatically based on data. Just left click on it and select Edit Data. Deliver and pitch your topic in the best possible manner with this Healthcare Financial Analysis Scorecard With Patient Average Treatment Cost Ppt Infographic Template Slide Portrait PDF. Use them to share invaluable insights on Avg Nurse Patient, Revenue And Expenses, Avg Treatment Costs and impress your audience. This template can be altered and modified as per your expectations. So, grab it now.
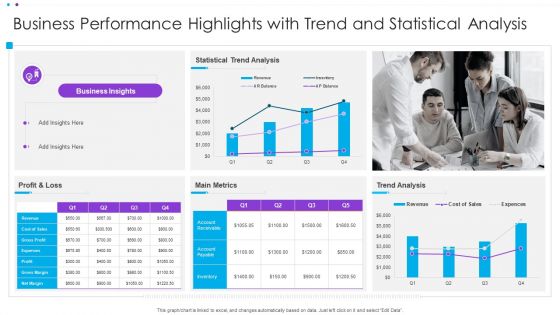
Business Performance Highlights With Trend And Statistical Analysis Ppt Infographic Template Display PDF
This graph or chart is linked to excel, and changes automatically based on data. Just left click on it and select Edit Data. Pitch your topic with ease and precision using this Business Performance Highlights With Trend And Statistical Analysis Ppt Infographic Template Display PDF. This layout presents information on Statistical Trend Analysis, Main Metrics, Profit And Loss. It is also available for immediate download and adjustment. So, changes can be made in the color, design, graphics or any other component to create a unique layout.
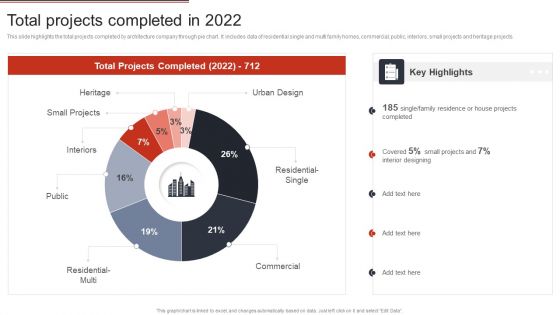
Building Design Firm Details Total Projects Completed In 2022 Ppt Infographic Template Graphics Pictures PDF
This slide highlights the total projects completed by architecture company through pie chart. It includes data of residential single and multi family homes, commercial, public, interiors, small projects and heritage projects. Deliver an awe inspiring pitch with this creative Building Design Firm Details Total Projects Completed In 2022 Ppt Infographic Template Graphics Pictures PDF bundle. Topics like Urban Design, Residential Single, Commercial, Interiors, Small Projects can be discussed with this completely editable template. It is available for immediate download depending on the needs and requirements of the user.
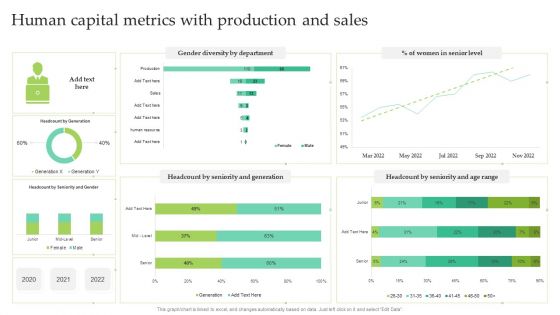
Human Capital Metrics With Production And Sales Ppt Infographic Template Summary PDF
This graph or chart is linked to excel, and changes automatically based on data. Just left click on it and select Edit Data. Showcasing this set of slides titled Human Capital Metrics With Production And Sales Ppt Infographic Template Summary PDF. The topics addressed in these templates are Women Senior Level, Gender Diversity Department, Seniority And Generation. All the content presented in this PPT design is completely editable. Download it and make adjustments in color, background, font etc. as per your unique business setting.
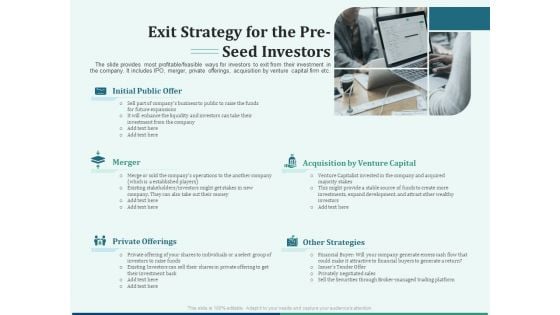
Early Stage Funding Exit Strategy For The Pre Seed Investors Ppt Infographic Template Diagrams PDF
The slide provides most profitable feasible ways for investors to exit from their investment in the company. It includes IPO, merger, private offerings, acquisition by venture capital firm etc. Presenting early stage funding exit strategy for the pre seed investors ppt infographic template diagrams pdf. to provide visual cues and insights. Share and navigate important information on five stages that need your due attention. This template can be used to pitch topics like development, business, investment, expansions, initial public offer. In addtion, this PPT design contains high-resolution images, graphics, etc, that are easily editable and available for immediate download.
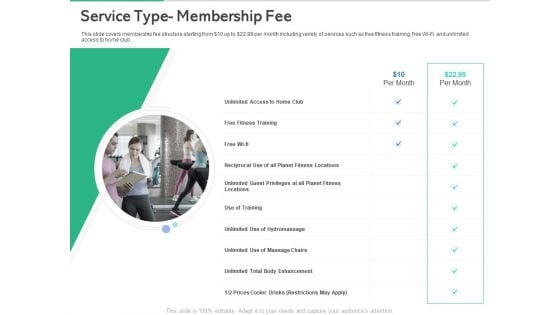
Market Overview Fitness Industry Service Type Membership Fee Ppt Infographic Template Diagrams PDF
This slide covers membership fee structure starting from dollar 10 up to dollar 22.99 per month including variety of services such as free fitness training, free Wi-Fi and unlimited access to home club. Deliver and pitch your topic in the best possible manner with this market overview fitness industry service type membership fee ppt infographic template diagrams pdf. Use them to share invaluable insights on service type membership fee and impress your audience. This template can be altered and modified as per your expectations. So, grab it now.
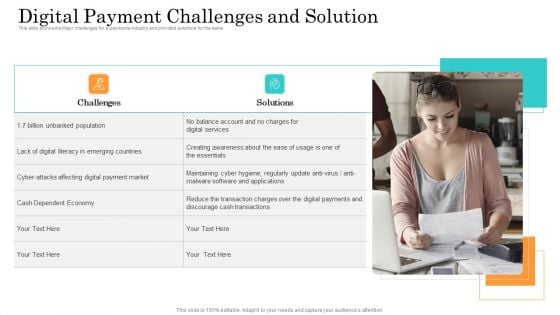
Online Payment Service Digital Payment Challenges And Solution Ppt Infographic Template Diagrams PDF
This slide shows the Major challenges for e payments industry and provided solutions for the same. This is a online payment service digital payment challenges and solution ppt infographic template diagrams pdf template with various stages. Focus and dispense information on two stages using this creative set, that comes with editable features. It contains large content boxes to add your information on topics like digital services, digital payments, cash dependent economy. You can also showcase facts, figures, and other relevant content using this PPT layout. Grab it now.
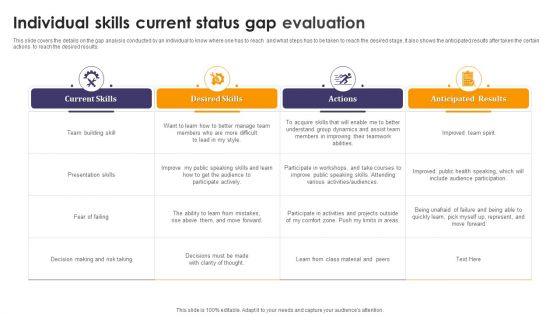
Individual Skills Current Status Gap Evaluation Ppt Infographic Template Diagrams PDF
This slide covers the details on the gap analysis conducted by an individual to know where one has to reach and what steps has to be taken to reach the desired stage. It also shows the anticipated results after taken the certain actions to reach the desired results. Pitch your topic with ease and precision using this Individual Skills Current Status Gap Evaluation Ppt Infographic Template Diagrams PDF. This layout presents information on Current Skills, Desired Skills, Actions, Anticipated Results. It is also available for immediate download and adjustment. So, changes can be made in the color, design, graphics or any other component to create a unique layout.
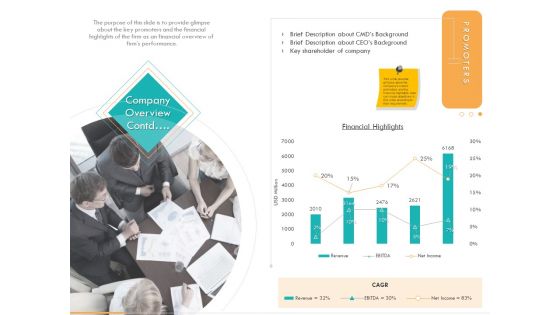
Business Planning And Strategy Playbook Company Overview Contd Ppt PowerPoint Presentation Infographic Template Rules PDF
The purpose of this slide is to provide glimpse about the key promoters and the financial highlights of the firm as an financial overview of firms performance. Deliver and pitch your topic in the best possible manner with this business planning and strategy playbook company overview contd ppt powerpoint presentation infographic template rules pdf. Use them to share invaluable insights on revenue, ebitda, net income, financial highlights and impress your audience. This template can be altered and modified as per your expectations. So, grab it now.

PPM Private Equity Key Streams Of Revenue Generation Ppt PowerPoint Presentation Infographic Template Show PDF
This slide shows Revenue Model of the Company with various revenue earning Channels that the Company has such as Online Stores, Product Sales, Subscription Fees etc. along with their respective percentage of the Total Revenue. Deliver an awe-inspiring pitch with this creative ppm private equity key streams of revenue generation ppt powerpoint presentation infographic template show pdf bundle. Topics like subscription fee technology, digital service, product sale, online sale, total revenue can be discussed with this completely editable template. It is available for immediate download depending on the needs and requirements of the user.
Employee Recognition Award Employee Performance Tracker Ppt PowerPoint Presentation Visual Aids Infographic Template PDF
The purpose of this slide is to provide various ways to track and measure employee performance levels and helps to choose low, average, good and high performers. Deliver and pitch your topic in the best possible manner with this employee recognition award employee performance tracker ppt powerpoint presentation visual aids infographic template pdf. Use them to share invaluable insights on performance levels, high performers vs non high performers, rating mark, employee and impress your audience. This template can be altered and modified as per your expectations. So, grab it now.
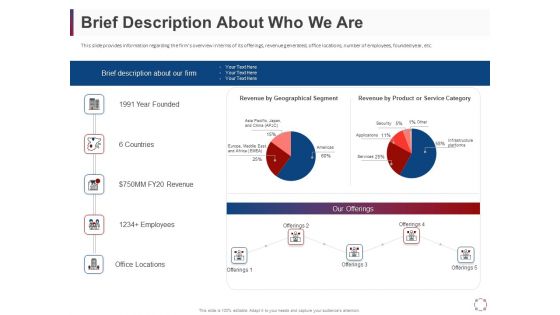
CSR Activities Company Reputation Management Brief Description About Who We Are Ppt Infographic Template Good PDF
This slide provides information regarding the firms overview in terms of its offerings, revenue generated, office locations, number of employees, founded year, etc. Deliver and pitch your topic in the best possible manner with this csr activities company reputation management brief description about who we are ppt infographic template good pdf. Use them to share invaluable insights on revenue by geographical segment, revenue by product or service category, office locations, employees and impress your audience. This template can be altered and modified as per your expectations. So, grab it now.
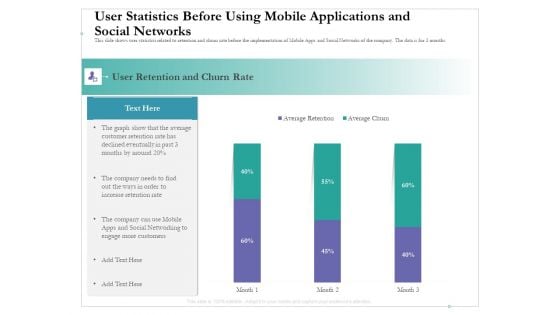
User Statistics Before Using Mobile Applications And Social Networks Ppt Summary Infographic Template PDF
This slide shows user statistics related to retention and churn rate before the implementation of Mobile Apps and Social Networks of the company. The data is for 3 months. Deliver and pitch your topic in the best possible manner with this user statistics before using mobile applications and social networks ppt summary infographic template pdf. Use them to share invaluable insights on user retention churn rate, social networking, engage more customers, declined eventually, average customer retention rate and impress your audience. This template can be altered and modified as per your expectations. So, grab it now.
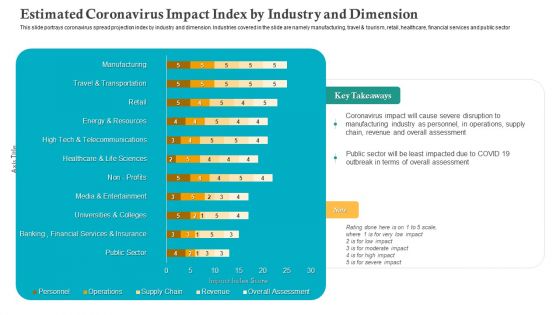
Estimated Coronavirus Impact Index By Industry And Dimension Ppt Styles Infographic Template PDF
This slide portrays coronavirus spread projection index by industry and dimension. Industries covered in the slide are namely manufacturing, travel and tourism, retail, healthcare, financial services and public sector. Deliver an awe inspiring pitch with this creative estimated coronavirus impact index by industry and dimension ppt styles infographic template pdf bundle. Topics like revenue and overall assessment, overall assessment, financial services, telecommunications can be discussed with this completely editable template. It is available for immediate download depending on the needs and requirements of the user.
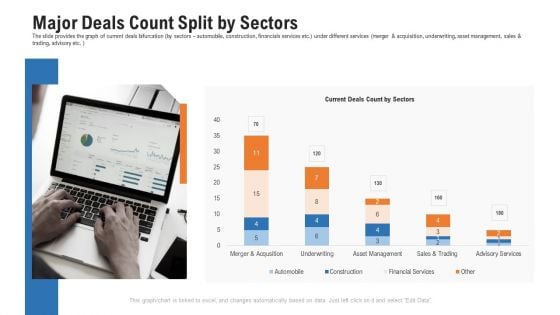
Pitch Deck For Procurement Deal Major Deals Count Split By Sectors Ppt Infographic Template Inspiration PDF
The slide provides the graph of current deals bifurcation by sectors automobile, construction, financials services etc. under different services merger and acquisition, underwriting, asset management, sales and trading, advisory etc. Deliver and pitch your topic in the best possible manner with this pitch deck for procurement deal major deals count split by sectors ppt infographic template inspiration pdf. Use them to share invaluable insights on current deals count by sectors, financial services, asset management, sales and trading, advisory services and impress your audience. This template can be altered and modified as per your expectations. So, grab it now.
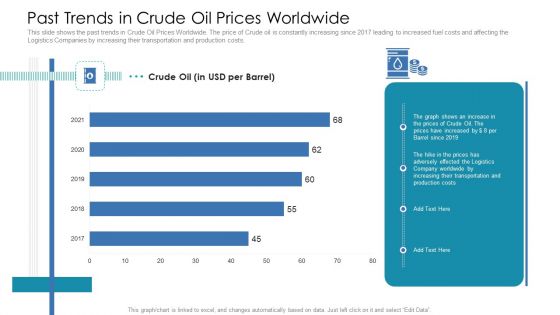
Past Trends In Crude Oil Prices Worldwide Ppt Infographic Template Gallery PDF
This slide shows the past trends in Crude Oil Prices Worldwide. The price of Crude oil is constantly increasing since 2017 leading to increased fuel costs and affecting the Logistics Companies by increasing their transportation and production costs.Deliver an awe-inspiring pitch with this creative past trends in crude oil prices worldwide ppt infographic template gallery pdf. bundle. Topics like past trends in crude oil prices worldwide, 2021 to 2017 can be discussed with this completely editable template. It is available for immediate download depending on the needs and requirements of the user.
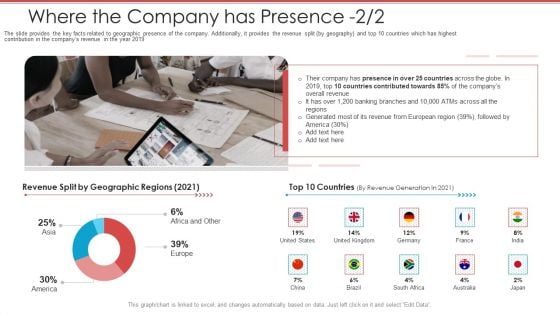
Cash Market Investor Deck Where The Company Has Presence Revenue Ppt Ideas Infographic Template PDF
The slide provides the key facts related to geographic presence of the company. Additionally, it provides the revenue split by geography and top 10 countries which has highest contribution in the companys revenue in the year 2019. Deliver and pitch your topic in the best possible manner with this cash market investor deck where the company has presence revenue ppt ideas infographic template pdf. Use them to share invaluable insights on where the company has presence and impress your audience. This template can be altered and modified as per your expectations. So, grab it now.
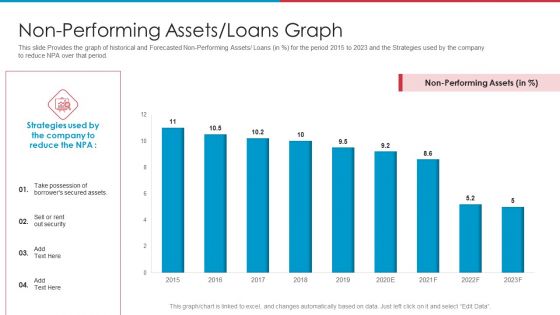
After IPO Equity Non Performing Assets Loans Graph Ppt Infographic Template Example Introduction PDF
This slide Provides the graph of historical and Forecasted Non-Performing Assets or Loans in percent for the period 2015 to 2023 and the Strategies used by the company to reduce NPA over that period. Deliver an awe-inspiring pitch with this creative after ipo equity non performing assets loans graph ppt infographic template example introduction pdf bundle. Topics like non performing assets or loans graph can be discussed with this completely editable template. It is available for immediate download depending on the needs and requirements of the user.
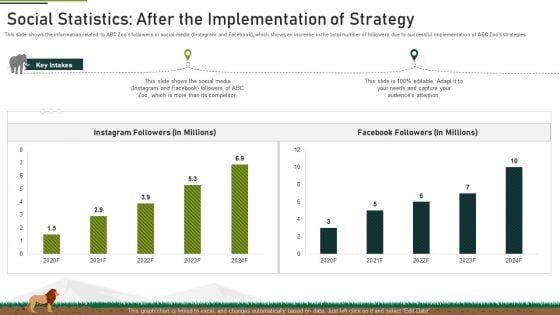
Social Statistics After The Implementation Of Strategy Ppt Infographic Template Styles PDF
This slide shows the information related to ABC Zoos followers in social media Instagram and Facebook, which shows an increase in the total number of followers due to successful implementation of ABC Zoos strategies. Deliver and pitch your topic in the best possible manner with this social statistics after the implementation of strategy ppt infographic template styles pdf. Use them to share invaluable insights on instagram followers, facebook followers and impress your audience. This template can be altered and modified as per your expectations. So, grab it now.
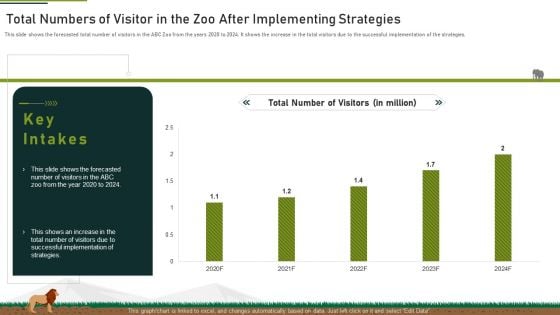
Total Numbers Of Visitor In The Zoo After Implementing Strategies Ppt Infographic Template Outfit PDF
This slide shows the forecasted total number of visitors in the ABC Zoo from the years 2020 to 2024. It shows the increase in the total visitors due to the successful implementation of the strategies.Deliver and pitch your topic in the best possible manner with this total numbers of visitor in the zoo after implementing strategies ppt infographic template outfit pdf. Use them to share invaluable insights on total numbers of visitor in the zoo after implementing strategies and impress your audience. This template can be altered and modified as per your expectations. So, grab it now.
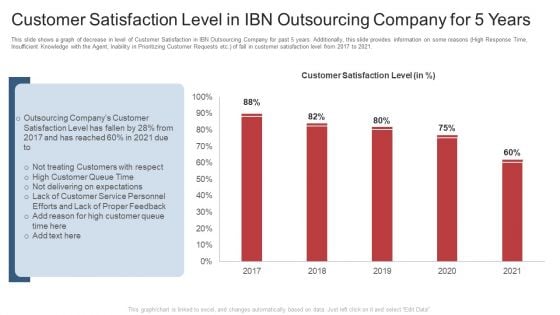
Customer Satisfaction Level In Ibn Outsourcing Company For 5 Years Ppt Pictures Infographic Template PDF
This slide shows a graph of decrease in level of Customer Satisfaction in IBN Outsourcing Company for past 5 years. Additionally, this slide provides information on some reasons High Response Time, Insufficient Knowledge with the Agent, Inability in Prioritizing Customer Requests etc. of fall in customer satisfaction level from 2017 to 2021. Deliver an awe-inspiring pitch with this creative customer satisfaction level in ibn outsourcing company for 5 years ppt pictures infographic template pdf. bundle. Topics like customer satisfaction level in ibn outsourcing company for 5 years can be discussed with this completely editable template. It is available for immediate download depending on the needs and requirements of the user.
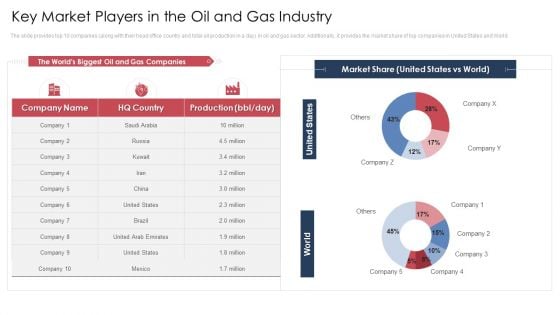
Key Market Players In The Oil And Gas Industry Ppt Infographic Template Grid PDF
The slide provides top 10 companies along with their head office country and total oil production in a day in oil and gas sector. Additionally, it provides the market share of top companies in United States and World.Deliver an awe-inspiring pitch with this creative key market players in the oil and gas industry ppt infographic template grid pdf. bundle. Topics like market share, the worlds biggest oil and gas companiescan be discussed with this completely editable template. It is available for immediate download depending on the needs and requirements of the user.

Cybersecurity And Hacking Incidents In ABS Healthcare Company Ppt Infographic Template Graphics Example PDF
This slide shows the graph of total number of Cybersecurity and Hacking Incidents in ABS Healthcare Company from the year 2017 to 2021. Additionally, it provides key insights growth rate, key recommendation, reasons etc. related to growing cybersecurity and hacking incidents. Deliver an awe inspiring pitch with this creative cybersecurity and hacking incidents in abs healthcare company ppt infographic template graphics example pdf bundle. Topics like cybersecurity and hacking incidents in abs healthcare company can be discussed with this completely editable template. It is available for immediate download depending on the needs and requirements of the user.
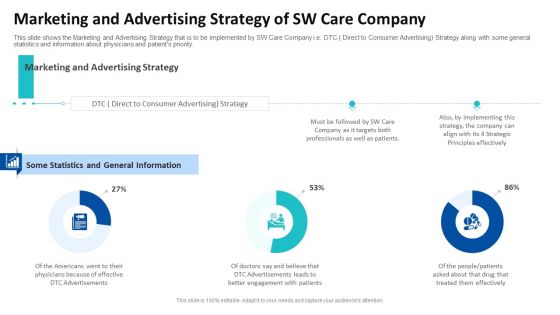
Marketing And Advertising Strategy Of SW Care Company Ppt Infographic Template Graphic Images PDF
This slide shows the Marketing and Advertising Strategy that is to be implemented by SW Care Company i.e. DTC Direct to Consumer Advertising Strategy along with some general statistics and information about physicians and patients priority. Deliver and pitch your topic in the best possible manner with this marketing and advertising strategy of sw care company ppt infographic template graphic images pdf. Use them to share invaluable insights on strategic, implementing, strategy and impress your audience. This template can be altered and modified as per your expectations. So, grab it now.
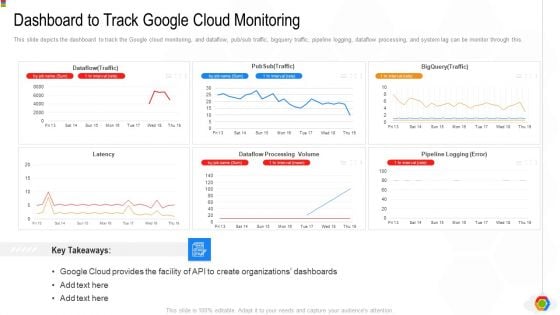
Google Cloud Console IT Dashboard To Track Google Cloud Monitoring Ppt Infographic Template Guide PDF
This slide depicts the dashboard to track the Google cloud monitoring, and dataflow, pub or sub traffic, bigquery traffic, pipeline logging, dataflow processing, and system lag can be monitor through this. Deliver an awe inspiring pitch with this creative google cloud console it dashboard to track google cloud monitoring ppt infographic template guide pdf bundle. Topics like dataflow processing volume, pipeline logging, organizations dashboards, latency can be discussed with this completely editable template. It is available for immediate download depending on the needs and requirements of the user.

RPA IT Problems Faced By The Organization Ppt Infographic Template Demonstration PDF
This slide depicts the monthly analysis of the organizations current situation by covering details of staff engagement, efficiency and productivity, errors and level of customer service. Deliver and pitch your topic in the best possible manner with this rpa it problems faced by the organization ppt infographic template demonstration pdf. Use them to share invaluable insights on efficiency, services, current scenario, staff engagement, efficiency and productivity and impress your audience. This template can be altered and modified as per your expectations. So, grab it now.
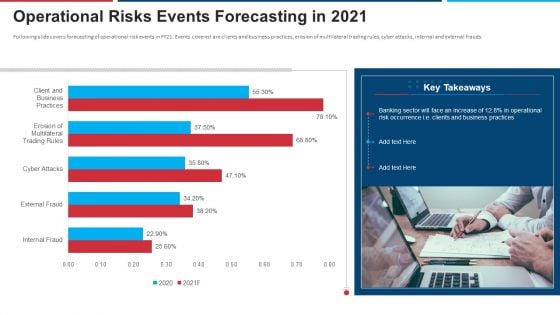
Mitigation Strategies For Operational Threat Operational Risks Events Forecasting In 2021 Ppt Infographic Template Microsoft PDF
Following slide covers forecasting of operational risk events in FY21. Events covered are clients and business practices, erosion of multilateral trading rules, cyber attacks, internal and external frauds. Deliver and pitch your topic in the best possible manner with this mitigation strategies for operational threat operational risks events forecasting in 2021 ppt infographic template microsoft pdf. Use them to share invaluable insights on banking, operational risk, occurrence, business and impress your audience. This template can be altered and modified as per your expectations. So, grab it now.
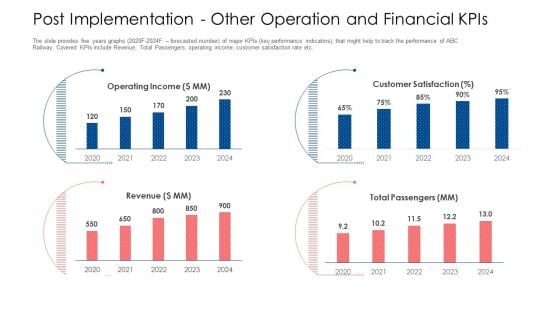
Post Implementation Other Operation And Financial Kpis Ppt Infographic Template PDF
The slide provides five years graphs 2020F-2024F forecasted number of major KPIs key performance indicators, that might help to track the performance of ABC Railway. Covered KPIs include Revenue, Total Passengers, operating income, customer satisfaction rate etc. Deliver an awe inspiring pitch with this creative post implementation other operation and financial kpis ppt infographic template pdf bundle. Topics like operating income, revenue, customer satisfaction can be discussed with this completely editable template. It is available for immediate download depending on the needs and requirements of the user.
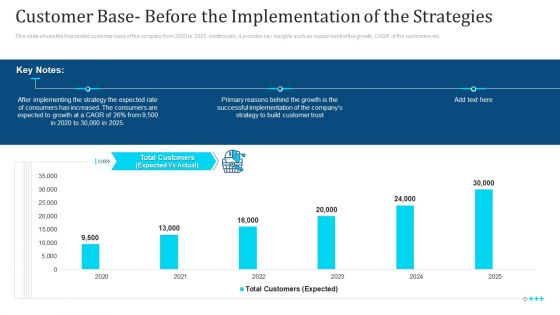
Customer Base Before The Implementation Of The Strategies Growth Ppt Infographic Template Clipart Images PDF
This slide shows the forecasted customer base of the company from 2020 to 2025. Additionally, it provides key insights such as reason behind the growth, CAGR of the customers etc. Deliver an awe inspiring pitch with this creative customer base before the implementation of the strategies growth ppt infographic template clipart images pdf bundle. Topics like customer base before the implementation of the strategies can be discussed with this completely editable template. It is available for immediate download depending on the needs and requirements of the user.
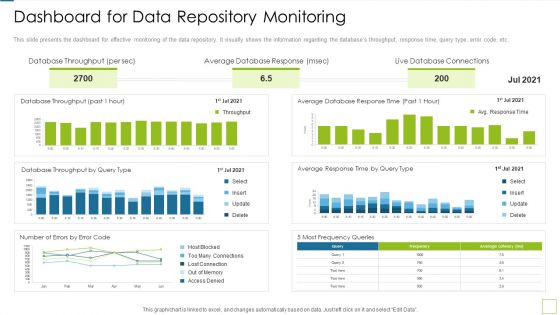
Database Expansion And Optimization Dashboard For Data Repository Monitoring Ppt Model Infographic Template
This slide presents the dashboard for effective monitoring of the data repository. It visually shows the information regarding the databases throughput, response time, query type, error code, etc. Deliver and pitch your topic in the best possible manner with this database expansion and optimization dashboard for data repository monitoring ppt model infographic template. Use them to share invaluable insights on database throughput, average database response, live database connections and impress your audience. This template can be altered and modified as per your expectations. So, grab it now.
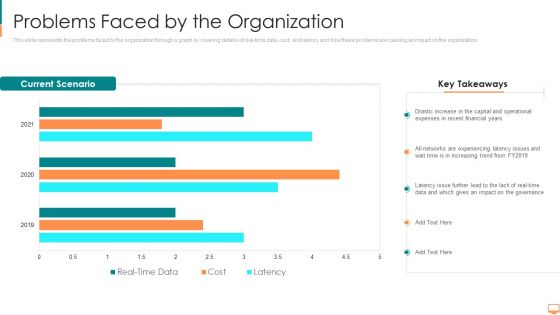
Problems Faced By The Organization Ppt Infographic Template Design Templates PDF
This slide represents the problems faced by the organization through a graph by covering details of real time data, cost, and latency and how these problems are causing an impact on the organization. Deliver and pitch your topic in the best possible manner with this problems faced by the organization ppt infographic template design templates pdf. Use them to share invaluable insights on problems faced by the organization and impress your audience. This template can be altered and modified as per your expectations. So, grab it now.
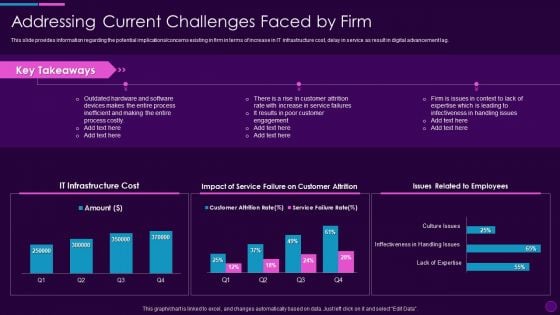
Cognitive Computing Action Plan Addressing Current Challenges Faced By Firm Ppt Outline Infographic Template PDF
This slide provides information regarding the potential implications concerns existing in firm in terms of increase in IT infrastructure cost, delay in service as result in digital advancement lag. Deliver an awe inspiring pitch with this creative cognitive computing action plan addressing current challenges faced by firm ppt outline infographic template pdf bundle. Topics like it infrastructure cost, customer attrition, issues related to employees can be discussed with this completely editable template. It is available for immediate download depending on the needs and requirements of the user.
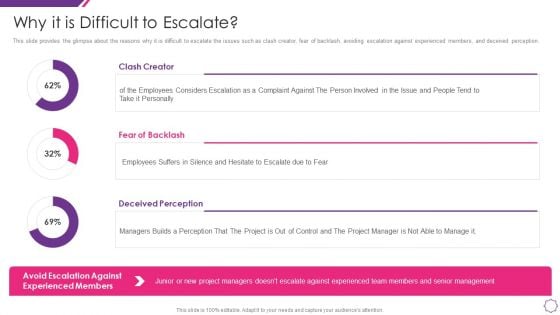
Handle Project Escalations Why It Is Difficult To Escalate Ppt Infographic Template Samples PDF
This slide provides the glimpse about the reasons why it is difficult to escalate the issues such as clash creator, fear of backlash, avoiding escalation against experienced members, and deceived perception. Deliver an awe inspiring pitch with this creative handle project escalations why it is difficult to escalate ppt infographic template samples pdf bundle. Topics like clash creator, fear of backlash, deceived perception can be discussed with this completely editable template. It is available for immediate download depending on the needs and requirements of the user.
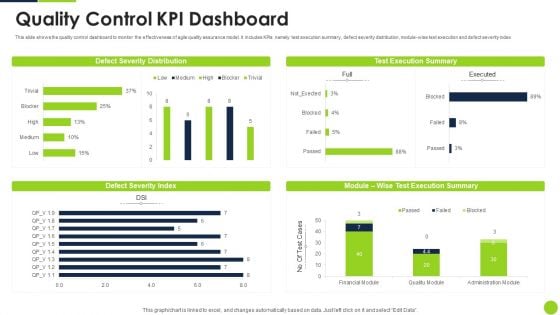
Agile Methodology Quality Control Quality Control KPI Dashboard Ppt Infographic Template Layout Ideas PDF
This slide shows the quality control dashboard to monitor the effectiveness of agile quality assurance model. It includes KPIs namely test execution summary, defect severity distribution, module-wise text execution and defect severity index Deliver an awe inspiring pitch with this creative agile methodology quality control quality control kpi dashboard ppt infographic template layout ideas pdf bundle. Topics like quality control kpi dashboard can be discussed with this completely editable template. It is available for immediate download depending on the needs and requirements of the user.

Impact On Organization After Implementing Information Technology Security Ppt Infographic Template Examples PDF
This slide depicts the hardware software update measure under the network security model. It also tells the current status of the devices that need to update in the organization. Deliver and pitch your topic in the best possible manner with this impact on organization after implementing information technology security ppt infographic template examples pdf. Use them to share invaluable insights on hardware and software update in company and impress your audience. This template can be altered and modified as per your expectations. So, grab it now.
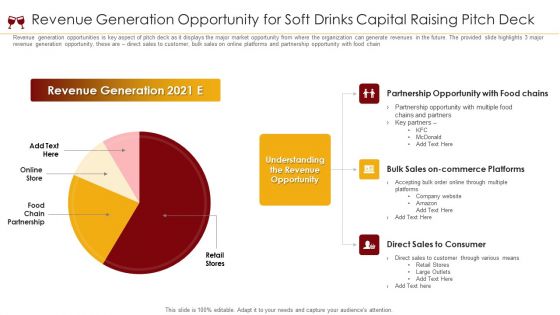
Revenue Generation Opportunity For Soft Drinks Capital Raising Pitch Deck Ppt Infographic Template Slides PDF
Revenue generation opportunities is key aspect of pitch deck as it displays the major market opportunity from where the organization can generate revenues in the future. The provided slide highlights 3 major revenue generation opportunity, these are direct sales to customer, bulk sales on online platforms and partnership opportunity with food chain. Deliver an awe inspiring pitch with this creative revenue generation opportunity for soft drinks capital raising pitch deck ppt infographic template slides pdf bundle. Topics like revenue generation 2021, online store, food chain partnership, retail stores can be discussed with this completely editable template. It is available for immediate download depending on the needs and requirements of the user.
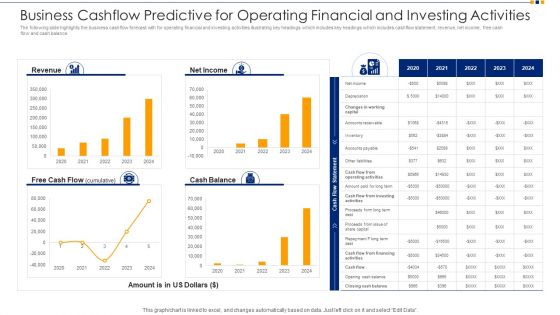
Business Cashflow Predictive For Operating Financial And Investing Activities Ppt Inspiration Infographic Template PDF
The following slide highlights the business cashflow forecast with for operating financial and investing activities illustrating key headings which includes key headings which includes cashflow statement, revenue, net income, free cash flow and cash balance. Pitch your topic with ease and precision using this business cashflow predictive for operating financial and investing activities ppt inspiration infographic template pdf. This layout presents information on revenue, net income, free cash flow, cash balance, 2020 to 2024. It is also available for immediate download and adjustment. So, changes can be made in the color, design, graphics or any other component to create a unique layout.
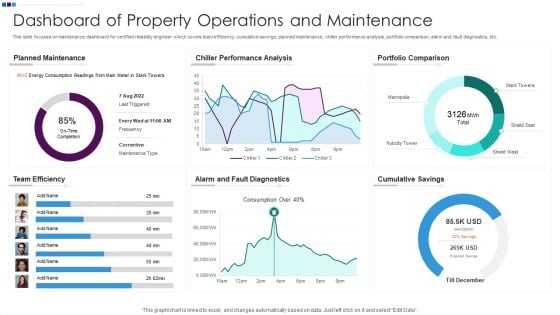
Dashboard Of Property Operations And Maintenance Ppt Infographic Template Objects PDF
This slide focuses on maintenance dashboard for certified reliability engineer which covers team efficiency, cumulative savings, planned maintenance, chiller performance analysis, portfolio comparison, alarm and fault diagnostics, etc. Pitch your topic with ease and precision using this Dashboard Of Property Operations And Maintenance Ppt Infographic Template Objects PDF. This layout presents information on Planned Maintenance Efficiency, Chiller Performance Analysis, Portfolio Comparison Team, Alarm And Fault. It is also available for immediate download and adjustment. So, changes can be made in the color, design, graphics or any other component to create a unique layout.
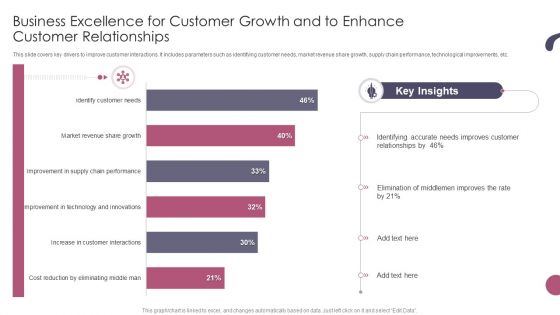
Business Excellence For Customer Growth And To Enhance Customer Relationships Ppt Infographic Template Styles PDF
This slide covers key drivers to improve customer interactions. It includes parameters such as identifying customer needs, market revenue share growth, supply chain performance, technological improvements, etc. Pitch your topic with ease and precision using this Business Excellence For Customer Growth And To Enhance Customer Relationships Ppt Infographic Template Styles PDF. This layout presents information on Business Excellence, Customer Growth, Customer Relationships. It is also available for immediate download and adjustment. So, changes can be made in the color, design, graphics or any other component to create a unique layout.
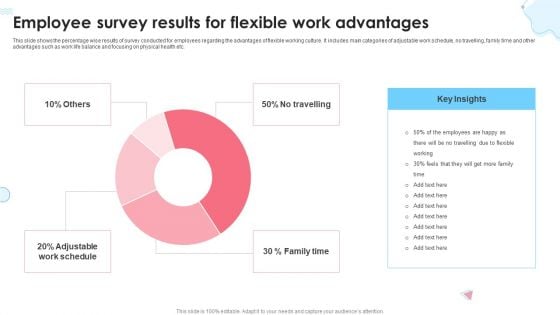
Employee Survey Results For Flexible Work Advantages Ppt Infographic Template Guidelines PDF
This slide shows the percentage wise results of survey conducted for employees regarding the advantages of flexible working culture. It includes main categories of adjustable work schedule, no travelling, family time and other advantages such as work life balance and focusing on physical health etc. Pitch your topic with ease and precision using this Employee Survey Results For Flexible Work Advantages Ppt Infographic Template Guidelines PDF. This layout presents information on Key Insights, Family Time, Adjustable Work Schedule, No Travelling. It is also available for immediate download and adjustment. So, changes can be made in the color, design, graphics or any other component to create a unique layout.

Logistics KPI Status Dashboard With Monthly KPI Ppt Infographic Template Layout PDF
The following slide highlights the transportation status dashboard with monthly KPI illustrating order status with customer, order date and delivery date. It shows financial performance for four quarters as well as todays order, inventory and monthly KPI with Inventory, shipping cost for past 30 days. Pitch your topic with ease and precision using this Logistics KPI Status Dashboard With Monthly KPI Ppt Infographic Template Layout PDF. This layout presents information on Order Status, Today Order, Inventory, Monthly KPI. It is also available for immediate download and adjustment. So, changes can be made in the color, design, graphics or any other component to create a unique layout.
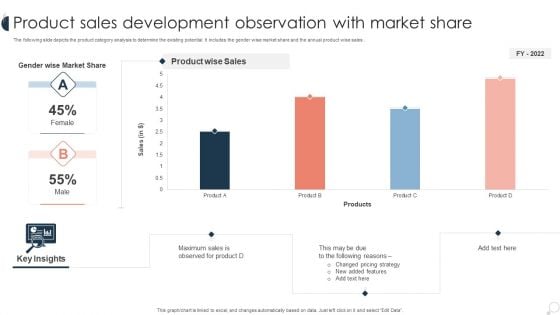
Product Sales Development Observation With Market Share Ppt PowerPoint Presentation Infographic Template Guide PDF
The following slide depicts the product category analysis to determine the existing potential. It includes the gender wise market share and the annual product wise sales . Pitch your topic with ease and precision using this Product Sales Development Observation With Market Share Ppt PowerPoint Presentation Infographic Template Guide PDF. This layout presents information on Changed Pricing, Observed For Product, Product Wise. It is also available for immediate download and adjustment. So, changes can be made in the color, design, graphics or any other component to create a unique layout.
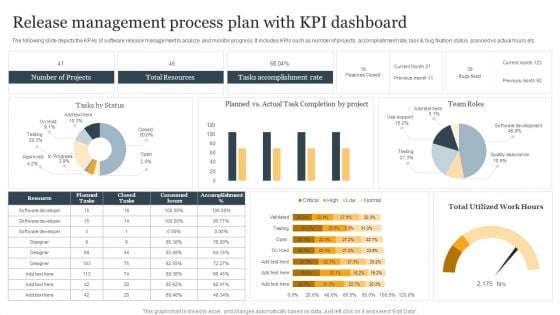
Release Management Process Plan With KPI Dashboard Ppt Infographic Template Structure PDF
The following slide depicts the KPAs of software release management to analyze and monitor progress. It includes KPIs such as number of projects, accomplishment rate, task and bug fixation status, planned vs actual hours etc. Showcasing this set of slides titled Release Management Process Plan With KPI Dashboard Ppt Infographic Template Structure PDF. The topics addressed in these templates are Number Of Projects, Total Resources, Tasks Accomplishment Rate. All the content presented in this PPT design is completely editable. Download it and make adjustments in color, background, font etc. as per your unique business setting.
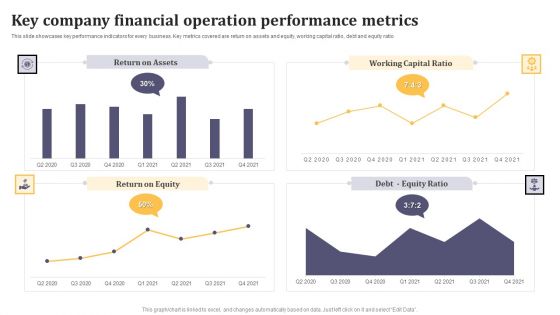
Key Company Financial Operation Performance Metrics Ppt Infographic Template Example Introduction PDF
This slide showcases key performance indicators for every business. Key metrics covered are return on assets and equity, working capital ratio, debt and equity ratio. Showcasing this set of slides titled Key Company Financial Operation Performance Metrics Ppt Infographic Template Example Introduction PDF. The topics addressed in these templates are Return on Assets, Working Capital Ratio, Return on Equity. All the content presented in this PPT design is completely editable. Download it and make adjustments in color, background, font etc. as per your unique business setting.
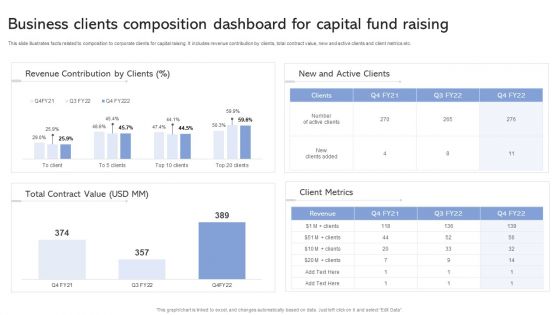
Business Clients Composition Dashboard For Capital Fund Raising Ppt Infographic Template Microsoft PDF
This slide illustrates facts related to composition to corporate clients for capital raising. It includes revenue contribution by clients, total contract value, new and active clients and client metrics etc. Showcasing this set of slides titled Business Clients Composition Dashboard For Capital Fund Raising Ppt Infographic Template Microsoft PDF. The topics addressed in these templates are Revenue Contribution Clients, Client Metrics, Total Contract Value. All the content presented in this PPT design is completely editable. Download it and make adjustments in color, background, font etc. as per your unique business setting.
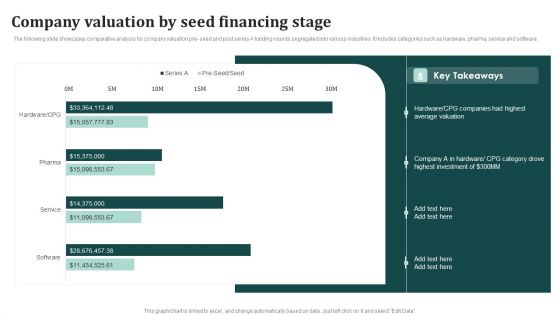
Company Valuation By Seed Financing Stage Ppt Infographic Template Graphics Tutorials PDF
The following slide showcases comparative analysis for company valuation pre- seed and post series A funding rounds segregated into various industries. It includes categories such as hardware, pharma, service and software. Showcasing this set of slides titled Company Valuation By Seed Financing Stage Ppt Infographic Template Graphics Tutorials PDF. The topics addressed in these templates are CPG Companies, Highest Average Valuation, Highest Investment. All the content presented in this PPT design is completely editable. Download it and make adjustments in color, background, font etc. as per your unique business setting.

Patient Health And Risk Key Performance Indicator Dashboard Ppt Infographic Template Summary PDF
The following slide highlights the patient health and safety key performance indicator dashboard illustrating admission by department, admission by cost, patient satisfaction, total patients, operations cost, patient density, total staff, waiting time, treatment satisfaction and treatment confidence. Pitch your topic with ease and precision using this Patient Health And Risk Key Performance Indicator Dashboard Ppt Infographic Template Summary PDF. This layout presents information on Admission By Department, Admission Vs Cost, Patient Satisfaction. It is also available for immediate download and adjustment. So, changes can be made in the color, design, graphics or any other component to create a unique layout.
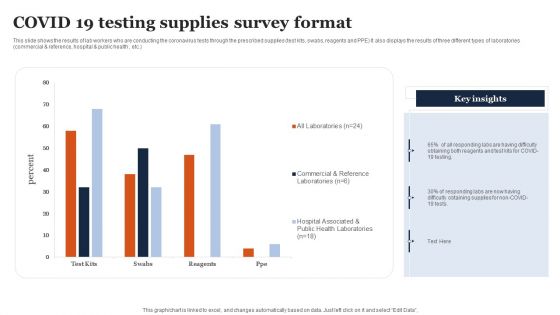
COVID 19 Testing Supplies Survey Format Ppt Infographic Template Slide PDF
This slide shows the results of lab workers who are conducting the coronavirus tests through the prescribed supplies test kits, swabs, reagents and PPE It also displays the results of three different types of laboratories commercial and reference, hospital and public health , etc. Showcasing this set of slides titled COVID 19 Testing Supplies Survey Format Ppt Infographic Template Slide PDF. The topics addressed in these templates are All Laboratories, Commercial And Reference, Hospital Associated. All the content presented in this PPT design is completely editable. Download it and make adjustments in color, background, font etc. as per your unique business setting.
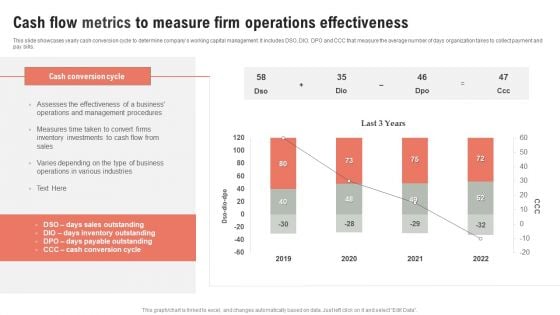
Cash Flow Metrics To Measure Firm Operations Effectiveness Ppt Outline Infographic Template PDF
This slide showcases yearly cash conversion cycle to determine companys working capital management. It includes DSO, DIO, DPO and CCC that measure the average number of days organization takes to collect payment and pay bills. Pitch your topic with ease and precision using this Cash Flow Metrics To Measure Firm Operations Effectiveness Ppt Outline Infographic Template PDF. This layout presents information on Cash Conversion Cycle, 2019 To 2022, Cash Flow. It is also available for immediate download and adjustment. So, changes can be made in the color, design, graphics or any other component to create a unique layout.
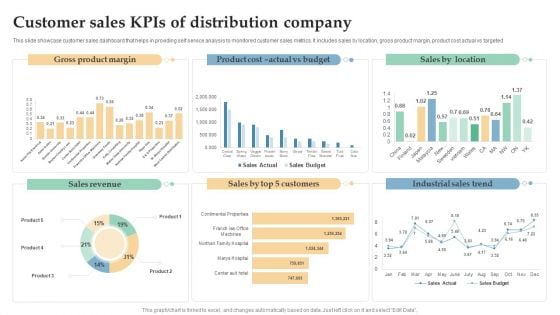
Customer Sales Kpis Of Distribution Company Ppt Infographic Template Templates PDF
This slide showcase customer sales dashboard that helps in providing self service analysis to monitored customer sales metrics. It includes sales by location, gross product margin, product cost actual vs targeted. Showcasing this set of slides titled Customer Sales Kpis Of Distribution Company Ppt Infographic Template Templates PDF. The topics addressed in these templates are Gross Product Margin, Sales Revenue, Industrial Sales Trend. All the content presented in this PPT design is completely editable. Download it and make adjustments in color, background, font etc. as per your unique business setting.
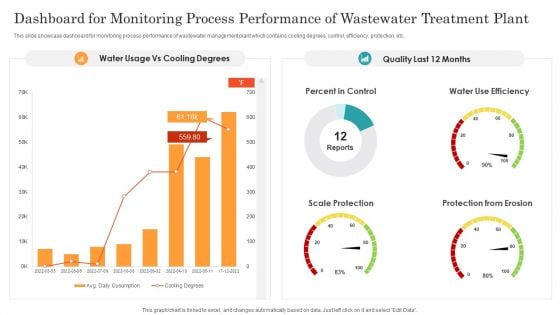
Dashboard For Monitoring Process Performance Of Wastewater Treatment Plant Ppt Infographic Template Demonstration PDF
This slide showcase dashboard for monitoring process performance of wastewater management plant which contains cooling degrees, control, efficiency, protection, etc. Showcasing this set of slides titled Dashboard For Monitoring Process Performance Of Wastewater Treatment Plant Ppt Infographic Template Demonstration PDF. The topics addressed in these templates are Percent Control, Water Use Efficiency, Scale Protection, Protection From Erosion. All the content presented in this PPT design is completely editable. Download it and make adjustments in color, background, font etc. as per your unique business setting.
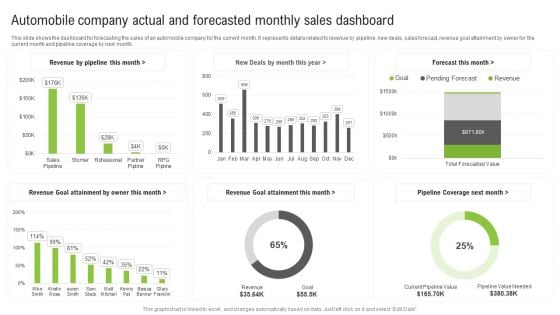
Automobile Company Actual And Forecasted Monthly Sales Dashboard Ppt Infographic Template Aids PDF
This slide shows the dashboard for forecasting the sales of an automobile company for the current month. It represents details related to revenue by pipeline, new deals, sales forecast, revenue goal attainment by owner for the current month and pipeline coverage by next month. Showcasing this set of slides titled Automobile Company Actual And Forecasted Monthly Sales Dashboard Ppt Infographic Template Aids PDF. The topics addressed in these templates are Forecast Month, Revenue Goal Attainment, Revenue Goal Attainment. All the content presented in this PPT design is completely editable. Download it and make adjustments in color, background, font etc. as per your unique business setting.
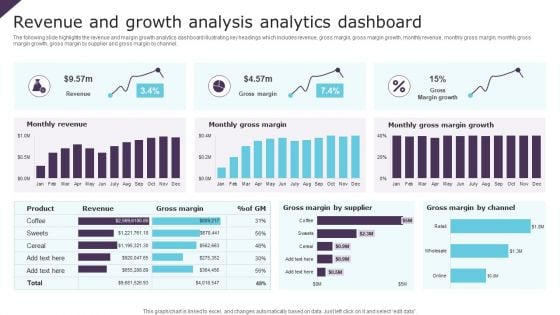
Revenue And Growth Analysis Analytics Dashboard Ppt Infographic Template Brochure PDF
The following slide highlights the revenue and margin growth analytics dashboard illustrating key headings which includes revenue, gross margin, gross margin growth, monthly revenue, monthly gross margin, monthly gross margin growth, gross margin by supplier and gross margin by channel. Pitch your topic with ease and precision using this Revenue And Growth Analysis Analytics Dashboard Ppt Infographic Template Brochure PDF. This layout presents information on Monthly Revenue, Monthly Gross Margin, Gross Margin Growth. It is also available for immediate download and adjustment. So, changes can be made in the color, design, graphics or any other component to create a unique layout.
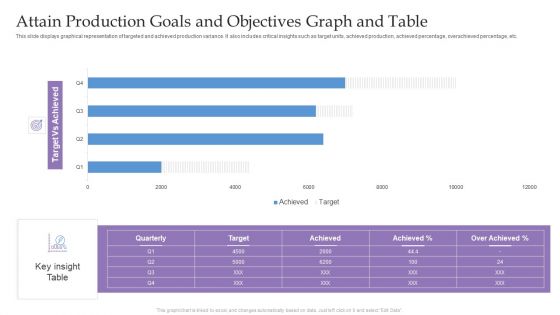
Attain Production Goals And Objectives Graph And Table Ppt Infographic Template Visuals PDF
This slide displays graphical representation of targeted and achieved production variance. It also includes critical insights such as target units, achieved production, achieved percentage, overachieved percentage, etc. Pitch your topic with ease and precision using this Attain Production Goals And Objectives Graph And Table Ppt Infographic Template Visuals PDF. This layout presents information on Target Vs Achieved, Key insight Table, Quarterly. It is also available for immediate download and adjustment. So, changes can be made in the color, design, graphics or any other component to create a unique layout.
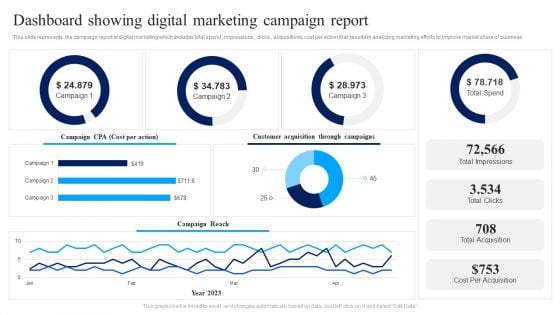
Dashboard Showing Digital Marketing Campaign Report Ppt Infographic Template Template PDF
This slide represents the campaign report of digital marketing which includes total spend , impressions , clicks , acquisitions, cost per action that results in analyzing marketing efforts to improve market share of business. Pitch your topic with ease and precision using this Dashboard Showing Digital Marketing Campaign Report Ppt Infographic Template Template PDF. This layout presents information on Customer Acquisition, Total Impressions, Total Clicks, Total Acquisition. It is also available for immediate download and adjustment. So, changes can be made in the color, design, graphics or any other component to create a unique layout.
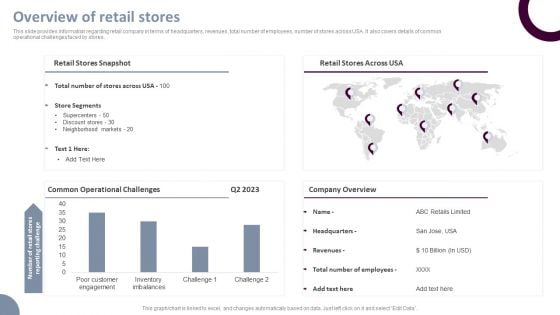
Retail Store Operations Overview Of Retail Stores Ppt Infographic Template File Formats PDF
This slide provides information regarding retail company in terms of headquarters, revenues, total number of employees, number of stores across USA. It also covers details of common operational challenges faced by stores. Take your projects to the next level with our ultimate collection of Retail Store Operations Overview Of Retail Stores Ppt Infographic Template File Formats PDF. Slidegeeks has designed a range of layouts that are perfect for representing task or activity duration, keeping track of all your deadlines at a glance. Tailor these designs to your exact needs and give them a truly corporate look with your own brand colors theyll make your projects stand out from the rest.
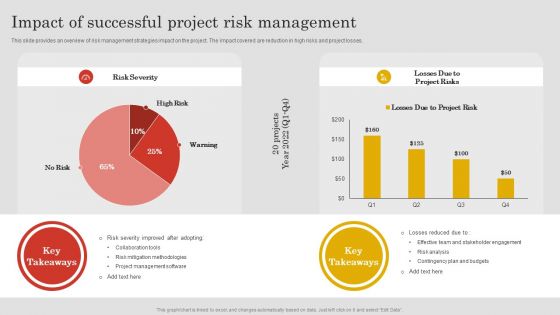
Impact Of Successful Project Risk Management Ppt PowerPoint Presentation File Infographic Template PDF
This slide provides an overview of risk management strategies impact on the project. The impact covered are reduction in high risks and project losses. Present like a pro with Impact Of Successful Project Risk Management Ppt PowerPoint Presentation File Infographic Template PDF Create beautiful presentations together with your team, using our easy to use presentation slides. Share your ideas in real-time and make changes on the fly by downloading our templates. So whether you are in the office, on the go, or in a remote location, you can stay in sync with your team and present your ideas with confidence. With Slidegeeks presentation got a whole lot easier. Grab these presentations today.
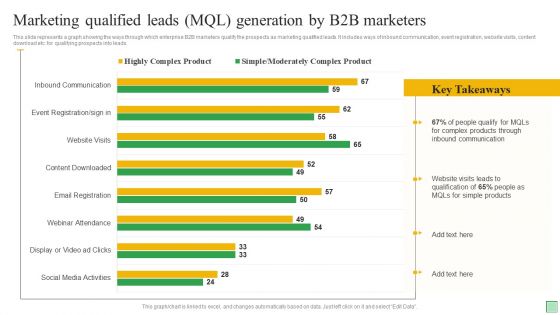
Marketing Qualified Leads MQL Generation By B2B Marketers Ppt Infographic Template Design Ideas PDF
This slide represents a graph showing the ways through which enterprise B2B marketers qualify the prospects as marketing qualified leads. It includes ways of inbound communication, event registration, website visits, content download etc. for qualifying prospects into leads. Showcasing this set of slides titled Marketing Qualified Leads MQL Generation By B2B Marketers Ppt Infographic Template Design Ideas PDF. The topics addressed in these templates are People Qualify, Inbound Communication, Complex Products. All the content presented in this PPT design is completely editable. Download it and make adjustments in color, background, font etc. as per your unique business setting.
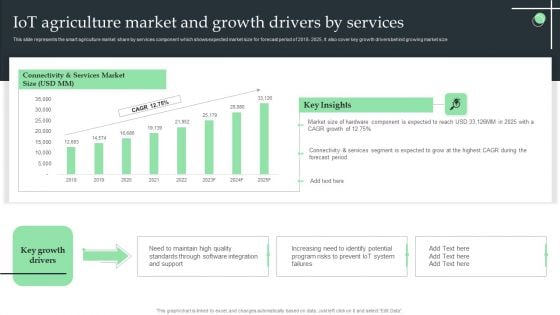
Iot Agriculture Market And Growth Drivers By Services Ppt Infographic Template Elements PDF
This slide represents the smart agriculture market share by services component which shows expected market size for forecast period of 2018- 2025. It also cover key growth drivers behind growing market size. Find a pre-designed and impeccable Iot Agriculture Market And Growth Drivers By Services Ppt Infographic Template Elements PDF. The templates can ace your presentation without additional effort. You can download these easy-to-edit presentation templates to make your presentation stand out from others. So, what are you waiting for Download the template from Slidegeeks today and give a unique touch to your presentation.
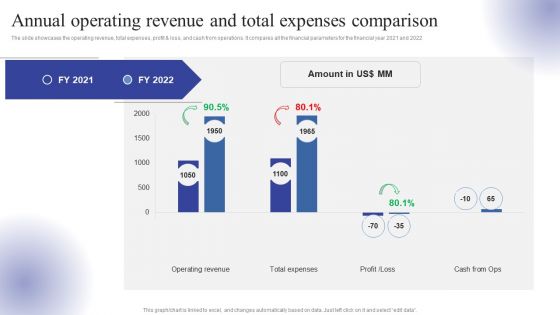
Annual Operating Revenue And Total Expenses Comparison Ppt Infographic Template Rules PDF
The slide showcases the operating revenue, total expenses, profit and loss, and cash from operations. It compares all the financial parameters for the financial year 2021 and 2022. Want to ace your presentation in front of a live audience Our Annual Operating Revenue And Total Expenses Comparison Ppt Infographic Template Rules PDF can help you do that by engaging all the users towards you.. Slidegeeks experts have put their efforts and expertise into creating these impeccable powerpoint presentations so that you can communicate your ideas clearly. Moreover, all the templates are customizable, and easy-to-edit and downloadable. Use these for both personal and commercial use.
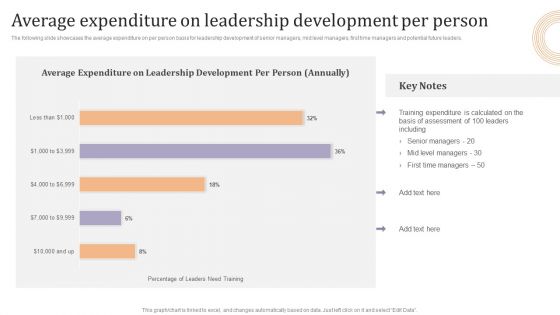
Average Expenditure On Leadership Development Per Person Ppt Infographic Template Inspiration PDF
The following slide showcases the average expenditure on per person basis for leadership development of senior managers, mid level managers, first time managers and potential future leaders. Find a pre designed and impeccable Average Expenditure On Leadership Development Per Person Ppt Infographic Template Inspiration PDF. The templates can ace your presentation without additional effort. You can download these easy to edit presentation templates to make your presentation stand out from others. So, what are you waiting for Download the template from Slidegeeks today and give a unique touch to your presentation.
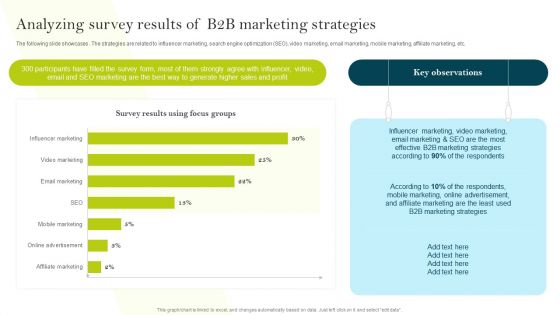
Analyzing Survey Results Of B2B Marketing Strategies Ppt PowerPoint Presentation File Infographic Template PDF
The following slide showcases . The strategies are related to influencer marketing, search engine optimization SEO, video marketing, email marketing, mobile marketing, affiliate marketing, etc. Boost your pitch with our creative Analyzing Survey Results Of B2B Marketing Strategies Ppt PowerPoint Presentation File Infographic Template PDF. Deliver an awe-inspiring pitch that will mesmerize everyone. Using these presentation templates you will surely catch everyones attention. You can browse the ppts collection on our website. We have researchers who are experts at creating the right content for the templates. So you do not have to invest time in any additional work. Just grab the template now and use them.
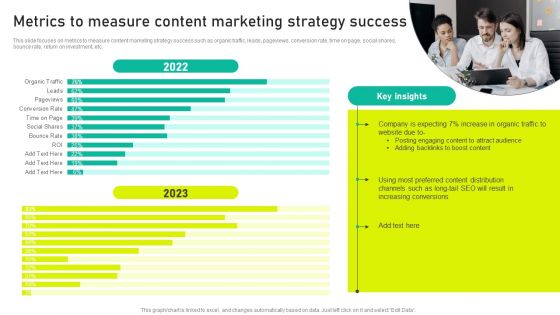
Metrics To Measure Content Marketing Strategy Success Ppt Infographic Template Files PDF
This slide focuses on metrics to measure content marketing strategy success such as organic traffic, leads, pageviews, conversion rate, time on page, social shares, bounce rate, return on investment, etc. The best PPT templates are a great way to save time, energy, and resources. Slidegeeks have 100 percent editable powerpoint slides making them incredibly versatile. With these quality presentation templates, you can create a captivating and memorable presentation by combining visually appealing slides and effectively communicating your message. Download Metrics To Measure Content Marketing Strategy Success Ppt Infographic Template Files PDF from Slidegeeks and deliver a wonderful presentation.
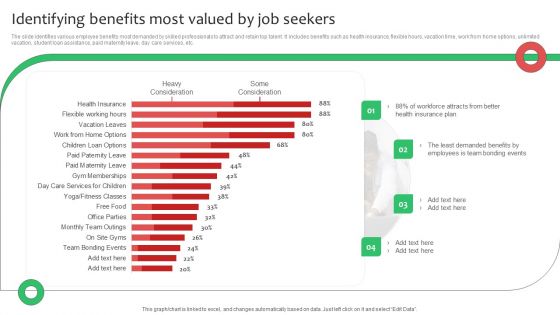
Identifying Benefits Most Valued By Job Seekers Ppt Infographic Template Outfit PDF
The slide identifies various employee benefits most demanded by skilled professionals to attract and retain top talent. It includes benefits such as health insurance, flexible hours, vacation time, work from home options, unlimited vacation, student loan assistance, paid maternity leave, day care services, etc. There are so many reasons you need a Identifying Benefits Most Valued By Job Seekers Ppt Infographic Template Outfit PDF. The first reason is you can not spend time making everything from scratch, Thus, Slidegeeks has made presentation templates for you too. You can easily download these templates from our website easily.
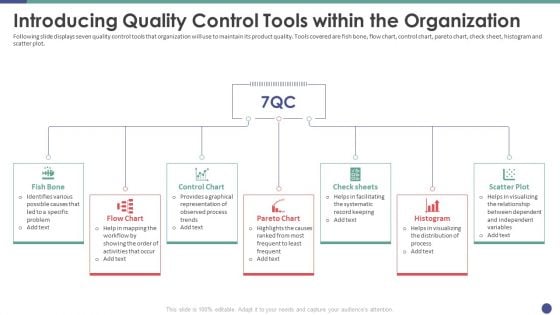
QC Engineering Introducing Quality Control Tools Within The Organization Ppt Infographic Template Design Templates PDF
Following slide displays seven quality control tools that organization will use to maintain its product quality. Tools covered are fish bone, flow chart, control chart, pareto chart, check sheet, histogram and scatter plot. Presenting qc engineering introducing quality control tools within the organization ppt infographic template design templates pdf to provide visual cues and insights. Share and navigate important information on seven stages that need your due attention. This template can be used to pitch topics like fish bone, flow chart, control chart, pareto chart, check sheets. In addtion, this PPT design contains high resolution images, graphics, etc, that are easily editable and available for immediate download.

Stock Market Research Report Equity Research Team Structure Ppt PowerPoint Presentation Infographic Template Example PDF
The purpose of the following slide is to show the team structure of the equity research team. This is a stock market research report equity research team structure ppt powerpoint presentation infographic template example pdf template with various stages. Focus and dispense information on four stages using this creative set, that comes with editable features. It contains large content boxes to add your information on topics like senior analyst, associate, head research, equities. You can also showcase facts, figures, and other relevant content using this PPT layout. Grab it now.
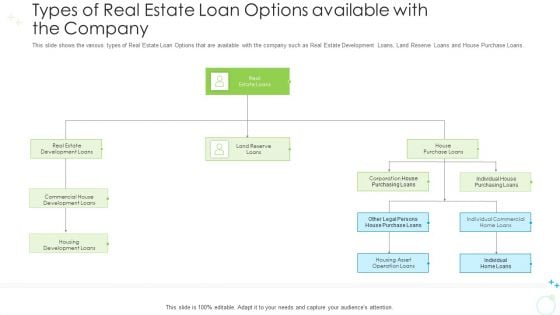
Types Of Real Estate Loan Options Available With The Company Ppt Infographic Template Inspiration PDF
This slide shows the various types of Real Estate Loan Options that are available with the company such as Real Estate Development Loans, Land Reserve Loans and House Purchase Loans. Presenting types of real estate loan options available with the company ppt infographic template inspiration pdf to provide visual cues and insights. Share and navigate important information on four stages that need your due attention. This template can be used to pitch topics like commercial, development loans, purchasing loans. In addtion, this PPT design contains high resolution images, graphics, etc, that are easily editable and available for immediate download.
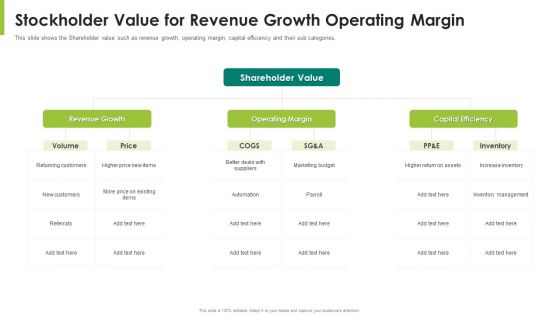
Stockholder Value For Revenue Growth Operating Margin Ppt Infographic Template Grid Pdf
This slide shows the Shareholder value such as revenue growth, operating margin, capital efficiency and their sub categories. This is a stockholder value for revenue growth operating margin ppt infographic template grid pdf template with various stages. Focus and dispense information on three stages using this creative set, that comes with editable features. It contains large content boxes to add your information on topics like revenue growth, operating margin, capital efficiency. You can also showcase facts, figures, and other relevant content using this PPT layout. Grab it now.
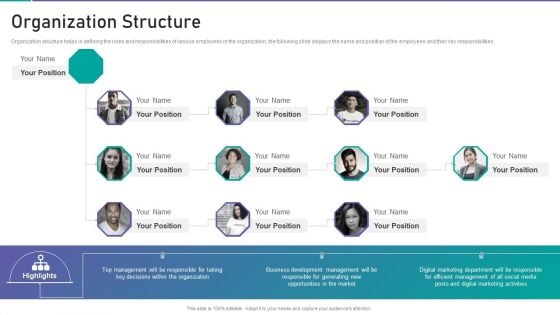
Corporate Organization Playbook Organization Structure Ppt Infographic Template Clipart Images PDF
Organization structure helps in defining the roles and responsibilities of various employees in the organization, the following slide displays the name and position of the employees and their key responsibilities. This is a corporate organization playbook organization structure ppt infographic template clipart images pdf template with various stages. Focus and dispense information on four stages using this creative set, that comes with editable features. It contains large content boxes to add your information on topics like organization, business development management, market, digital marketing activities. You can also showcase facts, figures, and other relevant content using this PPT layout. Grab it now.
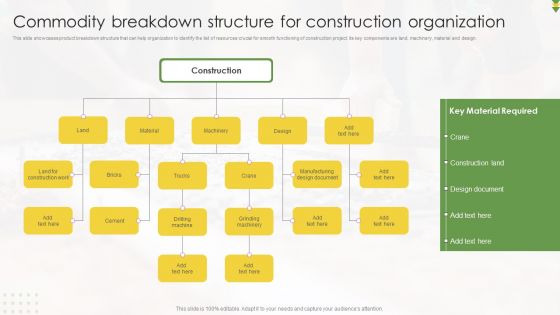
Commodity Breakdown Structure For Construction Organization Ppt Infographic Template Design Templates PDF
This slide showcases product breakdown structure that can help organization to identify the list of resources crucial for smooth functioning of construction project. Its key components are land, machinery, material and design. Persuade your audience using this Commodity Breakdown Structure For Construction Organization Ppt Infographic Template Design Templates PDF. This PPT design covers five stages, thus making it a great tool to use. It also caters to a variety of topics including Construction, Trucks, Machinery, Material. Download this PPT design now to present a convincing pitch that not only emphasizes the topic but also showcases your presentation skills.
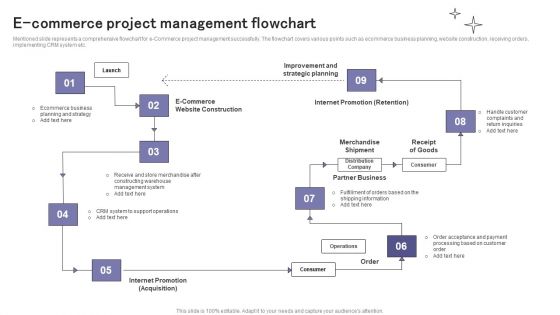
E Commerce Project Management Flowchart Ppt Infographic Template Slide Download PDF
Mentioned slide represents a comprehensive flowchart for e-Commerce project management successfully. The flowchart covers various points such as ecommerce business planning, website construction, receiving orders, implementing CRM system etc. Presenting E Commerce Project Management Flowchart Ppt Infographic Template Slide Download PDF to dispense important information. This template comprises nine stages. It also presents valuable insights into the topics including Internet Promotion, Partner Business, Consumer. This is a completely customizable PowerPoint theme that can be put to use immediately. So, download it and address the topic impactfully.
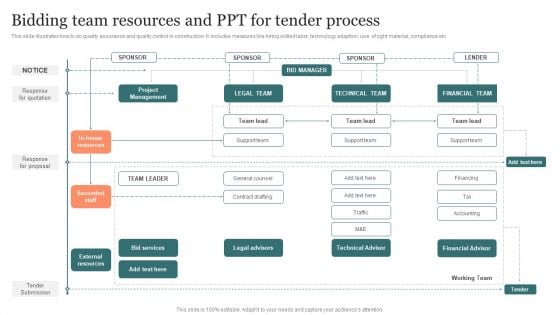
Bidding Team Resources And Ppt For Tender Process Ppt Infographic Template Clipart PDF
This slide illustrates how to do quality assurance and quality control in construction. It includes measures like hiring skilled labor, technology adaption, use of right material, compliance etc. Presenting Bidding Team Resources And Ppt For Tender Process Ppt Infographic Template Clipart PDF to dispense important information. This template comprises one stages. It also presents valuable insights into the topics including Project Management, Technical Team, Financial Team . This is a completely customizable PowerPoint theme that can be put to use immediately. So, download it and address the topic impactfully.
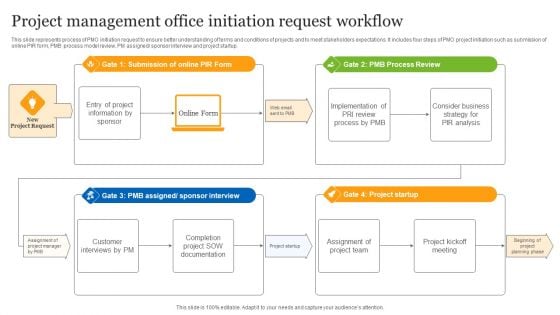
Project Management Office Initiation Request Workflow Ppt Ideas Infographic Template PDF
This slide represents process of PMO initiation request to ensure better understanding of terms and conditions of projects and to meet stakeholders expectations. It includes four steps of PMO project initiation such as submission of online PIR form, PMB process model review, PM assigned or sponsor interview and project startup. Presenting Project Management Office Initiation Request Workflow Ppt Ideas Infographic Template PDF to dispense important information. This template comprises one stages. It also presents valuable insights into the topics including PMB Process Review, Project Startup, Sponsor Interview. This is a completely customizable PowerPoint theme that can be put to use immediately. So, download it and address the topic impactfully.
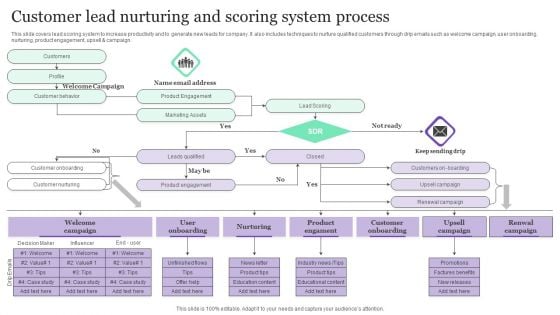
Customer Lead Nurturing And Scoring System Process Ppt Infographic Template Graphic Images PDF
This slide covers lead scoring system to increase productivity and to generate new leads for company. It also includes techniques to nurture qualified customers through drip emails such as welcome campaign, user onboarding, nurturing, product engagement, upsell and campaign. Presenting Customer Lead Nurturing And Scoring System Process Ppt Infographic Template Graphic Images PDF to dispense important information. This template comprises three stages. It also presents valuable insights into the topics including Welcome Campaign, Name Email Address, Lead Scoring. This is a completely customizable PowerPoint theme that can be put to use immediately. So, download it and address the topic impactfully.

Four Stages Of Windows Ten Operating System Starting Process Ppt PowerPoint Presentation File Infographic Template PDF
This slide shows different phases in booting process of windows 10 operating system which are pre-boot, windows boot manager, OS loader and NT OS kernel. Persuade your audience using this four stages of windows ten operating system starting process ppt powerpoint presentation file infographic template pdf. This PPT design covers four stages, thus making it a great tool to use. It also caters to a variety of topics including windows boot manager, windows os loader, windows nt os kernel. Download this PPT design now to present a convincing pitch that not only emphasizes the topic but also showcases your presentation skills.
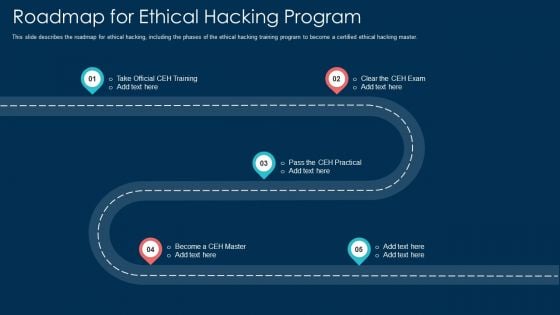
Roadmap For Ethical Hacking Program Ppt Infographic Template Graphic Tips PDF
This slide describes the roadmap for ethical hacking, including the phases of the ethical hacking training program to become a certified ethical hacking master. This is a roadmap for ethical hacking program ppt infographic template graphic tips pdf template with various stages. Focus and dispense information on five stages using this creative set, that comes with editable features. It contains large content boxes to add your information on topics like roadmap for ethical hacking program. You can also showcase facts, figures, and other relevant content using this PPT layout. Grab it now.
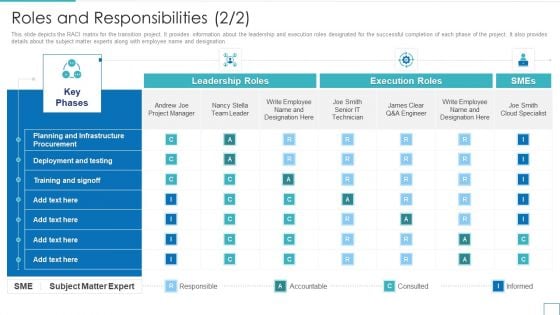
Roles And Responsibilities Technology Upgradation Action Plan Ppt Infographic Template Elements PDF
This slide depicts the RACI matrix for the transition project. It provides information about the leadership and execution roles designated for the successful completion of each phase of the project. It also provides details about the subject matter experts along with employee name and designation. Deliver an awe inspiring pitch with this creative Roles And Responsibilities Technology Upgradation Action Plan Ppt Infographic Template Elements PDF bundle. Topics like Planning And Infrastructure Procurement, Deployment And Testing, Training And Signoff can be discussed with this completely editable template. It is available for immediate download depending on the needs and requirements of the user.
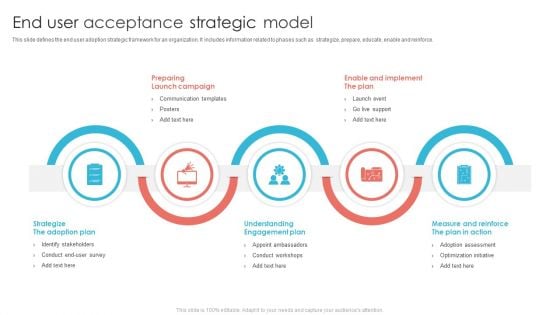
End User Acceptance Strategic Model Ppt PowerPoint Presentation Infographic Template Design Inspiration PDF
This slide defines the end user adoption strategic framework for an organization. It includes information related to phases such as strategize, prepare, educate, enable and reinforce.Persuade your audience using this End User Acceptance Strategic Model Ppt PowerPoint Presentation Infographic Template Design Inspiration PDF. This PPT design covers five stages, thus making it a great tool to use. It also caters to a variety of topics including Enable Implement, Launch Campaign, Understanding Engagement. Download this PPT design now to present a convincing pitch that not only emphasizes the topic but also showcases your presentation skills.
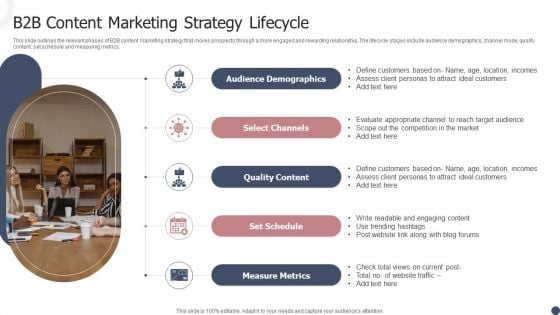
B2B Content Marketing Strategy Lifecycle Ppt Infographic Template Design Inspiration PDF
This slide outlines the relevant phases of B2B content marketing strategy that moves prospects through a more engaged and rewarding relationship. The lifecycle stages include audience demographics, channel mode, quality content, set schedule and measuring metrics. Persuade your audience using this B2B Content Marketing Strategy Lifecycle Ppt Infographic Template Design Inspiration PDF. This PPT design covers five stages, thus making it a great tool to use. It also caters to a variety of topics including Audience Demographics, Select Channels, Quality Content, Set Schedule. Download this PPT design now to present a convincing pitch that not only emphasizes the topic but also showcases your presentation skills.
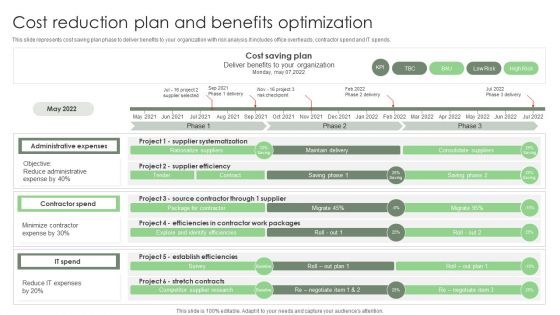
Cost Reduction Plan And Benefits Optimization Ppt Slides Infographic Template PDF
This slide represents cost saving plan phase to deliver benefits to your organization with risk analysis.It includes office overheads, contractor spend and IT spends. Pitch your topic with ease and precision using this Cost Reduction Plan And Benefits Optimization Ppt Slides Infographic Template PDF. This layout presents information on Cost Saving Plan, Administrative Expenses, Contractor Spend. It is also available for immediate download and adjustment. So, changes can be made in the color, design, graphics or any other component to create a unique layout.
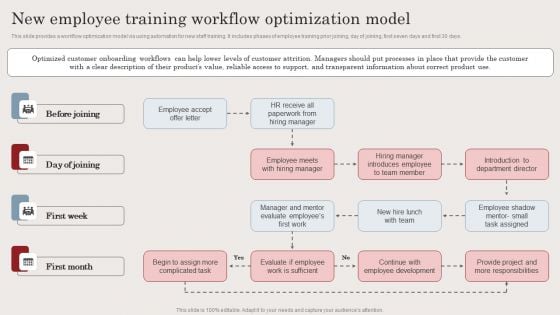
New Employee Training Workflow Optimization Model Ppt Infographic Template Inspiration PDF
This slide provides a workflow optimization model via using automation for new staff training. It includes phases of employee training prior joining, day of joining, first seven days and first 30 days. The best PPT templates are a great way to save time, energy, and resources. Slidegeeks have 100 percent editable powerpoint slides making them incredibly versatile. With these quality presentation templates, you can create a captivating and memorable presentation by combining visually appealing slides and effectively communicating your message. Download New Employee Training Workflow Optimization Model Ppt Infographic Template Inspiration PDF from Slidegeeks and deliver a wonderful presentation.
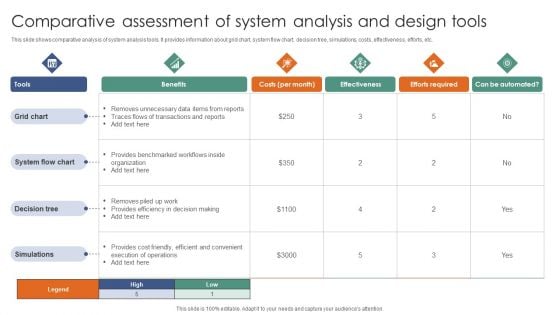
Comparative Assessment Of System Analysis And Design Tools Ppt Infographic Template Microsoft PDF
This slide shows comparative analysis of system analysis tools. It provides information about grid chart, system flow chart, decision tree, simulations, costs, effectiveness, efforts, etc. Pitch your topic with ease and precision using this Comparative Assessment Of System Analysis And Design Tools Ppt Infographic Template Microsoft PDF. This layout presents information on Benefits, Effectiveness, Efforts required, Grid chart. It is also available for immediate download and adjustment. So, changes can be made in the color, design, graphics or any other component to create a unique layout.
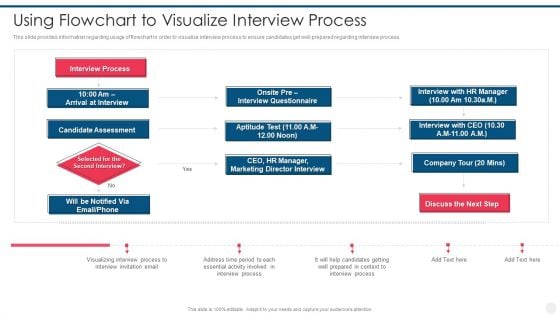
Efficient Hiring And Selection Process Using Flowchart To Visualize Interview Process Ppt Portfolio Infographic Template PDF
This slide provides information regarding usage of flowchart in order to visualize interview process to ensure candidates get well prepared regarding interview process. This is a Efficient Hiring And Selection Process Using Flowchart To Visualize Interview Process Ppt Portfolio Infographic Template PDF template with various stages. Focus and dispense information on one stages using this creative set, that comes with editable features. It contains large content boxes to add your information on topics like Interview Process, Candidate Assessment, Time Period. You can also showcase facts, figures, and other relevant content using this PPT layout. Grab it now.
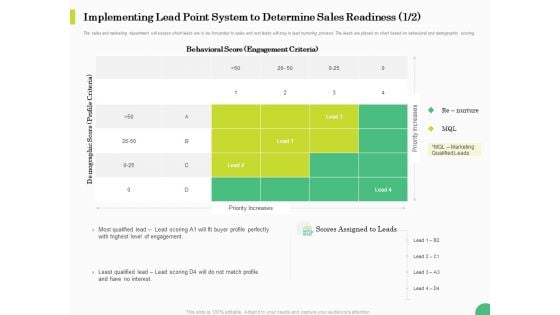
Evaluating Rank Prospects Implementing Lead Point System To Determine Sales Readiness Ppt Infographic Template Portfolio PDF
The sales and marketing department will assess which leads are to be forwarded to sales and rest leads will stay in lead nurturing process. The leads are placed on chart based on behavioral and demographic scoring. Deliver and pitch your topic in the best possible manner with this evaluating rank prospects implementing lead point system to determine sales readiness ppt infographic template portfolio pdf. Use them to share invaluable insights on behavioral score, engagement criteria, scores assigned to leads, priority increases, highest level engagement. and impress your audience. This template can be altered and modified as per your expectations. So, grab it now.
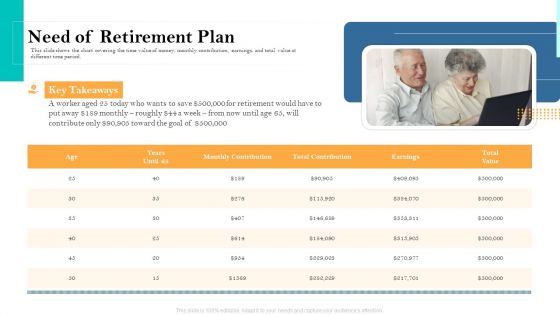
Retirement Income Analysis Need Of Retirement Plan Ppt Infographic Template Structure PDF
This slide shows the chart covering the time value of money, monthly contribution, earnings, and total value at different time period. This is a retirement income analysis need of retirement plan ppt infographic template structure pdf template with various stages. Focus and dispense information on one stages using this creative set, that comes with editable features. It contains large content boxes to add your information on topics like need of retirement plan. You can also showcase facts, figures, and other relevant content using this PPT layout. Grab it now.
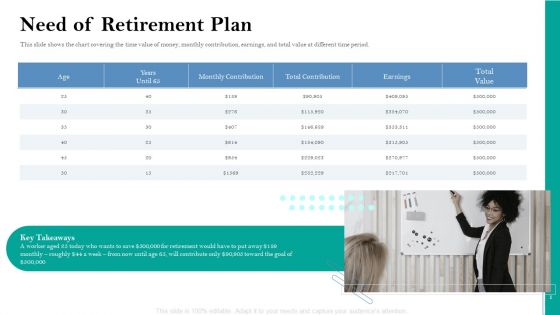
Retirement Insurance Benefit Plan Need Of Retirement Plan Ppt Layouts Infographic Template PDF
This slide shows the chart covering the time value of money, monthly contribution, earnings, and total value at different time period. This is a retirement insurance benefit plan need of retirement plan ppt layouts infographic template pdf template with various stages. Focus and dispense information on one stages using this creative set, that comes with editable features. It contains large content boxes to add your information on topics like need of retirement plan. You can also showcase facts, figures, and other relevant content using this PPT layout. Grab it now.
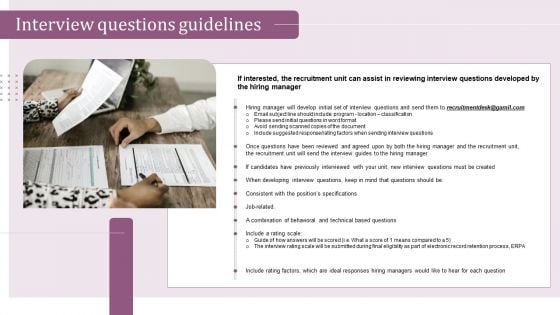
Internal Hiring Handbook Interview Questions Guidelines Ppt PowerPoint Presentation Gallery Infographic Template PDF
If you are looking for a format to display your unique thoughts, then the professionally designed Internal Hiring Handbook Interview Questions Guidelines Ppt PowerPoint Presentation Gallery Infographic Template PDF is the one for you. You can use it as a Google Slides template or a PowerPoint template. Incorporate impressive visuals, symbols, images, and other charts. Modify or reorganize the text boxes as you desire. Experiment with shade schemes and font pairings. Alter, share or cooperate with other people on your work. Download and find out how to give a successful presentation. Present a perfect display to your team and make your presentation unforgettable.
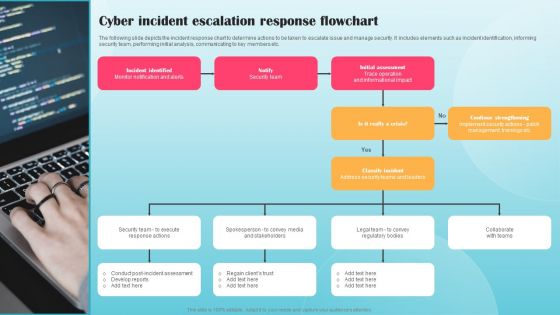
Cyber Incident Escalation Response Flowchart Ppt PowerPoint Presentation File Infographic Template PDF
The following slide depicts the incident response chart to determine actions to be taken to escalate issue and manage security. It includes elements such as incident identification, informing security team, performing initial analysis, communicating to key members etc. Make sure to capture your audiences attention in your business displays with our gratis customizable Cyber Incident Escalation Response Flowchart Ppt PowerPoint Presentation File Infographic Template PDF. These are great for business strategies, office conferences, capital raising or task suggestions. If you desire to acquire more customers for your tech business and ensure they stay satisfied, create your own sales presentation with these plain slides.
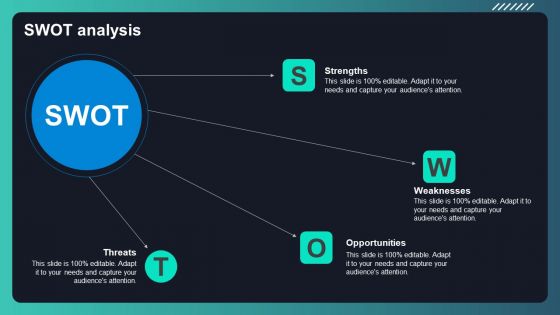
Deploying AML Transaction Monitoring SWOT Analysis Ppt Infographic Template Styles PDF
Retrieve professionally designed Deploying AML Transaction Monitoring SWOT Analysis Ppt Infographic Template Styles PDF to effectively convey your message and captivate your listeners. Save time by selecting pre-made slideshows that are appropriate for various topics, from business to educational purposes. These themes come in many different styles, from creative to corporate, and all of them are easily adjustable and can be edited quickly. Access them as PowerPoint templates or as Google Slides themes. You do not have to go on a hunt for the perfect presentation because Slidegeeks got you covered from everywhere.
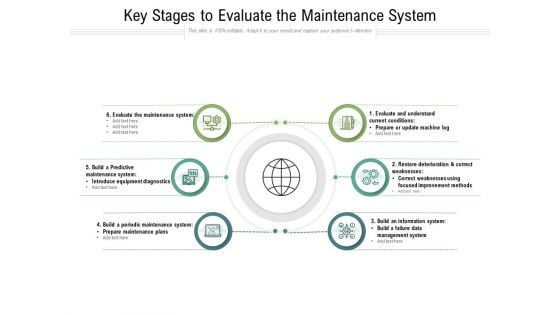
Key Stages To Evaluate The Maintenance System Ppt PowerPoint Presentation Infographic Template Clipart PDF
Presenting key stages to evaluate the maintenance system ppt powerpoint presentation infographic template clipart pdf to dispense important information. This template comprises six stages. It also presents valuable insights into the topics including evaluate and understand current conditions, restore deterioration and correct weaknesses, build an information system, build a failure data management system, build a periodic maintenance system, prepare maintenance plans, build a predictive maintenance system, introduce equipment diagnostics, evaluate the maintenance system. This is a completely customizable PowerPoint theme that can be put to use immediately. So, download it and address the topic impactfully.
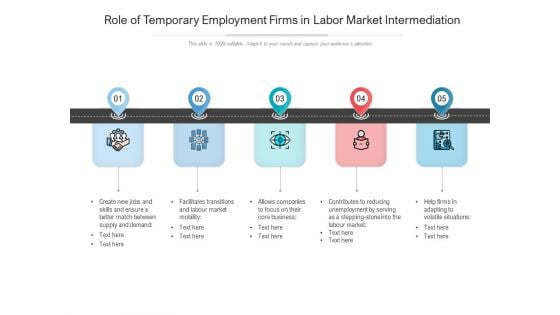
Role Of Temporary Employment Firms In Labor Market Intermediation Ppt PowerPoint Presentation Summary Infographic Template PDF
Presenting role of temporary employment firms in labor market intermediation ppt powerpoint presentation summary infographic template pdf to dispense important information. This template comprises five stages. It also presents valuable insights into the topics including create new jobs and skills and ensure a better match between supply and demand, facilitates transitions and labour market mobility, allows companies to focus on their core business, contributes to reducing unemployment by serving as a stepping-stone into the labour market, help firms in adapting to volatile situations. This is a completely customizable PowerPoint theme that can be put to use immediately. So, download it and address the topic impactfully.
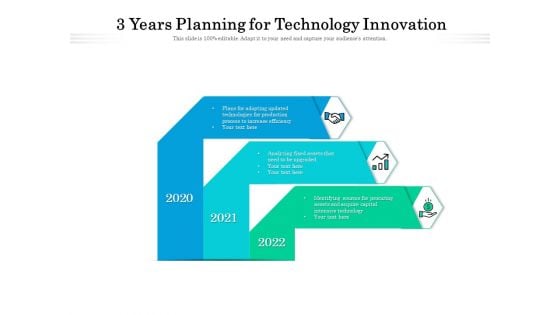
3 Years Planning For Technology Innovation Ppt PowerPoint Presentation Ideas Infographic Template PDF
Presenting 3 years planning for technology innovation ppt powerpoint presentation ideas infographic template pdf to dispense important information. This template comprises three stages. It also presents valuable insights into the topics including plans for adopting updated technologies for production process to increase efficiency, analyzing fixed assets that need to be upgraded, identifying sources for procuring assets and acquire capital intensive technology, 2020 to 2022. This is a completely customizable PowerPoint theme that can be put to use immediately. So, download it and address the topic impactfully.
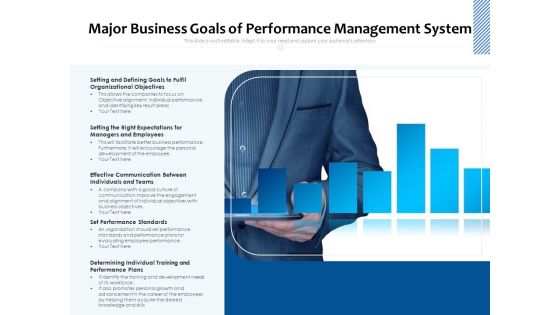
Major Business Goals Of Performance Management System Ppt PowerPoint Presentation Infographic Template Example Introduction PDF
Presenting major business goals of performance management system ppt powerpoint presentation infographic template example introduction pdf to dispense important information. This template comprises one stages. It also presents valuable insights into the topics including setting and defining goals to fulfil organizational objectives, setting the right expectations for managers and employees, effective communication between individuals and teams, set performance standards, determining individual training and performance plans. This is a completely customizable PowerPoint theme that can be put to use immediately. So, download it and address the topic impactfully.
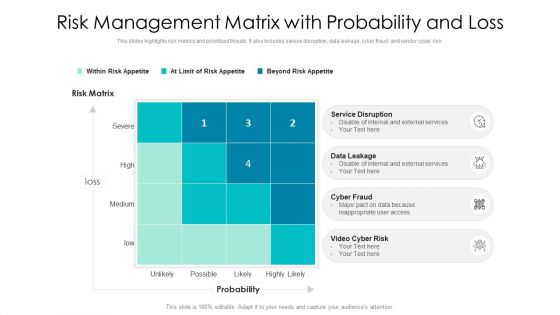
Risk Management Matrix With Probability And Loss Ppt PowerPoint Presentation Infographic Template Deck PDF
This slides highlights risk metrics and prioritized threats. It also includes service disruption, data leakage, cyber fraud and vendor cyber risk. Presenting risk management matrix with probability and loss ppt powerpoint presentation infographic template deck pdf to dispense important information. This template comprises four stages. It also presents valuable insights into the topics including service disruption, disable of internal and external services, risk matrix. This is a completely customizable PowerPoint theme that can be put to use immediately. So, download it and address the topic impactfully.

 Home
Home