Infographic Icons
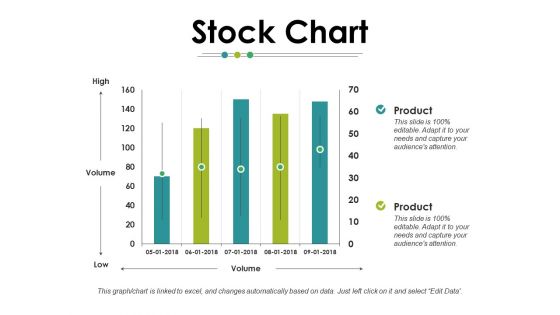
Stock Chart Ppt PowerPoint Presentation Infographics Smartart
This is a stock chart ppt powerpoint presentation infographics smartart. This is a two stages process. The stages in this process are stock chart, finance, business, planning, marketing, management.
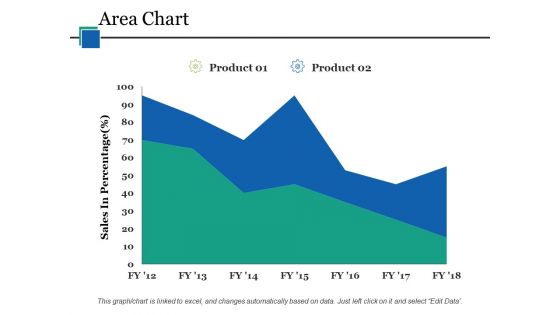
Area Chart Ppt PowerPoint Presentation Infographics Guide
This is a area chart ppt powerpoint presentation infographics guide. This is a two stage process. The stages in this process are area chart, product, sales in percentage, finance, business.
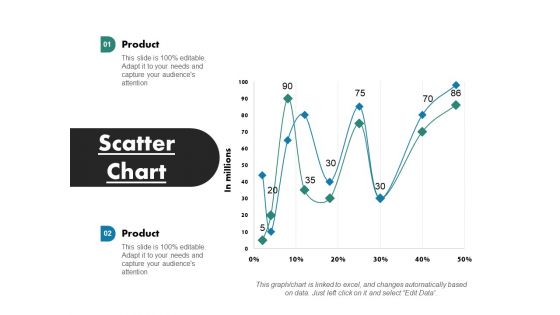
Scatter Chart Ppt PowerPoint Presentation Infographics Designs
This is a scatter chart ppt powerpoint presentation infographics designs. This is a two stage process. The stages in this process are scatter chart, finance, marketing, management, investment, analysis.
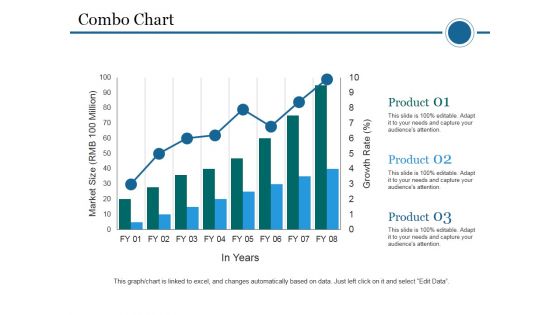
Combo Chart Ppt PowerPoint Presentation Infographics Summary
This is a combo chart ppt powerpoint presentation infographics summary. This is a three stage process. The stages in this process are market size, product, combo chart, years, business.
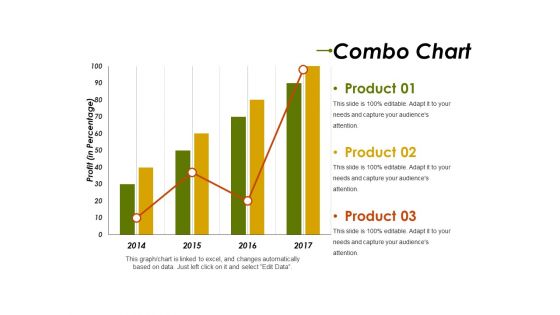
Combo Chart Ppt PowerPoint Presentation Infographics Introduction
This is a combo chart ppt powerpoint presentation infographics introduction. This is a three stage process. The stages in this process are profit in percentage, business, graph, strategy, product.
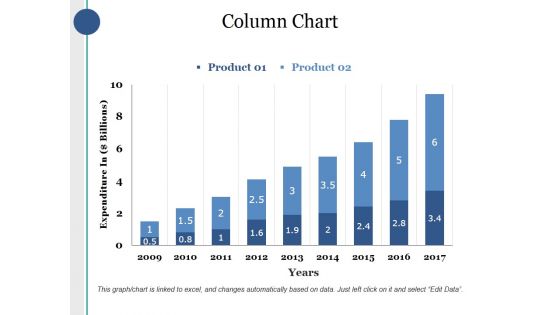
Column Chart Ppt PowerPoint Presentation Infographics Deck
This is a column chart ppt powerpoint presentation infographics deck. This is a two stage process. The stages in this process are product, expenditure in, years, bar graph, growth.
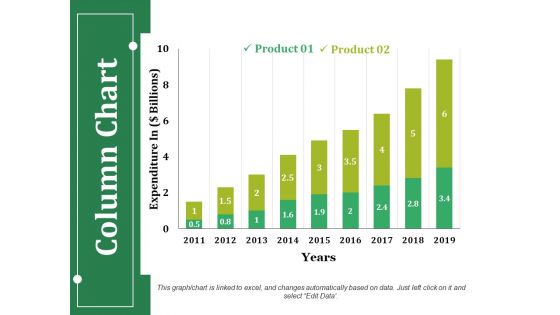
Column Chart Ppt PowerPoint Presentation Infographics Guidelines
This is a column chart ppt powerpoint presentation infographics guidelines. This is a two stage process. The stages in this process are product, expenditure in, years, business, bar graph.
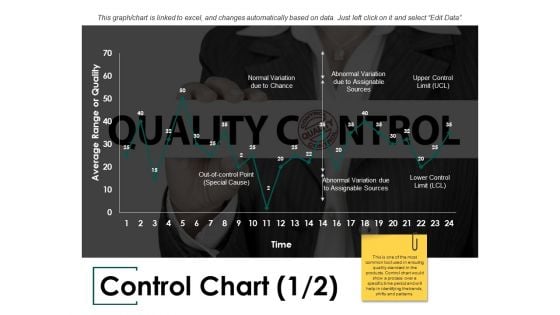
Control Chart Ppt PowerPoint Presentation Infographics Slide
This is a control chart ppt powerpoint presentation infographics slide. This is a two stage process. The stages in this process are normal variation due to chance, abnormal variation due to assignable sources, average range or quality.
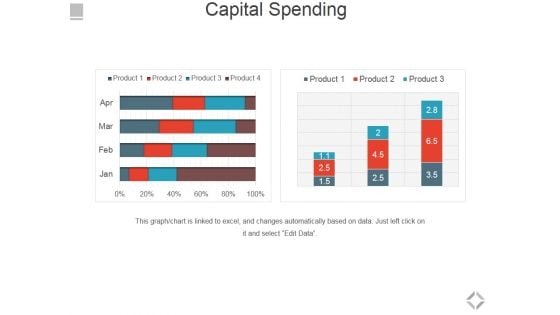
Capital Spending Ppt PowerPoint Presentation Infographics Show
This is a capital spending ppt powerpoint presentation infographics show. This is a two stage process. The stages in this process are capital spending, financials, business, marketing, growth.
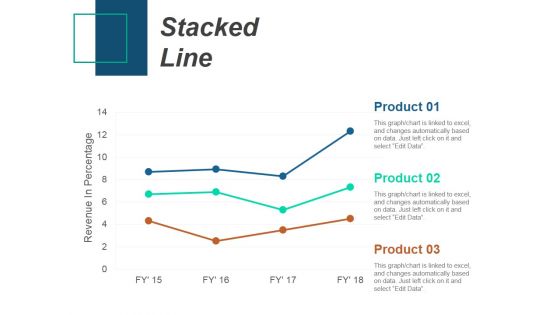
Stacked Line Ppt PowerPoint Presentation Infographics Slideshow
This is a stacked line ppt powerpoint presentation infographics slideshow. This is a three stage process. The stages in this process are stacked line, revenue in percentage, product.
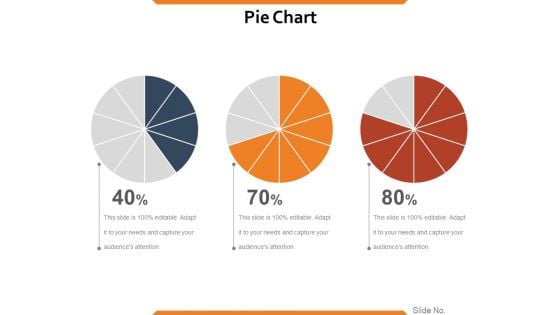
Pie Chart Ppt PowerPoint Presentation Infographics Show
This is a pie chart ppt powerpoint presentation infographics show. This is a three stage process. The stages in this process are process, percentage, business, marketing, success, pie chart.
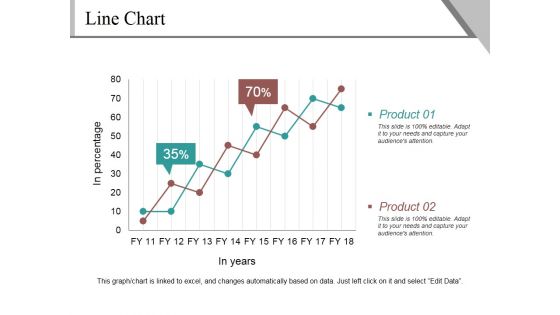
Line Chart Ppt PowerPoint Presentation Infographics Example
This is a line chart ppt powerpoint presentation infographics example. This is a two stage process. The stages in this process are product, in percentage, in years, finance, growth.
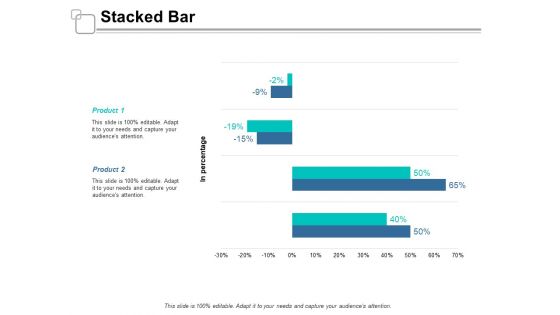
Stacked Bar Ppt Powerpoint Presentation Infographics Introduction
This is a stacked bar ppt powerpoint presentation infographics introduction. The topics discussed in this diagram are marketing, management, business, strategy, finance. This is a completely editable PowerPoint presentation, and is available for immediate download.
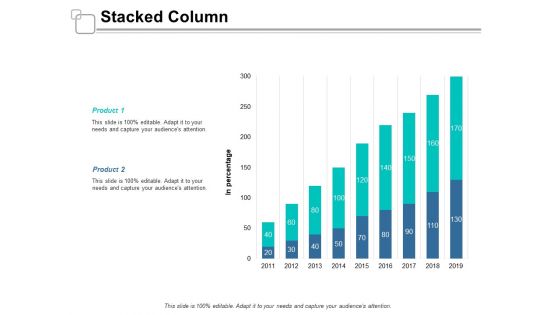
Stacked Column Ppt Powerpoint Presentation Infographics Portfolio
This is a stacked column ppt powerpoint presentation infographics portfolio. The topics discussed in this diagram are marketing, management, business, strategy, finance. This is a completely editable PowerPoint presentation, and is available for immediate download..
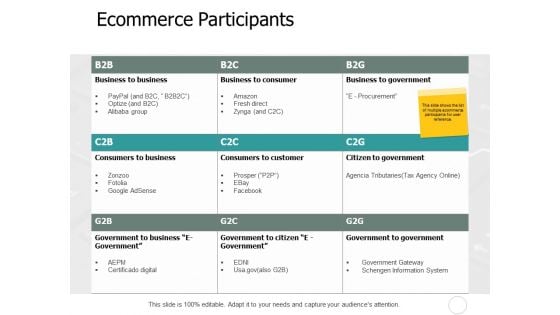
Ecommerce Participants Ppt PowerPoint Presentation Infographics Diagrams
This is a ecommerce participants ppt powerpoint presentation infographics diagrams. The topics discussed in this diagram are business, management, planning, strategy, marketing. This is a completely editable PowerPoint presentation, and is available for immediate download.
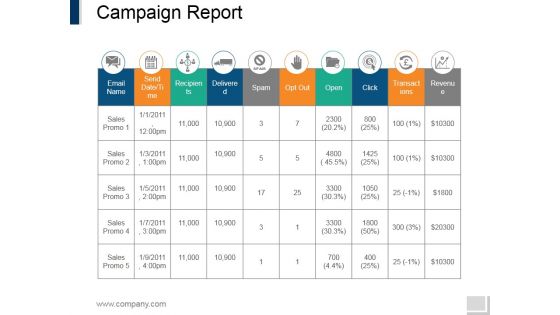
Campaign Report Ppt PowerPoint Presentation Infographics Diagrams
This is a campaign report ppt powerpoint presentation infographics diagrams. This is a nine stage process. The stages in this process are email name, send date, recipients, delivered, spam, transactions.
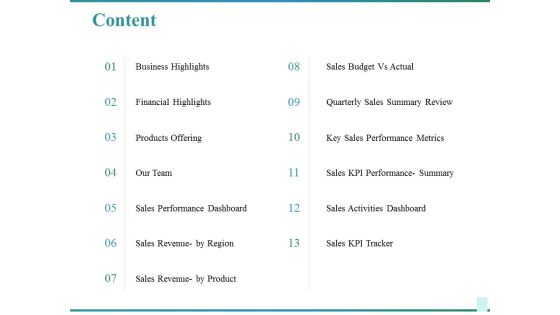
Content Ppt PowerPoint Presentation Infographics Diagrams
This is a content ppt powerpoint presentation infographics diagrams. This is a thirteen stage process. The stages in this process are business highlights, financial highlights, products offering, sales performance dashboard, sales revenue by region.
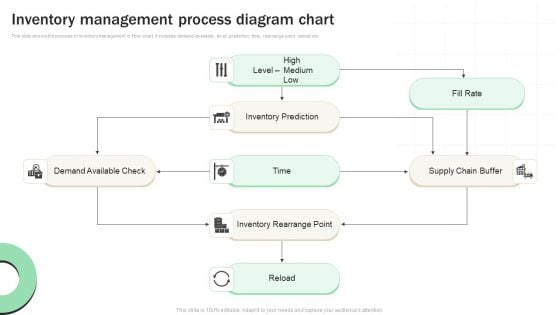
Inventory Management Process Diagram Chart Infographics PDF
This slide shows the process of inventory management in flow chart. It includes demand available, level, prediction, time, rearrange point, reload etc. Pitch your topic with ease and precision using this Inventory Management Process Diagram Chart Infographics PDF. This layout presents information on Demand Available Check, Inventory Rearrange Point, Supply Chain Buffer. It is also available for immediate download and adjustment. So, changes can be made in the color, design, graphics or any other component to create a unique layout.

Four Quarter Merchandise Development Roadmap Template Infographics
We present our four quarter merchandise development roadmap template infographics. This PowerPoint layout is easy-to-edit so you can change the font size, font type, color, and shape conveniently. In addition to this, the PowerPoint layout is Google Slides compatible, so you can share it with your audience and give them access to edit it. Therefore, download and save this well-researched four quarter merchandise development roadmap template infographics in different formats like PDF, PNG, and JPG to smoothly execute your business plan.
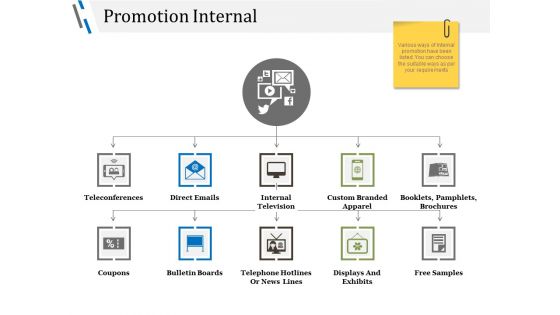
Promotion Internal Ppt PowerPoint Presentation Infographics Vector
This is a promotion internal ppt powerpoint presentation infographics vector. This is a three stage process. The stages in this process are teleconferences, direct emails, internal television, custom branded apparel, coupons.
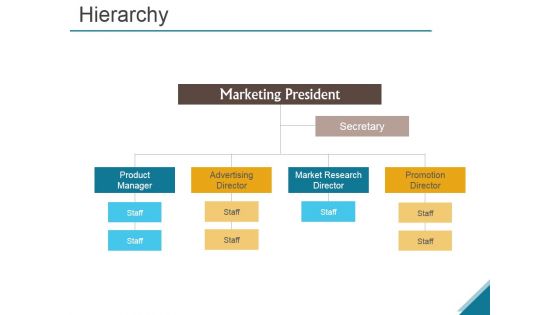
Hierarchy Ppt PowerPoint Presentation Infographics Portrait
This is a hierarchy ppt powerpoint presentation infographics portrait. This is a four stage process. The stages in this process are marketing president, product manager, advertising director, market research director, promotion director, secretary.
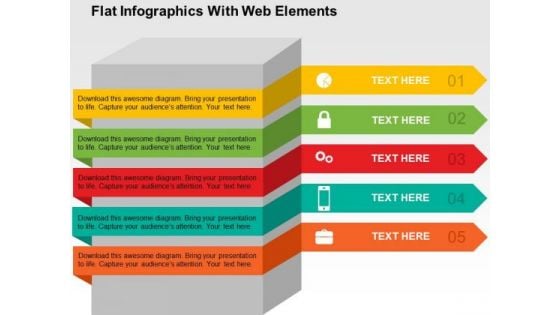
Flat Infographics With Web Elements PowerPoint Templates
Use this diagram of flat Infographics to illustrate business processes. This web elements diagram may also be used to display flow of business steps. This slide is designed to attract the attention of your audience towards business process analysis.
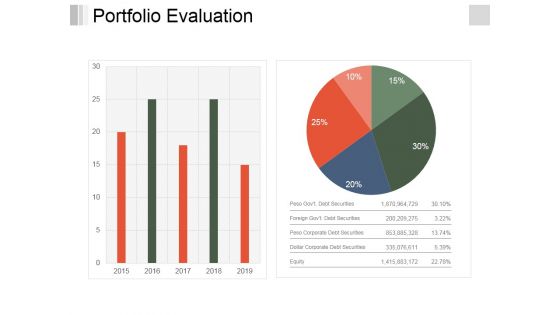
Portfolio Evaluation Ppt PowerPoint Presentation Infographics Objects
This is a portfolio evaluation ppt powerpoint presentation infographics objects. This is a two stage process. The stages in this process are business, finance, bar graph, pie chart, marketing, analysis, investment.
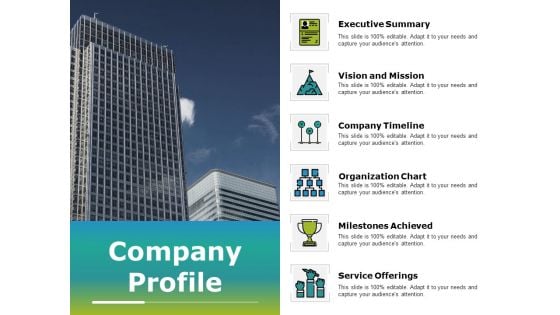
Company Profile Ppt PowerPoint Presentation Infographics Information
This is a company profile ppt powerpoint presentation infographics information. This is a six stage process. The stages in this process are executive summary, vision and mission, company timeline, organization chart, service offerings.
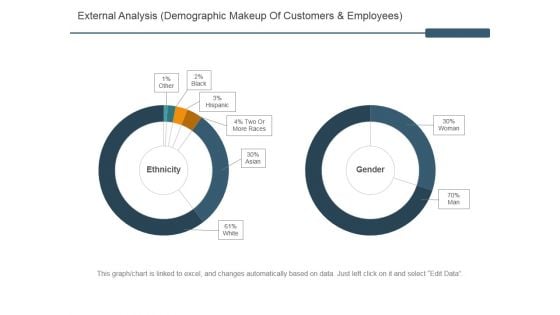
External Analysis Ppt PowerPoint Presentation Infographics Information
This is a external analysis ppt powerpoint presentation infographics information. This is a seven stage process. The stages in this process are education, police, hm forces, local government, civil service.
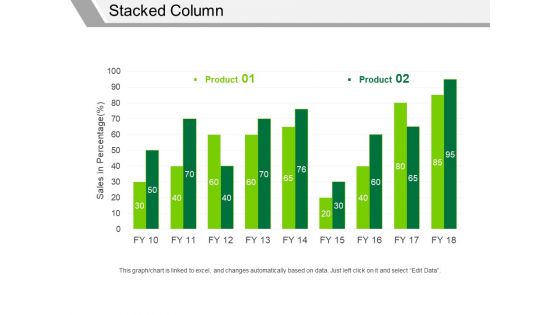
Stacked Column Ppt PowerPoint Presentation Infographics Samples
This is a stacked column ppt powerpoint presentation infographics samples. This is a two stage process. The stages in this process are product, sales in percentage, business, marketing, graph.
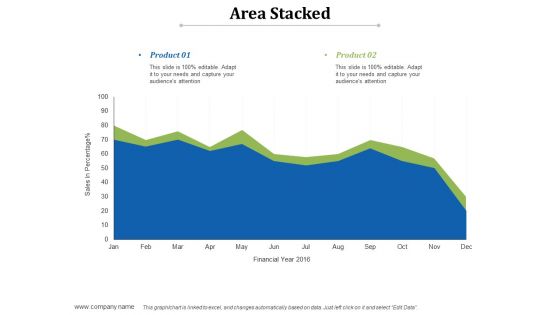
Area Stacked Ppt PowerPoint Presentation Infographics Shapes
This is a area stacked ppt powerpoint presentation infographics shapes. This is a two stage process. The stages in this process are product, area stacked, sales in percentage, financial year.
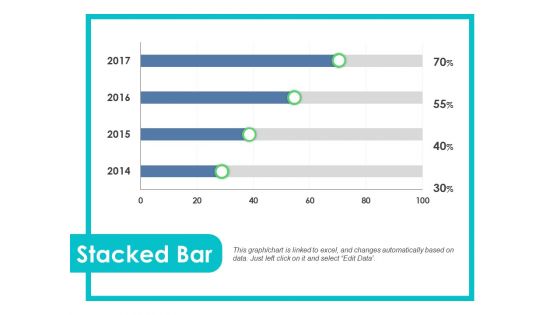
Stacked Bar Ppt PowerPoint Presentation Infographics Elements
This is a stacked bar ppt powerpoint presentation infographics elements. This is a four stages process. The stages in this process are stacked bar, finance, planning, management, strategy, business.
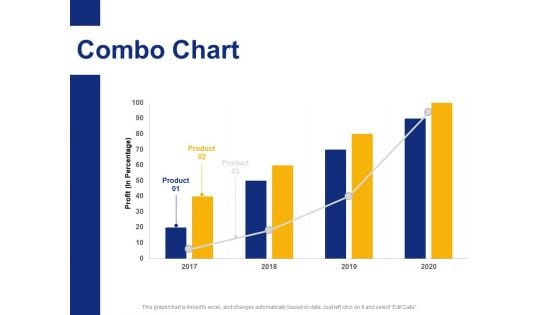
Combo Chart Ppt PowerPoint Presentation Infographics Objects
Presenting this set of slides with name combo chart ppt powerpoint presentation infographics objects. The topics discussed in these slide is combo chart. This is a completely editable PowerPoint presentation and is available for immediate download. Download now and impress your audience.
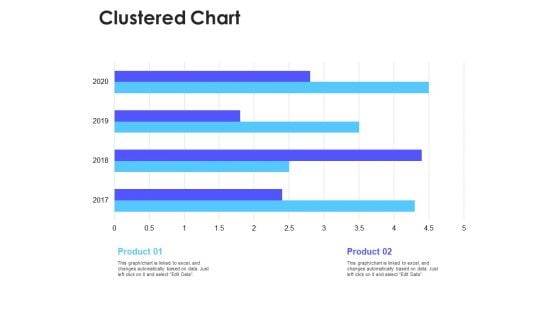
Clustered Chart Ppt PowerPoint Presentation Infographics Good
Presenting this set of slides with name clustered chart ppt powerpoint presentation infographics good. The topics discussed in these slide is clustered chart. This is a completely editable PowerPoint presentation and is available for immediate download. Download now and impress your audience.
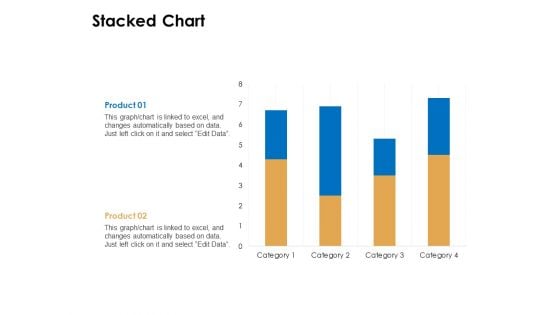
Stacked Chart Ppt PowerPoint Presentation Infographics Images
Presenting this set of slides with name area stacked chart ppt powerpoint presentation infographics images. The topics discussed in these slide is stacked chart. This is a completely editable PowerPoint presentation and is available for immediate download. Download now and impress your audience.
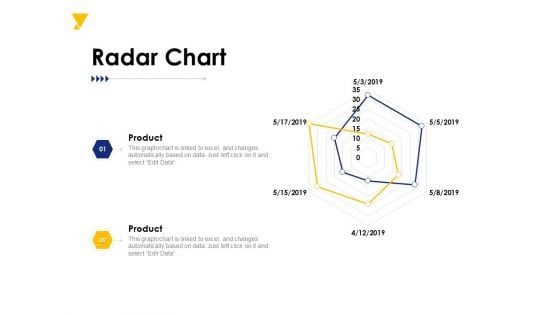
Radar Chart Ppt PowerPoint Presentation Infographics Deck
Presenting this set of slides with name radar chart ppt powerpoint presentation infographics deck. The topics discussed in these slide is radar chart. This is a completely editable PowerPoint presentation and is available for immediate download. Download now and impress your audience.
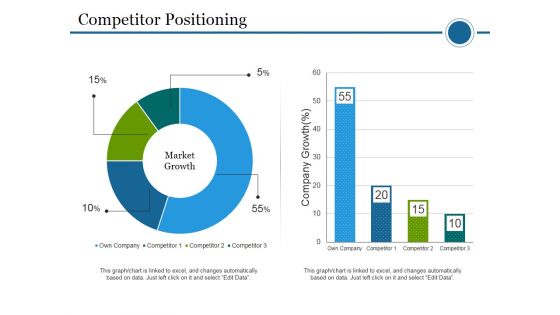
Competitor Positioning Ppt PowerPoint Presentation Infographics Gridlines
This is a competitor positioning ppt powerpoint presentation infographics gridlines. This is a two stage process. The stages in this process are competitor positioning, company, growth, market growth, business, marketing.
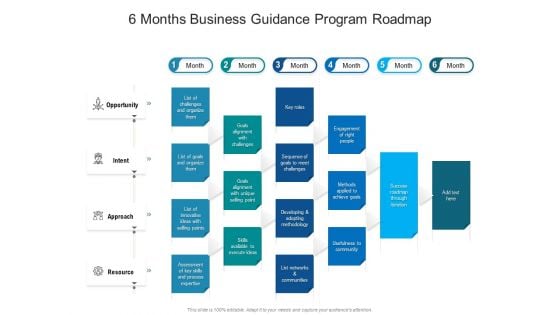
6 Months Business Guidance Program Roadmap Infographics
We present our 6 months business guidance program roadmap infographics. This PowerPoint layout is easy-to-edit so you can change the font size, font type, color, and shape conveniently. In addition to this, the PowerPoint layout is Google Slides compatible, so you can share it with your audience and give them access to edit it. Therefore, download and save this well-researched 6 months business guidance program roadmap infographics in different formats like PDF, PNG, and JPG to smoothly execute your business plan.
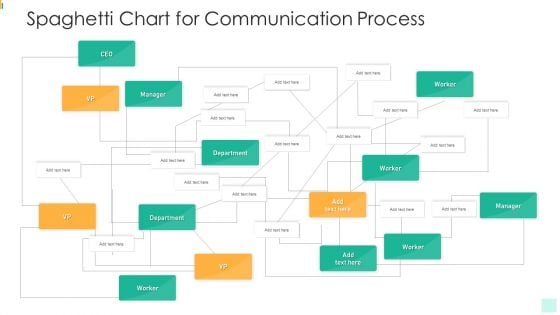
Spaghetti Chart For Communication Process Infographics PDF
Showcasing this set of slides titled spaghetti chart for communication process infographics pdf. The topics addressed in these templates are spaghetti chart for communication process. All the content presented in this PPT design is completely editable. Download it and make adjustments in color, background, font etc. as per your unique business setting.
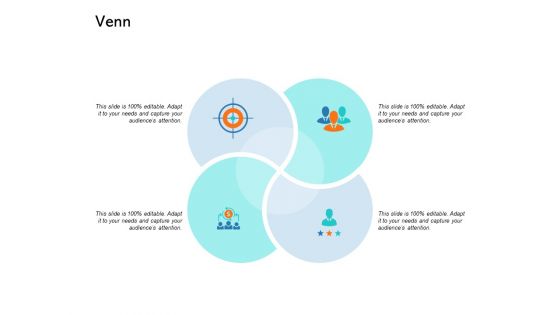
Venn Marketing Ppt PowerPoint Presentation Infographics Brochure
Presenting this set of slides with name venn marketing ppt powerpoint presentation infographics brochure. This is a four stage process. The stages in this process are venn. This is a completely editable PowerPoint presentation and is available for immediate download. Download now and impress your audience.
Venn Ppt PowerPoint Presentation Infographics Design Templates
Presenting this set of slides with name venn ppt powerpoint presentation infographics design templates. This is a four stage process. The stages in this process are venn. This is a completely editable PowerPoint presentation and is available for immediate download. Download now and impress your audience.
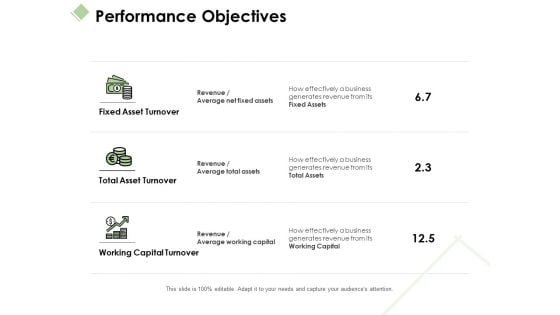
Performance Objectives Ppt PowerPoint Presentation Infographics Themes
Presenting this set of slides with name performance objectives ppt powerpoint presentation infographics themes. This is a three stage process. The stages in this process are fixed asset turnover, total asset turnover, working capital turnover. This is a completely editable PowerPoint presentation and is available for immediate download. Download now and impress your audience.
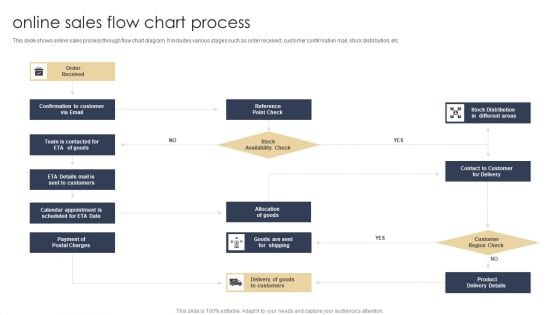
Online Sales Flow Chart Process Infographics PDF
This slide shows online sales process through flow chart diagram. It includes various stages such as order received, customer confirmation mail, stock distribution, etc. Showcasing this set of slides titled Online Sales Flow Chart Process Infographics PDF. The topics addressed in these templates are Customers, Product, Payment. All the content presented in this PPT design is completely editable. Download it and make adjustments in color, background, font etc. as per your unique business setting.
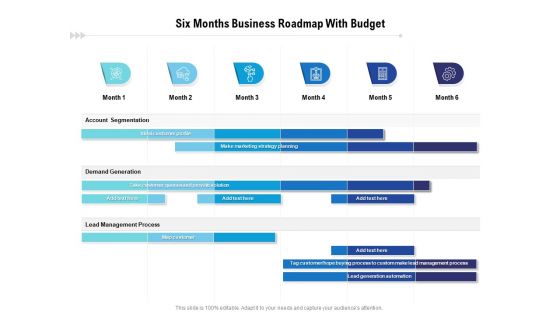
Six Months Business Roadmap With Budget Infographics
We present our six months business roadmap with budget infographics. This PowerPoint layout is easy to edit so you can change the font size, font type, color, and shape conveniently. In addition to this, the PowerPoint layout is Google Slides compatible, so you can share it with your audience and give them access to edit it. Therefore, download and save this well researched six months business roadmap with budget infographics in different formats like PDF, PNG, and JPG to smoothly execute your business plan.
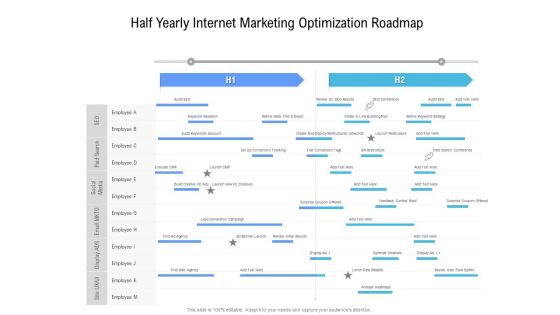
Half Yearly Internet Marketing Optimization Roadmap Infographics
We present our half yearly internet marketing optimization roadmap infographics. This PowerPoint layout is easy to edit so you can change the font size, font type, color, and shape conveniently. In addition to this, the PowerPoint layout is Google Slides compatible, so you can share it with your audience and give them access to edit it. Therefore, download and save this well researched half yearly internet marketing optimization roadmap infographics in different formats like PDF, PNG, and JPG to smoothly execute your business plan.
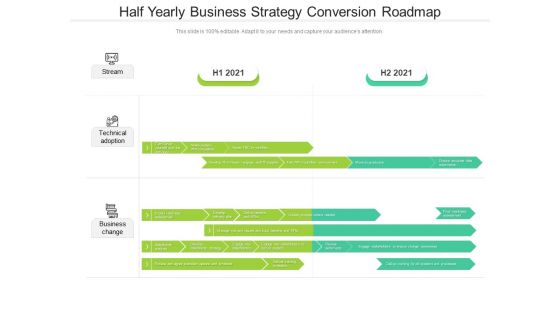
Half Yearly Business Strategy Conversion Roadmap Infographics
We present our half yearly business strategy conversion roadmap infographics. This PowerPoint layout is easy to edit so you can change the font size, font type, color, and shape conveniently. In addition to this, the PowerPoint layout is Google Slides compatible, so you can share it with your audience and give them access to edit it. Therefore, download and save this well researched half yearly business strategy conversion roadmap infographics in different formats like PDF, PNG, and JPG to smoothly execute your business plan.
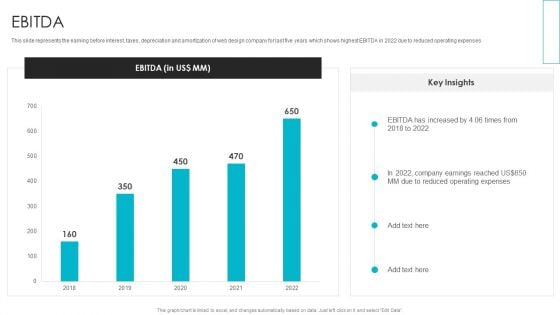
Web Design Company Overview EBITDA Infographics PDF
This slide represents the earning before interest, taxes, depreciation and amortization of web design company for last five years which shows highest EBITDA in 2022 due to reduced operating expenses. Here you can discover an assortment of the finest PowerPoint and Google Slides templates. With these templates, Web Design Company Overview EBITDA Infographics PDF can create presentations for a variety of purposes while simultaneously providing your audience with an eye catching visual experience. Download Web Design Company Overview EBITDA Infographics PDF to deliver an impeccable presentation. These templates will make your job of preparing presentations much quicker, yet still, maintain a high level of quality. Slidegeeks has experienced researchers who prepare these templates and write high quality content for you. Later on, you can personalize the content by editing the Web Design Company Overview EBITDA Infographics PDF.
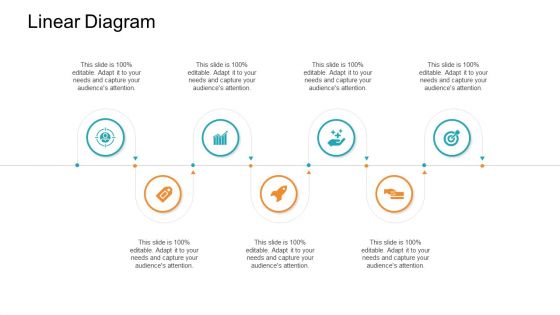
Retail Sector Introduction Linear Diagram Infographics PDF
This is a retail sector introduction linear diagram infographics pdf. template with various stages. Focus and dispense information on seven stages using this creative set, that comes with editable features. It contains large content boxes to add your information on topics like linear diagram. You can also showcase facts, figures, and other relevant content using this PPT layout. Grab it now.
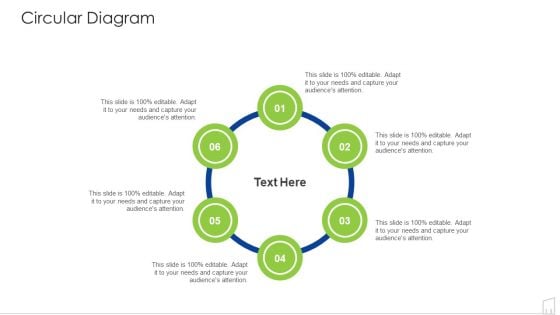
Circular Diagram Ppt Layouts Infographics PDF
Presenting circular diagram ppt layouts infographics pdf to provide visual cues and insights. Share and navigate important information on six stages that need your due attention. This template can be used to pitch topics like circular diagram. In addtion, this PPT design contains high resolution images, graphics, etc, that are easily editable and available for immediate download.
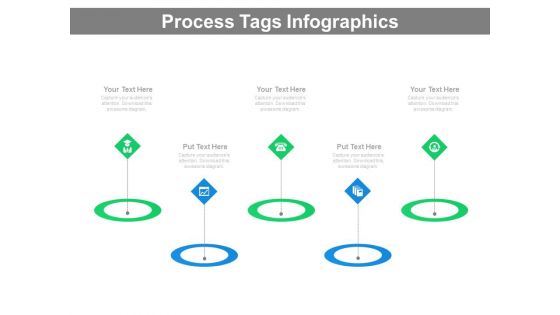
Linear Tags Infographics Diagram Powerpoint Slides
This PowerPoint template contains graphics of linear tags infographics diagram. This timeline slide is ready to use for business projects or education timeline. Download this PPT slide to demonstrate how you intend to navigate your steps towards the desired corporate goal.
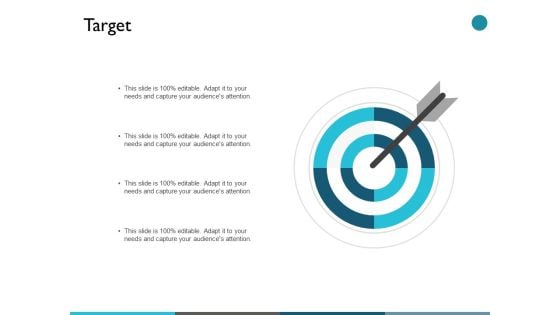
Target Competition Ppt PowerPoint Presentation Infographics Diagrams
Presenting this set of slides with name target competition ppt powerpoint presentation infographics diagrams. This is a one stage process. The stages in this process are our goal, arrow, target, planning, management. This is a completely editable PowerPoint presentation and is available for immediate download. Download now and impress your audience.
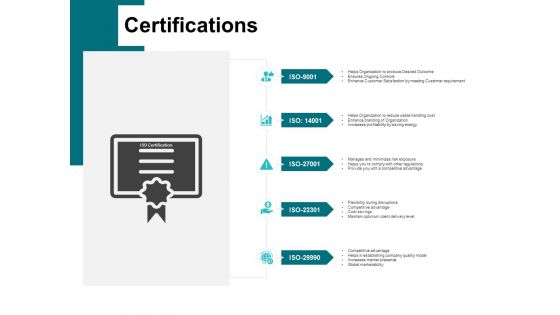
Certifications Management Ppt PowerPoint Presentation Infographics Diagrams
Presenting this set of slides with name certifications management ppt powerpoint presentation infographics diagrams. This is a five stage process. The stages in this process are business, management, planning, strategy, marketing. This is a completely editable PowerPoint presentation and is available for immediate download. Download now and impress your audience.

Mind Map Ppt PowerPoint Presentation Infographics Diagrams
Presenting this set of slides with name mind map ppt powerpoint presentation infographics diagrams. This is a one stage process. The stage in this process is mind map. This is a completely editable PowerPoint presentation and is available for immediate download. Download now and impress your audience.
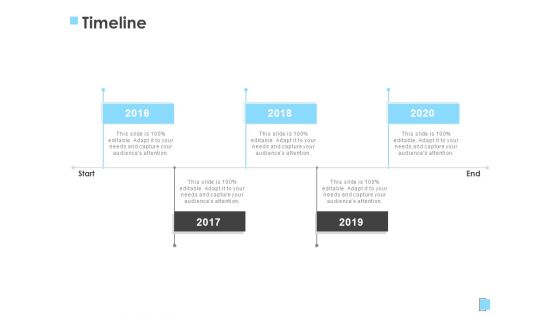
Strategic Management Timeline Ppt Infographics Diagrams PDF
This is a strategic management timeline ppt infographics diagrams pdf template with various stages. Focus and dispense information on five stages using this creative set, that comes with editable features. It contains large content boxes to add your information on topics like timeline, 2016 to 2020. You can also showcase facts, figures, and other relevant content using this PPT layout. Grab it now.
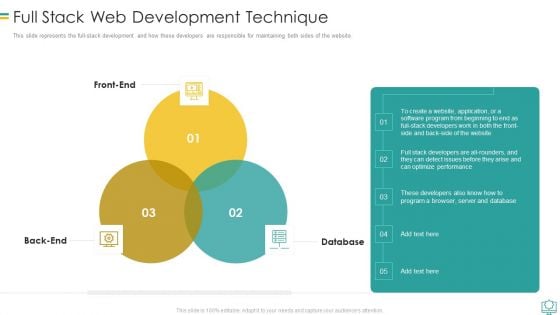
Full Stack Web Development Technique Infographics PDF
This slide represents the full stack development and how these developers are responsible for maintaining both sides of the website.Presenting Full Stack Web Development Technique Infographics PDF to provide visual cues and insights. Share and navigate important information on three stages that need your due attention. This template can be used to pitch topics like Program A Browser, Optimize Performance, Software Program In addtion, this PPT design contains high resolution images, graphics, etc, that are easily editable and available for immediate download.
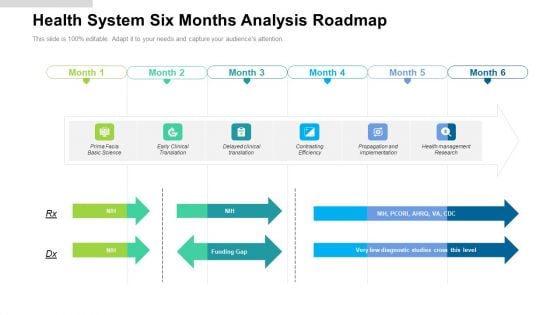
Health System Six Months Analysis Roadmap Infographics
We present our health system six months analysis roadmap infographics. This PowerPoint layout is easy to edit so you can change the font size, font type, color, and shape conveniently. In addition to this, the PowerPoint layout is Google Slides compatible, so you can share it with your audience and give them access to edit it. Therefore, download and save this well researched health system six months analysis roadmap infographics in different formats like PDF, PNG, and JPG to smoothly execute your business plan.
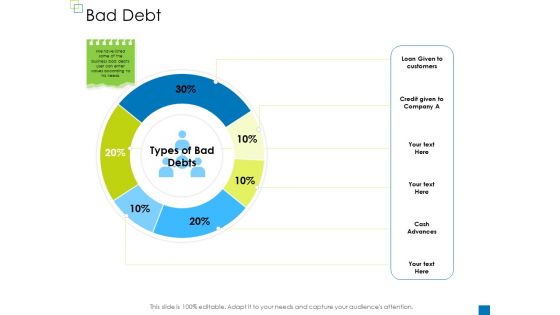
Enterprise Management Bad Debt Infographics PDF
Deliver an awe-inspiring pitch with this creative enterprise management bad debt infographics pdf bundle. Topics like cash advances, loan given to customers, types of bad debts can be discussed with this completely editable template. It is available for immediate download depending on the needs and requirements of the user.
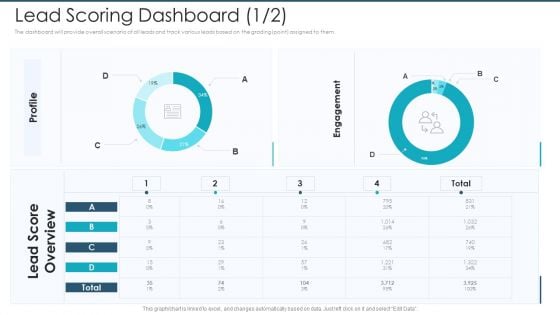
Lead Scoring Dashboard Profile Infographics PDF
The dashboard will provide overall scenario of all leads and track various leads based on the grading point assigned to them. Deliver an awe-inspiring pitch with this creative lead scoring dashboard profile infographics pdf. bundle. Topics like profile, lead score overview can be discussed with this completely editable template. It is available for immediate download depending on the needs and requirements of the user.
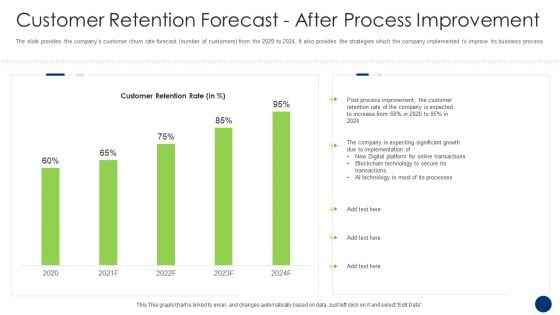
Customer Retention Forecastafter Process Improvement Infographics PDF
Deliver an awe inspiring pitch with this creative customer retention forecastafter process improvement infographics pdf bundle. Topics like new digital platform for online transactions, blockchain technology to secure its transactions, ai technology in most of its processes can be discussed with this completely editable template. It is available for immediate download depending on the needs and requirements of the user.
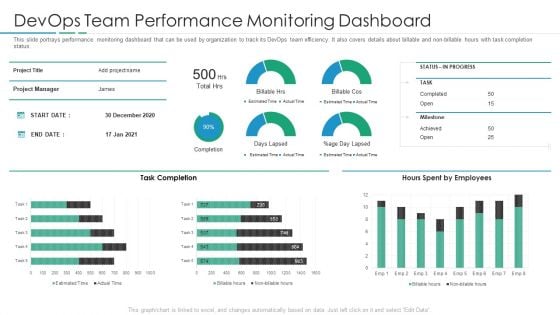
Devops Team Performance Monitoring Dashboard Infographics PDF
Deliver an awe inspiring pitch with this creative devops team performance monitoring dashboard infographics pdf bundle. Topics like devops team performance monitoring dashboard can be discussed with this completely editable template. It is available for immediate download depending on the needs and requirements of the user.
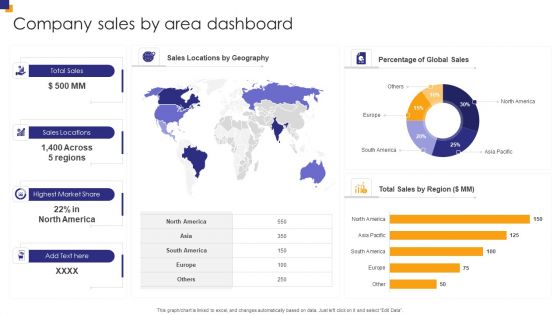
Company Sales By Area Dashboard Infographics PDF
Pitch your topic with ease and precision using this Company Sales By Area Dashboard Infographics PDF. This layout presents information on Total Sales, Sales Locations, Highest Market. It is also available for immediate download and adjustment. So, changes can be made in the color, design, graphics or any other component to create a unique layout.
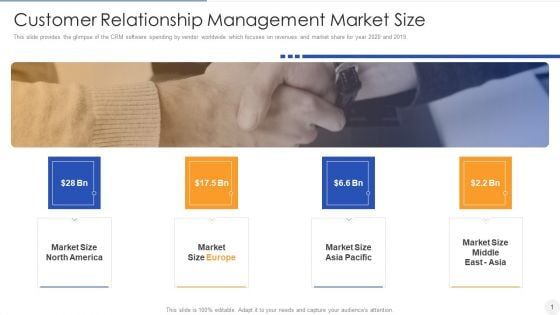
Customer Relationship Management Market Size Infographics PDF
This is a customer relationship management market size infographics pdf template with various stages. Focus and dispense information on four stages using this creative set, that comes with editable features. It contains large content boxes to add your information on topics like customer relationship management market size. You can also showcase facts, figures, and other relevant content using this PPT layout. Grab it now.
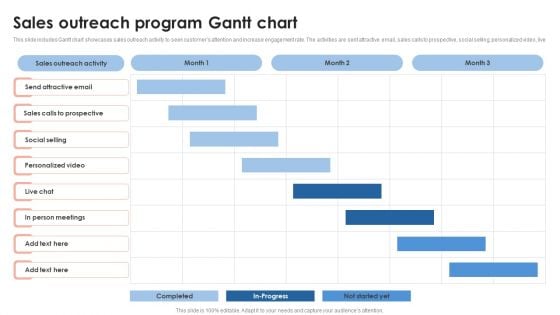
Sales Outreach Program Gantt Chart Infographics PDF
This slide includes Gantt chart showcases sales outreach activity to seek customers attention and increase engagement rate. The activities are sent attractive email, sales calls to prospective, social selling, personalized video, live chat and personal meeting. Pitch your topic with ease and precision using this Sales Outreach Program Gantt Chart Infographics PDF. This layout presents information on Attractive Email, Personalized Video, Person Meetings. It is also available for immediate download and adjustment. So, changes can be made in the color, design, graphics or any other component to create a unique layout.
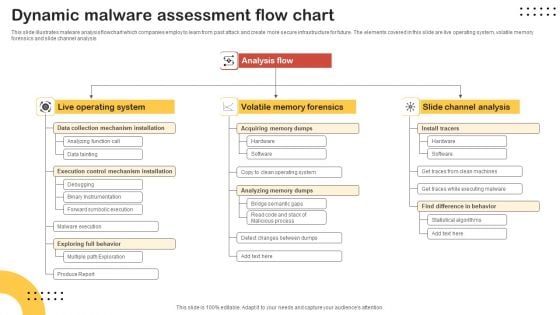
Dynamic Malware Assessment Flow Chart Infographics PDF
This slide illustrates malware analysis flowchart which companies employ to learn from past attack and create more secure infrastructure for future. The elements covered in this slide are live operating system, volatile memory forensics and slide channel analysis. Showcasing this set of slides titled Dynamic Malware Assessment Flow Chart Infographics PDF. The topics addressed in these templates are Live Operating System, Volatile Memory Forensics, Slide Channel Analysis. All the content presented in this PPT design is completely editable. Download it and make adjustments in color, background, font etc. as per your unique business setting.


 Continue with Email

 Home
Home


