Infographic Icons
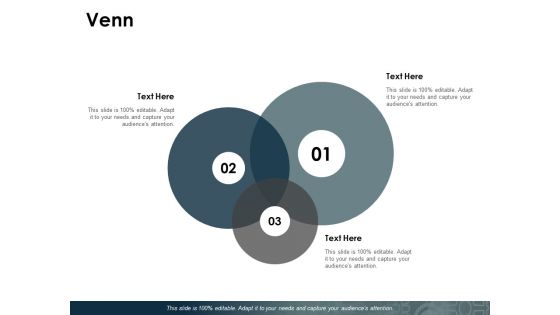
Venn Ppt PowerPoint Presentation Pictures Infographics
This is a venn ppt powerpoint presentation pictures infographics. This is a three stage process. The stages in this process are marketing, strategy, business.
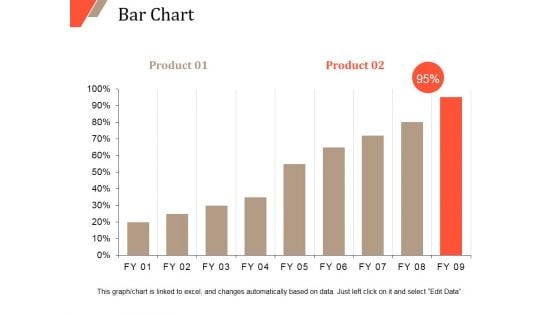
Bar Chart Ppt PowerPoint Presentation Outline Infographics
This is a bar chart ppt powerpoint presentation outline infographics. This is a two stage process. The stages in this process are bar chart, finance, marketing, strategy, analysis, business.
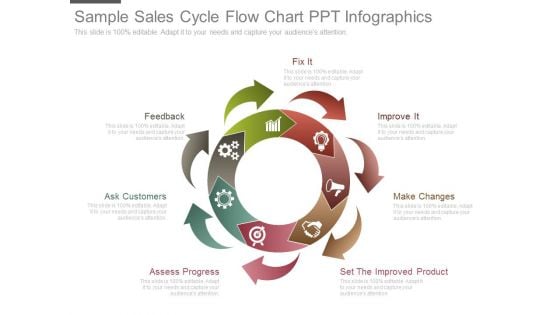
Sample Sales Cycle Flow Chart Ppt Infographics
This is a sample sales cycle flow chart ppt infographics. This is a seven stage process. The stages in this process are fix it, feedback, ask customers, assess progress, set the improved product, make changes, improve it.
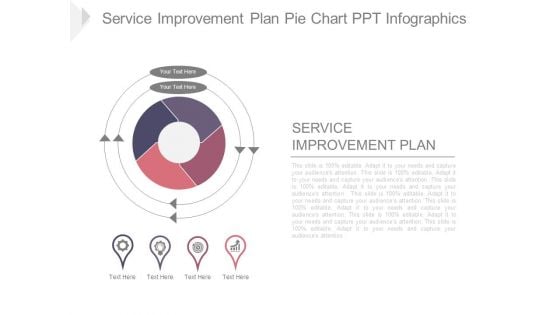
Service Improvement Plan Pie Chart Ppt Infographics
This is a service improvement plan pie chart ppt infographics. This is a four stage process. The stages in this process are service improvement plan, business, strategy, marketing, management.
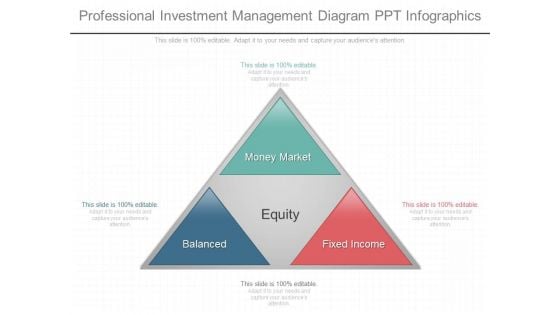
Professional Investment Management Diagram Ppt Infographics
This is a professional investment management diagram ppt infographics. This is a three stage process. The stages in this process are money market, equity, balanced, fixed income.
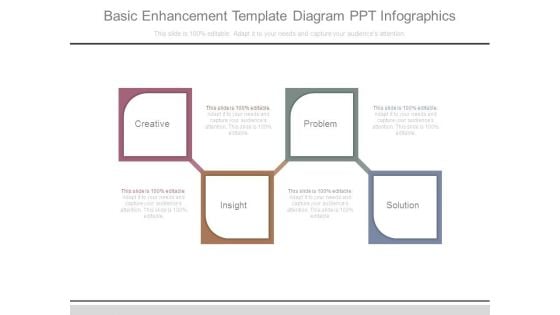
Basic Enhancement Template Diagram Ppt Infographics
This is a basic enhancement template diagram ppt infographics. This is a four stage process. The stages in this process are creative, problem, insight, solution.
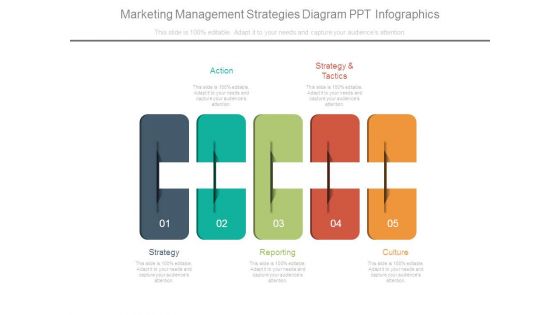
Marketing Management Strategies Diagram Ppt Infographics
This is a marketing management strategies diagram ppt infographics. This is a five stage process. The stages in this process are action, strategy and tactics, strategy, reporting, culture.
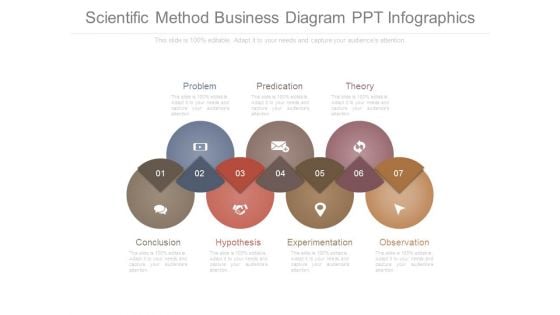
Scientific Method Business Diagram Ppt Infographics
This is a scientific method business diagram ppt infographics. This is a seven stage process. The stages in this process are conclusion, problem, hypothesis, predication, experimentation, theory, observation.
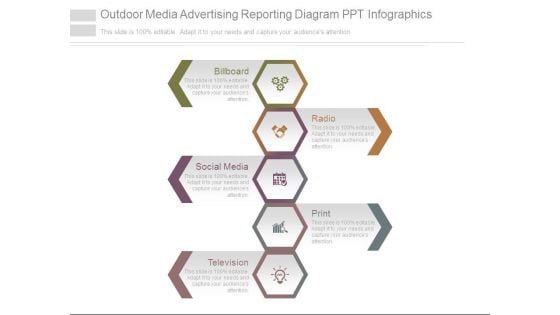
Outdoor Media Advertising Reporting Diagram Ppt Infographics
This is a outdoor media advertising reporting diagram ppt infographics. This is a five stage process. The stages in this process are billboard, radio, social media, print, television.
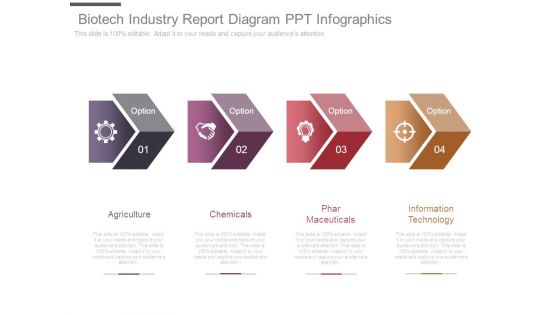
Biotech Industry Report Diagram Ppt Infographics
This is a biotech industry report diagram ppt infographics. This is a four stage process. The stages in this process are agriculture, chemicals, phar maceuticals, information technology.
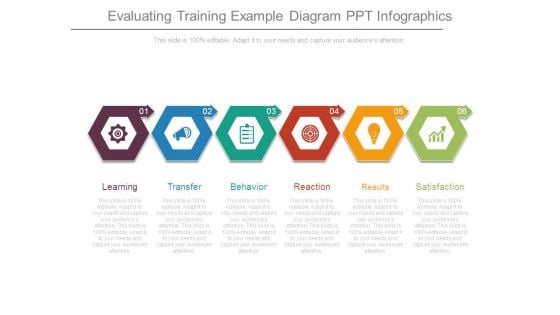
Evaluating Training Example Diagram Ppt Infographics
This is a evaluating training example diagram ppt infographics. This is a six stage process. The stages in this process are learning, transfer, behavior, reaction, results, satisfaction.
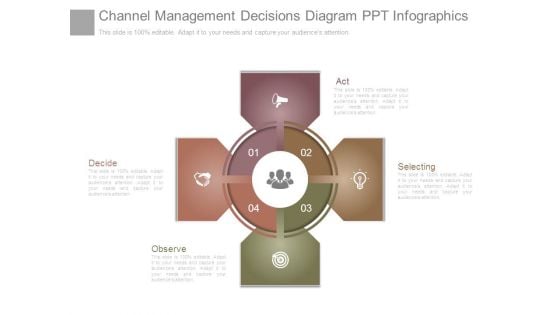
Channel Management Decisions Diagram Ppt Infographics
This is a channel management decisions diagram ppt infographics. This is a four stage process. The stages in this process are decide, observe, act, selecting.
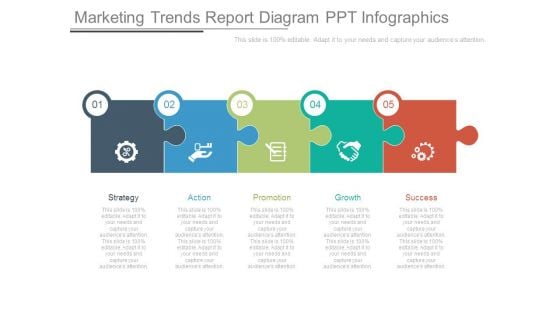
Marketing Trends Report Diagram Ppt Infographics
This is a marketing trends report diagram ppt infographics. This is a five stage process. The stages in this process are strategy, action, promotion, growth, success.
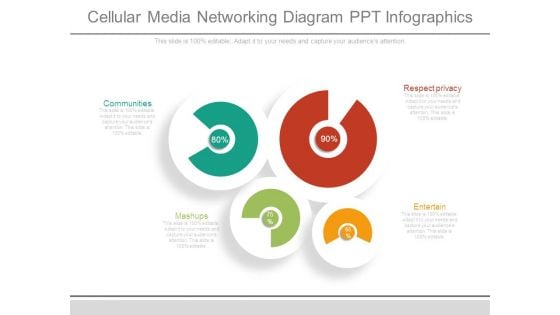
Cellular Media Networking Diagram Ppt Infographics
This is a cellular media networking diagram ppt infographics. This is a four stage process. The stages in this process are communities, mashups, respect privacy, entertain.
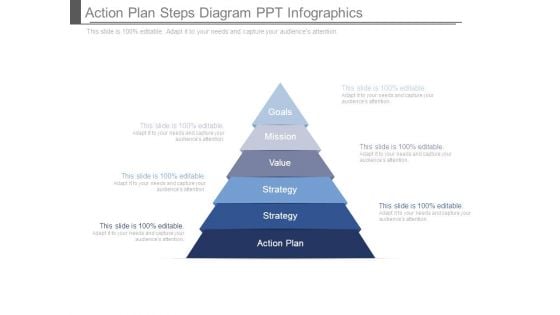
Action Plan Steps Diagram Ppt Infographics
This is a action plan steps diagram ppt infographics. This is a five stage process. The stages in this process are goals, mission, value, strategy, strategy, action plan.
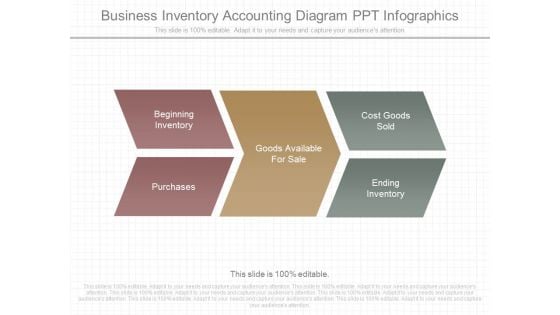
Business Inventory Accounting Diagram Ppt Infographics
This is a business inventory accounting diagram ppt infographics. This is a three stage process. The stages in this process are beginning inventory, purchases, goods available for sale, cost goods sold, ending inventory.
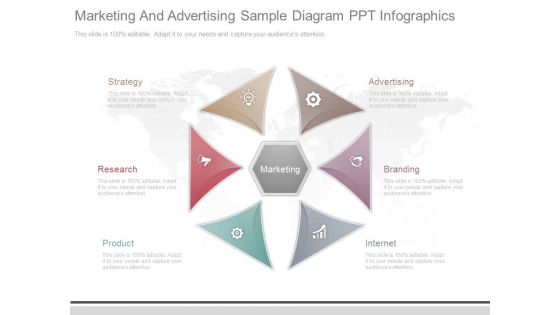
Marketing And Advertising Sample Diagram Ppt Infographics
This is a marketing and advertising sample diagram ppt infographics. This is a six stage process. The stages in this process are marketing, strategy, research, product, advertising, branding, internet.
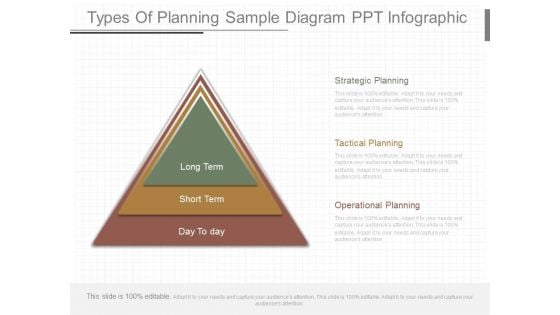
Types Of Planning Sample Diagram Ppt Infographics
This is a types of planning sample diagram ppt infographics. This is a three stage process. The stages in this process are long term, short term, day to day, strategic planning, tactical planning, operational planning.
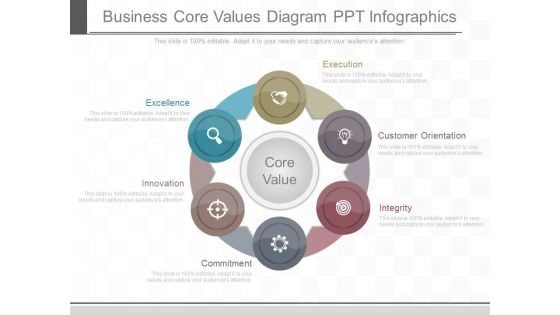
Business Core Values Diagram Ppt Infographics
This is a business core values diagram ppt infographics. This is a six stage process. The stages in this process are execution, customer orientation, integrity, commitment, innovation, excellence, core value.
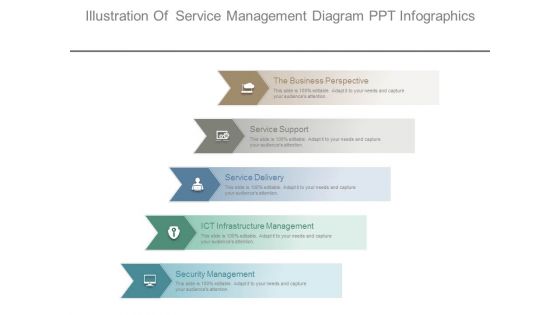
Illustration Of Service Management Diagram Ppt Infographics
This is a illustration of service management diagram ppt infographics. This is a five stage process. The stages in this process are the business perspective, service support, service delivery, ict infrastructure management, security management.
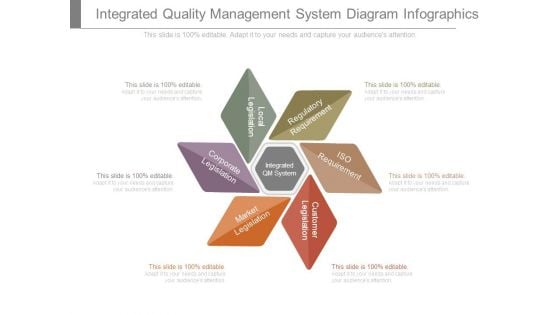
Integrated Quality Management System Diagram Infographics
This is a integrated quality management system diagram infographics. This is a six stage process. The stages in this process are integrated qm system, corporate legislation, local legislation, regulatory requirement, iso requirement, customer legislation, market legislation.
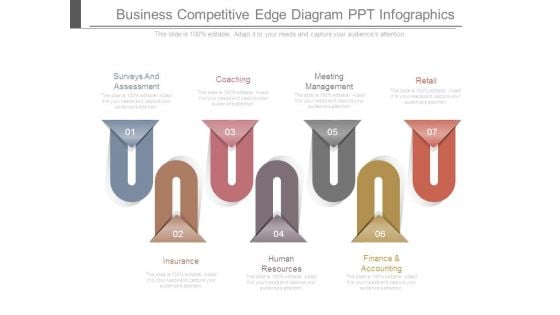
Business Competitive Edge Diagram Ppt Infographics
This is a business competitive edge diagram ppt infographics. This is a seven stage process. The stages in this process are surveys and assessment, coaching, meeting management, retail, insurance, human resources, finance and accounting.
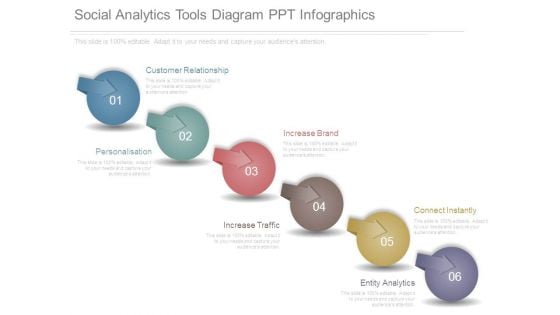
Social Analytics Tools Diagram Ppt Infographics
This is a social analytics tools diagram ppt infographics. This is a six stage process. The stages in this process are customer relationship, personalisation, increase brand, increase traffic, connect instantly, entity analytics.
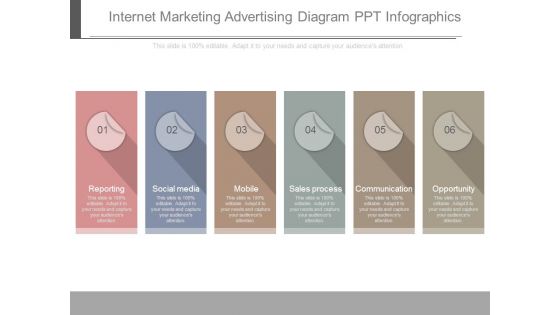
Internet Marketing Advertising Diagram Ppt Infographics
This is a internet marketing advertising diagram ppt infographics. This is a six stage process. The stages in this process are reporting, social media, mobile, sales process, communication, opportunity.
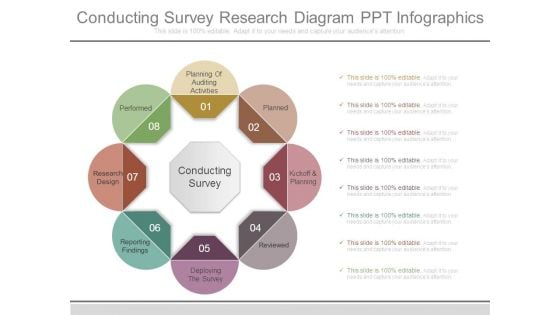
Conducting Survey Research Diagram Ppt Infographics
This is a conducting survey research diagram ppt infographics. This is a eight stage process. The stages in this process are planned, kickoff and planning, reviewed, deploying the survey, reporting findings, research design, performed, planning of auditing activities, conducting survey.
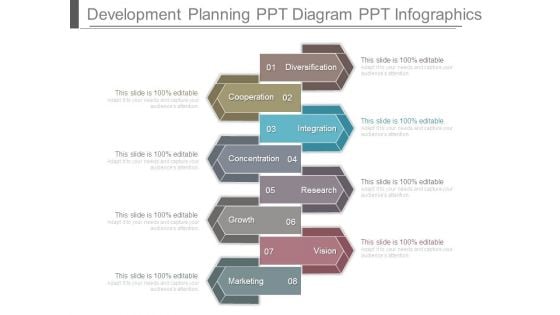
Development Planning Ppt Diagram Ppt Infographics
This is a development planning ppt diagram ppt infographics. This is a eight stage process. The stages in this process are diversification, cooperation, integration, concentration, research, growth, vision, marketing.
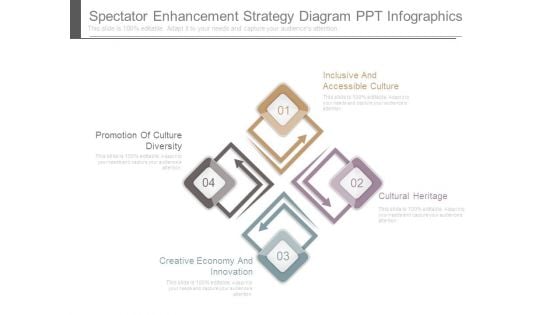
Spectator Enhancement Strategy Diagram Ppt Infographics
This is a spectator enhancement strategy diagram ppt infographics. This is a four stage process. The stages in this process are promotion of culture diversity, creative economy and innovation, cultural heritage, inclusive and accessible culture.
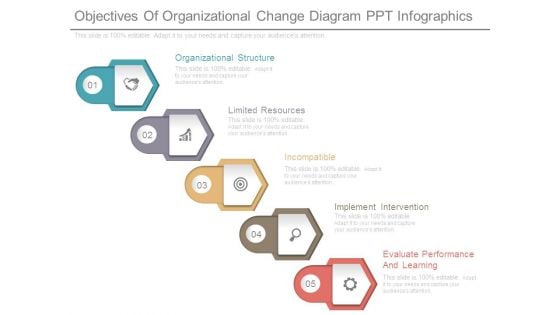
Objectives Of Organizational Change Diagram Ppt Infographics
This is a objectives of organizational change diagram ppt infographics. This is a five stage process. The stages in this process are organizational structure, limited resources, incompatible, implement intervention, evaluate performance and learning.
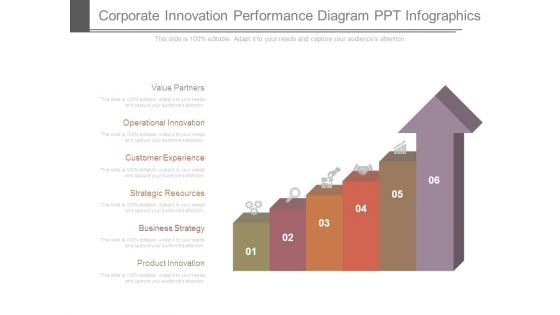
Corporate Innovation Performance Diagram Ppt Infographics
This is a corporate innovation performance diagram ppt infographics. This is a six stage process. The stages in this process are value partners, operational innovation, customer experience, strategic resources, business strategy, product innovation.
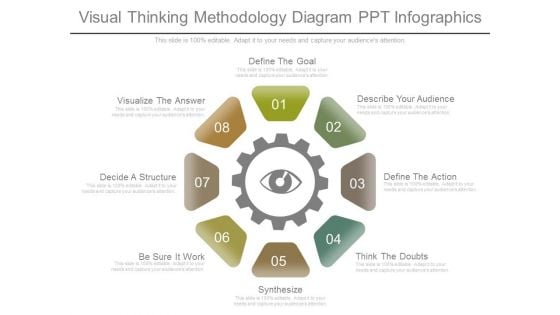
Visual Thinking Methodology Diagram Ppt Infographics
This is a visual thinking methodology diagram ppt infographics. This is a eight stage process. The stages in this process are define the goal, describe your audience, define the action, think the doubts, synthesize, be sure it work, decide a structure, visualize the answer.
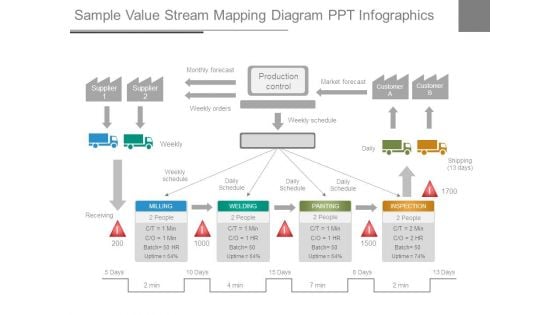
Sample Value Stream Mapping Diagram Ppt Infographics
This is a sample value stream mapping diagram ppt infographics. This is a four stage process. The stages in this process are supplier, monthly forecast, production control, market forecast, customer, weekly orders, weekly schedule, weekly, daily schedule, daily, shipping, receiving, milling, welding, painting, inspection, people, batch, uptime.
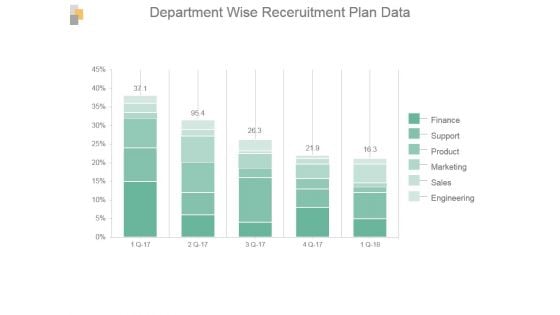
Department Wise Recruitment Plan Data Ppt Infographics
This is a department wise recruitment plan data ppt infographics. This is a five stage process. The stages in this process are finance, support, product, marketing, sales, engineering.
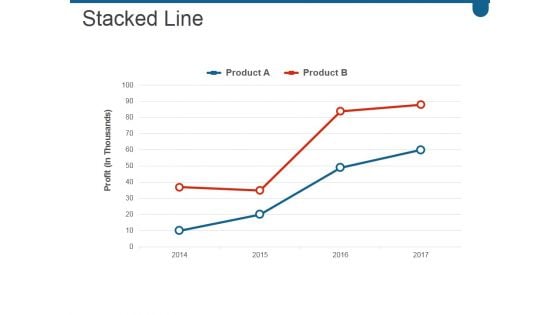
Stacked Line Ppt PowerPoint Presentation Infographics
This is a stacked line ppt powerpoint presentation infographics. This is a two stage process. The stages in this process are business, marketing, growth, success, line.
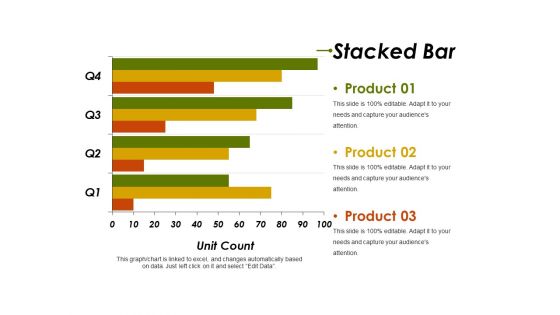
Stacked Bar Ppt PowerPoint Presentation Summary Infographics
This is a stacked bar ppt powerpoint presentation summary infographics. This is a four stage process. The stages in this process are product, unit count, business, marketing, graph.
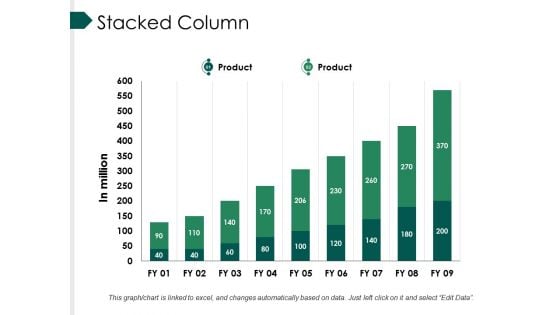
Stacked Column Ppt PowerPoint Presentation Professional Infographics
This is a stacked column ppt powerpoint presentation professional infographics. This is a nine stage process. The stages in this process are bar, marketing, strategy, finance, teamwork.
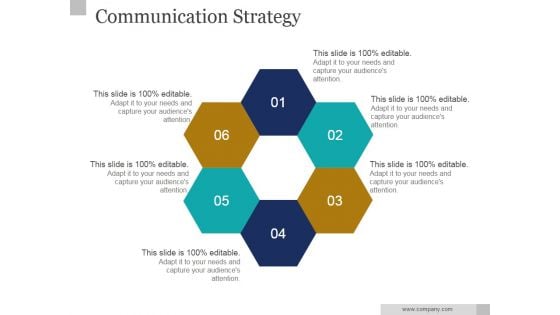
Communication Strategy Ppt PowerPoint Presentation Infographics
This is a communication strategy ppt powerpoint presentation infographics. This is a six stage process. The stages in this process are business, marketing, diagram, presentation.
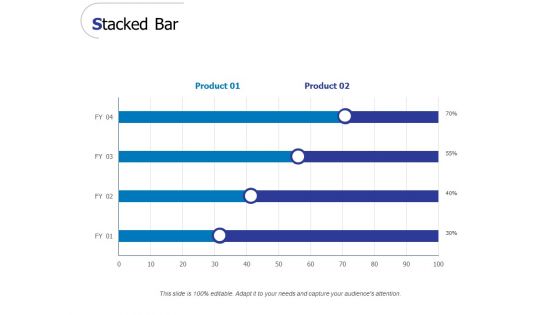
Stacked Bar Ppt PowerPoint Presentation Gallery Infographics
Presenting this set of slides with name stacked bar ppt powerpoint presentation gallery infographics. The topics discussed in these slide is stacked bar. This is a completely editable PowerPoint presentation and is available for immediate download. Download now and impress your audience.
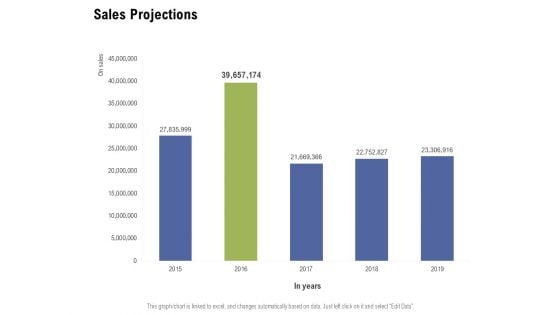
Sales Projections Ppt PowerPoint Presentation Outline Infographics
Presenting this set of slides with name sales projections ppt powerpoint presentation outline infographics. The topics discussed in these slide is sales projections. This is a completely editable PowerPoint presentation and is available for immediate download. Download now and impress your audience.
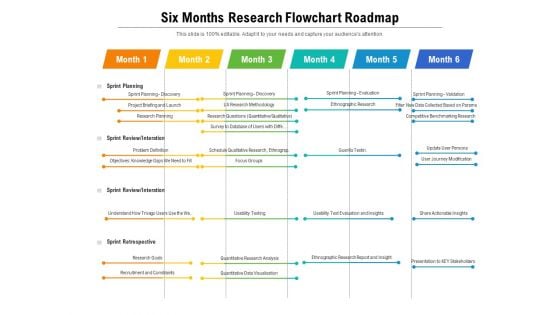
Six Months Research Flowchart Roadmap Infographics
Presenting our jaw-dropping six months research flowchart roadmap infographics. You can alternate the color, font size, font type, and shapes of this PPT layout according to your strategic process. This PPT presentation is compatible with Google Slides and is available in both standard screen and widescreen aspect ratios. You can also download this well-researched PowerPoint template design in different formats like PDF, JPG, and PNG. So utilize this visually-appealing design by clicking the download button given below.
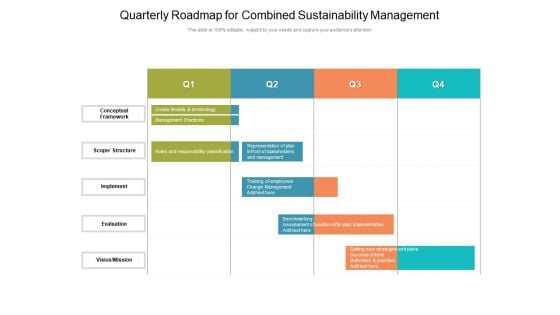
Quarterly Roadmap For Combined Sustainability Management Infographics
Presenting our jaw-dropping quarterly roadmap for combined sustainability management infographics. You can alternate the color, font size, font type, and shapes of this PPT layout according to your strategic process. This PPT presentation is compatible with Google Slides and is available in both standard screen and widescreen aspect ratios. You can also download this well-researched PowerPoint template design in different formats like PDF, JPG, and PNG. So utilize this visually-appealing design by clicking the download button given below.
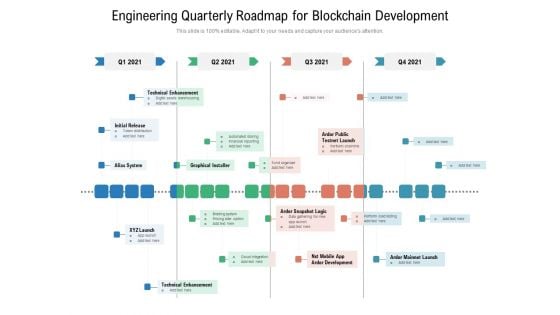
Engineering Quarterly Roadmap For Blockchain Development Infographics
Introducing our engineering quarterly roadmap for blockchain development infographics. This PPT presentation is Google Slides compatible, therefore, you can share it easily with the collaborators for measuring the progress. Also, the presentation is available in both standard screen and widescreen aspect ratios. So edit the template design by modifying the font size, font type, color, and shapes as per your requirements. As this PPT design is fully editable it can be presented in PDF, JPG and PNG formats.
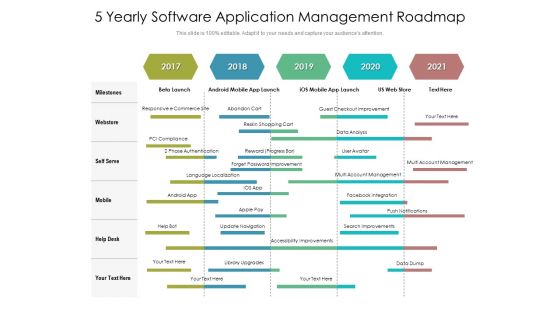
5 Yearly Software Application Management Roadmap Infographics
Presenting our jaw-dropping 5 yearly software application management roadmap infographics. You can alternate the color, font size, font type, and shapes of this PPT layout according to your strategic process. This PPT presentation is compatible with Google Slides and is available in both standard screen and widescreen aspect ratios. You can also download this well-researched PowerPoint template design in different formats like PDF, JPG, and PNG. So utilize this visually-appealing design by clicking the download button given below.
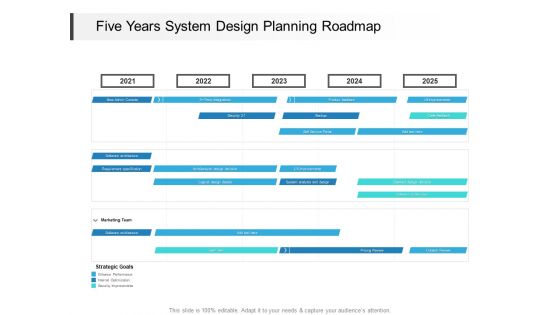
Five Years System Design Planning Roadmap Infographics
Presenting our jaw dropping five years system design planning roadmap infographics. You can alternate the color, font size, font type, and shapes of this PPT layout according to your strategic process. This PPT presentation is compatible with Google Slides and is available in both standard screen and widescreen aspect ratios. You can also download this well researched PowerPoint template design in different formats like PDF, JPG, and PNG. So utilize this visually appealing design by clicking the download button given below.
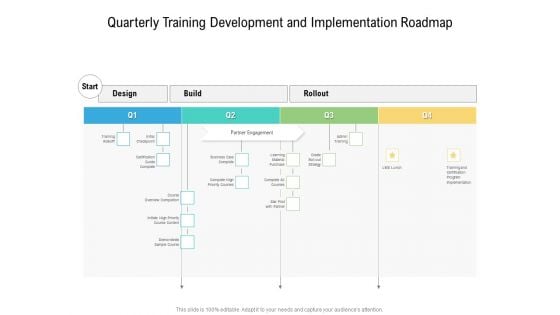
Quarterly Training Development And Implementation Roadmap Infographics
Presenting our jaw-dropping quarterly training development and implementation roadmap infographics. You can alternate the color, font size, font type, and shapes of this PPT layout according to your strategic process. This PPT presentation is compatible with Google Slides and is available in both standard screen and widescreen aspect ratios. You can also download this well-researched PowerPoint template design in different formats like PDF, JPG, and PNG. So utilize this visually-appealing design by clicking the download button given below.
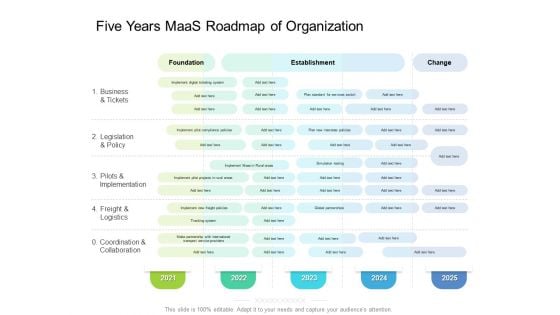
Five Years Maas Roadmap Of Organization Infographics
Introducing our five years maas roadmap of organization infographics. This PPT presentation is Google Slides compatible, therefore, you can share it easily with the collaborators for measuring the progress. Also, the presentation is available in both standard screen and widescreen aspect ratios. So edit the template design by modifying the font size, font type, color, and shapes as per your requirements. As this PPT design is fully editable it can be presented in PDF, JPG and PNG formats.
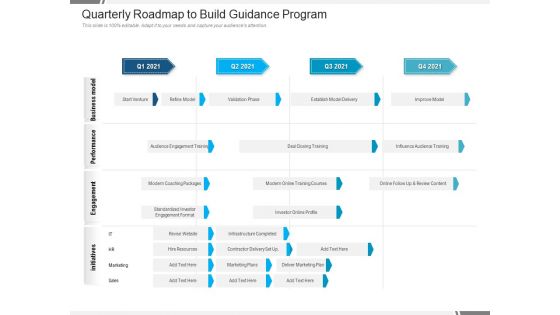
Quarterly Roadmap To Build Guidance Program Infographics
Presenting our jaw-dropping quarterly roadmap to build guidance program infographics. You can alternate the color, font size, font type, and shapes of this PPT layout according to your strategic process. This PPT presentation is compatible with Google Slides and is available in both standard screen and widescreen aspect ratios. You can also download this well-researched PowerPoint template design in different formats like PDF, JPG, and PNG. So utilize this visually-appealing design by clicking the download button given below.

5 Year Data Analytics Roadmap Infographics
Introducing our 5 year data analytics roadmap infographics. This PPT presentation is Google Slides compatible, therefore, you can share it easily with the collaborators for measuring the progress. Also, the presentation is available in both standard screen and widescreen aspect ratios. So edit the template design by modifying the font size, font type, color, and shapes as per your requirements. As this PPT design is fully editable it can be presented in PDF, JPG and PNG formats.
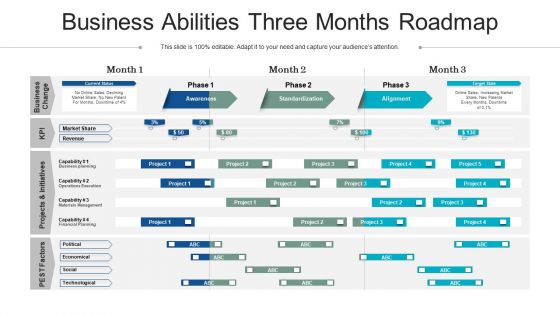
Business Abilities Three Months Roadmap Infographics
Presenting our jaw dropping business abilities three months roadmap infographics. You can alternate the color, font size, font type, and shapes of this PPT layout according to your strategic process. This PPT presentation is compatible with Google Slides and is available in both standard screen and widescreen aspect ratios. You can also download this well researched PowerPoint template design in different formats like PDF, JPG, and PNG. So utilize this visually appealing design by clicking the download button given below.
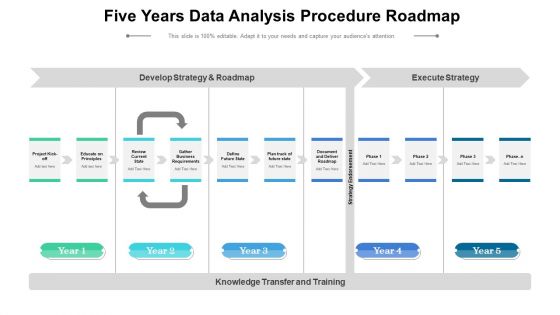
Five Years Data Analysis Procedure Roadmap Infographics
Introducing our five years data analysis procedure roadmap infographics. This PPT presentation is Google Slides compatible, therefore, you can share it easily with the collaborators for measuring the progress. Also, the presentation is available in both standard screen and widescreen aspect ratios. So edit the template design by modifying the font size, font type, color, and shapes as per your requirements. As this PPT design is fully editable it can be presented in PDF, JPG and PNG formats.
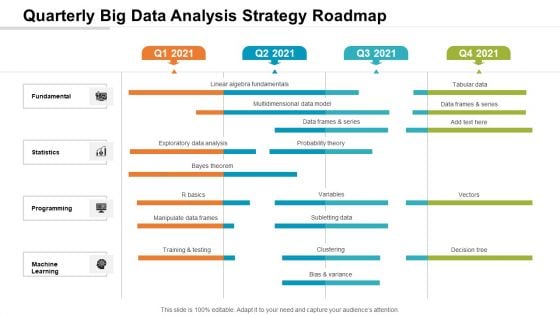
Quarterly Big Data Analysis Strategy Roadmap Infographics
Presenting our jaw-dropping quarterly big data analysis strategy roadmap infographics. You can alternate the color, font size, font type, and shapes of this PPT layout according to your strategic process. This PPT presentation is compatible with Google Slides and is available in both standard screen and widescreen aspect ratios. You can also download this well-researched PowerPoint template design in different formats like PDF, JPG, and PNG. So utilize this visually-appealing design by clicking the download button given below.
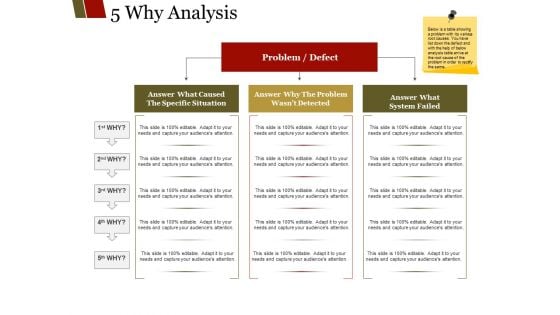
Why Analysis Ppt PowerPoint Presentation Outline Infographics
This is a why analysis ppt powerpoint presentation outline infographics. This is a three stage process. The stages in this process are answer what caused the specific situation, answer why the problem wasn t detected, answer what, system failed, problem defect.
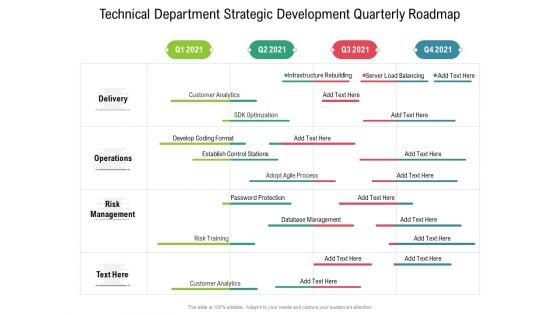
Technical Department Strategic Development Quarterly Roadmap Infographics
Presenting the technical department strategic development quarterly roadmap infographics. The template includes a roadmap that can be used to initiate a strategic plan. Not only this, the PowerPoint slideshow is completely editable and you can effortlessly modify the font size, font type, and shapes according to your needs. This PPT slide can be easily reached in standard screen and widescreen aspect ratios. The set is also available in various formats like PDF, PNG, and JPG. So download and use it multiple times as per your knowledge.
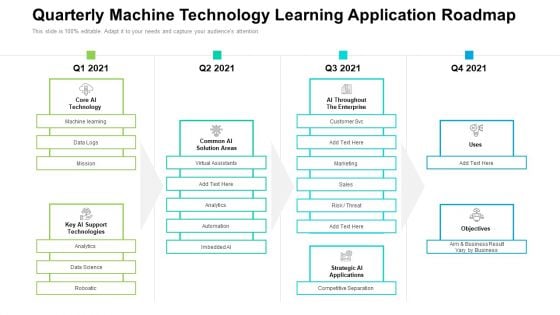
Quarterly Machine Technology Learning Application Roadmap Infographics
Presenting the quarterly machine technology learning application roadmap infographics. The template includes a roadmap that can be used to initiate a strategic plan. Not only this, the PowerPoint slideshow is completely editable and you can effortlessly modify the font size, font type, and shapes according to your needs. This PPT slide can be easily reached in standard screen and widescreen aspect ratios. The set is also available in various formats like PDF, PNG, and JPG. So download and use it multiple times as per your knowledge.
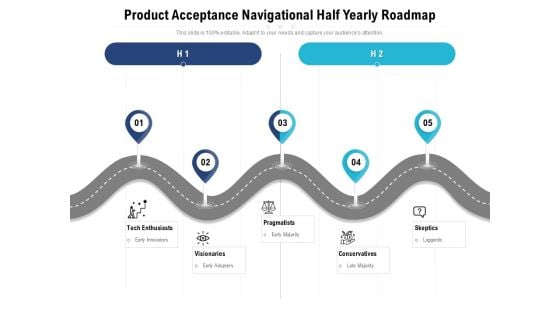
Product Acceptance Navigational Half Yearly Roadmap Infographics
Introducing our product acceptance navigational half yearly roadmap infographics. This PPT presentation is Google Slides compatible, therefore, you can share it easily with the collaborators for measuring the progress. Also, the presentation is available in both standard screen and widescreen aspect ratios. So edit the template design by modifying the font size, font type, color, and shapes as per your requirements. As this PPT design is fully editable it can be presented in PDF, JPG and PNG formats.
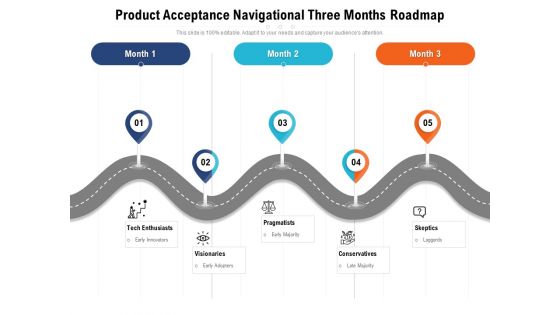
Product Acceptance Navigational Three Months Roadmap Infographics
Presenting our jaw-dropping product acceptance navigational three months roadmap infographics. You can alternate the color, font size, font type, and shapes of this PPT layout according to your strategic process. This PPT presentation is compatible with Google Slides and is available in both standard screen and widescreen aspect ratios. You can also download this well-researched PowerPoint template design in different formats like PDF, JPG, and PNG. So utilize this visually-appealing design by clicking the download button given below.
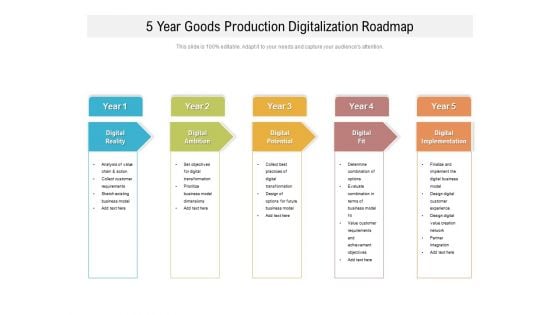
5 Year Goods Production Digitalization Roadmap Infographics
Introducing our 5 year goods production digitalization roadmap infographics. This PPT presentation is Google Slides compatible, therefore, you can share it easily with the collaborators for measuring the progress. Also, the presentation is available in both standard screen and widescreen aspect ratios. So edit the template design by modifying the font size, font type, color, and shapes as per your requirements. As this PPT design is fully editable it can be presented in PDF, JPG and PNG formats.
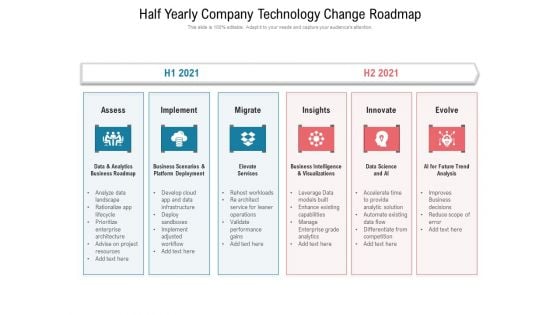
Half Yearly Company Technology Change Roadmap Infographics
Introducing our half yearly company technology change roadmap infographics. This PPT presentation is Google Slides compatible, therefore, you can share it easily with the collaborators for measuring the progress. Also, the presentation is available in both standard screen and widescreen aspect ratios. So edit the template design by modifying the font size, font type, color, and shapes as per your requirements. As this PPT design is fully editable it can be presented in PDF, JPG and PNG formats.
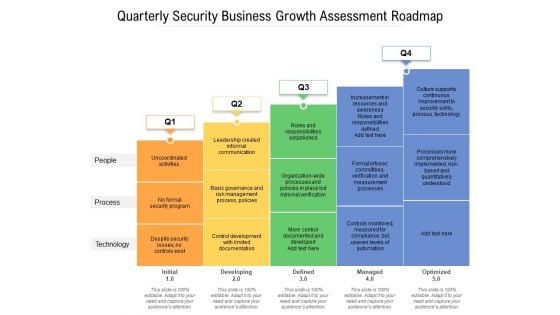
Quarterly Security Business Growth Assessment Roadmap Infographics
Presenting our jaw-dropping quarterly security business growth assessment roadmap infographics. You can alternate the color, font size, font type, and shapes of this PPT layout according to your strategic process. This PPT presentation is compatible with Google Slides and is available in both standard screen and widescreen aspect ratios. You can also download this well-researched PowerPoint template design in different formats like PDF, JPG, and PNG. So utilize this visually-appealing design by clicking the download button given below.
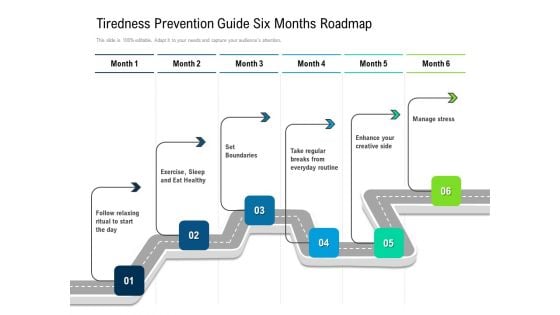
Tiredness Prevention Guide Six Months Roadmap Infographics
Presenting our jaw-dropping tiredness prevention guide six months roadmap infographics. You can alternate the color, font size, font type, and shapes of this PPT layout according to your strategic process. This PPT presentation is compatible with Google Slides and is available in both standard screen and widescreen aspect ratios. You can also download this well-researched PowerPoint template design in different formats like PDF, JPG, and PNG. So utilize this visually-appealing design by clicking the download button given below.
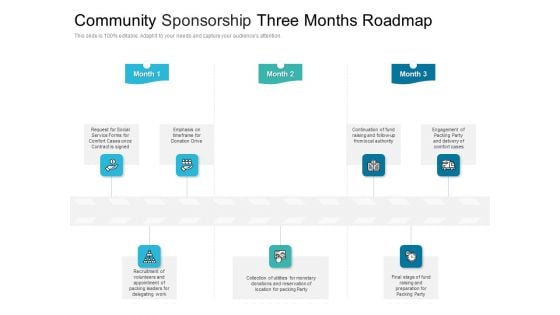
Community Sponsorship Three Months Roadmap Infographics
Presenting our jaw-dropping community sponsorship three months roadmap infographics. You can alternate the color, font size, font type, and shapes of this PPT layout according to your strategic process. This PPT presentation is compatible with Google Slides and is available in both standard screen and widescreen aspect ratios. You can also download this well-researched PowerPoint template design in different formats like PDF, JPG, and PNG. So utilize this visually-appealing design by clicking the download button given below.


 Continue with Email

 Home
Home


