Infographic Icons
Managerial Accounting System Circular Ppt Infographics PDF
Presenting this set of slides with name managerial accounting system circular ppt infographics pdf. This is a five stage process. The stages in this process are circular diagram. This is a completely editable PowerPoint presentation and is available for immediate download. Download now and impress your audience.
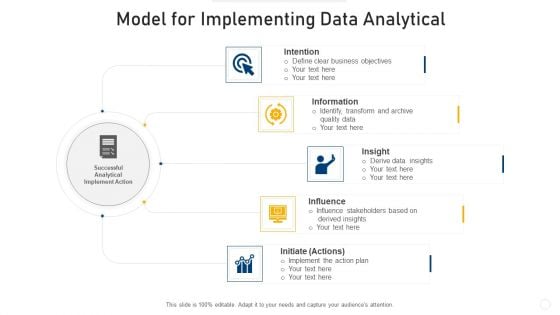
Model For Implementing Data Analytical Infographics PDF
Presenting model for implementing data analytical infographics pdf to dispense important information. This template comprises five stages. It also presents valuable insights into the topics including intention, insight, influence. This is a completely customizable PowerPoint theme that can be put to use immediately. So, download it and address the topic impactfully.
Team Communicating Business Global Challenges Infographics PDF
Presenting team communicating business global challenges infographics pdf to dispense important information. This template comprises one stages. It also presents valuable insights into the topics including team communicating business global challenges. This is a completely customizable PowerPoint theme that can be put to use immediately. So, download it and address the topic impactfully.

Administrator Updating Information System Security Infographics PDF
Presenting administrator updating information system security infographics pdf to dispense important information. This template comprises three stages. It also presents valuable insights into the topics including administrator updating information system security. This is a completely customizable PowerPoint theme that can be put to use immediately. So, download it and address the topic impactfully.
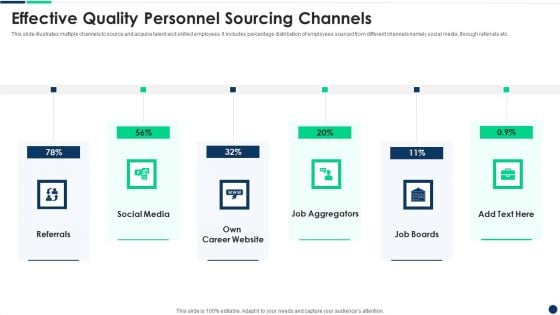
Effective Quality Personnel Sourcing Channels Infographics PDF
Presenting Effective Quality Personnel Sourcing Channels Infographics PDF to dispense important information. This template comprises six stages. It also presents valuable insights into the topics including Social Media, Own Career Website, Referrals This is a completely customizable PowerPoint theme that can be put to use immediately. So, download it and address the topic impactfully.
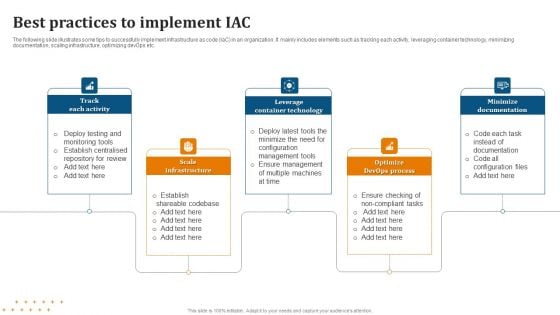
Best Practices To Implement IAC Infographics PDF
Presenting Best Practices To Implement IAC Infographics PDF to dispense important information. This template comprises Five stages. It also presents valuable insights into the topics including Best Practices, Implement IAC, Track Each Activity, Scale Infrastructure. This is a completely customizable PowerPoint theme that can be put to use immediately. So, download it and address the topic impactfully.
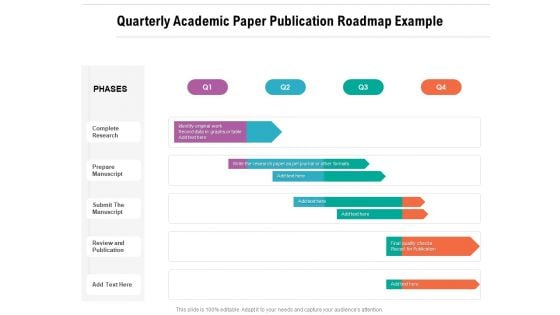
Quarterly Academic Paper Publication Roadmap Example Infographics
Presenting our innovatively-structured quarterly academic paper publication roadmap example infographics Template. Showcase your roadmap process in different formats like PDF, PNG, and JPG by clicking the download button below. This PPT design is available in both Standard Screen and Widescreen aspect ratios. It can also be easily personalized and presented with modified font size, font type, color, and shapes to measure your progress in a clear way.
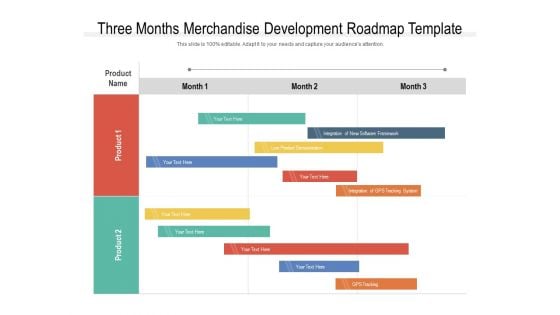
Three Months Merchandise Development Roadmap Template Infographics
Presenting our innovatively-structured three months merchandise development roadmap template infographics Template. Showcase your roadmap process in different formats like PDF, PNG, and JPG by clicking the download button below. This PPT design is available in both Standard Screen and Widescreen aspect ratios. It can also be easily personalized and presented with modified font size, font type, color, and shapes to measure your progress in a clear way.
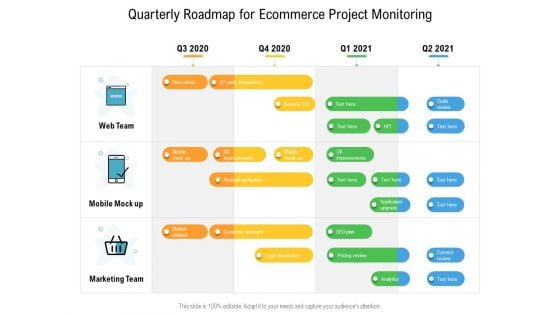
Quarterly Roadmap For Ecommerce Project Monitoring Infographics
Presenting our innovatively-structured quarterly roadmap for ecommerce project monitoring infographics Template. Showcase your roadmap process in different formats like PDF, PNG, and JPG by clicking the download button below. This PPT design is available in both Standard Screen and Widescreen aspect ratios. It can also be easily personalized and presented with modified font size, font type, color, and shapes to measure your progress in a clear way.
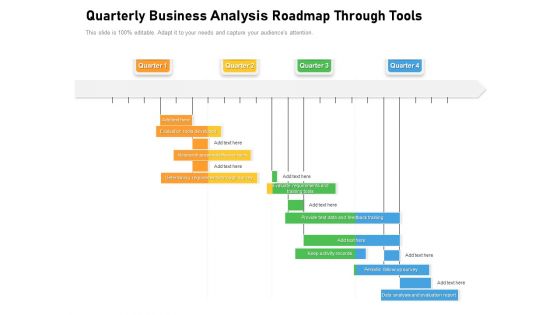
Quarterly Business Analysis Roadmap Through Tools Infographics
Presenting our innovatively-structured quarterly business analysis roadmap through tools infographics Template. Showcase your roadmap process in different formats like PDF, PNG, and JPG by clicking the download button below. This PPT design is available in both Standard Screen and Widescreen aspect ratios. It can also be easily personalized and presented with modified font size, font type, color, and shapes to measure your progress in a clear way.
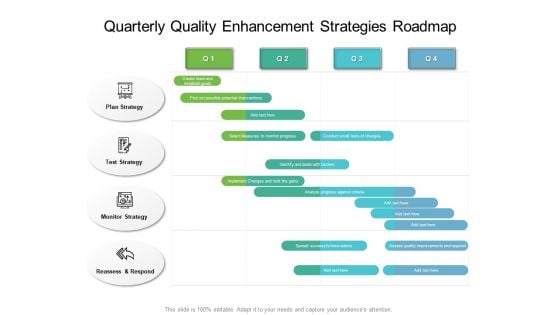
Quarterly Quality Enhancement Strategies Roadmap Infographics
Presenting our innovatively-structured quarterly quality enhancement strategies roadmap infographics Template. Showcase your roadmap process in different formats like PDF, PNG, and JPG by clicking the download button below. This PPT design is available in both Standard Screen and Widescreen aspect ratios. It can also be easily personalized and presented with modified font size, font type, color, and shapes to measure your progress in a clear way.
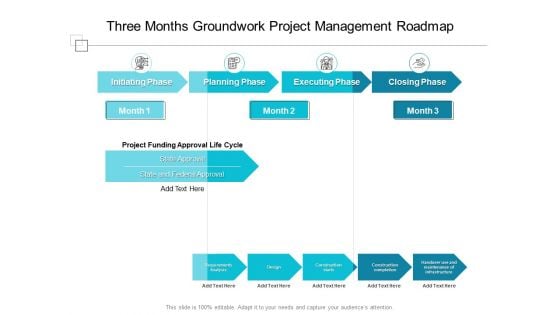
Three Months Groundwork Project Management Roadmap Infographics
Presenting our innovatively structured three months groundwork project management roadmap infographics Template. Showcase your roadmap process in different formats like PDF, PNG, and JPG by clicking the download button below. This PPT design is available in both Standard Screen and Widescreen aspect ratios. It can also be easily personalized and presented with modified font size, font type, color, and shapes to measure your progress in a clear way.
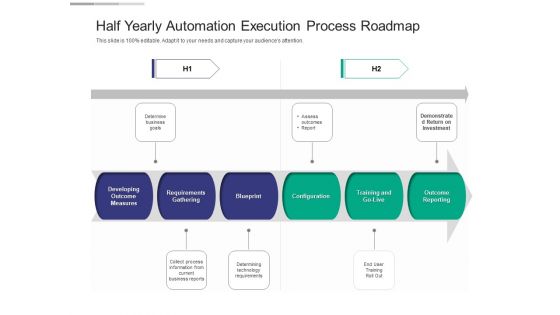
Half Yearly Automation Execution Process Roadmap Infographics
Presenting our innovatively structured half yearly automation execution process roadmap infographics Template. Showcase your roadmap process in different formats like PDF, PNG, and JPG by clicking the download button below. This PPT design is available in both Standard Screen and Widescreen aspect ratios. It can also be easily personalized and presented with modified font size, font type, color, and shapes to measure your progress in a clear way.
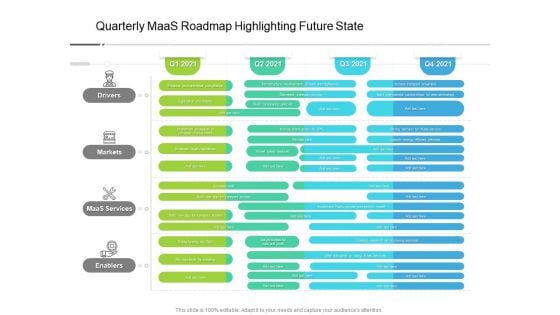
Quarterly Maas Roadmap Highlighting Future State Infographics
Presenting our innovatively-structured quarterly maas roadmap highlighting future state infographics Template. Showcase your roadmap process in different formats like PDF, PNG, and JPG by clicking the download button below. This PPT design is available in both Standard Screen and Widescreen aspect ratios. It can also be easily personalized and presented with modified font size, font type, color, and shapes to measure your progress in a clear way.
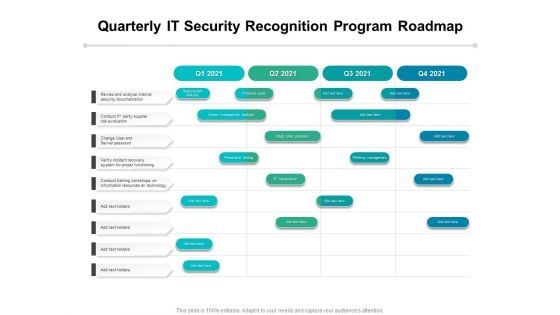
Quarterly IT Security Recognition Program Roadmap Infographics
Presenting our innovatively-structured quarterly it security recognition program roadmap infographics Template. Showcase your roadmap process in different formats like PDF, PNG, and JPG by clicking the download button below. This PPT design is available in both Standard Screen and Widescreen aspect ratios. It can also be easily personalized and presented with modified font size, font type, color, and shapes to measure your progress in a clear way.
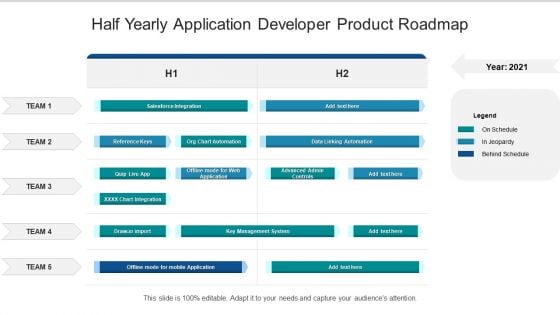
Half Yearly Application Developer Product Roadmap Infographics
Presenting our innovatively structured half yearly application developer product roadmap infographics Template. Showcase your roadmap process in different formats like PDF, PNG, and JPG by clicking the download button below. This PPT design is available in both Standard Screen and Widescreen aspect ratios. It can also be easily personalized and presented with modified font size, font type, color, and shapes to measure your progress in a clear way.
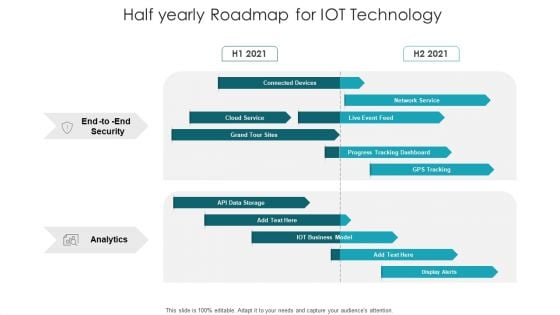
Half Yearly Roadmap For IOT Technology Infographics
Presenting our innovatively structured half yearly roadmap for iot technology infographics Template. Showcase your roadmap process in different formats like PDF, PNG, and JPG by clicking the download button below. This PPT design is available in both Standard Screen and Widescreen aspect ratios. It can also be easily personalized and presented with modified font size, font type, color, and shapes to measure your progress in a clear way.
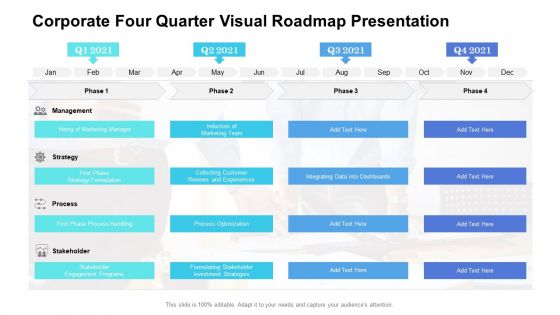
Corporate Four Quarter Visual Roadmap Presentation Infographics
Presenting our innovatively structured corporate four quarter visual roadmap presentation infographics Template. Showcase your roadmap process in different formats like PDF, PNG, and JPG by clicking the download button below. This PPT design is available in both Standard Screen and Widescreen aspect ratios. It can also be easily personalized and presented with modified font size, font type, color, and shapes to measure your progress in a clear way.
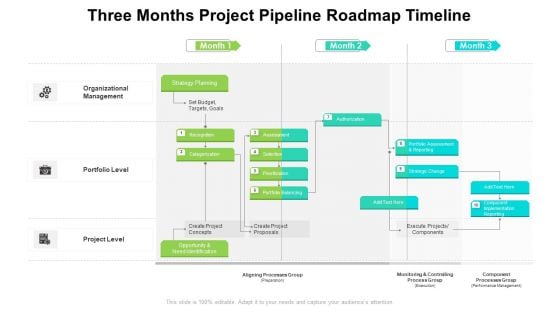
Three Months Project Pipeline Roadmap Timeline Infographics
Presenting our innovatively structured three months project pipeline roadmap timeline infographics Template. Showcase your roadmap process in different formats like PDF, PNG, and JPG by clicking the download button below. This PPT design is available in both Standard Screen and Widescreen aspect ratios. It can also be easily personalized and presented with modified font size, font type, color, and shapes to measure your progress in a clear way.
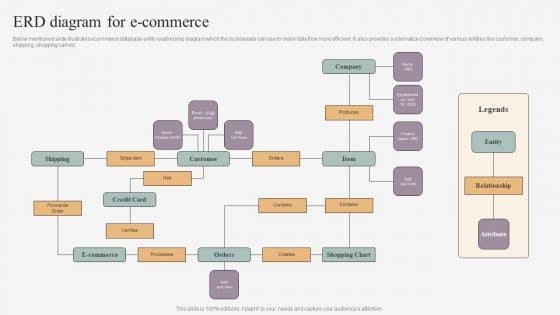
ERD Diagram For E Commerce Infographics PDF
Below mentioned slide illustrates ecommerce database entity relationship diagram which the businesses can use to make data flow more efficient. It also provides systematized overview of various entities like customer, company, shipping, shopping cart etc. Showcasing this set of slides titled ERD Diagram For E Commerce Infographics PDF. The topics addressed in these templates are Shipping, Customer, Company, Entity, Shopping Chart, Credit Card, Relationship. All the content presented in this PPT design is completely editable. Download it and make adjustments in color, background, font etc. as per your unique business setting.
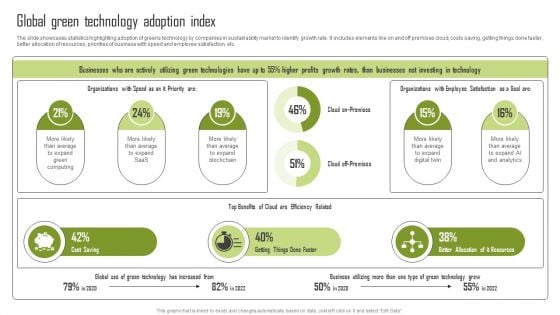
Global Green Technology Adoption Index Infographics PDF
The slide showcases statistics highlighting adoption of greens technology by companies in sustainability market to identify growth rate. It includes elements like on and off premises cloud, costs saving, getting things done faster, better allocation of resources, priorities of business with speed and employee satisfaction, etc. Explore a selection of the finest Global Green Technology Adoption Index Infographics PDF here. With a plethora of professionally designed and pre made slide templates, you can quickly and easily find the right one for your upcoming presentation. You can use our Global Green Technology Adoption Index Infographics PDF to effectively convey your message to a wider audience. Slidegeeks has done a lot of research before preparing these presentation templates. The content can be personalized and the slides are highly editable. Grab templates today from Slidegeeks.
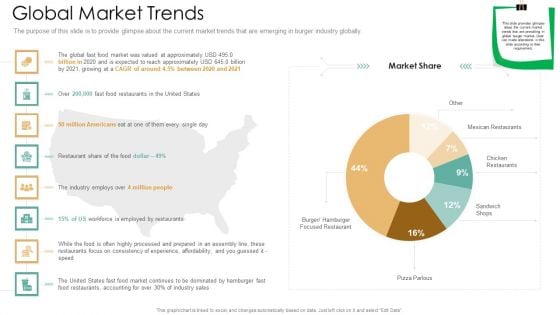
Global Market Trends Ppt Infographics Pictures PDF
The purpose of this slide is to provide glimpse about the current market trends that are emerging in burger industry globally. Deliver and pitch your topic in the best possible manner with this global market trends ppt infographics pictures pdf. Use them to share invaluable insights on global market trends and impress your audience. This template can be altered and modified as per your expectations. So, grab it now.
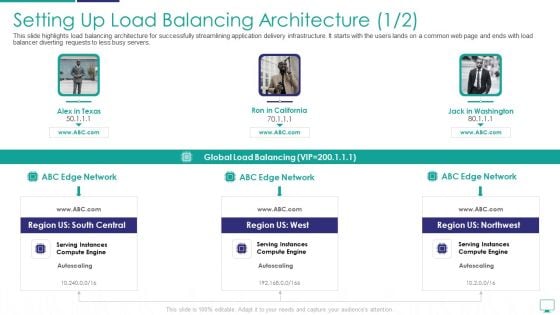
Setting Up Load Balancing Architecture Infographics PDF
This slide highlights load balancing architecture for successfully streamlining application delivery infrastructure. It starts with the users lands on a common web page and ends with load balancer diverting requests to less busy servers.Deliver an awe inspiring pitch with this creative setting up load balancing architecture infographics pdf bundle. Topics like setting up load balancing architecture can be discussed with this completely editable template. It is available for immediate download depending on the needs and requirements of the user.

Customer Need Assessment Kpi Dashboard Infographics PDF
The following slide highlights the spas to assess customers changing needs and make strategies to improve. It consists of NPS, responses, weekly variations in needs, positive and negative feedback etc. Showcasing this set of slides titled customer need assessment kpi dashboard infographics pdf. The topics addressed in these templates are customer need assessment kpi dashboard. All the content presented in this PPT design is completely editable. Download it and make adjustments in color, background, font etc. as per your unique business setting.
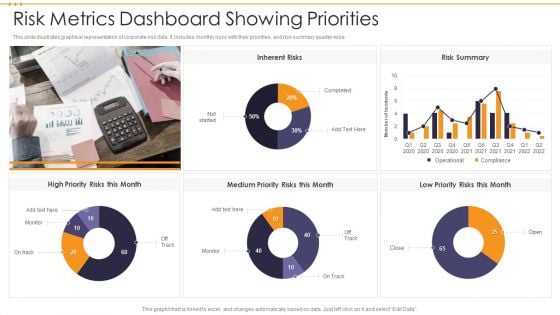
Risk Metrics Dashboard Showing Priorities Infographics PDF
This slide illustrates graphical representation of corporate risk data. It includes monthly risks with their priorities, and risk summary quarter wise. Showcasing this set of slides titled Risk Metrics Dashboard Showing Priorities Infographics PDF. The topics addressed in these templates are Risk Metrics Dashboard Showing Priorities. All the content presented in this PPT design is completely editable. Download it and make adjustments in color, background, font etc. as per your unique business setting.
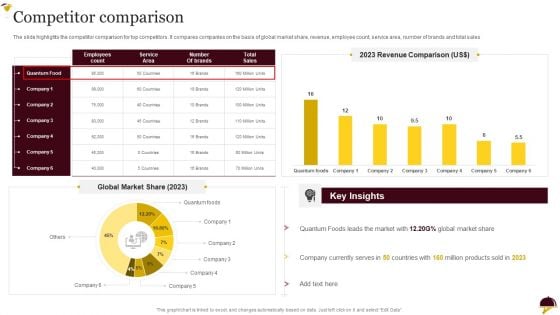
Food Company Overview Competitor Comparison Infographics PDF
The slide highlights the competitor comparison for top competitors. It compares companies on the basis of global market share, revenue, employee count, service area, number of brands and total sales.Deliver and pitch your topic in the best possible manner with this Food Company Overview Competitor Comparison Infographics PDF. Use them to share invaluable insights on Currently Serves, Quantum Foods, Key Insights and impress your audience. This template can be altered and modified as per your expectations. So, grab it now.
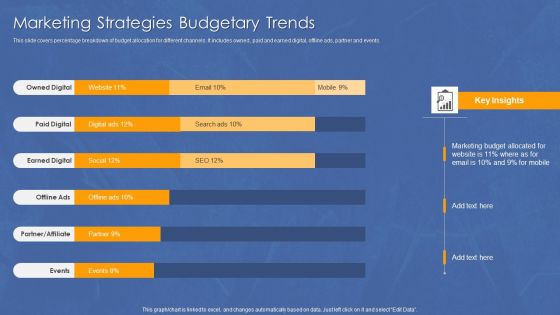
Marketing Strategies Budgetary Trends Infographics PDF
This slide covers percentage breakdown of budget allocation for different channels. It includes owned , paid and earned digital, offline ads, partner and events.Showcasing this set of slides titled Marketing Strategies Budgetary Trends Infographics PDF. The topics addressed in these templates are Owned Digital, Partner Affiliate, Earned Digital. All the content presented in this PPT design is completely editable. Download it and make adjustments in color, background, font etc. as per your unique business setting.
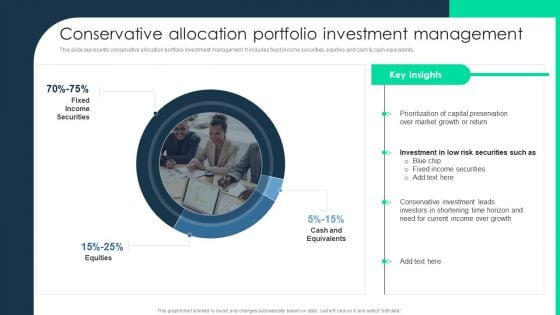
Conservative Allocation Portfolio Investment Management Infographics PDF
This slide represents conservative allocation portfolio investment management. It includes fixed income securities, equities and cash and cash equivalents. Deliver an awe inspiring pitch with this creative Conservative Allocation Portfolio Investment Management Infographics PDF bundle. Topics like Market Growth, Current Income, Cash And Equivalents can be discussed with this completely editable template. It is available for immediate download depending on the needs and requirements of the user.
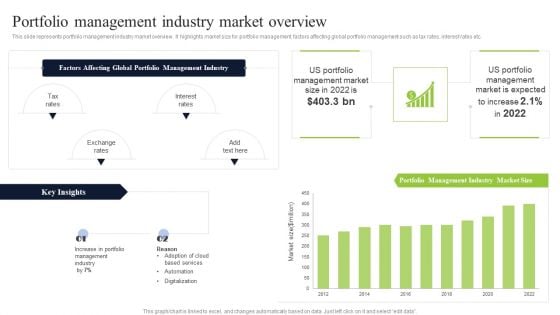
Portfolio Management Industry Market Overview Infographics PDF
This slide represents portfolio management industry market overview. It highlights market size for portfolio management, factors affecting global portfolio management such as tax rates, interest rates etc. Deliver and pitch your topic in the best possible manner with this Portfolio Management Industry Market Overview Infographics PDF. Use them to share invaluable insights on Portfolio Management, Interest Rates, Global Portfolio Management Industry and impress your audience. This template can be altered and modified as per your expectations. So, grab it now.
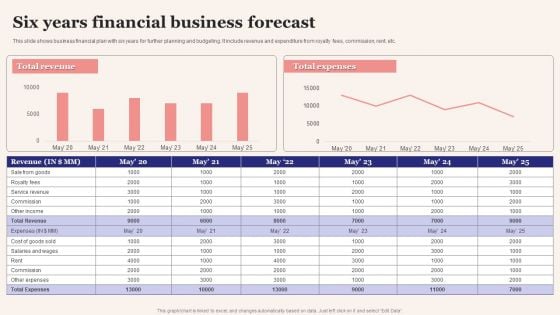
Six Years Financial Business Forecast Infographics PDF
This slide shows business financial plan with six years for further planning and budgeting. It include revenue and expenditure from royalty fees, commission, rent, etc. Showcasing this set of slides titled Six Years Financial Business Forecast Infographics PDF. The topics addressed in these templates are Six Years Financial, Business Forecast. All the content presented in this PPT design is completely editable. Download it and make adjustments in color, background, font etc. as per your unique business setting.
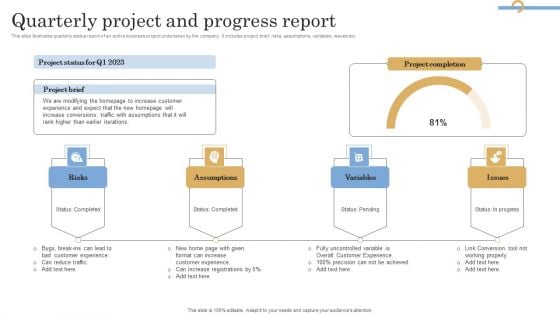
Quarterly Project And Progress Report Infographics PDF
This slide illustrates quarterly status report of an active business project undertaken by the company. it includes project brief, risks, assumptions, variables, issues etc. Showcasing this set of slides titled Quarterly Project And Progress Report Infographics PDF. The topics addressed in these templates are Risks, Assumptions, Variables. All the content presented in this PPT design is completely editable. Download it and make adjustments in color, background, font etc. as per your unique business setting.
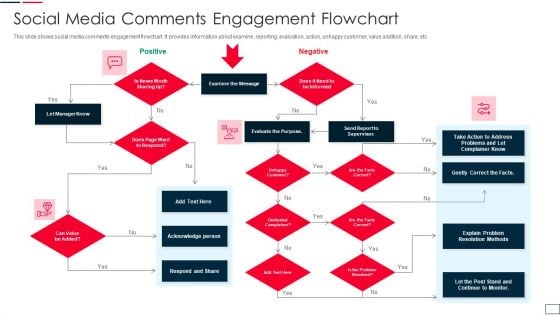
Social Media Comments Engagement Flowchart Infographics PDF
This slide shows social media comments engagement flowchart. It provides information about examine, reporting, evaluation, action, unhappy customer, value addition, share, etc. Presenting social media comments engagement flowchart infographics pdf to dispense important information. This template comprises one stages. It also presents valuable insights into the topics including evaluate, customer, methods. This is a completely customizable PowerPoint theme that can be put to use immediately. So, download it and address the topic impactfully.
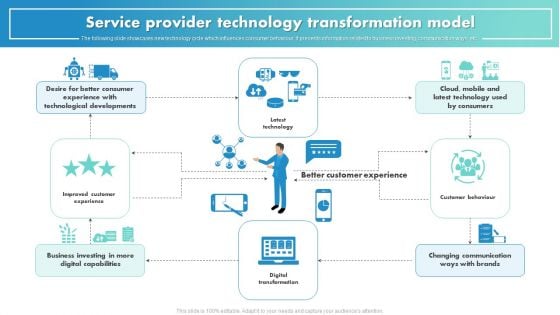
Service Provider Technology Transformation Model Infographics PDF
The following slide showcases new technology cycle which influences consumer behaviour. It presents information related to business investing, communication ways, etc. Presenting Service Provider Technology Transformation Model Infographics PDF to dispense important information. This template comprises one stages. It also presents valuable insights into the topics including Improved Customer Experience, Digital Transformation, Customer Behaviour. This is a completely customizable PowerPoint theme that can be put to use immediately. So, download it and address the topic impactfully.
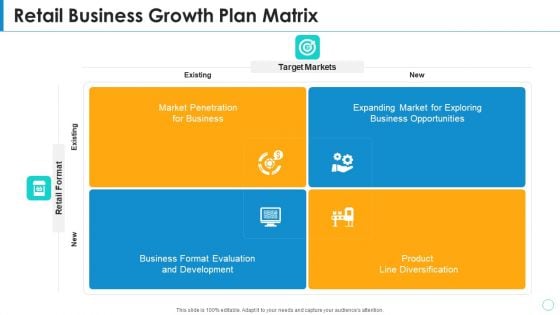
Retail Business Growth Plan Matrix Infographics PDF
Persuade your audience using this retail business growth plan matrix infographics pdf. This PPT design covers four stages, thus making it a great tool to use. It also caters to a variety of topics including market penetration for business, expanding market for exploring business opportunities, business format evaluation and development, product line diversification . Download this PPT design now to present a convincing pitch that not only emphasizes the topic but also showcases your presentation skills.

Export Logistics Procedural Flow Diagram Infographics PDF
This slide showcases the export logistics process flow and represents the entire supply chain channel. It also includes stages such as inspection, packaging, delivery, customer clearance, etc. Presenting Export Logistics Procedural Flow Diagram Infographics PDF to dispense important information. This template comprises tewlve stages. It also presents valuable insights into the topics including Inspect And Check, Pack Label Product, Get Delivery Order. This is a completely customizable PowerPoint theme that can be put to use immediately. So, download it and address the topic impactfully.
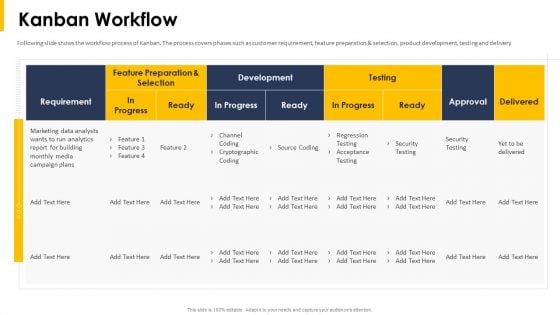
Kanban Workflow Ppt Infographics Sample PDF
Following slide shows the workflow process of Kanban. The process covers phases such as customer requirement, feature preparation and selection, product development, testing and delivery. Deliver an awe inspiring pitch with this creative kanban workflow ppt infographics sample pdf bundle. Topics like progress, requirement can be discussed with this completely editable template. It is available for immediate download depending on the needs and requirements of the user.
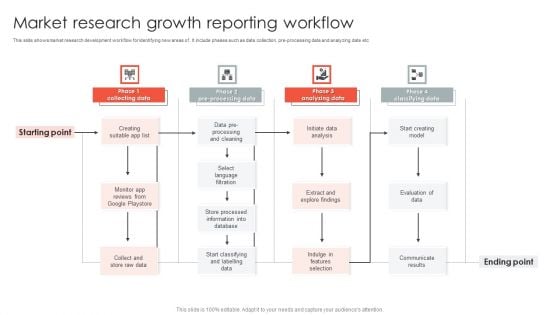
Market Research Growth Reporting Workflow Infographics PDF
This slide shows market research development workflow for identifying new areas of . It include phases such as data collection, pre-processing data and analyzing date etc. Showcasing this set of slides titled Market Research Growth Reporting Workflow Infographics PDF. The topics addressed in these templates are Processing Cleaning, Language Filtration, Information Database. All the content presented in this PPT design is completely editable. Download it and make adjustments in color, background, font etc. as per your unique business setting.

LAER Framework Model Execution Roadmap Infographics PDF
This slide showcases step by step approach to ensure seamless implementation of LAER framework in organization. It further includes details about phases such as land, adopt, expand and renew. Persuade your audience using this LAER Framework Model Execution Roadmap Infographics PDF. This PPT design covers four stages, thus making it a great tool to use. It also caters to a variety of topics including Land Phase, Adopt Phase, Expand Phase, Renew Phase. Download this PPT design now to present a convincing pitch that not only emphasizes the topic but also showcases your presentation skills.
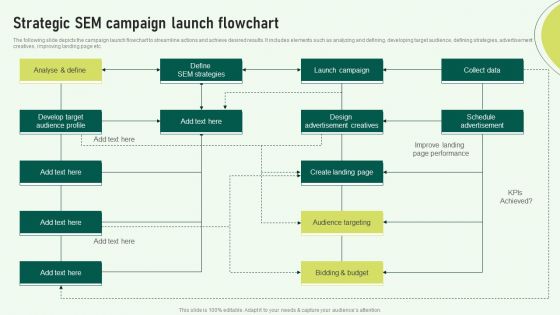
Strategic SEM Campaign Launch Flowchart Infographics PDF
The following slide depicts the campaign launch flowchart to streamline actions and achieve desired results. It includes elements such as analyzing and defining, developing target audience, defining strategies, advertisement creatives, improving landing page etc. Here you can discover an assortment of the finest PowerPoint and Google Slides templates. With these templates, you can create presentations for a variety of purposes while simultaneously providing your audience with an eye-catching visual experience. Download Strategic SEM Campaign Launch Flowchart Infographics PDF to deliver an impeccable presentation. These templates will make your job of preparing presentations much quicker, yet still, maintain a high level of quality. Slidegeeks has experienced researchers who prepare these templates and write high-quality content for you. Later on, you can personalize the content by editing the Strategic SEM Campaign Launch Flowchart Infographics PDF.
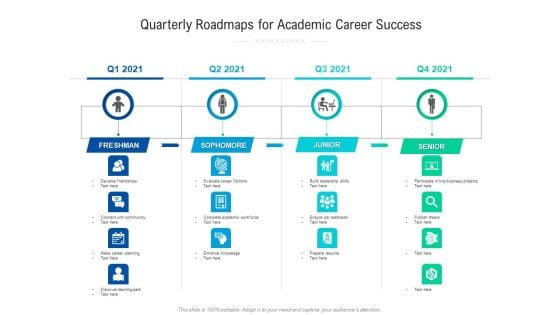
Quarterly Roadmaps For Academic Career Success Infographics
Presenting our innovatively structured quarterly roadmaps for academic career success infographics Template. Showcase your roadmap process in different formats like PDF, PNG, and JPG by clicking the download button below. This PPT design is available in both Standard Screen and Widescreen aspect ratios. It can also be easily personalized and presented with modified font size, font type, color, and shapes to measure your progress in a clear way.
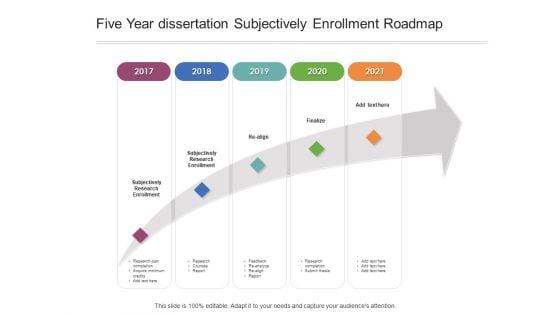
Five Year Dissertation Subjectively Enrollment Roadmap Infographics
Presenting our innovatively-structured five year dissertation subjectively enrollment roadmap infographics Template. Showcase your roadmap process in different formats like PDF, PNG, and JPG by clicking the download button below. This PPT design is available in both Standard Screen and Widescreen aspect ratios. It can also be easily personalized and presented with modified font size, font type, color, and shapes to measure your progress in a clear way.
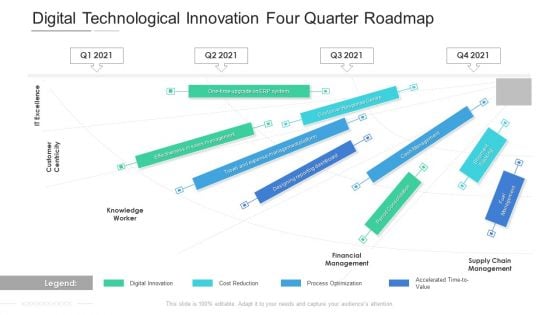
Digital Technological Innovation Four Quarter Roadmap Infographics
Presenting our innovatively structured digital technological innovation four quarter roadmap infographics Template. Showcase your roadmap process in different formats like PDF, PNG, and JPG by clicking the download button below. This PPT design is available in both Standard Screen and Widescreen aspect ratios. It can also be easily personalized and presented with modified font size, font type, color, and shapes to measure your progress in a clear way.
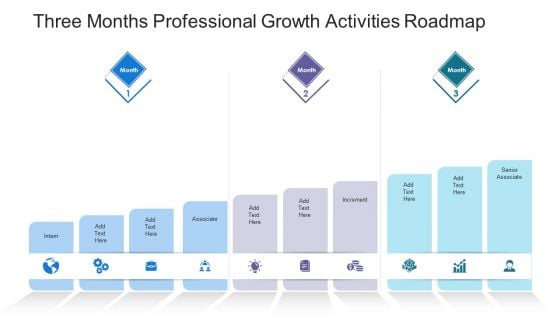
Three Months Professional Growth Activities Roadmap Infographics
Presenting our innovatively structured three months professional growth activities roadmap infographics Template. Showcase your roadmap process in different formats like PDF, PNG, and JPG by clicking the download button below. This PPT design is available in both Standard Screen and Widescreen aspect ratios. It can also be easily personalized and presented with modified font size, font type, color, and shapes to measure your progress in a clear way.
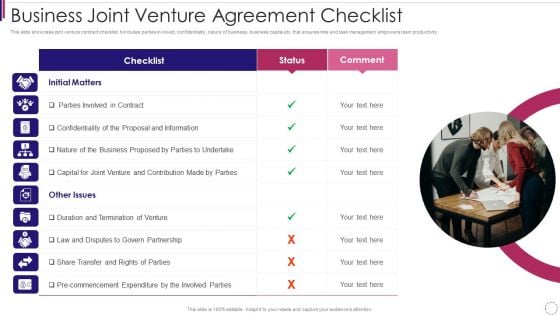
Business Joint Venture Agreement Checklist Infographics PDF
This slide showcase joint venture contract checklist. It includes parties involved, confidentiality, nature of business, business capital etc. that ensures time and task management empowers team productivity. Presenting business joint venture agreement checklist infographics pdf to dispense important information. This template comprises one stages. It also presents valuable insights into the topics including business joint venture agreement checklist. This is a completely customizable PowerPoint theme that can be put to use immediately. So, download it and address the topic impactfully.
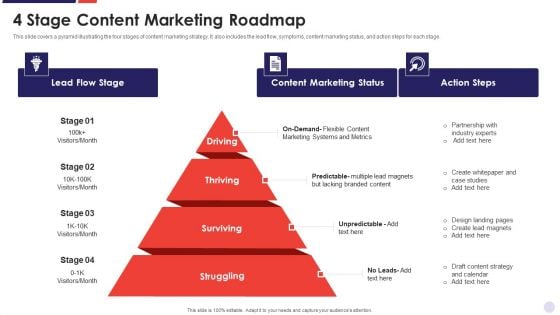
4 Stage Content Marketing Roadmap Infographics PDF
This slide covers a pyramid illustrating the four stages of content marketing strategy. It also includes the lead flow, symptoms, content marketing status, and action steps for each stage. Presenting 4 Stage Content Marketing Roadmap Infographics PDF to dispense important information. This template comprises four stages. It also presents valuable insights into the topics including Driving, Thriving, Surviving. This is a completely customizable PowerPoint theme that can be put to use immediately. So, download it and address the topic impactfully.
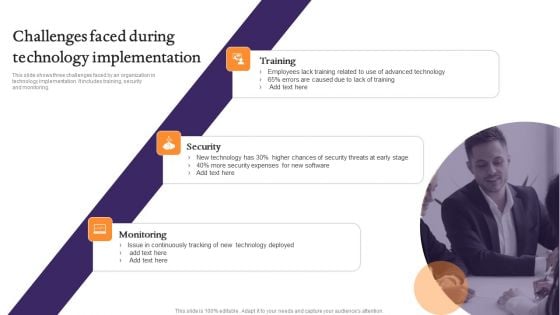
Challenges Faced During Technology Implementation Infographics PDF
This slide shows three challenges faced by an organization in technology implementation. It includes training, security and monitoring. Presenting Challenges Faced During Technology Implementation Infographics PDF to dispense important information. This template comprises three stages. It also presents valuable insights into the topics including Training, Security, Monitoring. This is a completely customizable PowerPoint theme that can be put to use immediately. So, download it and address the topic impactfully.
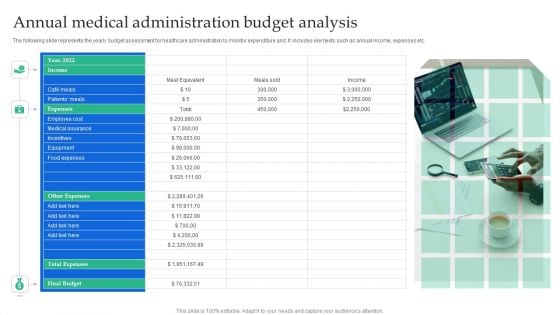
Annual Medical Administration Budget Analysis Infographics PDF
The following slide represents the yearly budget assessment for healthcare administration to monitor expenditure and. It includes elements such as annual income, expenses etc.Presenting Annual Medical Administration Budget Analysis Infographics PDF to dispense important information. This template comprises one stage. It also presents valuable insights into the topics including Medical Insurance, Equipment, Total Expenses. This is a completely customizable PowerPoint theme that can be put to use immediately. So, download it and address the topic impactfully.
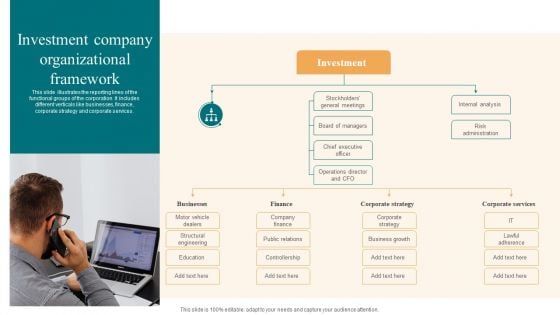
Investment Company Organizational Framework Infographics PDF
This slide illustrates the reporting lines of the functional groups of the corporation. It includes different verticals like businesses, finance, corporate strategy and corporate services. Presenting Investment Company Organizational Framework Infographics PDF to dispense important information. This template comprises one stages. It also presents valuable insights into the topics including Company Finance, Corporate Strategy, Business Growth. This is a completely customizable PowerPoint theme that can be put to use immediately. So, download it and address the topic impactfully.
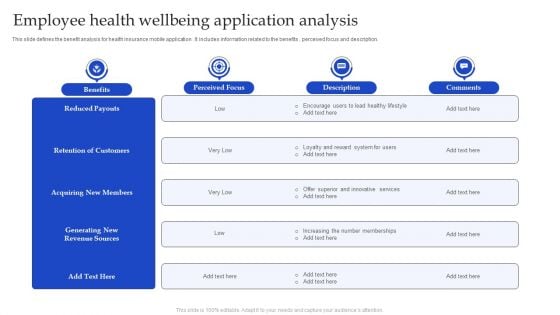
Employee Health Wellbeing Application Analysis Infographics PDF
This slide defines the benefit analysis for health insurance mobile application . It includes information related to the benefits , perceived focus and description. Presenting Employee Health Wellbeing Application Analysis Infographics PDF to dispense important information. This template comprises five stages. It also presents valuable insights into the topics including Retention Of Customers, Reduced Payouts, Innovative Services. This is a completely customizable PowerPoint theme that can be put to use immediately. So, download it and address the topic impactfully.
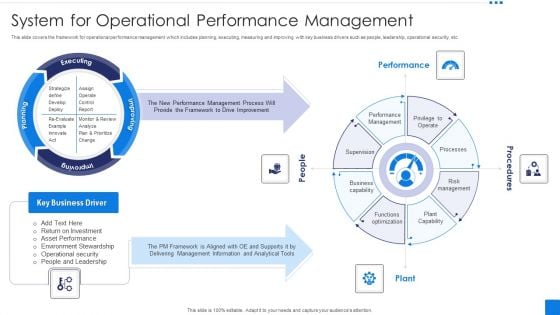
System For Operational Performance Management Infographics PDF
This slide covers the framework for operational performance management which includes planning, executing, measuring and improving with key business drivers such as people, leadership, operational security, etc. Presenting System For Operational Performance Management Infographics PDF to dispense important information. This template comprises four stages. It also presents valuable insights into the topics including Performance, Procedures, People, Plant. This is a completely customizable PowerPoint theme that can be put to use immediately. So, download it and address the topic impactfully.
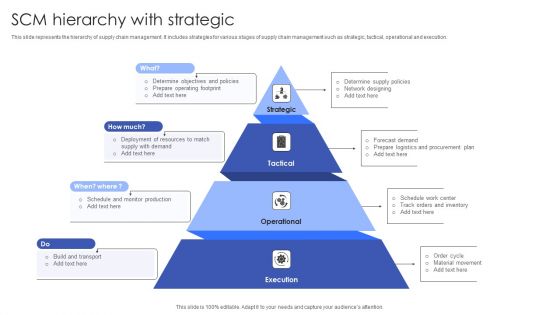
SCM Hierarchy With Strategic Infographics PDF
This slide represents the hierarchy of supply chain management. It includes strategies for various stages of supply chain management such as strategic, tactical, operational and execution.Presenting SCM Hierarchy With Strategic Infographics PDF to dispense important information. This template comprises four stages. It also presents valuable insights into the topics including Prepare Operating Footprint, Determine Objectives, Network Designing. This is a completely customizable PowerPoint theme that can be put to use immediately. So, download it and address the topic impactfully.
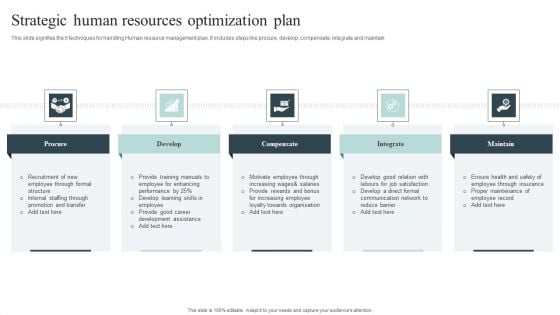
Strategic Human Resources Optimization Plan Infographics PDF
This slide signifies the 5 techniques for handling Human resource management plan. It includes steps like procure, develop, compensate, integrate and maintain.Presenting Strategic Human Resources Optimization Plan Infographics PDF to dispense important information. This template comprises five stages. It also presents valuable insights into the topics including Provide Training, Through Formal, Development Assistance. This is a completely customizable PowerPoint theme that can be put to use immediately. So, download it and address the topic impactfully.
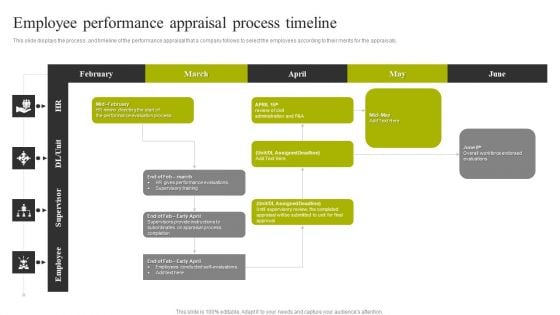
Employee Performance Appraisal Process Timeline Infographics PDF
This slide displays the process and timeline of the performance appraisal that a company follows to select the employees according to their merits for the appraisals. Presenting Employee Performance Appraisal Process Timeline Infographics PDF to dispense important information. This template comprises One stage. It also presents valuable insights into the topics including Employee, Supervisor, Process Timeline. This is a completely customizable PowerPoint theme that can be put to use immediately. So, download it and address the topic impactfully.
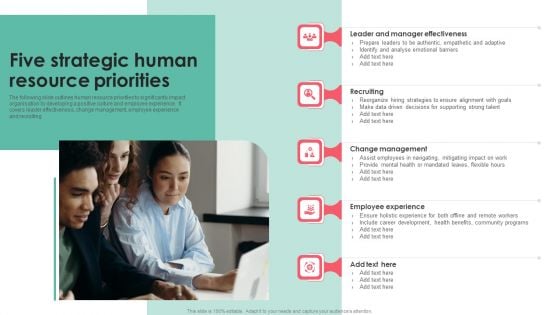
Five Strategic Human Resource Priorities Infographics PDF
The following slide outlines human resource priorities to significantly impact organisation by developing a positive culture and employee experience. It covers leader effectiveness, change management, employee experience and recruiting. Presenting Five Strategic Human Resource Priorities Infographics PDF to dispense important information. This template comprises five stages. It also presents valuable insights into the topics including Recruiting, Change Management, Employee Experience. This is a completely customizable PowerPoint theme that can be put to use immediately. So, download it and address the topic impactfully.
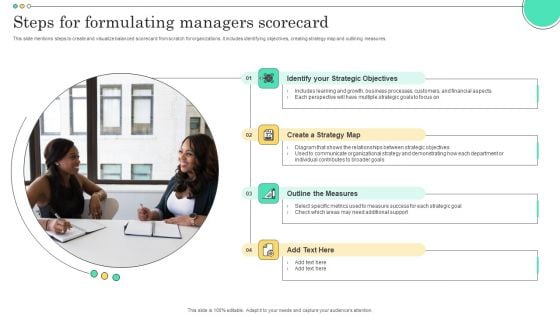
Steps For Formulating Managers Scorecard Infographics PDF
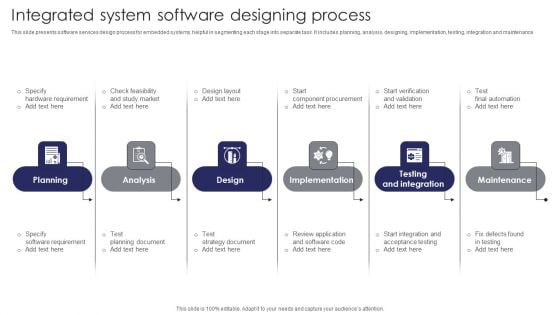
Integrated System Software Designing Process Infographics PDF
This slide presents software services design process for embedded systems, helpful in segmenting each stage into separate task. It includes planning, analysis, designing, implementation, testing, integration and maintenance. Presenting Integrated System Software Designing Process Infographics PDF to dispense important information. This template comprises six stages. It also presents valuable insights into the topics including Planning, Analysis, Design, Implementation. This is a completely customizable PowerPoint theme that can be put to use immediately. So, download it and address the topic impactfully.
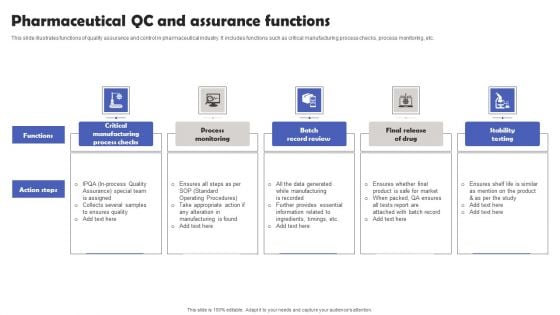
Pharmaceutical QC And Assurance Functions Infographics PDF
This slide illustrates functions of quality assurance and control in pharmaceutical industry. It includes functions such as critical manufacturing process checks, process monitoring, etc. Presenting Pharmaceutical QC And Assurance Functions Infographics PDF to dispense important information. This template comprises five stages. It also presents valuable insights into the topics including Process Monitoring, Batch Record Review, Stability Testing. This is a completely customizable PowerPoint theme that can be put to use immediately. So, download it and address the topic impactfully.

Datafy Framework Of Datafication Technology Infographics PDF
This slide represents the framework of datafication technology, and it includes two cycles such as design data and data use. The design data further contains four elements, including domain, domain model, implementation and appropriation, and design. Whether you have daily or monthly meetings, a brilliant presentation is necessary. Datafy Framework Of Datafication Technology Infographics PDF can be your best option for delivering a presentation. Represent everything in detail using Datafy Framework Of Datafication Technology Infographics PDF and make yourself stand out in meetings. The template is versatile and follows a structure that will cater to your requirements. All the templates prepared by Slidegeeks are easy to download and edit. Our research experts have taken care of the corporate themes as well. So, give it a try and see the results.
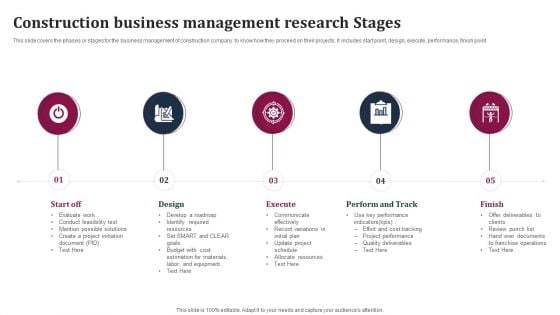
Construction Business Management Research Stages Infographics PDF
This slide covers the phases or stages for the business management of construction company to know how they proceed on their projects. It includes start point, design, execute, performance, finish point.Presenting Construction Business Management Research Stages Infographics PDF to dispense important information. This template comprises five stages. It also presents valuable insights into the topics including Communicate Effectively, Record Variations, Allocate Resources. This is a completely customizable PowerPoint theme that can be put to use immediately. So, download it and address the topic impactfully.
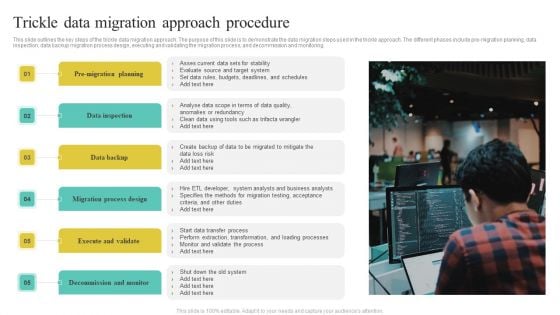
Trickle Data Migration Approach Procedure Infographics PDF
This slide outlines the key steps of the trickle data migration approach. The purpose of this slide is to demonstrate the data migration steps used in the trickle approach. The different phases include pre-migration planning, data inspection, data backup migration process design, executing and validating the migration process, and decommission and monitoring.Presenting Trickle Data Migration Approach Procedure Infographics PDF to dispense important information. This template comprises Five stages. It also presents valuable insights into the topics including Data Inspection, Data Backup, Execute And Validate . This is a completely customizable PowerPoint theme that can be put to use immediately. So, download it and address the topic impactfully.
Project Problem Administration Tracking Dashboard Infographics PDF
This slide covers dashboard which helps the project managers to keep the track of all issues in detail. It also includes project name, department, project owner, detail of the issue, priority and status. Showcasing this set of slides titled project problem administration tracking dashboard infographics pdf. The topics addressed in these templates are project problem administration tracking dashboard. All the content presented in this PPT design is completely editable. Download it and make adjustments in color, background, font etc. as per your unique business setting.
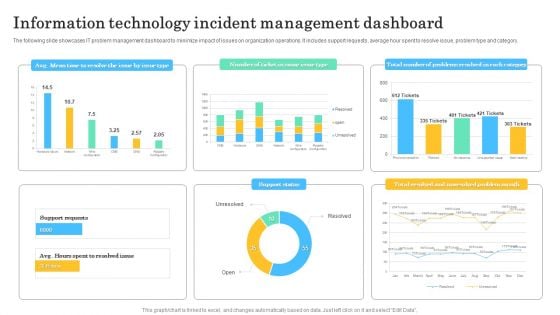
Information Technology Incident Management Dashboard Infographics PDF
The following slide showcases IT problem management dashboard to minimize impact of issues on organization operations. It includes support requests, average hour spent to resolve issue, problem type and category. Showcasing this set of slides titled Information Technology Incident Management Dashboard Infographics PDF. The topics addressed in these templates are Avg Mean Time, Resolve The Issue, Issue Type. All the content presented in this PPT design is completely editable. Download it and make adjustments in color, background, font etc. as per your unique business setting.
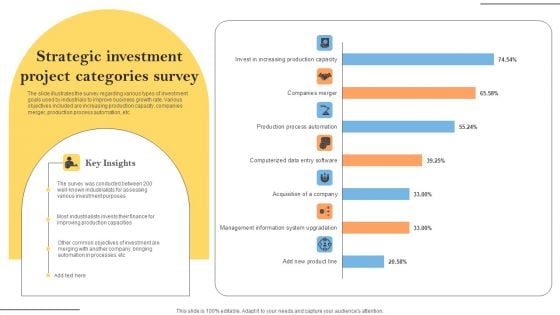
Strategic Investment Project Categories Survey Infographics PDF
The slide illustrates the survey regarding various types of investment goals used by industrials to improve business growth rate. Various objectives included are increasing production capacity, companies merger, production process automation, etc . Showcasing this set of slides titled Strategic Investment Project Categories Survey Infographics PDF. The topics addressed in these templates are Investment, Automation In Processes, Key Insights. All the content presented in this PPT design is completely editable. Download it and make adjustments in color, background, font etc. as per your unique business setting.

Monthly Product Sales Analysis Dashboard Infographics PDF
This slide illustrates a dashboard for product sales review to measure to help business monitor and improve productivity, employee engagement and meet revenue targets. It covers product names with sales reps, lead conversion, response time and outbound calls. Showcasing this set of slides titled Monthly Product Sales Analysis Dashboard Infographics PDF. The topics addressed in these templates are Lead Conversion Rate, Outbound Calls, Sales Analysis Dashboard. All the content presented in this PPT design is completely editable. Download it and make adjustments in color, background, font etc. as per your unique business setting.
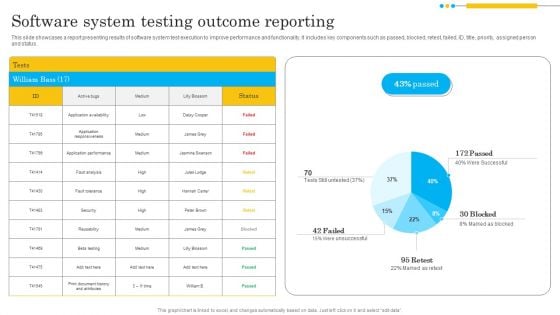
Software System Testing Outcome Reporting Infographics PDF
This slide showcases a report presenting results of software system test execution to improve performance and functionality. It includes key components such as passed, blocked, retest, failed, ID, title, priority, assigned person and status. Showcasing this set of slides titled Software System Testing Outcome Reporting Infographics PDF. The topics addressed in these templates are Application Responsiveness, Application Performance, Security. All the content presented in this PPT design is completely editable. Download it and make adjustments in color, background, font etc. as per your unique business setting.
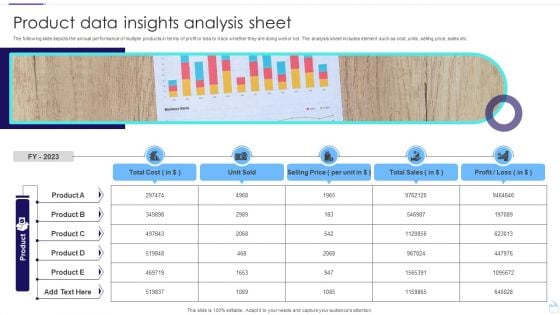
Product Data Insights Analysis Sheet Infographics PDF
The following slide depicts the annual performance of multiple products in terms of profit or loss to track whether they are doing well or not. The analysis sheet includes element such as cost, units, selling price, sales etc. Pitch your topic with ease and precision using this Product Data Insights Analysis Sheet Infographics PDF. This layout presents information on Unit Sold, Selling Price, Total Sales. It is also available for immediate download and adjustment. So, changes can be made in the color, design, graphics or any other component to create a unique layout.
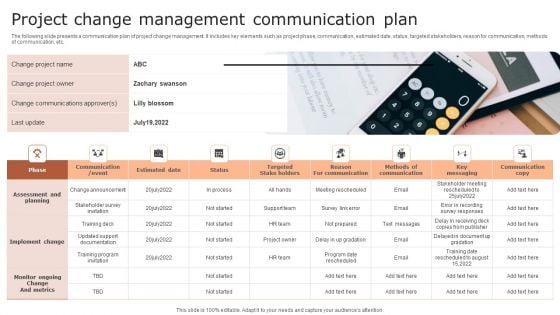
Project Change Management Communication Plan Infographics PDF
The following slide presents a communication plan of project change management. It includes key elements such as project phase, communication, estimated date, status, targeted stakeholders, reason for communication, methods of communication, etc. Persuade your audience using this Project Change Management Communication Plan Infographics PDF. This PPT design covers one stages, thus making it a great tool to use. It also caters to a variety of topics including Communication Plan, Project, Change. Download this PPT design now to present a convincing pitch that not only emphasizes the topic but also showcases your presentation skills.
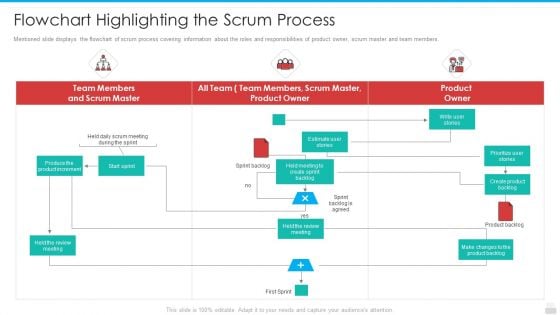
Flowchart Highlighting The Scrum Process Infographics PDF
Mentioned slide displays the flowchart of scrum process covering information about the roles and responsibilities of product owner, scrum master and team members.Presenting flowchart highlighting the scrum process infographics pdf to provide visual cues and insights. Share and navigate important information on three stages that need your due attention. This template can be used to pitch topics like estimate user stories, write user stories, prioritize user stories. In addtion, this PPT design contains high resolution images, graphics, etc, that are easily editable and available for immediate download.
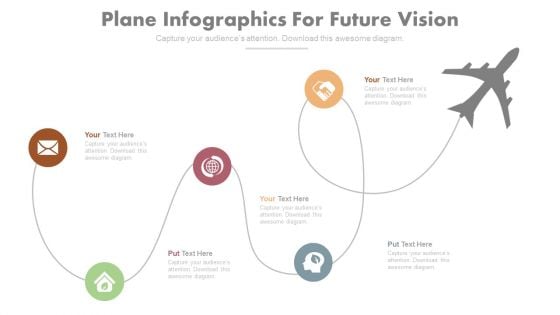
Plane Infographics For Future Vision PowerPoint Slides
Don?t just explain your future plans verbally or through boring text. Your audience would lose interest even before you start. But you can change that. Show the plan. Show the goals. Here is the perfect way to do this. Use this creatively designed PPT template to tell your colleagues or clients what are the future goals for them or for the company. You can use this slide to show that your business is global or upgrading to a multinational level. One can use this template to show what points need to be taken care of before actually entering into the market. Alternatively, you can use this slide for travelling purposes such as itinerary or information about the location and the dates of travel. This multipurpose PowerPoint template is actually easy to edit as well like all our slides. You can change the icon, color and text as per your need. Use this slide to keep your audience?s interest alive.
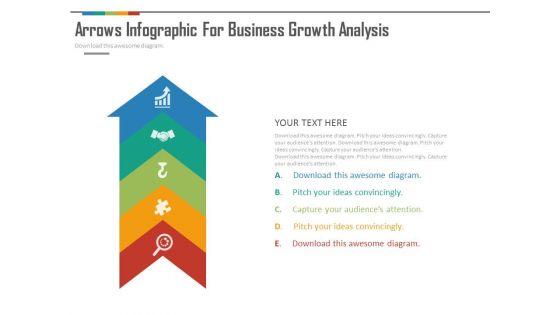
Arrow Infographics For Strategic Analysis Powerpoint Slides
This PowerPoint template contains design of arrow infographic. Download this diagram slide to depict strategic analysis. Use this PPT slide to make impressive presentations.
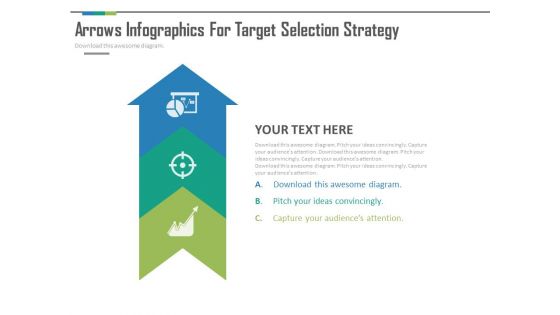
Arrow Infographics With Three Steps Powerpoint Slides
This PowerPoint template contains design of arrow infographic. Download this diagram slide to depict three steps of strategic analysis. Use this PPT slide to make impressive presentations.
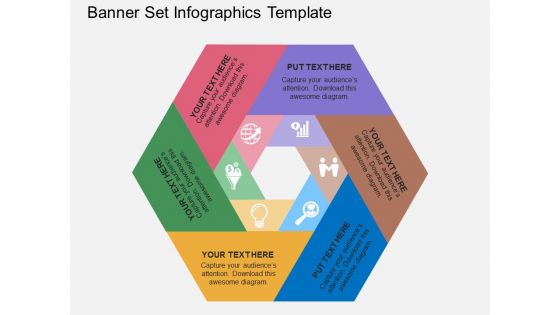
Banner Set Infographics Template Powerpoint Template
This business slide displays banner set Infographic. Download this diagram to represent concept of finance, management and success. Enlighten your audience with your breathtaking ideas.
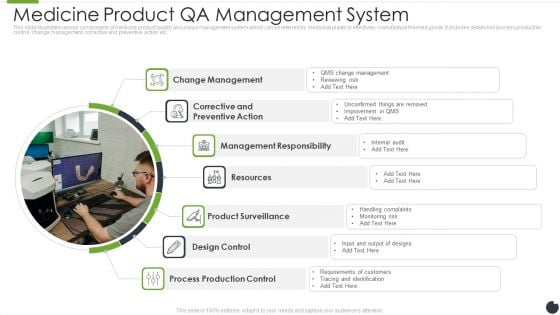
Medicine Product QA Management System Infographics PDF
This slide illustrates various components of medicine product quality assurance management system which can be referred by medicinal plants to effectively manufacture finished goods. It includes details like process production control, change management, corrective and preventive action etc. Presenting medicine product qa management system infographics pdf to dispense important information. This template comprises seven stages. It also presents valuable insights into the topics including management responsibility, product surveillance, process production control. This is a completely customizable PowerPoint theme that can be put to use immediately. So, download it and address the topic impactfully.
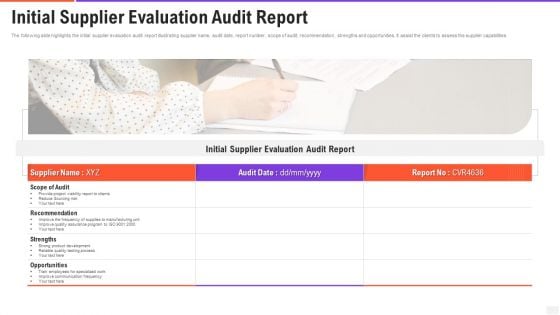
Initial Supplier Evaluation Audit Report Infographics PDF
The following slide highlights the initial supplier evaluation audit report illustrating supplier name, audit date, report number, scope of audit, recommendation, strengths and opportunities. It assist the clients to assess the supplier capabilities. Presenting initial supplier evaluation audit report infographics pdf to dispense important information. This template comprises one stages. It also presents valuable insights into the topics including scope of audit, recommendation, opportunities. This is a completely customizable PowerPoint theme that can be put to use immediately. So, download it and address the topic impactfully.
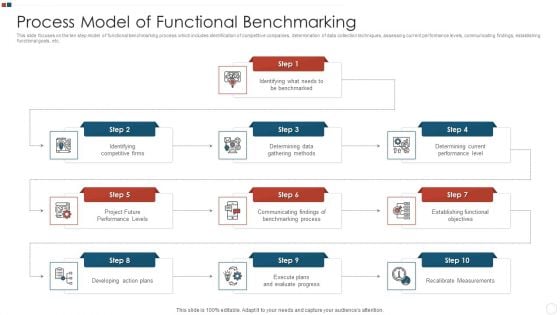
Process Model Of Functional Benchmarking Infographics PDF
This slide focuses on the ten step model of functional benchmarking process which includes identification of competitive companies, determination of data collection techniques, assessing current performance levels, communicating findings, establishing functional goals, etc.Presenting Process Model Of Functional Benchmarking Infographics PDF to dispense important information. This template comprises ten stages. It also presents valuable insights into the topics including Identifying, Competitive Firms, Determining Data, Gathering Methods This is a completely customizable PowerPoint theme that can be put to use immediately. So, download it and address the topic impactfully.
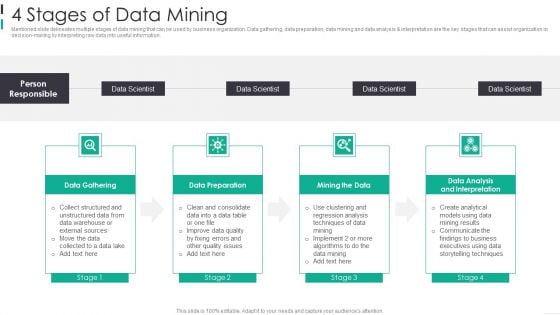
4 Stages Of Data Mining Infographics PDF
Mentioned slide delineates multiple stages of data mining that can be used by business organization. Data gathering, data preparation, data mining and data analysis and interpretation are the key stages that can assist organization in decision-making by interpreting raw data into useful information. Presenting 4 Stages Of Data Mining Infographics PDF to dispense important information. This template comprises four stages. It also presents valuable insights into the topics including Data Gathering, Data Preparation, Mining The Data This is a completely customizable PowerPoint theme that can be put to use immediately. So, download it and address the topic impactfully.

Developing Executive Management Team Expertise Infographics PDF
This slide mentions the executives involved that build management team of an organization which is responsible to drive change. It includes chief financial officer, director of marketing, director of human resources, chief technological officer and chief executive officer.Presenting Developing Executive Management Team Expertise Infographics PDF to dispense important information. This template comprises five stages. It also presents valuable insights into the topics including Financial Officer, Director Marketing, Director Human. This is a completely customizable PowerPoint theme that can be put to use immediately. So, download it and address the topic impactfully.

Typical Service Provider Training Curriculum Infographics PDF
This slide covers the various training that must be included in the curriculum of channel partner training. It includes trainings on brand, product and service, compliance, customer support skills, etc. Presenting Typical Service Provider Training Curriculum Infographics PDF to dispense important information. This template comprises three stages. It also presents valuable insights into the topics including Brand Training, Product And Service Training, Compliance Training. This is a completely customizable PowerPoint theme that can be put to use immediately. So, download it and address the topic impactfully.
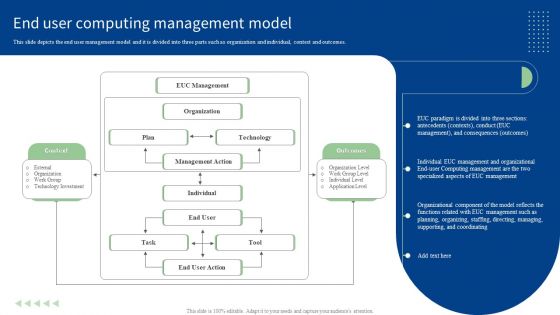
End User Computing Management Model Infographics PDF
This slide depicts the end user management model and it is divided into three parts such as organization and individual, context and outcomes. Do you know about Slidesgeeks End User Computing Management Model Infographics PDF These are perfect for delivering any kind od presentation. Using it, create PowerPoint presentations that communicate your ideas and engage audiences. Save time and effort by using our pre-designed presentation templates that are perfect for a wide range of topic. Our vast selection of designs covers a range of styles, from creative to business, and are all highly customizable and easy to edit. Download as a PowerPoint template or use them as Google Slides themes.
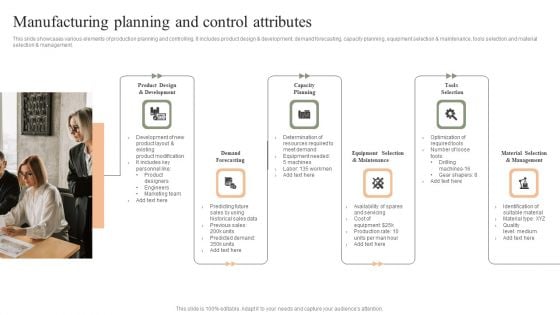
Manufacturing Planning And Control Attributes Infographics PDF
This slide showcases various elements of production planning and controlling. It includes product design and development, demand forecasting, capacity planning, equipment selection and maintenance, tools selection and material selection and management. Presenting Manufacturing Planning And Control Attributes Infographics PDF to dispense important information. This template comprises Six stage. It also presents valuable insights into the topics including Product Design Development, Demand Forecasting, Capacity Planning. This is a completely customizable PowerPoint theme that can be put to use immediately. So, download it and address the topic impactfully.

Nike Brand Strategy Swot Analysis Infographics PDF
This slide presents SWOT analysis of Nikes business strategy helpful in evaluating its performance and strategic position. It includes strengths, weaknesses, opportunities and threats that help to know how existing resources can counteract potential damages. Presenting Nike Brand Strategy Swot Analysis Infographics PDF to dispense important information. This template comprises four stages. It also presents valuable insights into the topics including Weaknesses, Threats, Opportunities, Strengths. This is a completely customizable PowerPoint theme that can be put to use immediately. So, download it and address the topic impactfully.
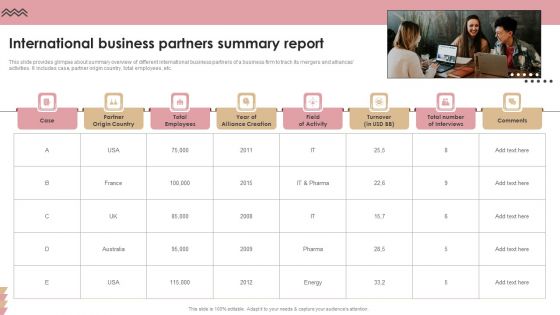
International Business Partners Summary Report Infographics PDF
This slide provides glimpse about summary overview of different international business partners of a business firm to track its mergers and alliances activities. It includes case, partner origin country, total employees, etc. Presenting International Business Partners Summary Report Infographics PDF to dispense important information. This template comprises eight stages. It also presents valuable insights into the topics including Partner Origin Country, Year Of Alliance Creation, Field Of Activity. This is a completely customizable PowerPoint theme that can be put to use immediately. So, download it and address the topic impactfully.
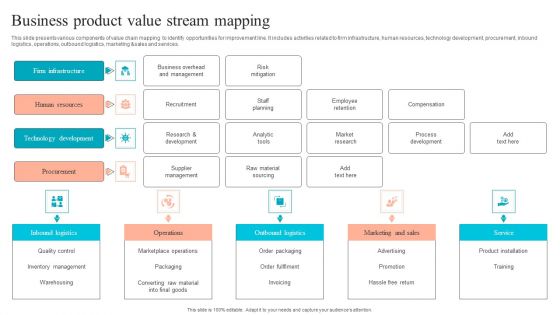
Business Product Value Stream Mapping Infographics PDF
This slide presents various components of value chain mapping to identify opportunities for improvement line. It includes activities related to firm infrastructure, human resources, technology development, procurement, inbound logistics, operations, outbound logistics, marketing and sales and services. Presenting Business Product Value Stream Mapping Infographics PDF to dispense important information. This template comprises five stages. It also presents valuable insights into the topics including Inbound Logistics, Operations, Outbound Logistics. This is a completely customizable PowerPoint theme that can be put to use immediately. So, download it and address the topic impactfully.
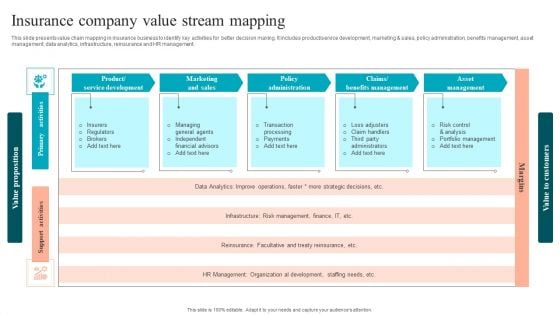
Insurance Company Value Stream Mapping Infographics PDF
This slide presents value chain mapping in insurance business to identify key activities for better decision making. It includes product service development, marketing and sales, policy administration, benefits management, asset management, data analytics, infrastructure, reinsurance and HR management. Presenting Insurance Company Value Stream Mapping Infographics PDF to dispense important information. This template comprises five stages. It also presents valuable insights into the topics including Product Service Development, Marketing Sales, Policy Administration. This is a completely customizable PowerPoint theme that can be put to use immediately. So, download it and address the topic impactfully.
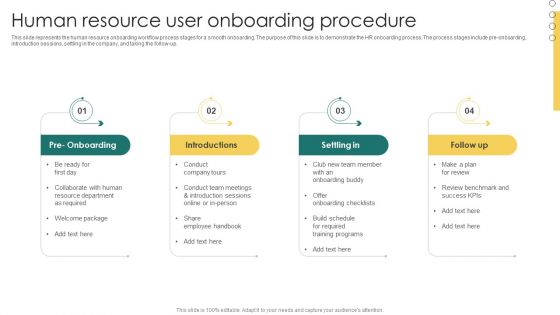
Human Resource User Onboarding Procedure Infographics PDF
This slide represents the human resource onboarding workflow process stages for a smooth onboarding. The purpose of this slide is to demonstrate the HR onboarding process. The process stages include pre onboarding, introduction sessions, settling in the company, and taking the follow-up. Presenting Human Resource User Onboarding Procedure Infographics PDF to dispense important information. This template comprises four stages. It also presents valuable insights into the topics including Onboarding, Introductions, Settling In. This is a completely customizable PowerPoint theme that can be put to use immediately. So, download it and address the topic impactfully.
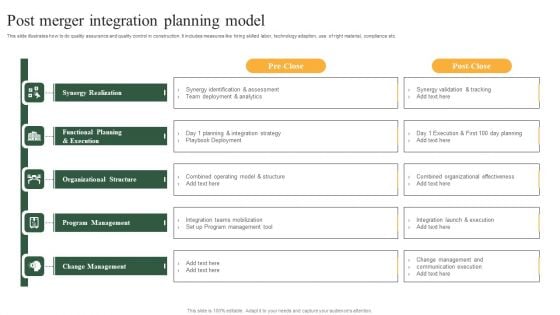
Post Merger Integration Planning Model Infographics PDF
This slide illustrates how to do quality assurance and quality control in construction. It includes measures like hiring skilled labor, technology adaption, use of right material, compliance etc. Presenting Post Merger Integration Planning Model Infographics PDF to dispense important information. This template comprises five stages. It also presents valuable insights into the topics including Synergy Realization, Functional Planning And Execution, Organizational Structure, Program Management, Change Management. This is a completely customizable PowerPoint theme that can be put to use immediately. So, download it and address the topic impactfully.
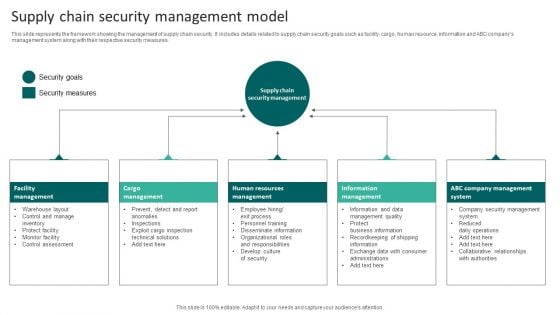
Supply Chain Security Management Model Infographics PDF
This slide represents the framework showing the management of supply chain security. It includes details related to supply chain security goals such as facility, cargo, human resource, information and ABC companys management system along with their respective security measures. Presenting Supply Chain Security Management Model Infographics PDF to dispense important information. This template comprises five stages. It also presents valuable insights into the topics including Human Resources Management, Cargo Management, Facility Management. This is a completely customizable PowerPoint theme that can be put to use immediately. So, download it and address the topic impactfully.
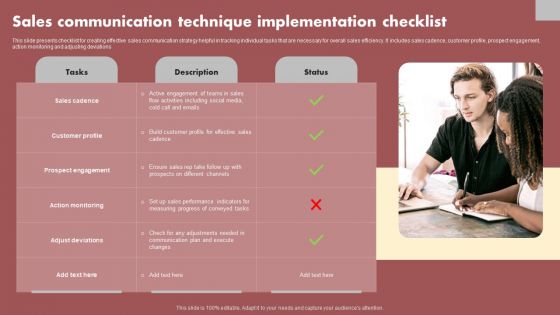
Sales Communication Technique Implementation Checklist Infographics PDF
This slide presents checklist for creating effective sales communication strategy helpful in tracking individual tasks that are necessary for overall sales efficiency. It includes sales cadence, customer profile, prospect engagement, action monitoring and adjusting deviations. Presenting Sales Communication Technique Implementation Checklist Infographics PDF to dispense important information. This template comprises one stages. It also presents valuable insights into the topics including Sales Cadence, Customer Profile, Prospect Engagement. This is a completely customizable PowerPoint theme that can be put to use immediately. So, download it and address the topic impactfully.
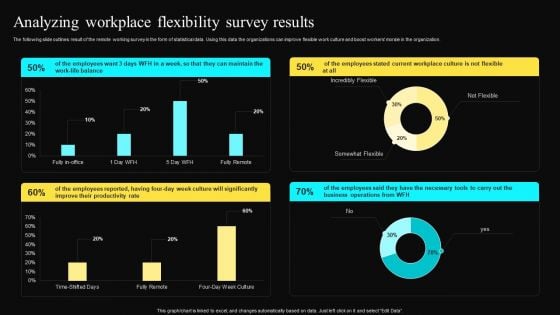
Analyzing Workplace Flexibility Survey Results Infographics PDF
The following slide outlines result of the remote working survey in the form of statistical data. Using this data the organizations can improve flexible work culture and boost workers morale in the organization. Slidegeeks is here to make your presentations a breeze with Analyzing Workplace Flexibility Survey Results Infographics PDF With our easy to use and customizable templates, you can focus on delivering your ideas rather than worrying about formatting. With a variety of designs to choose from, you are sure to find one that suits your needs. And with animations and unique photos, illustrations, and fonts, you can make your presentation pop. So whether you are giving a sales pitch or presenting to the board, make sure to check out Slidegeeks first.
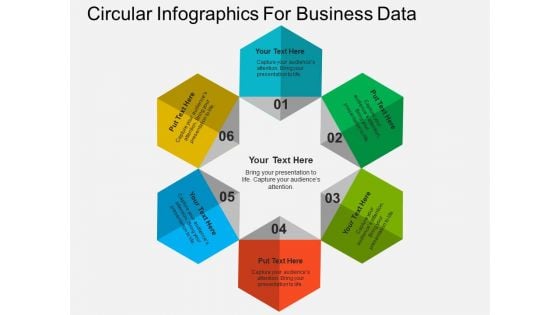
Circular Infographics For Business Data Powerpoint Templates
This PowerPoint diagram slide contains circular infographic. Download this diagram slide to display six steps of business process. You can edit text, color, shade and style of this diagram as per you need.
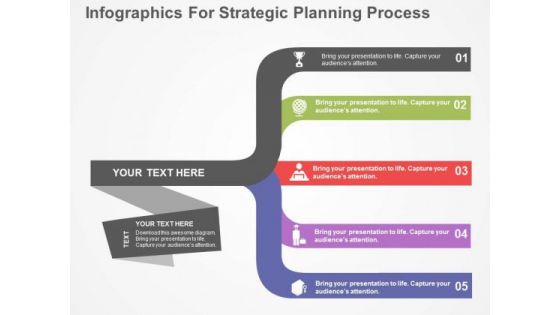
Infographics For Strategic Planning Process PowerPoint Template
Our professionally designed business diagram is as an effective tool for communicating ideas and planning. It contains banner infographic. Convey your strategic planning process with this diagram slide. It will amplify the strength of your logic.
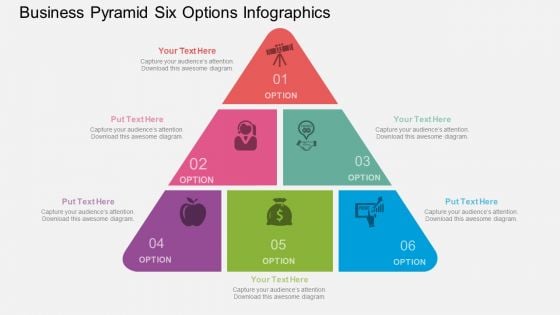
Business Pyramid Six Options Infographics Powerpoint Template
This professional diagram slide has been designed with graphics of pyramid six options infographic. You may use this diagram to display success strategy. Download this slide to build impressive presentations.
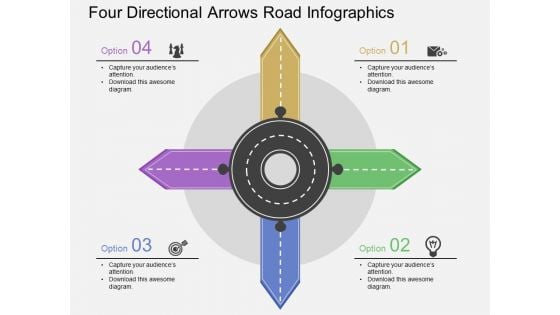
Four Directional Arrows Road Infographics Powerpoint Template
Download this exclusive business diagram to present four steps of financial reporting. This slide contains the four directional arrows road infographic. This PPT diagram slide is useful for business presentations.
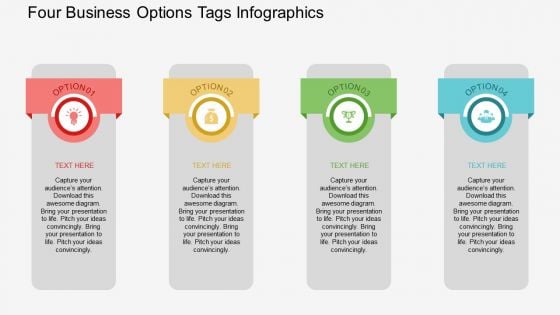
Four Business Options Tags Infographics Powerpoint Template
The above PowerPoint slide displays four options tags infographic. This PowerPoint diagram helps to summarize complex business data. Adjust the above diagram in your business presentations to visually support your content.
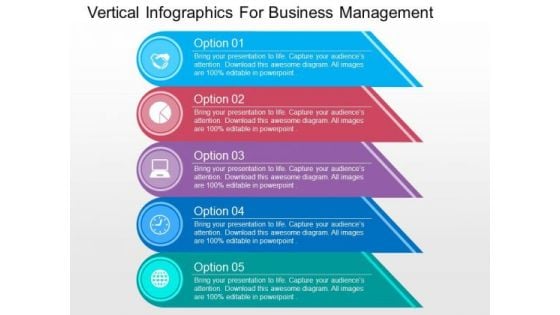
Vertical Infographics For Business Management PowerPoint Templates
Our above PPT slide displays vertical infographic. This diagram slide may use to represent concepts related to business management. Download this template to leave permanent impression on your audience.
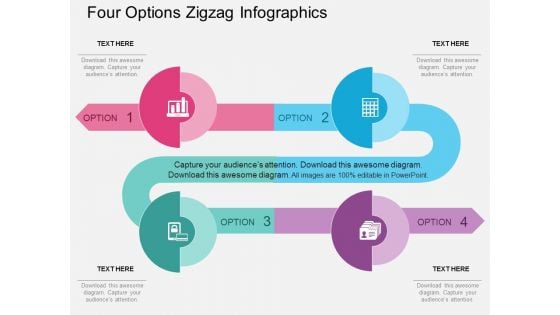
Four Options Zigzag Infographics Powerpoint Template
Emphatically define your message with our above template which contains four options zigzag infographic. This business diagram may be used to plot data series. Deliver amazing presentations to mesmerize your audience.
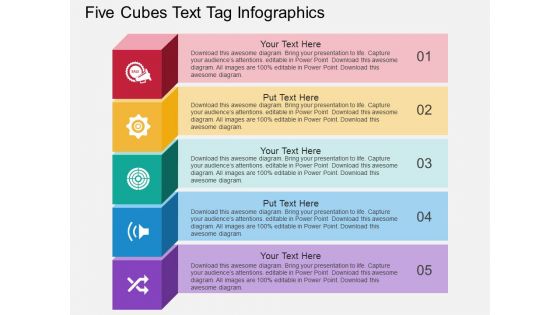
Five Cubes Text Tag Infographics Powerpoint Template
This business slide has been designed with cubes text tag infographic. You may download this PowerPoint template to display chain of business steps. This PPT diagram slide will help you to sequence your thoughts.

Banners Infographics For Financial Process Powerpoint Slides
This PowerPoint template contains diagram of banners infographic. You may download this slide to display strategy steps for financial process. You can easily customize this template to make it more unique as per your need.
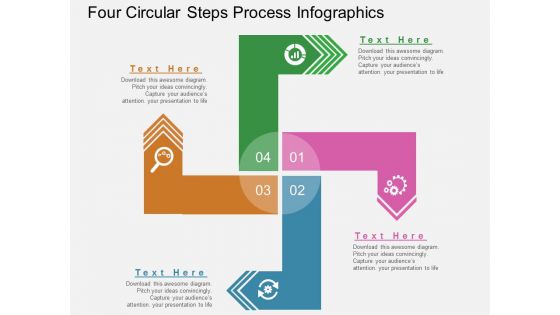
Four Circular Steps Process Infographics Powerpoint Template
This PowerPoint slide contains circular steps process infographic. This professional slide may be used for visual explanation of data. Adjust the above diagram in your business presentations to give professional impact.
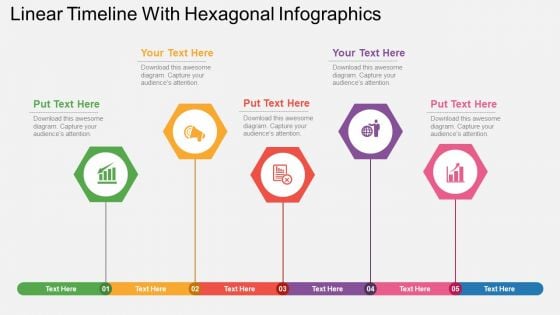
Linear Timeline With Hexagonal Infographics Powerpoint Template
Adjust the above diagram into your presentations to visually support your content. This PPT slide has been professionally designed with linear timeline with hexagonal infographic. This template offers an excellent background to display timeline and planning.
Venn Ppt PowerPoint Presentation Styles Infographics
This is a venn ppt powerpoint presentation styles infographics. This is a four stage process. The stages in this process are venn, business, marketing, strategy, management.
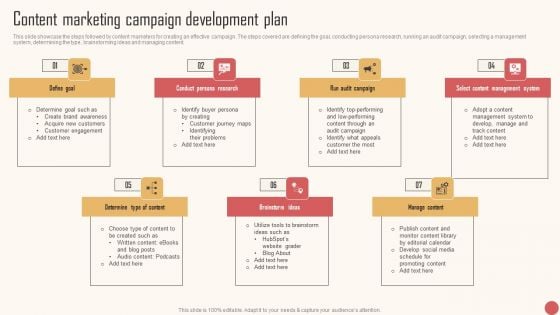
Content Marketing Campaign Development Plan Infographics PDF
This slide showcase the steps followed by content marketers for creating an effective campaign. The steps covered are defining the goal, conducting persona research, running an audit campaign, selecting a management system, determining the type, brainstorming ideas and managing content. Retrieve professionally designed Content Marketing Campaign Development Plan Infographics PDF to effectively convey your message and captivate your listeners. Save time by selecting pre-made slideshows that are appropriate for various topics, from business to educational purposes. These themes come in many different styles, from creative to corporate, and all of them are easily adjustable and can be edited quickly. Access them as PowerPoint templates or as Google Slides themes. You do not have to go on a hunt for the perfect presentation because Slidegeeks got you covered from everywhere.
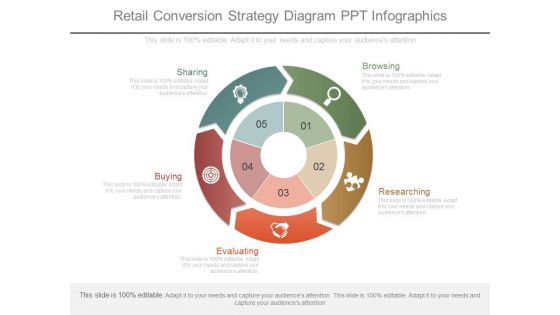
Retail Conversion Strategy Diagram Ppt Infographics
This is a retail conversion strategy diagram ppt infographics. This is a five stage process. The stages in this process are sharing, browsing, buying, researching, evaluating.
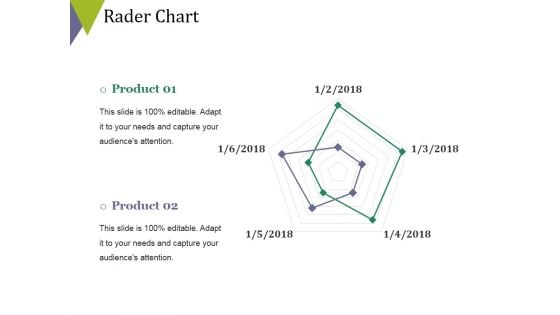
Rader Chart Ppt PowerPoint Presentation Portfolio Infographics
This is a rader chart ppt powerpoint presentation portfolio infographics. This is a two stage process. The stages in this process are rader chart, finance, analysis, business, marketing.
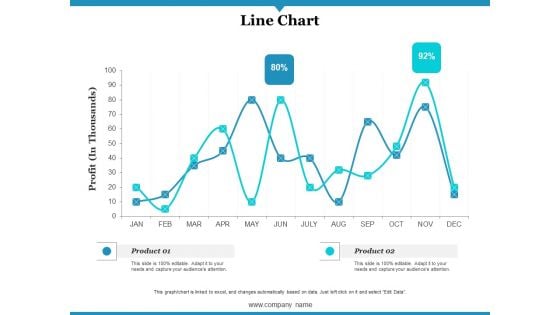
Line Chart Ppt PowerPoint Presentation Gallery Infographics
This is a line chart ppt powerpoint presentation gallery infographics. This is a two stage process. The stages in this process are profit, product, line chart.
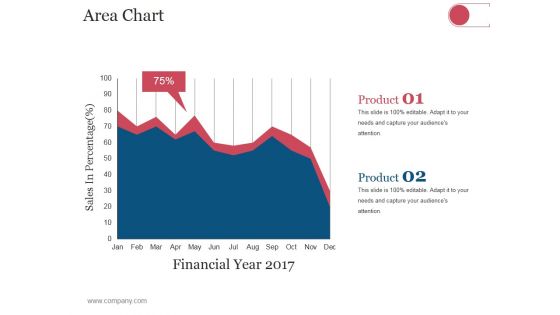
Area Chart Ppt PowerPoint Presentation Professional Infographics
This is a area chart ppt powerpoint presentation professional infographics. This is a two stage process. The stages in this process are business, strategy, analysis, planning, area chart.
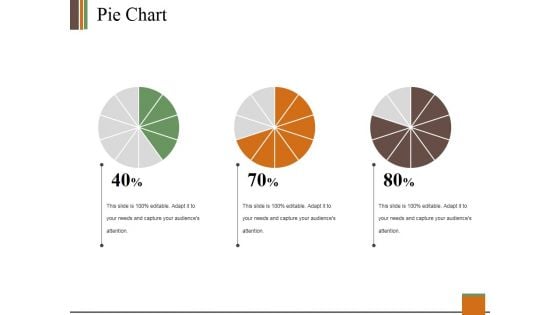
Pie Chart Ppt PowerPoint Presentation Summary Infographics
This is a pie chart ppt powerpoint presentation summary infographics. This is a three stage process. The stages in this process are pie, process, percentage, finance, business.
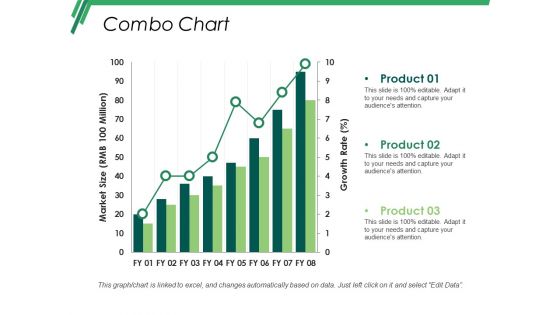
Combo Chart Ppt PowerPoint Presentation Layouts Infographics
This is a combo chart ppt powerpoint presentation layouts infographics. This is a three stage process. The stages in this process are business, marketing, strategy, planning, finance.
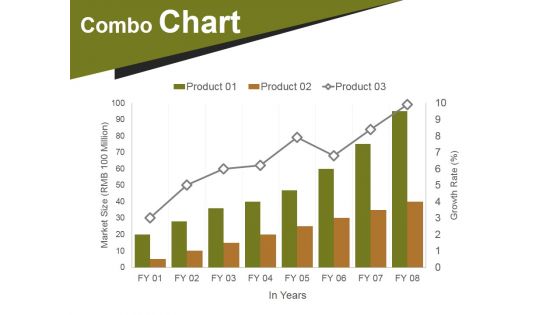
Combo Chart Ppt PowerPoint Presentation Portfolio Infographics
This is a combo chart ppt powerpoint presentation portfolio infographics. This is a eight stage process. The stages in this process are market size, growth, years, finance, business.
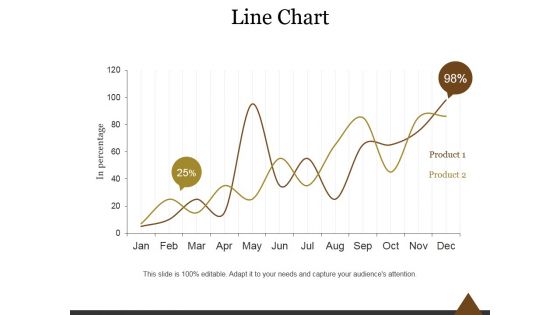
Line Chart Ppt PowerPoint Presentation Infographics
This is a line chart ppt powerpoint presentation infographics. This is a two stage process. The stages in this process are line chart, product, business, marketing, management.
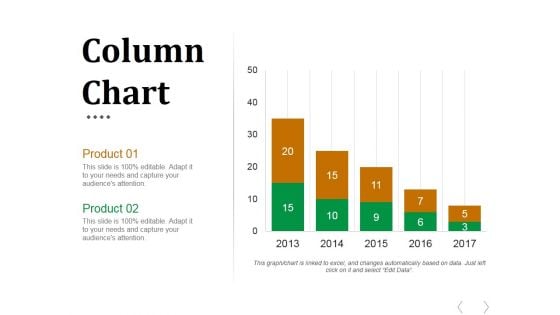
Column Chart Ppt PowerPoint Presentation Slides Infographics
This is a column chart ppt powerpoint presentation slides infographics. This is a five stage process. The stages in this process are business, marketing, management, column chart, timeline.
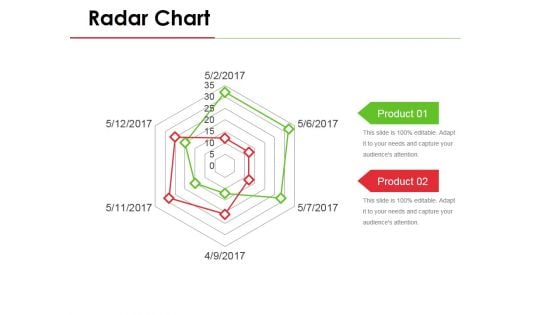
Radar Chart Ppt PowerPoint Presentation Styles Infographics
This is a radar chart ppt powerpoint presentation styles infographics. This is a six stage process. The stages in this process are business, marketing, product, radar chart, strategy.

Combo Chart Ppt PowerPoint Presentation Professional Infographics
This is a combo chart ppt powerpoint presentation professional infographics. This is a three stage process. The stages in this process are combo chart, market size, product.
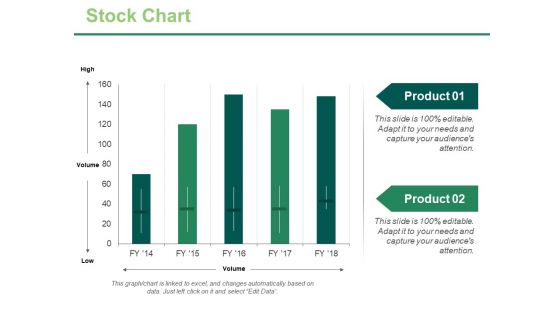
Stock Chart Ppt PowerPoint Presentation Ideas Infographics
This is a stock chart ppt powerpoint presentation ideas infographics. This is a two stage process. The stages in this process are high, volume, low, product, stock chart.
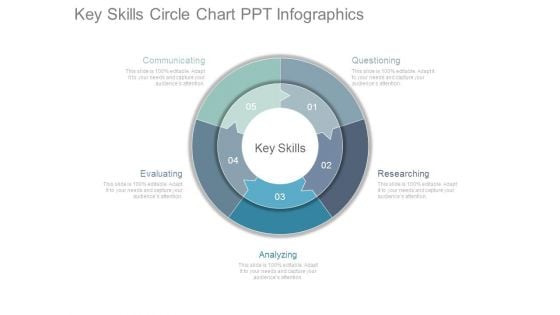
Key Skills Circle Chart Ppt Infographics
This is a key skills circle chart ppt infographics. This is a five stage process. The stages in this process are questioning, researching, analyzing, evaluating, communicating, key skills.
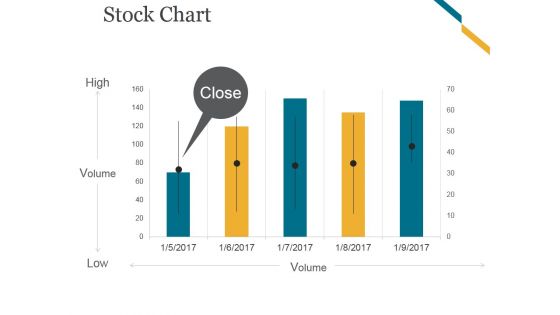
Stock Chart Ppt PowerPoint Presentation Infographics
This is a stock chart ppt powerpoint presentation infographics. This is a five stage process. The stages in this process are high, volume, low.
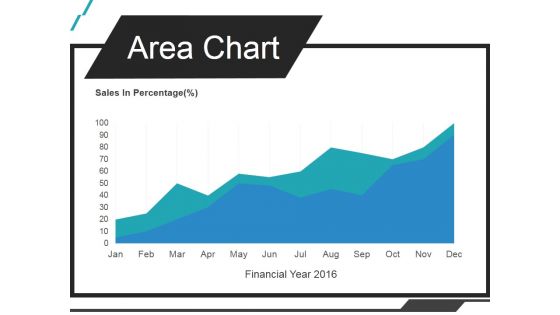
Area Chart Ppt PowerPoint Presentation Infographics
This is a area chart ppt powerpoint presentation infographics. This is a one stage process. The stages in this process are sales in percentage, jan, feb, mar, apr.
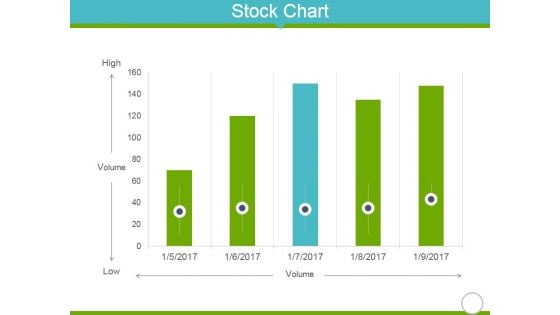
Stock Chart Ppt PowerPoint Presentation Portfolio Infographics
This is a stock chart ppt powerpoint presentation portfolio infographics. This is a five stage process. The stages in this process are high, volume, low, finance, business.
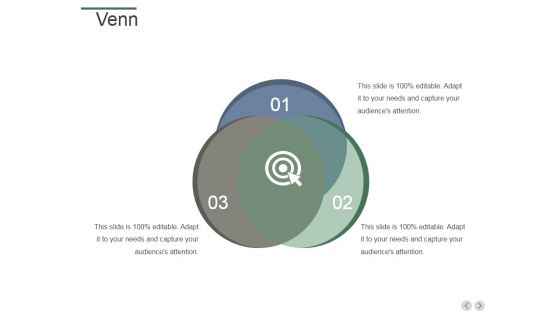
Venn Ppt PowerPoint Presentation Visual Aids Infographics
This is a venn ppt powerpoint presentation visual aids infographics. This is a three stage process. The stages in this process are venn, planning, business, strategy, management.
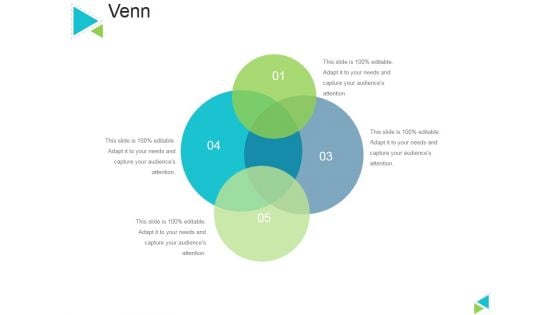
Venn Ppt PowerPoint Presentation Gallery Infographics
This is a venn ppt powerpoint presentation gallery infographics. This is a five stage process. The stages in this process are venn, business, marketing, process, management.

 Home
Home