Infographic Icons

Inventory Management Framework Ppt PowerPoint Presentation Infographics Files
This is a inventory management framework ppt powerpoint presentation infographics files. This is a five stage process. The stages in this process are inventory management framework, marketing, icons, strategy, business.
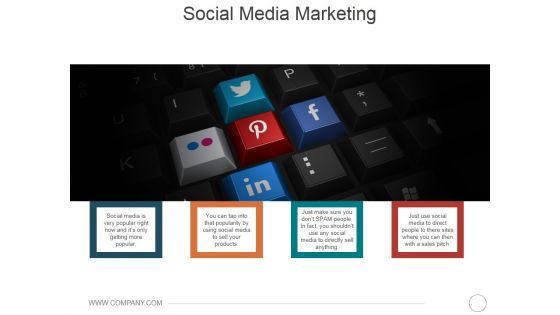
Social Media Marketing Ppt PowerPoint Presentation Portfolio Infographics
This is a social media marketing ppt powerpoint presentation portfolio infographics. This is a four stage process. The stages in this process are business, marketing, strategy, icons, social.
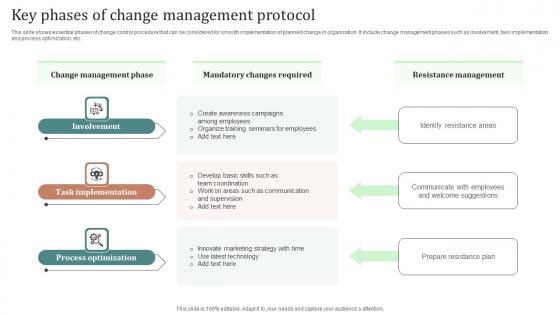
Key Phases Of Change Management Protocols Ppt Infographics Deck Pdf
This slide shows essential phases of change control procedure that can be considered for smooth implementation of planned change in organization. It include change management phases such as involvement, task implementation and process optimization, etc. Showcasing this set of slides titled Key Phases Of Change Management Protocols Ppt Infographics Deck Pdf. The topics addressed in these templates are Involvement, Task Implementation, Process Optimization. All the content presented in this PPT design is completely editable. Download it and make adjustments in color, background, font etc. as per your unique business setting. This slide shows essential phases of change control procedure that can be considered for smooth implementation of planned change in organization. It include change management phases such as involvement, task implementation and process optimization, etc.
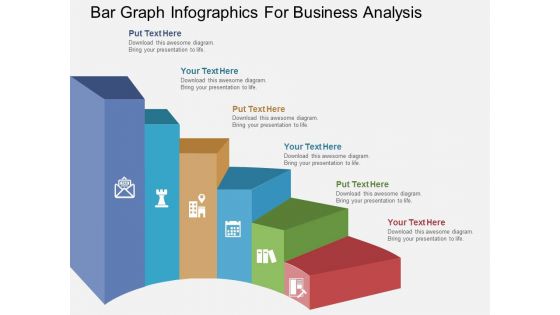
Bar Graph Infographics For Business Analysis Powerpoint Template
This PowerPoint template contains bar graph with icons. This PPT slide helps to exhibit concepts like strategy, direction and success. Use this business slide to make impressive presentations.
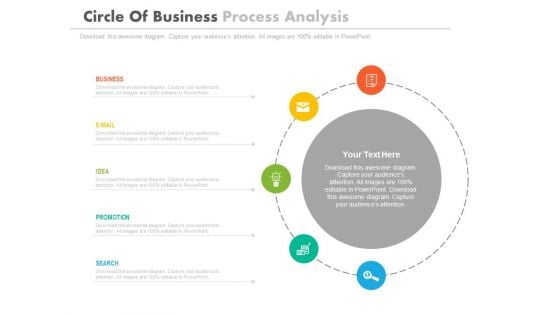
Circle Infographics For Market Research Analysis Powerpoint Template
This PowerPoint template has been designed with circular infographic diagram. You can use this PPT diagram slide to visually support your content. Above slide is suitable for business presentation.
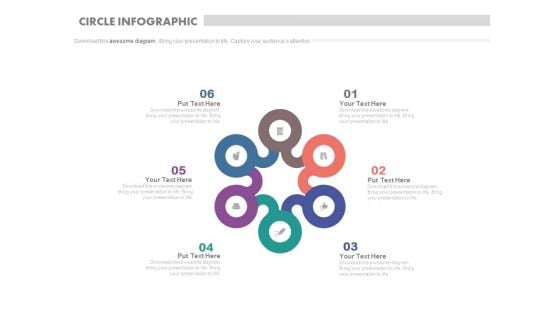
Six Steps Circle Infographics For Process Flow Powerpoint Slides
This business slide contains circular infographic design. This diagram provides schematic representation of any information. Visual effect this slide helps in maintaining the flow of the discussion and provides more clarity to the subject.
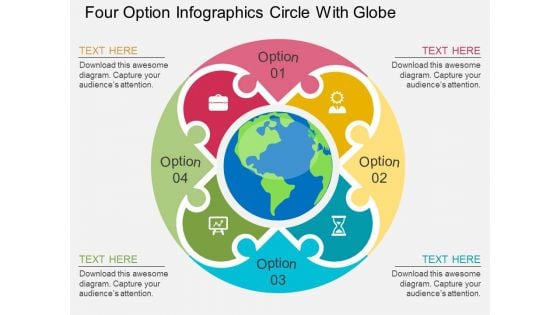
Four Option Infographics Circle With Globe Powerpoint Template
Download this exclusive business diagram to present ideas of global business management. This PPT slide contains four option infographic circles with globe. This diagram can be used for business related presentations.
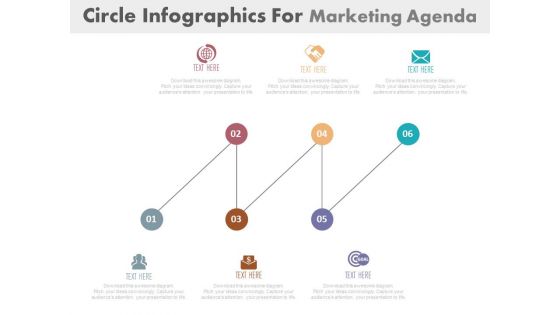
Infographics Diagram For Strategy Planning Process Powerpoint Template
This PowerPoint template has been designed with zigzag steps infographic diagram. This diagram can be used to display strategy planning process. Capture the attention of your audience with this slide.
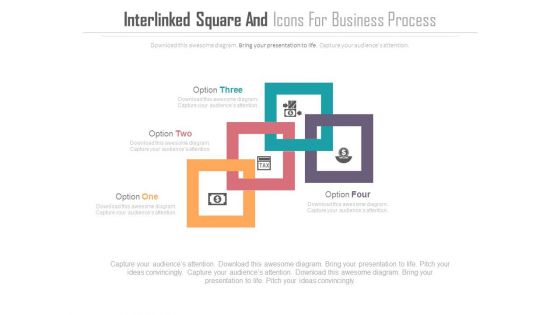
Infographics For Business Management Strategic Planning Powerpoint Template
This Power Point template has been designed with infographic diagram. This PPT diagram may be used for concepts like business management and strategic planning. Use this PPT diagram for business and finance related presentations.
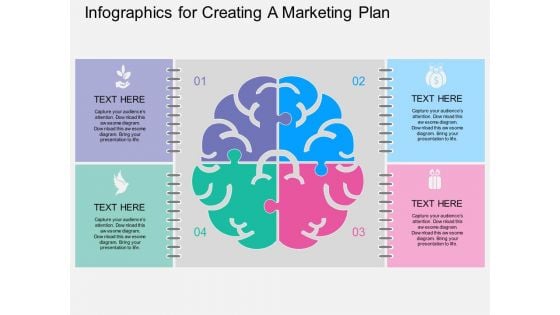
Infographics For Creating A Marketing Plan Powerpoint Template
The above template displays four steps brain infographic diagram. This diagram has been professionally designed for creating a marketing plan. Grab centre stage with this slide and capture the attention of your audience.
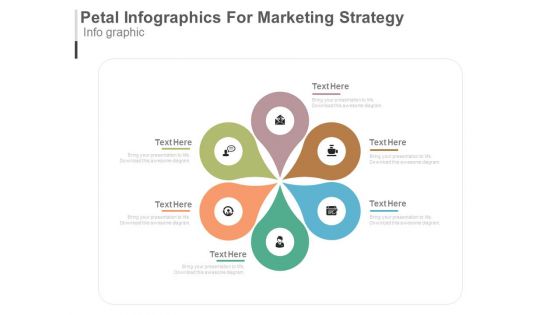
Six Steps Circular Infographics For Marketing Strategy Powerpoint Template
Create visually amazing presentations with slide of circular infographic chart. This business slide may be used to depict six steps of marketing strategy. You may use this slide to share a plan to achieve the desired goals.
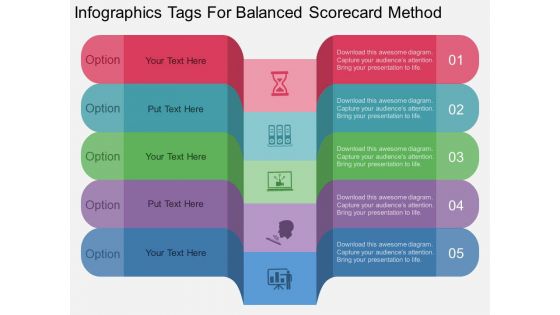
Infographics Tags For Balanced Scorecard Method Powerpoint Template
Five options infographic tags have been used to design this power point template. This diagram contains the concept of balanced scorecard management. Download this template to leave permanent impression on your audience.
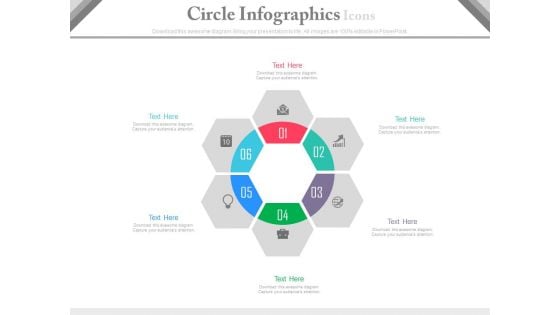
Circle Infographics Developing A Marketing Strategy Powerpoint Template
This business slide contains circular infographic design. This diagram may be used for developing a marketing strategy. Visual effect this slide helps in maintaining the flow of the discussion and provides more clarity to the subject.
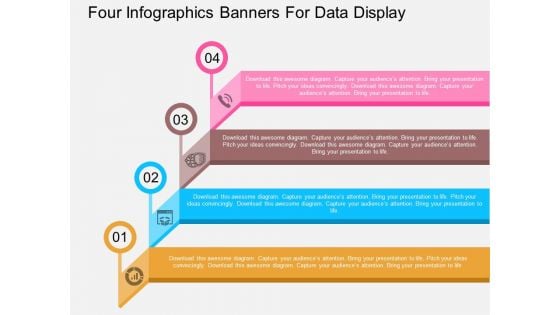
Four Infographics Banners For Data Display Powerpoint Template
Our above business slide contains diagram of four infographic banners. This PowerPoint slide may be used to exhibit business planning steps. Capture the attention of your audience with this slide.
New Marketing Channels For Product Promotion Ppt PowerPoint Presentation Infographics
This is a new marketing channels for product promotion ppt powerpoint presentation infographics. This is a one stage process. The stages in this process are business, marketing, technology, icons, media.
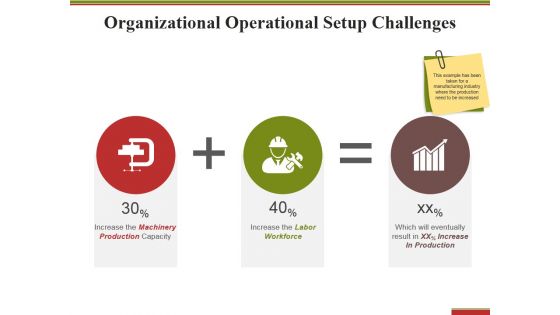
Organizational Operational Setup Challenges Ppt PowerPoint Presentation Portfolio Infographics
This is a organizational operational setup challenges ppt powerpoint presentation portfolio infographics. This is a three stage process. The stages in this process are business, finance, icons, strategy, marketing.
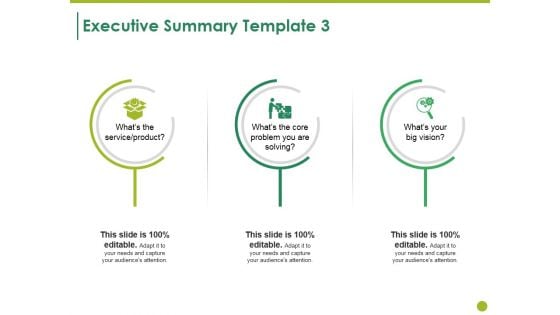
Executive Summary Template 3 Ppt PowerPoint Presentation Outline Infographics
This is a executive summary template 3 ppt powerpoint presentation outline infographics. This is a three stage process. The stages in this process are business, icons, strategy, management, marketing.
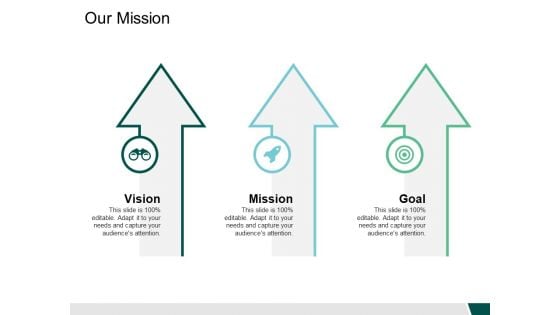
Our Mission Goal Vision Ppt PowerPoint Presentation Show Infographics
This is a our mission goal vision ppt powerpoint presentation show infographics. This is a three stage process. The stages in this process are icons, management, strategy, analysis, marketing.

Automate And Integrate Ppt PowerPoint Presentation Infographics Master Slide
Presenting this set of slides with name automate and integrate ppt powerpoint presentation infographics master slide. This is a three stage process. The stages in this process are business, icons, planning, strategy, marketing. This is a completely editable PowerPoint presentation and is available for immediate download. Download now and impress your audience.

About Us Successful Ppt PowerPoint Presentation Infographics Grid
Presenting this set of slides with name about us successful ppt powerpoint presentation infographics grid. This is a three stage process. The stages in this process are about us, professional, talented, successful, icons. This is a completely editable PowerPoint presentation and is available for immediate download. Download now and impress your audience.
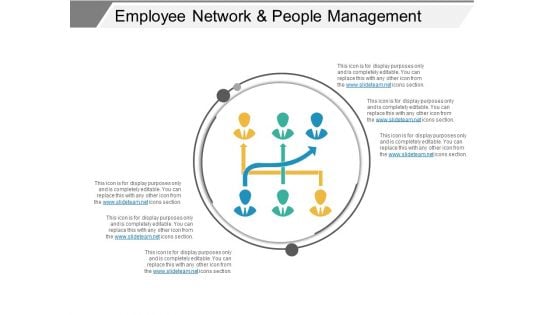
Employee Network And People Management Ppt PowerPoint Presentation Infographics Shapes
This is a employee network and people management ppt powerpoint presentation infographics shapes. This is a one stage process. The stages in this process are talent acquisition icon, human resource management icon, talent management icon, hr icon.
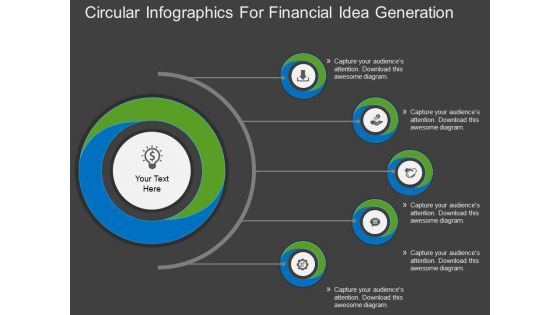
Circular Infographics For Financial Idea Generation Powerpoint Template
Our professionally designed circle diagram is as an effective tool for communicating financial ideas. It contains circle design with finance icons. Convey your views with this diagram slide. It will amplify the strength of your logic.
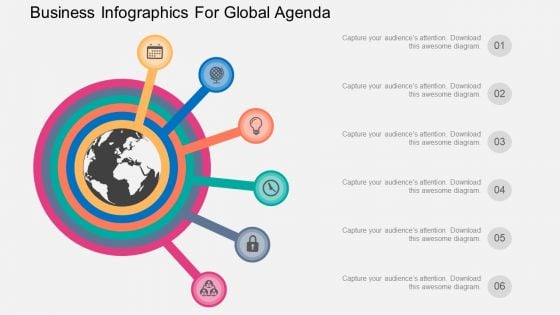
Six Staged Business Infographics For Global Agenda Powerpoint Template
Global business agenda can be defined with this business diagram. This slide depicts six spokes on globe with icons. Present your views using this innovative slide and be assured of leaving a lasting impression
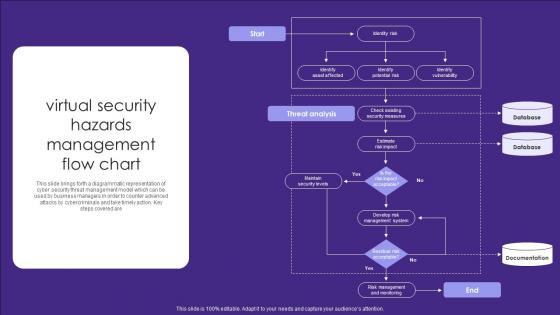
Virtual Security Hazards Management Flow Chart Infographics Pdf
This slide brings forth a diagrammatic representation of cyber security threat management model which can be used by business managers in order to counter advanced attacks by cybercriminals and take timely action. Key steps covered are Showcasing this set of slides titled Virtual Security Hazards Management Flow Chart Infographics Pdf. The topics addressed in these templates are Security Measures, Database, Documentation. All the content presented in this PPT design is completely editable. Download it and make adjustments in color, background, font etc. as per your unique business setting. This slide brings forth a diagrammatic representation of cyber security threat management model which can be used by business managers in order to counter advanced attacks by cybercriminals and take timely action. Key steps covered are
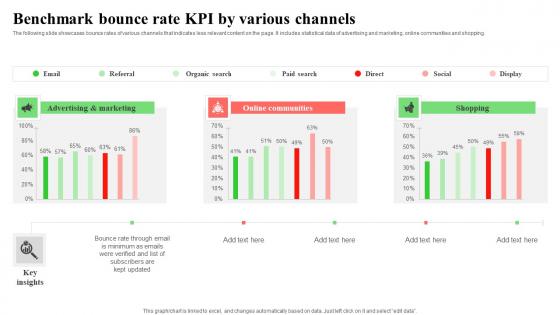
Benchmark Bounce Rate KPI By Various Channels Infographics Pdf
The following slide showcases bounce rates of various channels that indicates less relevant content on the page. It includes statistical data of advertising and marketing, online communities and shopping. Pitch your topic with ease and precision using this Benchmark Bounce Rate KPI By Various Channels Infographics Pdf. This layout presents information on Advertising,Marketing, Online Communities. It is also available for immediate download and adjustment. So, changes can be made in the color, design, graphics or any other component to create a unique layout. The following slide showcases bounce rates of various channels that indicates less relevant content on the page. It includes statistical data of advertising and marketing, online communities and shopping.
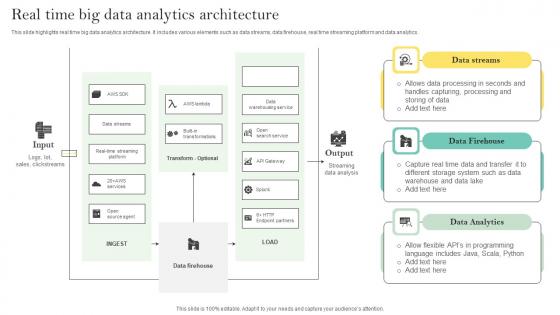
Real Time Big Data Analytics Architecture Ppt Infographics Microsoft Pdf
This slide highlights real time big data analytics architecture. It includes various elements such as data streams, data firehouse, real time streaming platform and data analytics. Showcasing this set of slides titled Real Time Big Data Analytics Architecture Ppt Infographics Microsoft Pdf. The topics addressed in these templates are Data Streams, Data Firehouse, Real Time. All the content presented in this PPT design is completely editable. Download it and make adjustments in color, background, font etc. as per your unique business setting. This slide highlights real time big data analytics architecture. It includes various elements such as data streams, data firehouse, real time streaming platform and data analytics.
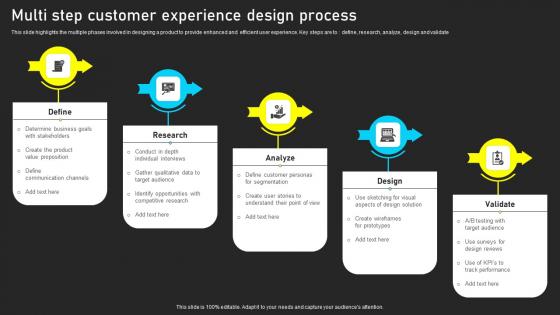
Multi Step Customer Experience Design Process Infographics Pdf
This slide highlights the multiple phases involved in designing a product to provide enhanced and efficient user experience. Key steps are to define, research, analyze, design and validate Pitch your topic with ease and precision using this Multi Step Customer Experience Design Process Infographics Pdf. This layout presents information on Define, Research, Analyze. It is also available for immediate download and adjustment. So, changes can be made in the color, design, graphics or any other component to create a unique layout. This slide highlights the multiple phases involved in designing a product to provide enhanced and efficient user experience. Key steps are to define, research, analyze, design and validate
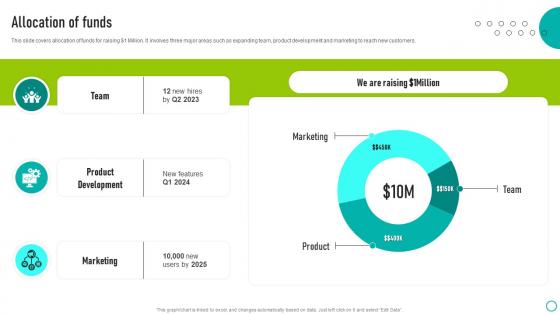
Allocation Of Funds Ovation Capital Funding Pitch Deck Infographics Pdf
This slide covers allocation of funds for raising dollar1 Million. It involves three major areas such as expanding team, product development and marketing to reach new customers. If you are looking for a format to display your unique thoughts, then the professionally designed Allocation Of Funds Ovation Capital Funding Pitch Deck Infographics Pdf is the one for you. You can use it as a Google Slides template or a PowerPoint template. Incorporate impressive visuals, symbols, images, and other charts. Modify or reorganize the text boxes as you desire. Experiment with shade schemes and font pairings. Alter, share or cooperate with other people on your work. Download Allocation Of Funds Ovation Capital Funding Pitch Deck Infographics Pdf and find out how to give a successful presentation. Present a perfect display to your team and make your presentation unforgettable. This slide covers allocation of funds for raising dollar1 Million. It involves three major areas such as expanding team, product development and marketing to reach new customers.
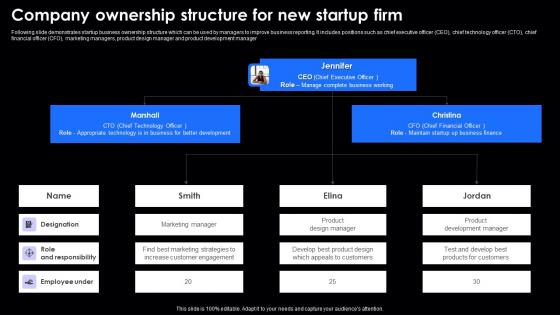
Company Ownership Structure For New Startup Firm Infographics Pdf
Following slide demonstrates startup business ownership structure which can be used by managers to improve business reporting. It includes positions such as chief executive officer CEO, chief technology officer CTO, chief financial officer CFO, marketing managers, product design manager and product development manager Pitch your topic with ease and precision using this Company Ownership Structure For New Startup Firm Infographics Pdf. This layout presents information on Role And Responsibility, Marketing Manager, Product Design Manager. It is also available for immediate download and adjustment. So, changes can be made in the color, design, graphics or any other component to create a unique layout. Following slide demonstrates startup business ownership structure which can be used by managers to improve business reporting. It includes positions such as chief executive officer CEO, chief technology officer CTO, chief financial officer CFO, marketing managers, product design manager and product development manager

KPI Dashboard For Estimating Monthly Cash Flow Infographics Pdf
Following slide demonstrates KPI dashboard to forecast monthly business money flow for cash flow management planning. It includes components such as projected profit before tax, net operating cash flow, net financial cash flow, net investing cash flow, etc. Showcasing this set of slides titled KPI Dashboard For Estimating Monthly Cash Flow Infographics Pdf. The topics addressed in these templates are KPI Dashboard, Estimating Monthly Cash Flow, Net Financial Cash Flow. All the content presented in this PPT design is completely editable. Download it and make adjustments in color, background, font etc. as per your unique business setting. Following slide demonstrates KPI dashboard to forecast monthly business money flow for cash flow management planning. It includes components such as projected profit before tax, net operating cash flow, net financial cash flow, net investing cash flow, etc.
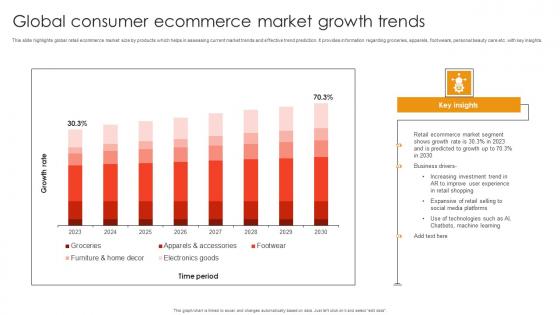
Global Consumer Ecommerce Market Growth Trends Infographics Pdf
This slide highlights global retail ecommerce market size by products which helps in assessing current market trends and effective trend prediction. It provides information regarding groceries, apparels, footwears, personal beauty care etc. with key insights. Showcasing this set of slides titled Global Consumer Ecommerce Market Growth Trends Infographics Pdf. The topics addressed in these templates are Increasing Investment Trend, Expansive Retail Selling, Use Technologies Such. All the content presented in this PPT design is completely editable. Download it and make adjustments in color, background, font etc. as per your unique business setting. This slide highlights global retail ecommerce market size by products which helps in assessing current market trends and effective trend prediction. It provides information regarding groceries, apparels, footwears, personal beauty care etc. with key insights.

Data Research And Analytics Ppt PowerPoint Presentation Infographics Examples
This is a data research and analytics ppt powerpoint presentation infographics examples. This is a one stage process. The stages in this process are metrics icon, kpis icon, statistics icon.
Business Diagram Four Staged Business Infographics Tags Presentation Template
Download this diagram to display business development strategies, business plans, decisions, and stages. This Business PowerPoint diagram contains graphics of four options text boxes with icons. Present your views using this innovative slide and be assured of leaving a lasting impression.
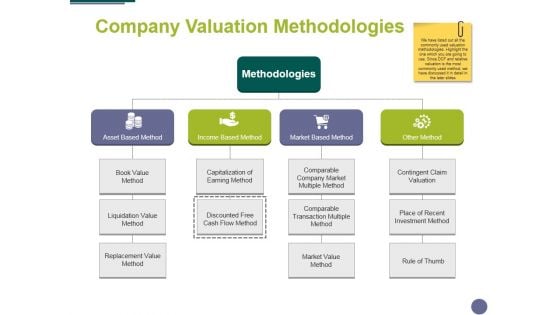
Company Valuation Methodologies Ppt PowerPoint Presentation Infographics Elements
This is a company valuation methodologies ppt powerpoint presentation infographics elements. This is a four stage process. The stages in this process are business, management, icon, marketing, strategy.
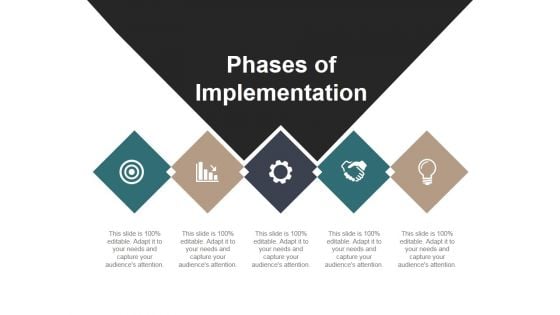
Phases Of Implementation Ppt PowerPoint Presentation Infographics Graphics Example
This is a phases of implementation ppt powerpoint presentation infographics graphics example. This is a five stage process. The stages in this process are icon, shapes, business, marketing, strategy.
Our Services Template 3 Ppt PowerPoint Presentation Infographics Inspiration
This is a our services template 3 ppt powerpoint presentation infographics inspiration. This is a four stage process. The stages in this process are icon, business, management, strategy, person.
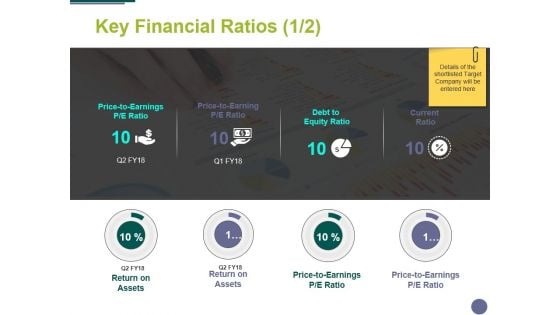
Key Financial Ratios Template 1 Ppt PowerPoint Presentation Infographics Shapes
This is a key financial ratios template 1 ppt powerpoint presentation infographics shapes. This is a four stage process. The stages in this process are business, marketing, analysis, finance, icon.
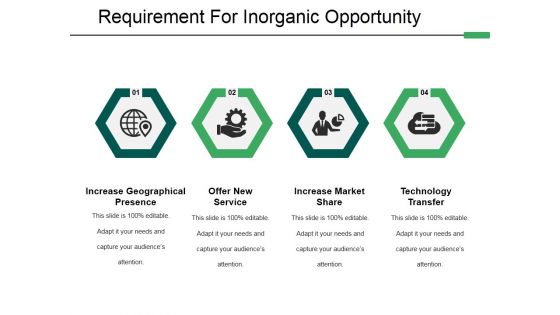
Requirement For Inorganic Opportunity Ppt PowerPoint Presentation Infographics Designs
This is a requirement for inorganic opportunity ppt powerpoint presentation infographics designs. This is a four stage process. The stages in this process are icon, business, strategy, marketing, management.
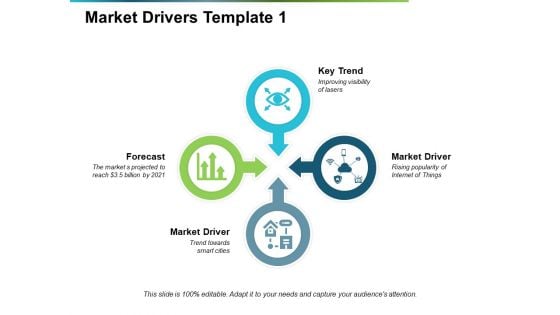
Market Drivers Key Trend Ppt PowerPoint Presentation Infographics Brochure
This is a market drivers key trend ppt powerpoint presentation infographics brochure. This is a four stage process. The stages in this process are key trend, forecast, market driver, icon, strategy.
Illustration Of Business Briefcase Ppt PowerPoint Presentation Infographics Slide Download
Presenting this set of slides with name illustration of business briefcase ppt powerpoint presentation infographics slide download. The topics discussed in these slides are business, teamwork, corporate icon. This is a completely editable PowerPoint presentation and is available for immediate download. Download now and impress your audience.
Electricity Tower Infrastructure Development Ppt PowerPoint Presentation Infographics Layouts
Presenting this set of slides with name electricity tower infrastructure development ppt powerpoint presentation infographics layouts. This is a four stage process. The stages in this process are infrastructure icon, infrastructure development, maintenance. This is a completely editable PowerPoint presentation and is available for immediate download. Download now and impress your audience.
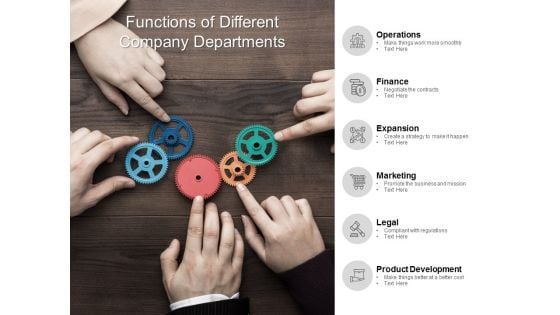
Functions Of Different Company Departments Ppt PowerPoint Presentation Infographics Deck
Presenting this set of slides with name functions of different company departments ppt powerpoint presentation infographics deck. This is a six stage process. The stages in this process are role description icon, role description steps, corporate relationship. This is a completely editable PowerPoint presentation and is available for immediate download. Download now and impress your audience.

Water Flow On Blue Background Ppt PowerPoint Presentation Infographics Sample
Presenting this set of slides with name water flow on blue background ppt powerpoint presentation infographics sample. The topics discussed in these slides are water flow, vector icon, droplets. This is a completely editable PowerPoint presentation and is available for immediate download. Download now and impress your audience.
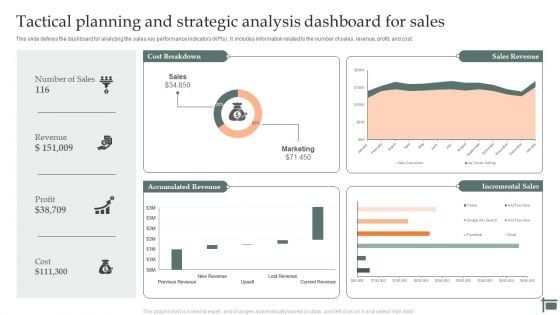
Tactical Planning And Strategic Analysis Dashboard For Sales Infographics PDF
Persuade your audience using this Tactical Planning And Strategic Analysis Dashboard For Sales Infographics PDF. This PPT design covers three stages, thus making it a great tool to use. It also caters to a variety of topics including Tactical, Planning And Analyzing, Organizational Goals, Icon. Download this PPT design now to present a convincing pitch that not only emphasizes the topic but also showcases your presentation skills.
Team Development Phases Ppt Powerpoint Presentation Infographics Inspiration Cpb
This is a team development phases ppt powerpoint presentation infographics inspiration cpb. This is a four stage process. The stages in this process are team development phases.
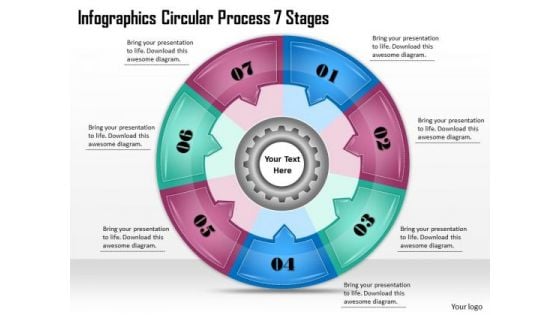
Timeline Ppt Template Infographics Circular Process 7 Stages
Our Timeline Ppt Template Infographics Circular Process 7 Stages Powerpoint Templates Enjoy Drama. They Provide Entertaining Backdrops.
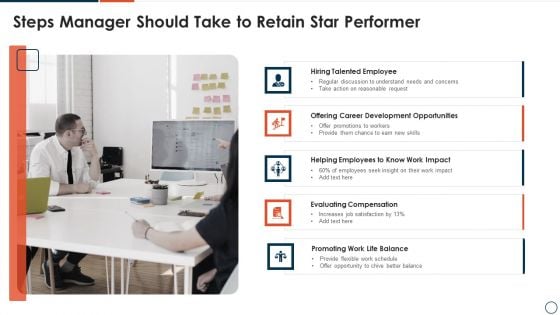
Steps Manager Should Take To Retain Star Performer Infographics PDF
Presenting steps manager should take to retain star performer infographics pdf to dispense important information. This template comprises five stages. It also presents valuable insights into the topics including hiring talented employee, evaluating compensation, promoting work life balance. This is a completely customizable PowerPoint theme that can be put to use immediately. So, download it and address the topic impactfully.
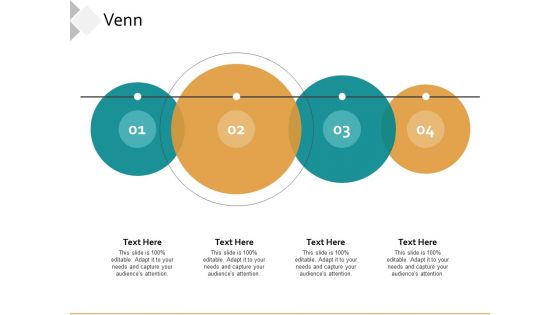
Venn Business Ppt PowerPoint Presentation Infographics Graphics Pictures
This is a venn business ppt powerpoint presentation infographics graphics pictures. This is a four stage process. The stages in this process are business, management, marketing, venn.
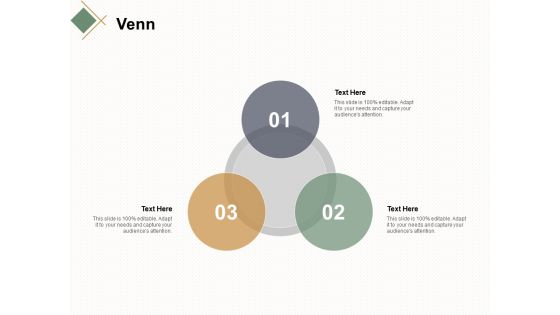
Venn Sales Marketing Ppt Powerpoint Presentation Infographics Styles
This is a venn sales marketing ppt powerpoint presentation infographics styles. This is a three stage process. The stages in this process are business, management, planning, marketing.
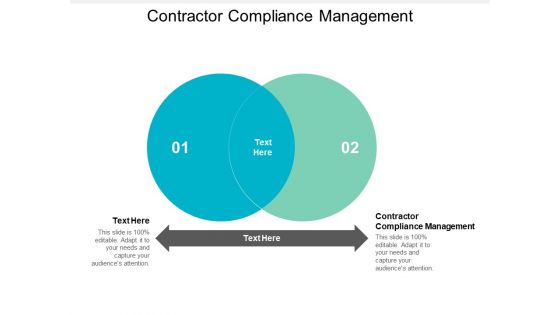
Contractor Compliance Management Ppt PowerPoint Presentation Infographics Guidelines Cpb
This is a contractor compliance management ppt powerpoint presentation infographics guidelines cpb. This is a two stage process. The stages in this process are contractor compliance management.
Venn Management Planning Ppt PowerPoint Presentation Infographics Brochure
This is a venn management planning ppt powerpoint presentation infographics brochure. This is a four stage process. The stages in this process are business, management, marketing, venn.
Digital Media Placement Ppt PowerPoint Presentation Infographics Images Cpb
This is a digital media placement ppt powerpoint presentation infographics images cpb. This is a three stage process. The stages in this process are digital media placement.
Venn Business Management Ppt PowerPoint Presentation Infographics Display
This is a venn business management ppt powerpoint presentation infographics display. This is a four stage process. The stages in this process are business, marketing, management, venn.
Consumer Satisfaction Ppt PowerPoint Presentation Infographics Images Cpb
This is a consumer satisfaction ppt powerpoint presentation infographics images cpb. This is a three stage process. The stages in this process are consumer satisfaction.
Star Performer Post It Notes Ppt Infographics Topics PDF
Presenting this set of slides with name star performer post it notes ppt infographics topics pdf. This is a three stage process. The stages in this process are post it notes. This is a completely editable PowerPoint presentation and is available for immediate download. Download now and impress your audience.

Star Employee About Us Ppt Infographics Outline PDF
Presenting this set of slides with name star employee about us ppt infographics outline pdf. This is a three stage process. The stages in this process are preferred by many, value client, target audiences. This is a completely editable PowerPoint presentation and is available for immediate download. Download now and impress your audience.
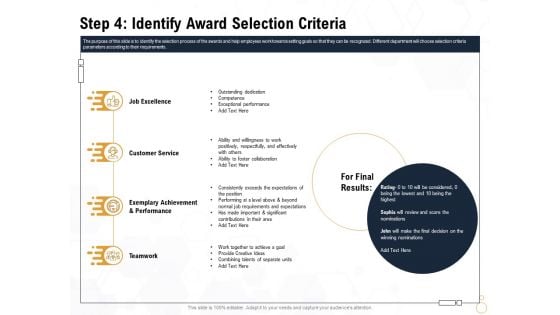
Star Employee Step 4 Identify Award Selection Criteria Infographics PDF
Presenting this set of slides with name star employee step 4 identify award selection criteria infographics pdf. This is a four stage process. The stages in this process are job excellence, customer service, teamwork, exemplary achievement and performance. This is a completely editable PowerPoint presentation and is available for immediate download. Download now and impress your audience.
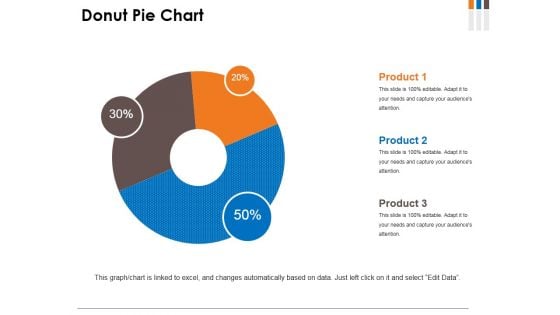
Donut Pie Chart Ppt PowerPoint Presentation Infographics Model
This is a donut pie chart ppt powerpoint presentation infographics model. This is a three stage process. The stages in this process are donut, business, marketing, percentage, finance.
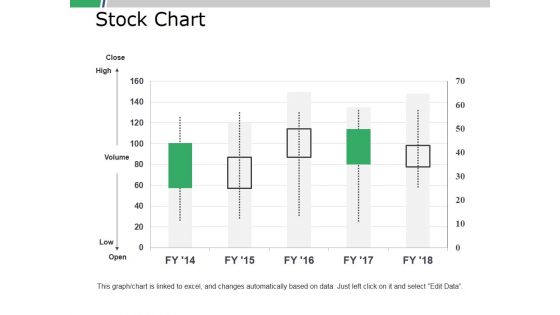
Stock Chart Ppt PowerPoint Presentation Infographics Example Introduction
This is a stock chart ppt powerpoint presentation infographics example introduction. This is a five stage process. The stages in this process are business, marketing, strategy, planning, finance.
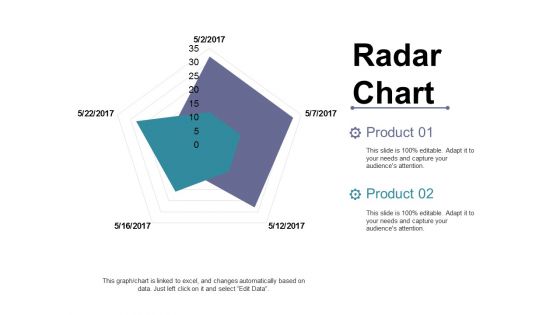
Radar Chart Ppt PowerPoint Presentation Infographics Graphic Tips
This is a radar chart ppt powerpoint presentation infographics graphic tips. This is a two stage process. The stages in this process are business, marketing, strategy, planning, finance.
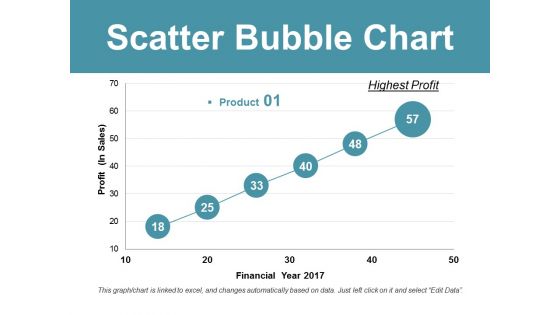
Scatter Bubble Chart Ppt PowerPoint Presentation Infographics Good
This is a scatter bubble chart ppt powerpoint presentation infographics good. This is a two stage process. The stages in this process are business, marketing, strategy, planning, finance.
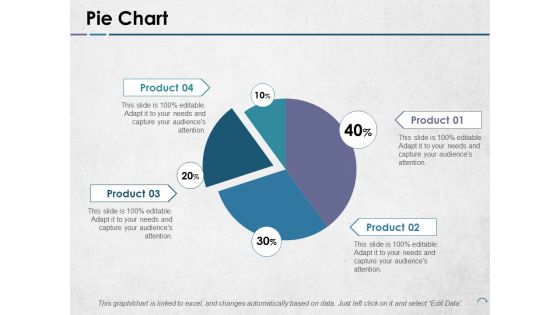
Pie Chart Ppt PowerPoint Presentation Infographics Example Topics
This is a pie chart ppt powerpoint presentation infographics example topics. This is a four stage process. The stages in this process are product, pie, process, percentage, finance.
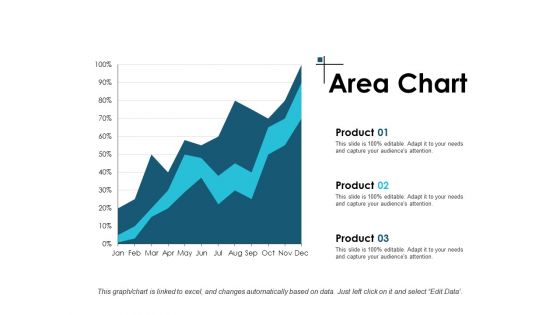
Area Chart Investment Ppt PowerPoint Presentation Infographics Summary
This is a area chart investment ppt powerpoint presentation infographics summary. This is a three stage process. The stages in this process are finance, marketing, management, investment, analysis.
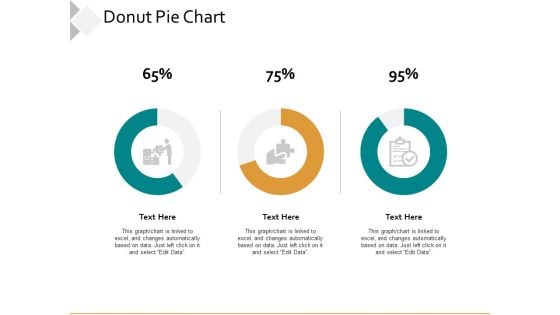
Donut Pie Chart Ppt PowerPoint Presentation Infographics Examples
This is a donut pie chart ppt powerpoint presentation infographics examples. This is a three stage process. The stages in this process are business, management, marketing, financial.
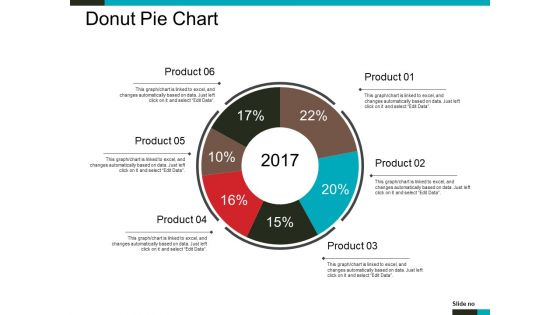
Donut Pie Chart Ppt PowerPoint Presentation Infographics Styles
This is a donut pie chart ppt powerpoint presentation infographics styles. This is a six stage process. The stages in this process are chart, percentage, years, business, management.
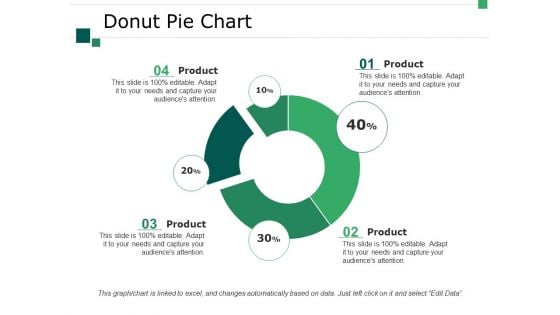
Donut Pie Chart Ppt PowerPoint Presentation Infographics Summary
This is a donut pie chart ppt powerpoint presentation infographics summary. This is a four stage process. The stages in this process are business, marketing, chart, percentage, process.
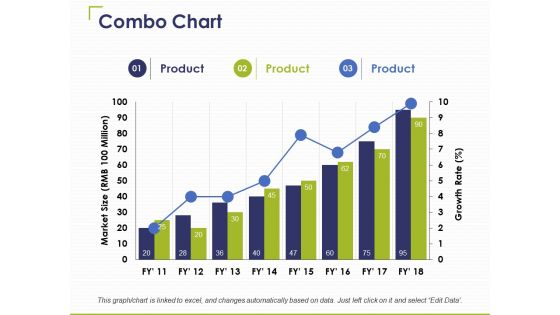
Combo Chart Ppt PowerPoint Presentation Infographics Graphics Pictures
This is a combo chart ppt powerpoint presentation infographics graphics pictures. This is a three stage process. The stages in this process are product, business, marketing, combo chart.
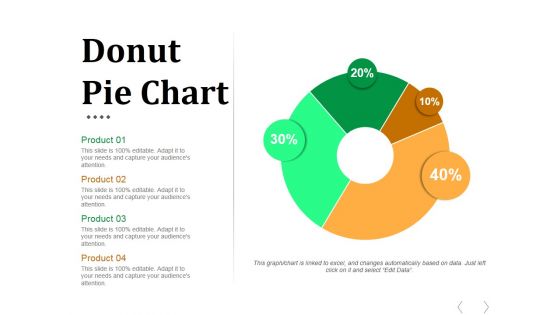
Donut Pie Chart Ppt PowerPoint Presentation Infographics Graphics
This is a donut pie chart ppt powerpoint presentation infographics graphics. This is a four stage process. The stages in this process are business, marketing, donut, finance, management.
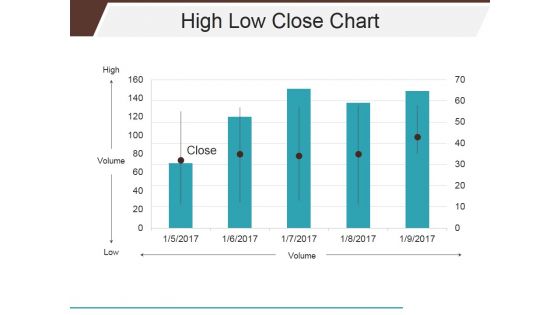
High Low Close Chart Ppt PowerPoint Presentation Infographics Shapes
This is a high low close chart ppt powerpoint presentation infographics shapes. This is a five stage process. The stages in this process are close, volume, high, low.

Donut Pie Chart Ppt PowerPoint Presentation Infographics Images
This is a donut pie chart ppt powerpoint presentation infographics images. This is a seven stage process. The stages in this process are product, year, pie, process, business.
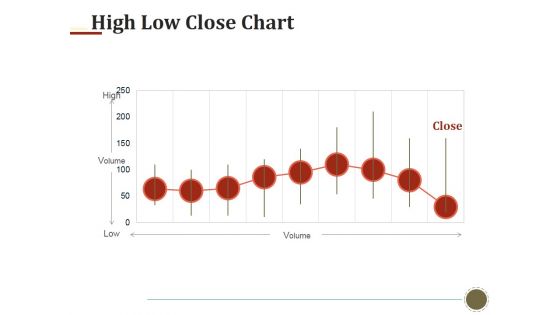
High Low Close Chart Ppt PowerPoint Presentation Infographics Templates
This is a high low close chart ppt powerpoint presentation infographics templates. This is a nine stage process. The stages in this process are high, volume, low, close.
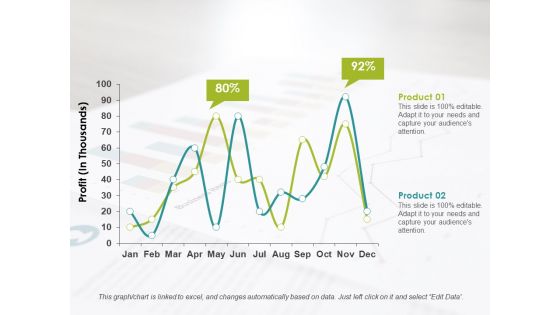
Line Chart Ppt PowerPoint Presentation Infographics Format Ideas
This is a line chart ppt powerpoint presentation infographics format ideas. This is a two stage process. The stages in this process are product, profit, business.
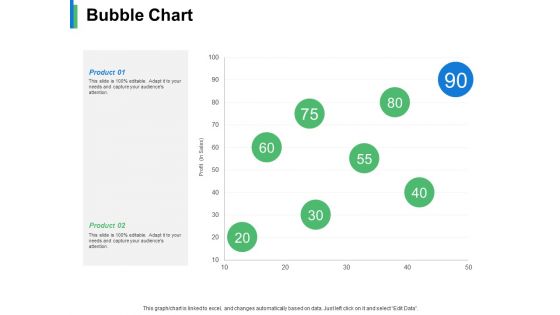
Bubble Chart Product Ppt PowerPoint Presentation Infographics Backgrounds
This is a bubble chart product ppt powerpoint presentation infographics backgrounds. This is a two stage process. The stages in this process are business, management, strategy, marketing, sales.
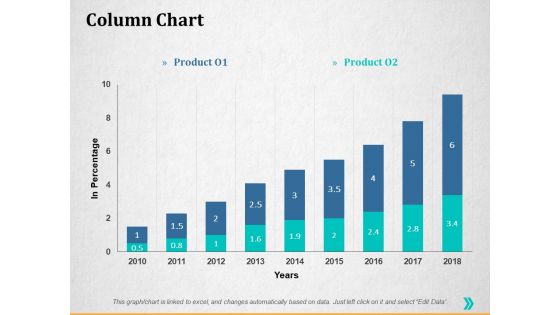
Column Chart Ppt PowerPoint Presentation Infographics Graphics Template
This is a column chart ppt powerpoint presentation infographics graphics template. This is a two stage process. The stages in this process are percentage, product, business, management, marketing.
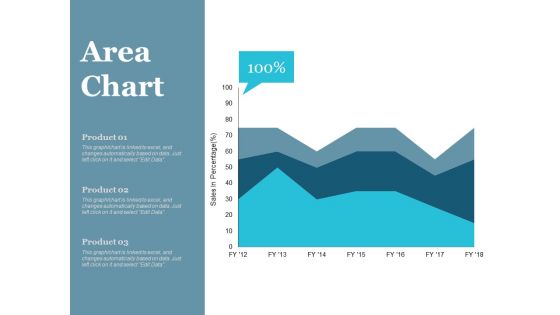
Area Chart Finance Ppt PowerPoint Presentation Infographics Deck
This is a area chart finance ppt powerpoint presentation infographics deck. This is a three stage process. The stages in this process are finance, marketing, management, investment, analysis.
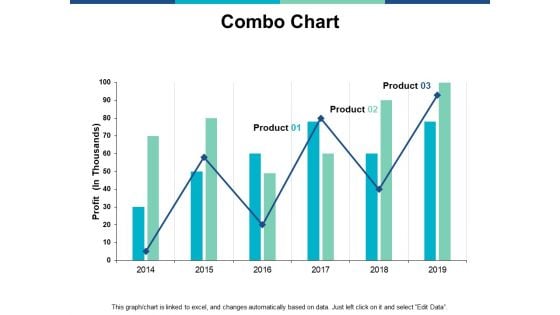
Combo Chart Graph Ppt PowerPoint Presentation Infographics Guide
This is a combo chart graph ppt powerpoint presentation infographics guide. This is a two stage process. The stages in this process are marketing, business, management, planning, strategy.
Three Stages Circle Infographics Layout Ppt PowerPoint Presentation File Visuals
Presenting this set of slides with name three stages circle infographics layout ppt powerpoint presentation file visuals. This is a three stage process. The stages in this process are 3 step circle diagram, process infographic, business goals. This is a completely editable PowerPoint presentation and is available for immediate download. Download now and impress your audience.
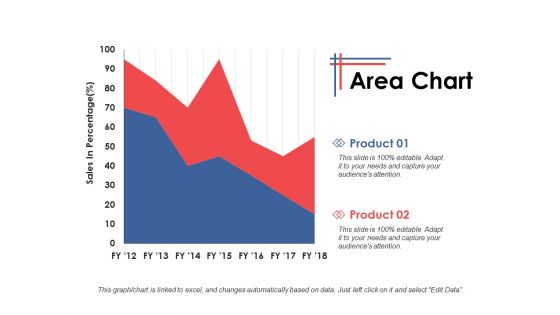
Area Chart Growth Strategy Ppt PowerPoint Presentation Infographics Themes
This is a area chart growth strategy ppt powerpoint presentation infographics themes. This is a two stage process. The stages in this process are finance, marketing, management, investment, analysis.

Artificial Intelligence Development Phases Ppt PowerPoint Presentation Infographics Good
This is a artificial intelligence development phases ppt powerpoint presentation infographics good. This is a three stage process. The stages in this process are artificial, intelligence, development, phases, planning.
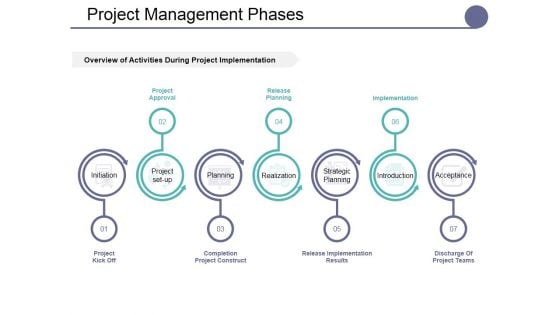
Project Management Phases Ppt PowerPoint Presentation Infographics Brochure
This is a project management phases ppt powerpoint presentation infographics brochure. This is a seven stage process. The stages in this process are initiation, project, set up, planning, realization, strategic planning.
Business Disaster Ppt PowerPoint Presentation Infographics Themes Cpb
This is a business disaster ppt powerpoint presentation infographics themes cpb. This is a seven stage process. The stages in this process are business disaster.
Change Management Programs Ppt PowerPoint Presentation Infographics Themes Cpb
This is a change management programs ppt powerpoint presentation infographics themes cpb. This is a three stage process. The stages in this process are change management programs.
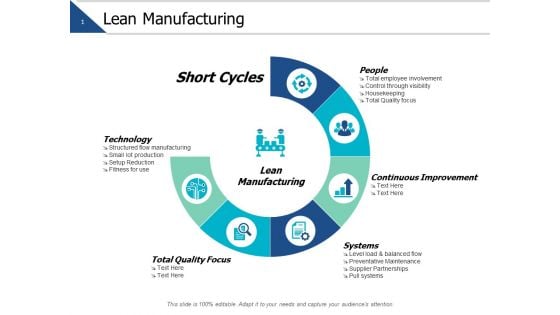
Lean Manufacturing Management Ppt PowerPoint Presentation Infographics Themes
This is a lean manufacturing management ppt powerpoint presentation infographics themes. This is a five stage process. The stages in this process are marketing, business, management, planning, strategy.
Omnichannel Marketing Strategy Ppt PowerPoint Presentation Infographics Themes Cpb
This is a omnichannel marketing strategy ppt powerpoint presentation infographics themes cpb. This is a four stage process. The stages in this process are omnichannel marketing strategy.
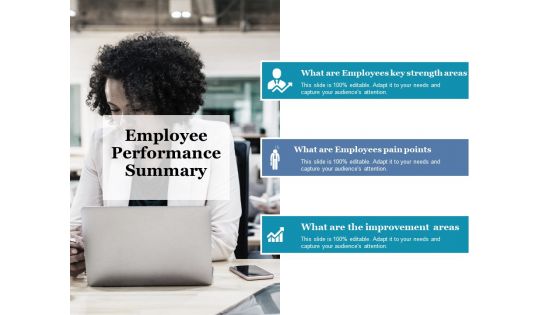
Employee Performance Summary Ppt PowerPoint Presentation Infographics Diagrams
This is a employee performance summary ppt powerpoint presentation infographics diagrams. This is a three stage process. The stages in this process are employee, performance, summary, strength, improvement.
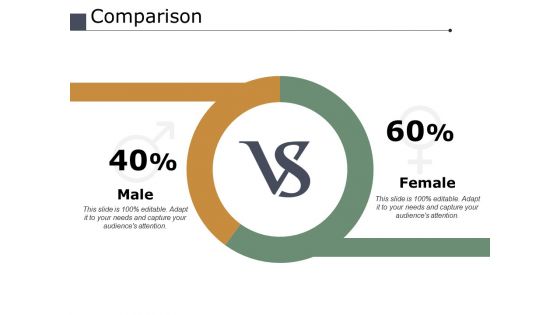
Comparison Male Female Ppt PowerPoint Presentation Infographics Diagrams
This is a comparison male female ppt powerpoint presentation infographics diagrams. This is a two stage process. The stages in this process are comparison, male, female, marketing, management.
Review Management Tools Ppt PowerPoint Presentation Infographics Diagrams Cpb
This is a review management tools ppt powerpoint presentation infographics diagrams cpb. This is a two stage process. The stages in this process are review management tools.
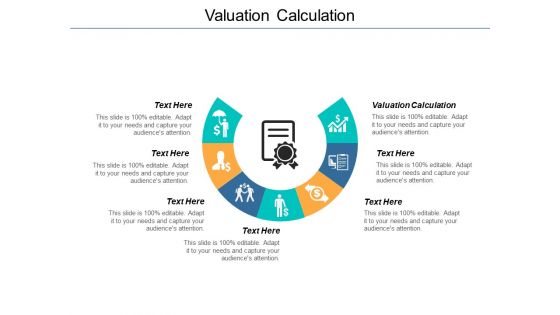
Valuation Calculation Ppt PowerPoint Presentation Infographics Diagrams Cpb
This is a valuation calculation ppt powerpoint presentation infographics diagrams cpb. This is a seven stage process. The stages in this process are valuation calculation.
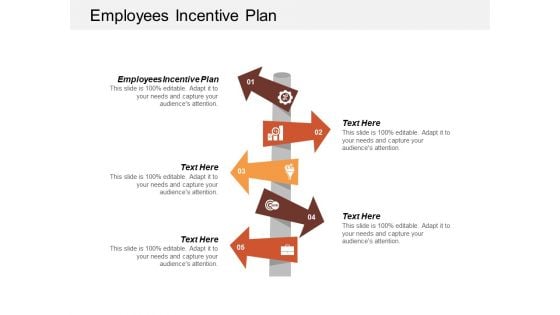
Employees Incentive Plan Ppt Powerpoint Presentation Infographics Diagrams Cpb
This is a employees incentive plan ppt powerpoint presentation infographics diagrams cpb. This is a five stage process. The stages in this process are employees incentive plan.
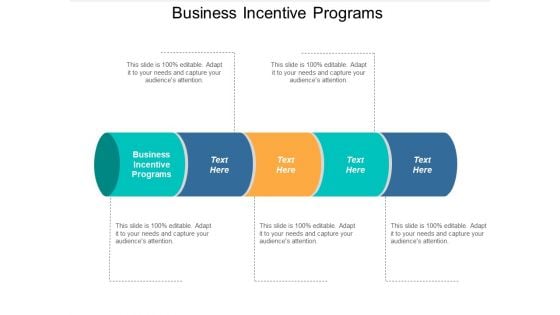
Business Incentive Programs Ppt Powerpoint Presentation Infographics Diagrams Cpb
This is a business incentive programs ppt powerpoint presentation infographics diagrams cpb. This is a five stage process. The stages in this process are business incentive programs.
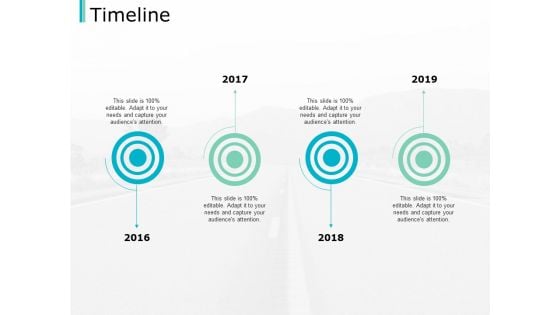
Timeline Process Roadmap Ppt PowerPoint Presentation Infographics Diagrams
This is a timeline process roadmap ppt powerpoint presentation infographics diagrams. This is a four stage process. The stages in this process are timeline, process, management, planning, business.
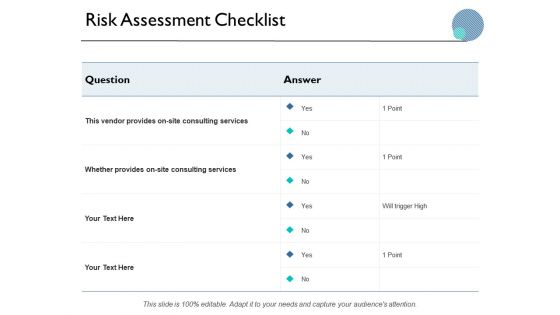
Risk Assessment Checklist Ppt PowerPoint Presentation Infographics Diagrams
This is a risk assessment checklist ppt powerpoint presentation infographics diagrams. This is a two stage process. The stages in this process are marketing, business, management, compare.
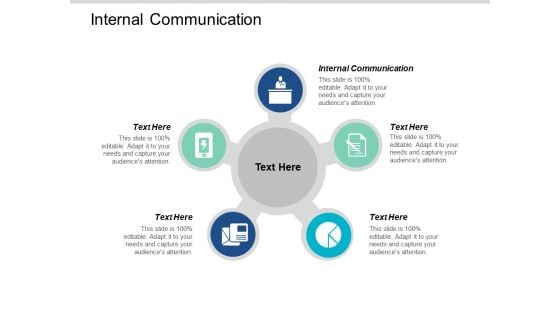
Internal Communication Ppt PowerPoint Presentation Infographics Diagrams Cpb
This is a internal communication ppt powerpoint presentation infographics diagrams cpb. This is a five stage process. The stages in this process are internal communication.
Business Quality Management Ppt PowerPoint Presentation Infographics Diagrams Cpb
This is a business quality management ppt powerpoint presentation infographics diagrams cpb. This is a four stage process. The stages in this process are business quality management.
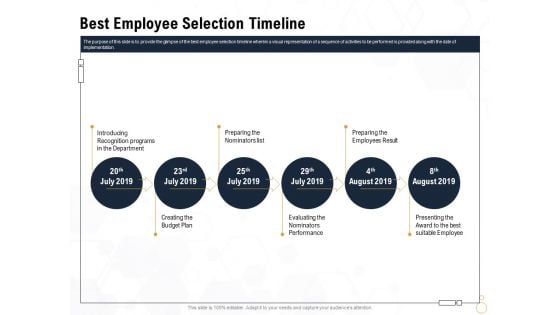
Star Employee Best Employee Selection Timeline Ppt Model Infographics PDF
Presenting this set of slides with name star employee best employee selection timeline ppt model infographics pdf. This is a six stage process. The stages in this process are introducing recognition programs in the department, preparing the nominators list, creating the budget plan, evaluating the nominators performance. This is a completely editable PowerPoint presentation and is available for immediate download. Download now and impress your audience.
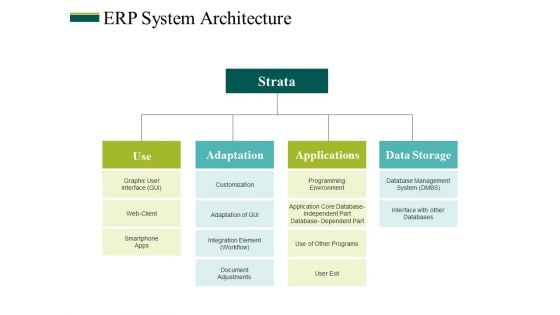
Erp System Architecture Ppt PowerPoint Presentation Infographics Ideas
This is a erp system architecture ppt powerpoint presentation infographics ideas. This is a four stage process. The stages in this process are use, adaptation, applications, data storage.
Partner Agreement Ppt PowerPoint Presentation Infographics Background Images Cpb
This is a partner agreement ppt powerpoint presentation infographics background images cpb. This is a three stage process. The stages in this process are partner agreement.
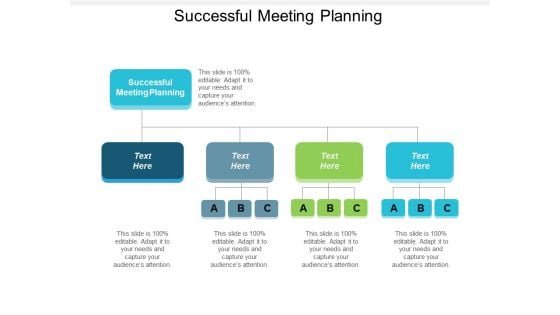
Successful Meeting Planning Ppt PowerPoint Presentation Portfolio Infographics Cpb
This is a successful meeting planning ppt powerpoint presentation portfolio infographics cpb. This is a four stage process. The stages in this process are successful meeting planning.
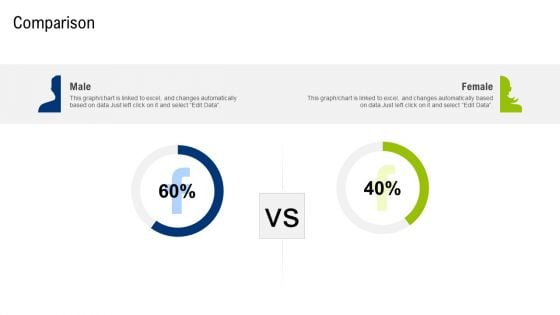
Multiple Phases For Supply Chain Management Comparison Infographics PDF
Deliver an awe inspiring pitch with this creative multiple phases for supply chain management comparison infographics pdf bundle. Topics like male, female can be discussed with this completely editable template. It is available for immediate download depending on the needs and requirements of the user.
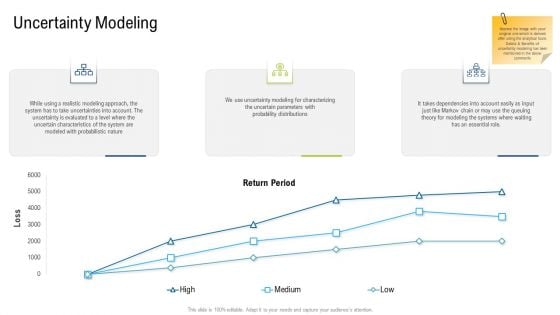
Multiple Phases For Supply Chain Management Uncertainty Modeling Infographics PDF
Deliver and pitch your topic in the best possible manner with this multiple phases for supply chain management uncertainty modeling infographics pdf. Use them to share invaluable insights on return period, systems, uncertainty modeling and impress your audience. This template can be altered and modified as per your expectations. So, grab it now.
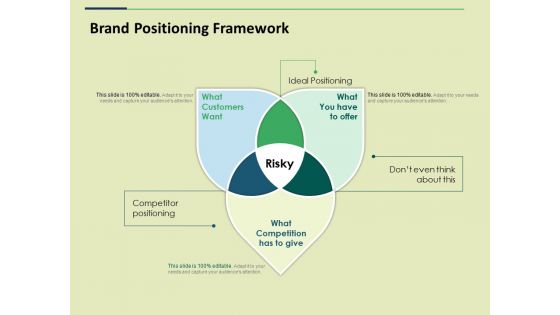
Brand Positioning Framework Ppt PowerPoint Presentation Infographics Deck
This is a brand positioning framework ppt powerpoint presentation infographics deck. This is a one stage process. The stages in this process are what customers want, what you have to offer, what competition has to give, risky, competitor positioning.

Employee Assessment Review Chart Ppt PowerPoint Presentation Infographics Graphics
This is a employee assessment review chart ppt powerpoint presentation infographics graphics. The topics discussed in this diagram are business, management, marketing. This is a completely editable PowerPoint presentation, and is available for immediate download.
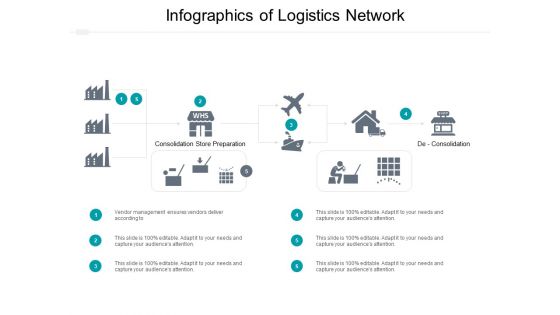
Infographics Of Logistics Network Ppt PowerPoint Presentation Show Diagrams
Presenting this set of slides with name infographics of logistics network ppt powerpoint presentation show diagrams. The topics discussed in these slides are supply chain infographics, logistics management, product distribution management. This is a completely editable PowerPoint presentation and is available for immediate download. Download now and impress your audience.
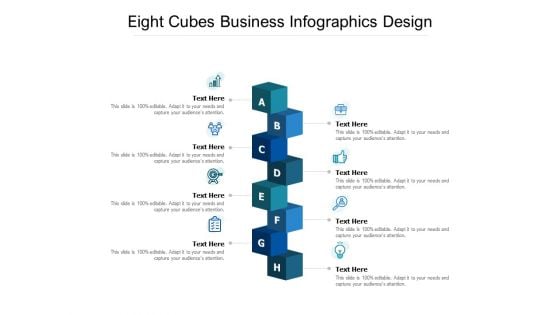
Eight Cubes Business Infographics Design Ppt PowerPoint Presentation Outline Diagrams
Presenting this set of slides with name eight cubes business infographics design ppt powerpoint presentation outline diagrams. This is a eight stage process. The stages in this process are eight cubes business infographics design. This is a completely editable PowerPoint presentation and is available for immediate download. Download now and impress your audience.
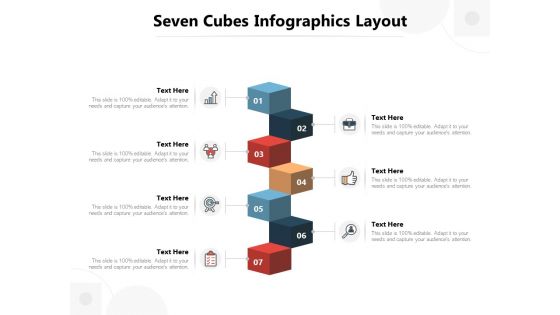
Seven Cubes Infographics Layout Ppt PowerPoint Presentation Summary Diagrams
Presenting this set of slides with name seven cubes infographics layout ppt powerpoint presentation summary diagrams. This is a seven stage process. The stages in this process are seven cubes infographics layout. This is a completely editable PowerPoint presentation and is available for immediate download. Download now and impress your audience.
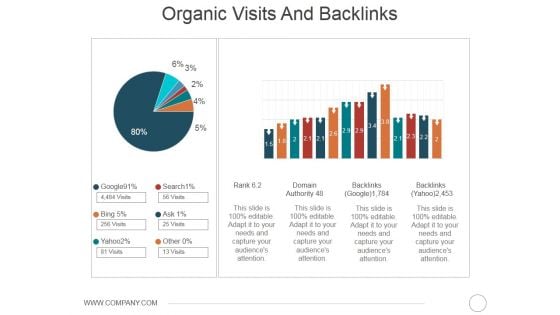
Organic Visits And Backlinks Ppt PowerPoint Presentation Infographics Slideshow
This is a organic visits and backlinks ppt powerpoint presentation infographics slideshow. This is a two stage process. The stages in this process are rank, domain authority, backlinks.
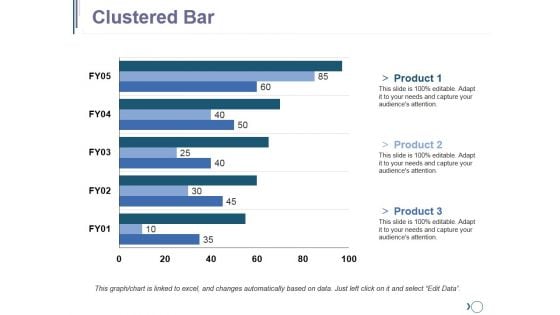
Clustered Bar Ppt PowerPoint Presentation Infographics Example File
This is a clustered bar ppt powerpoint presentation infographics example file. This is a five stage process. The stages in this process are business, marketing, strategy, planning, finance.
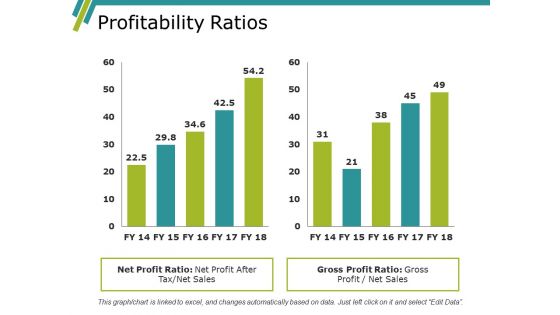
Profitability Ratios Ppt PowerPoint Presentation Infographics Design Templates
This is a profitability ratios ppt powerpoint presentation infographics design templates. This is a two stage process. The stages in this process are finance, marketing, strategy, management, planning.
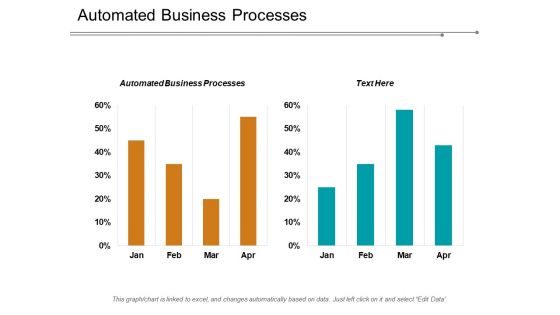
Automated Business Processes Ppt PowerPoint Presentation Infographics Images Cpb
This is a automated business processes ppt powerpoint presentation infographics images cpb. This is a two stage process. The stages in this process are automated business processes.
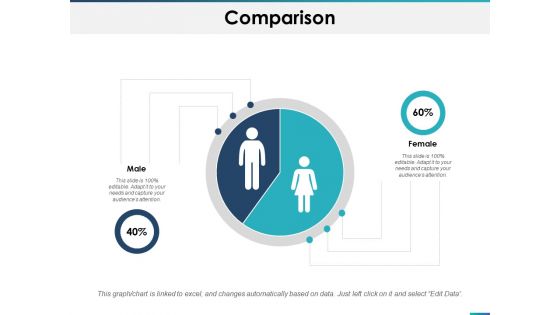
Comparison Male Female Ppt PowerPoint Presentation Infographics Files
This is a comparison male female ppt powerpoint presentation infographics files. This is a two stage process. The stages in this process are comparison, male, female, marketing, management.
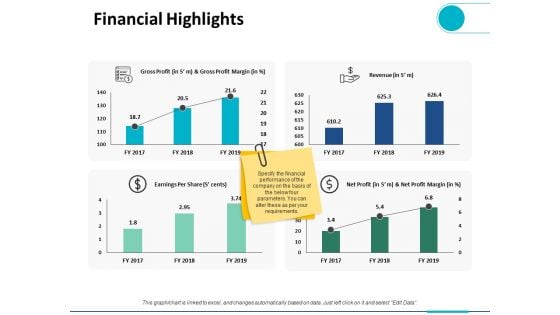
Financial Highlights Ppt PowerPoint Presentation Infographics Slide Portrait
This is a financial highlights ppt powerpoint presentation infographics slide portrait. This is a four stage process. The stages in this process are finance, analysis, business, investment, marketing.
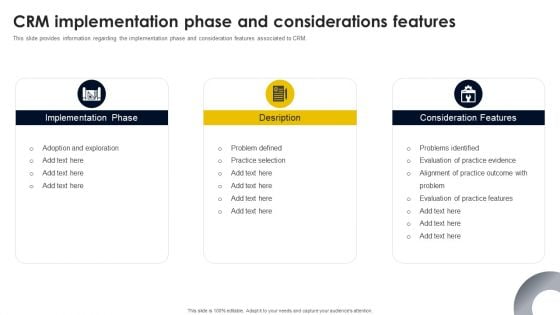
CRM Implementation Phase And Considerations Features Infographics PDF
This slide provides information regarding the implementation phase and consideration features associated to CRM. Whether you have daily or monthly meetings, a brilliant presentation is necessary. CRM Implementation Phase And Considerations Features Infographics PDF can be your best option for delivering a presentation. Represent everything in detail using CRM Implementation Phase And Considerations Features Infographics PDF and make yourself stand out in meetings. The template is versatile and follows a structure that will cater to your requirements. All the templates prepared by Slidegeeks are easy to download and edit. Our research experts have taken care of the corporate themes as well. So, give it a try and see the results.
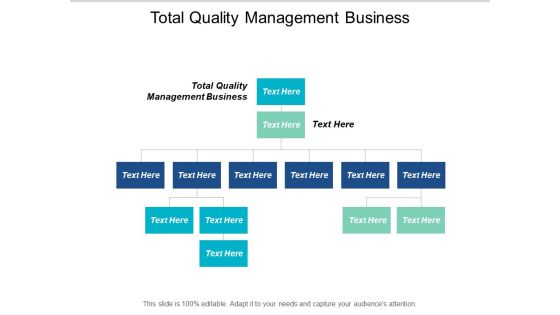
Total Quality Management Business Ppt PowerPoint Presentation Infographics Diagrams Cpb
This is a total quality management business ppt powerpoint presentation infographics diagrams cpb. This is a three stage process. The stages in this process are total quality management business.
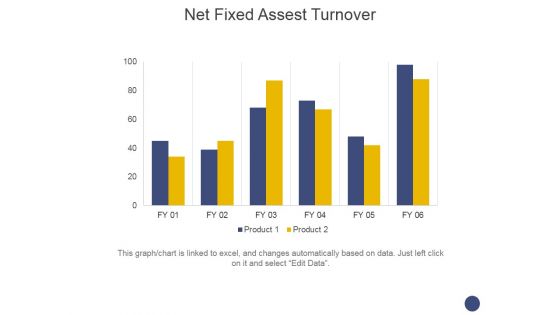
Net Fixed Assest Turnover Ppt PowerPoint Presentation Infographics Themes
This is a net fixed assest turnover ppt powerpoint presentation infographics themes. This is a two stage process. The stages in this process are turnover, business, marketing, management, finance.
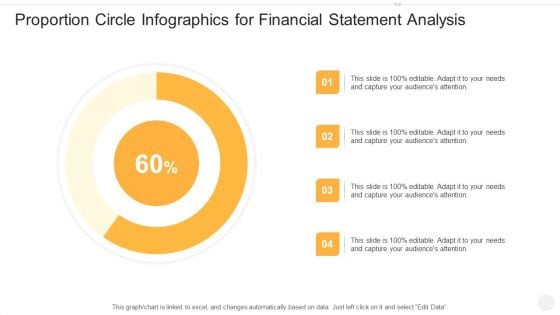
Proportion Circle Infographics For Financial Statement Analysis Mockup PDF
Pitch your topic with ease and precision using this proportion circle infographics for financial statement analysis mockup pdf. This layout presents information on proportion circle infographics for financial statement analysis. It is also available for immediate download and adjustment. So, changes can be made in the color, design, graphics or any other component to create a unique layout.
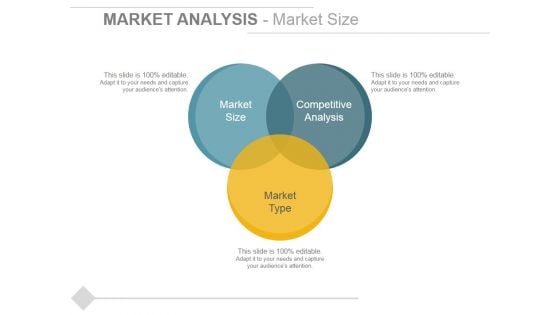
Market Analysis Market Size Ppt PowerPoint Presentation Infographics Structure
This is a market analysis market size ppt powerpoint presentation infographics structure. This is a three stage process. The stages in this process are market size, market type, competitive analysis.
Product Marketing Sales Enablement Ppt PowerPoint Presentation Infographics Format Cpb
This is a product marketing sales enablement ppt powerpoint presentation infographics format cpb. This is a three stage process. The stages in this process are product marketing sales enablement.

Organizations Departments Structure Chart Ppt PowerPoint Presentation Infographics Slide Portrait
This is a organizations departments structure chart ppt powerpoint presentation infographics slide portrait. This is a six stage process. The stages in this process are flow chart, org chart, hierarchy chart.

Radar Chart Template 1 Ppt PowerPoint Presentation Infographics Designs
This is a radar chart template 1 ppt powerpoint presentation infographics designs. This is a two stage process. The stages in this process are business, strategy, analysis, pretention, radar chart.
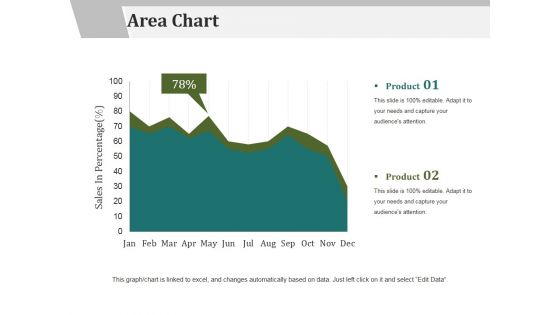
Area Chart Ppt PowerPoint Presentation Infographics Graphics Tutorials
This is a area chart ppt powerpoint presentation infographics graphics tutorials. This is a two stage process. The stages in this process are product, area chart, sales in percentage.
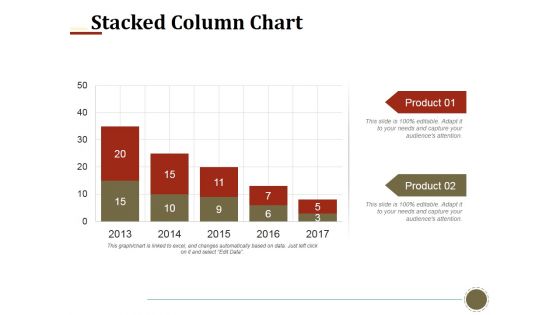
Stacked Column Chart Ppt PowerPoint Presentation Infographics Smartart
This is a stacked column chart ppt powerpoint presentation infographics smartart. This is a two stage process. The stages in this process are stacked column chart, business, finance, marketing, strategy.
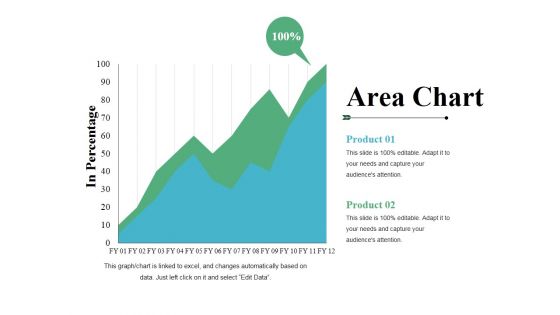
Area Chart Ppt PowerPoint Presentation Infographics Visual Aids
This is a area chart ppt powerpoint presentation infographics visual aids. This is a two stage process. The stages in this process are product, area chart, in percentage, growth, success.
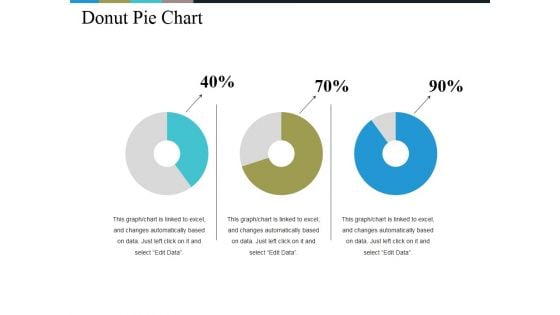
Donut Pie Chart Ppt PowerPoint Presentation Infographics Background Images
This is a donut pie chart ppt powerpoint presentation infographics background images. This is a three stage process. The stages in this process are chart, percentage, business, management, process.
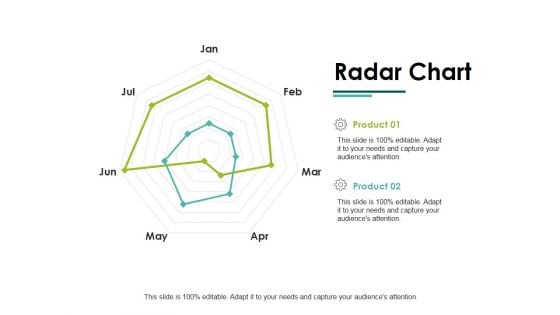
Radar Chart Ppt PowerPoint Presentation Infographics Slide Download
This is a radar chart ppt powerpoint presentation infographics slide download. This is a two stage process. The stages in this process are radar chart, finance, marketing, strategy, business.
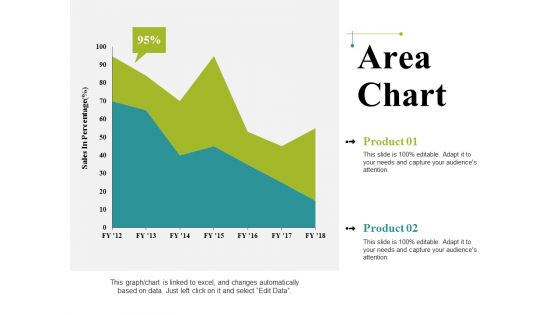
Area Chart Ppt PowerPoint Presentation Infographics Graphics Pictures
This is a area chart ppt powerpoint presentation infographics graphics pictures. This is a two stage process. The stages in this process are business, sales in percentage, area chart, marketing, graph.
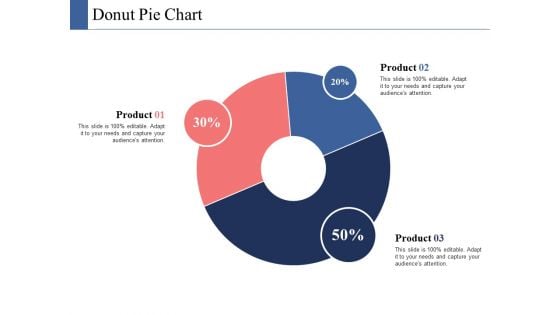
Donut Pie Chart Ppt PowerPoint Presentation Infographics Ideas
This is a donut pie chart ppt powerpoint presentation infographics ideas. This is a three stage process. The stages in this process are donut pie chart, finance, marketing, strategy, analysis.
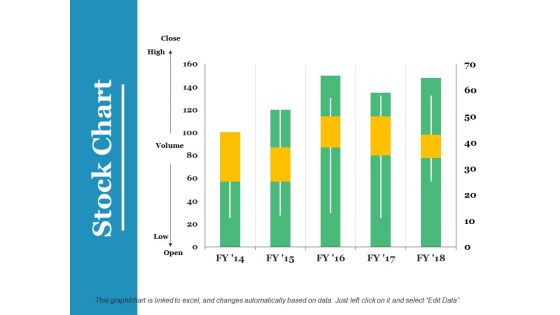
Stock Chart Ppt PowerPoint Presentation Infographics Graphics Example
This is a stock chart ppt powerpoint presentation infographics graphics example. This is a five stage process. The stages in this process are stock chart, finance, business, planning, marketing.

Area Chart Finance Ppt PowerPoint Presentation Infographics Layouts
This is a area chart finance ppt powerpoint presentation infographics layouts. This is a one stages process. The stages in this process are area chart, financial, marketing, planning, business.
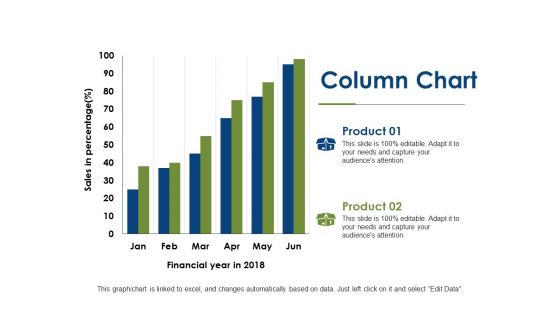
Column Chart Finance Ppt PowerPoint Presentation Infographics Backgrounds
This is a column chart finance ppt powerpoint presentation infographics backgrounds. This is a two stage process. The stages in this process are column chart, investment, marketing, finance, analysis.
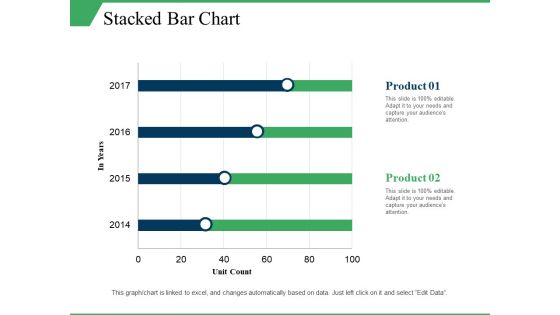
Stacked Bar Chart Ppt PowerPoint Presentation Infographics Elements
This is a stacked bar chart ppt powerpoint presentation infographics elements. This is a two stage process. The stages in this process are stacked bar chart, product, unit count, in year.
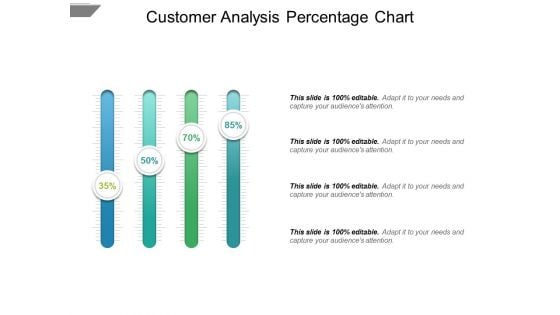
Customer Analysis Percentage Chart Ppt PowerPoint Presentation Infographics Master Slide
This is a customer analysis percentage chart ppt powerpoint presentation infographics master slide. This is a four stage process. The stages in this process are comparison chart, comparison table, comparison matrix.
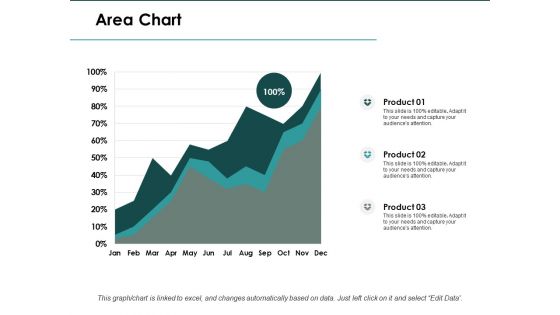
Area Chart Finance Ppt PowerPoint Presentation Infographics Slide
This is a area chart finance ppt powerpoint presentation infographics slide. This is a three stage process. The stages in this process are area chart, finance, marketing, analysis, investment.
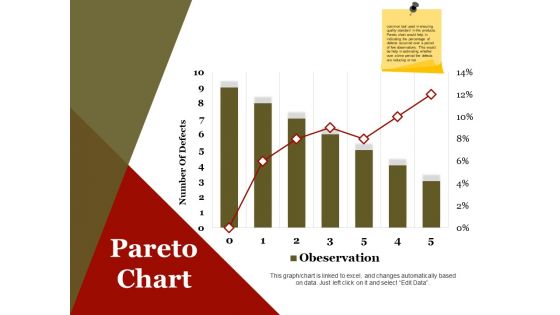
Pareto Chart Ppt PowerPoint Presentation Infographics Design Inspiration
This is a pareto chart ppt powerpoint presentation infographics design inspiration. This is a seven stage process. The stages in this process are number of defects, business, marketing, finance.
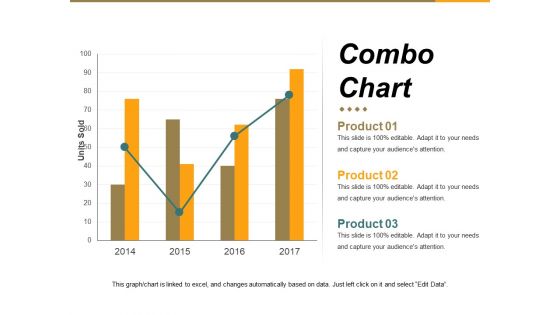
Combo Chart Ppt PowerPoint Presentation Infographics Example Introduction
This is a combo chart ppt powerpoint presentation infographics example introduction. This is a four stage process. The stages in this process are units sold, business, marketing, graph, growth.

Line Chart Ppt PowerPoint Presentation Infographics Graphic Images
This is a line chart ppt powerpoint presentation infographics graphic images. This is a two stage process. The stages in this process are sales in percentage, financial years, growth, business, marketing.
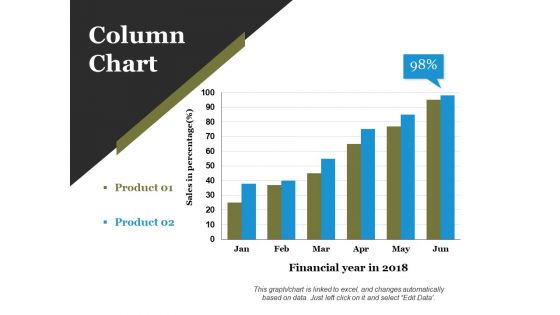
Column Chart Ppt PowerPoint Presentation Infographics Layout Ideas
This is a column chart ppt powerpoint presentation infographics layout ideas. This is a two stage process. The stages in this process are financial year in, business, marketing, growth, graph.
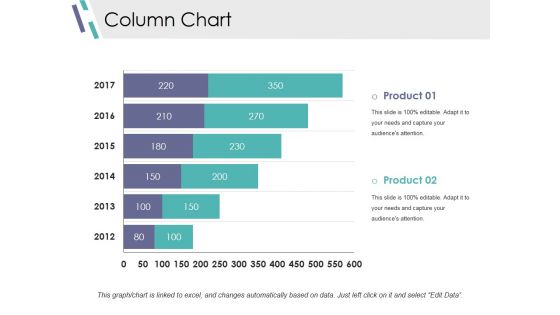
Column Chart Ppt PowerPoint Presentation Infographics Design Inspiration
This is a column chart ppt powerpoint presentation infographics design inspiration. This is a two stage process. The stages in this process are slide bar, marketing, strategy, finance, planning.
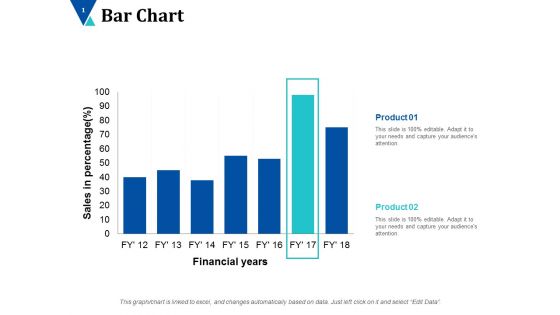
Bar Chart Finance Ppt PowerPoint Presentation Infographics Background Images
This is a bar chart finance ppt powerpoint presentation infographics background images. This is a seven stages process. The stages in this process are alpha testing, beta testing, full scale show.
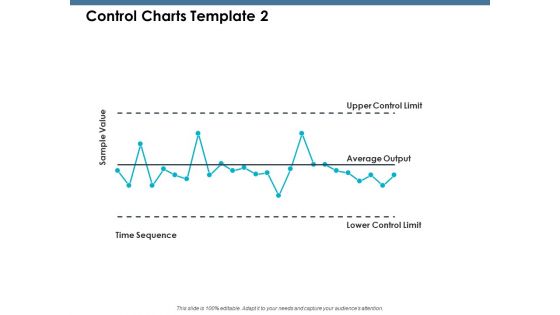
Control Charts Sample Value Ppt PowerPoint Presentation Infographics Demonstration
This is a control charts sample value ppt powerpoint presentation infographics demonstration. This is a five stage process. The stages in this process are product, percentage, marketing, business, management.
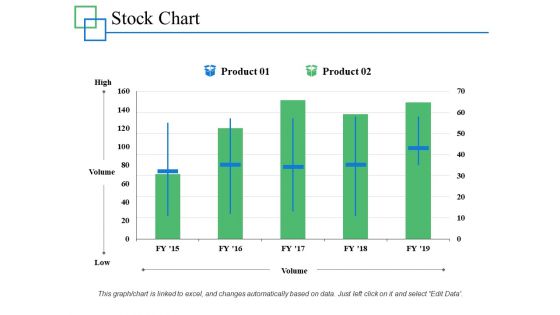
Stock Chart Management Investment Ppt PowerPoint Presentation Infographics Professional
This is a stock chart management investment ppt powerpoint presentation infographics professional. This is a two stage process. The stages in this process are marketing, business, management, percentage, product.
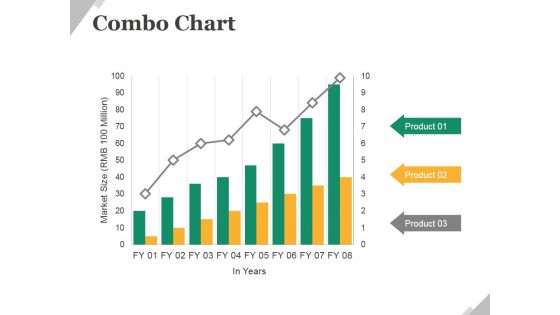
Combo Chart Ppt PowerPoint Presentation Infographics Example Topics
This is a combo chart ppt powerpoint presentation infographics example topics. This is a eight stage process. The stages in this process are business, marketing, growth, combo chart, management.
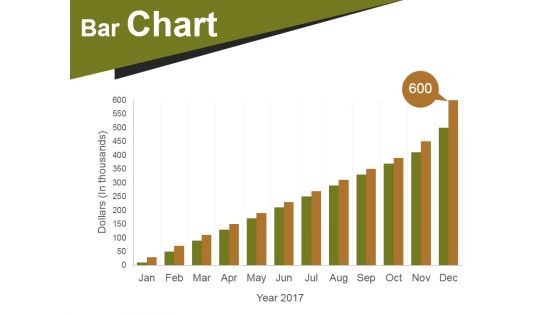
Bar Chart Ppt PowerPoint Presentation Infographics Designs Download
This is a bar chart ppt powerpoint presentation infographics designs download. This is a twelve stage process. The stages in this process are bar chart, business, marketing, strategy, success.
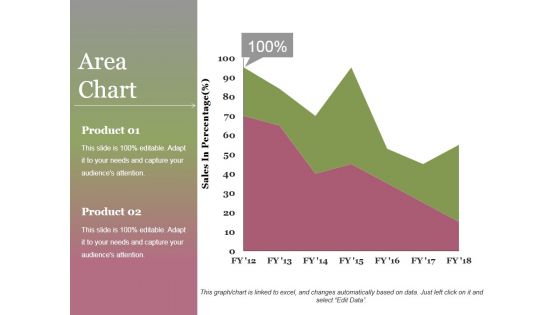
Area Chart Ppt PowerPoint Presentation Infographics File Formats
This is a area chart ppt powerpoint presentation infographics file formats. This is a two stage process. The stages in this process are area chart, product, sales in percentage, growth, success.

Area Chart Ppt PowerPoint Presentation Infographics Example Topics
This is a area chart ppt powerpoint presentation infographics example topics. This is a two stage process. The stages in this process are area chart, finance, marketing, strategy, business.
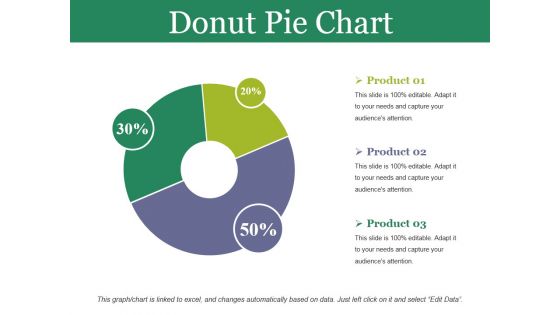
Donut Pie Chart Ppt PowerPoint Presentation Infographics Design Inspiration
This is a donut pie chart ppt powerpoint presentation infographics design inspiration. This is a three stage process. The stages in this process are donut pie chart, business, marketing, strategy, planning.
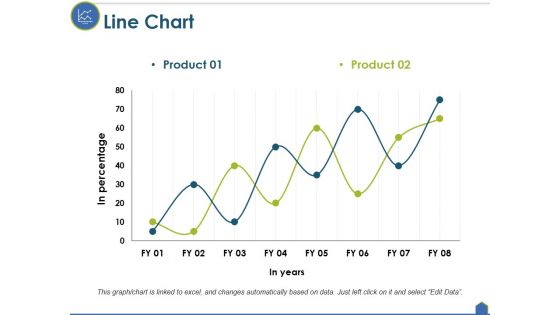
Line Chart Ppt PowerPoint Presentation Infographics File Formats
This is a line chart ppt powerpoint presentation infographics file formats. This is a two stage process. The stages in this process are line chart, growth, strategy, analysis, business.

Radar Chart Ppt PowerPoint Presentation Infographics Visual Aids
This is a radar chart ppt powerpoint presentation infographics visual aids. This is a two stage process. The stages in this process are radar chart, product, finance, business, marketing.
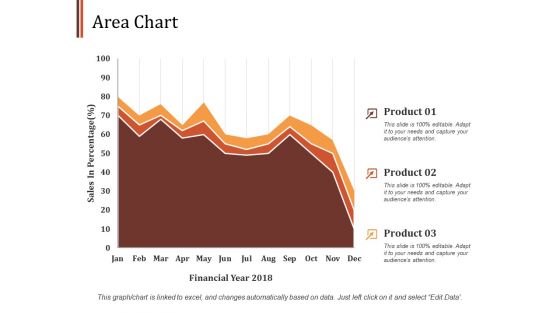
Area Chart Finance Ppt PowerPoint Presentation Infographics Design Ideas
This is a area chart finance ppt powerpoint presentation infographics design ideas. This is a three stage process. The stages in this process are area chart, finance, marketing, management, investment.
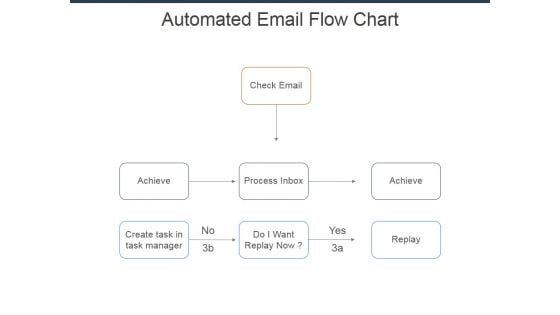
Automated Email Flow Chart Ppt Powerpoint Presentation Infographics Show
This is a automated email flow chart ppt powerpoint presentation infographics show. This is a three stage process. The stages in this process are check email, achieve, process inbox, do i want replay now, create task in task manager.

Donut Pie Chart Ppt PowerPoint Presentation Infographics Outfit
This is a donut pie chart ppt powerpoint presentation infographics outfit. This is a three stage process. The stages in this process are business, strategy, analysis, planning, dashboard, finance.

Scatter Bubble Chart Ppt PowerPoint Presentation Infographics Backgrounds
This is a scatter bubble chart ppt powerpoint presentation infographics backgrounds. This is a five stage process. The stages in this process are highest sale, in price, growth, success, business.
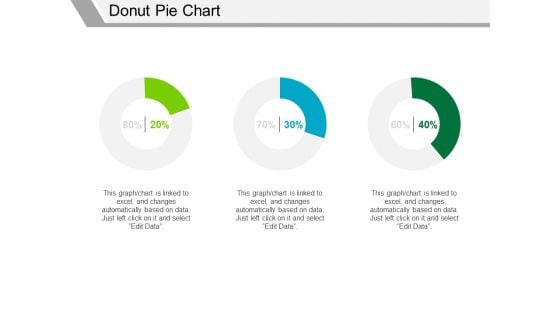
Donut Pie Chart Ppt PowerPoint Presentation Infographics Background Designs
This is a donut pie chart ppt powerpoint presentation infographics background designs. This is a three stage process. The stages in this process are finance, business, marketing, strategy, percentage.
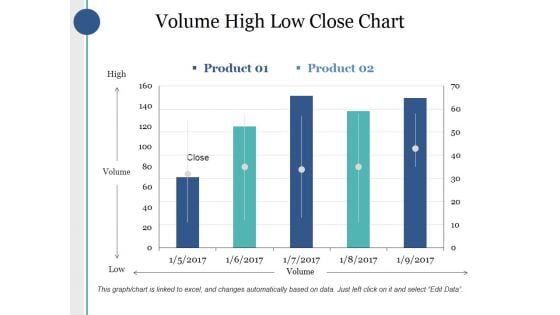
Volume High Low Close Chart Ppt PowerPoint Presentation Infographics Good
This is a volume high low close chart ppt powerpoint presentation infographics good. This is a two stage process. The stages in this process are high, volume, low, product, close.
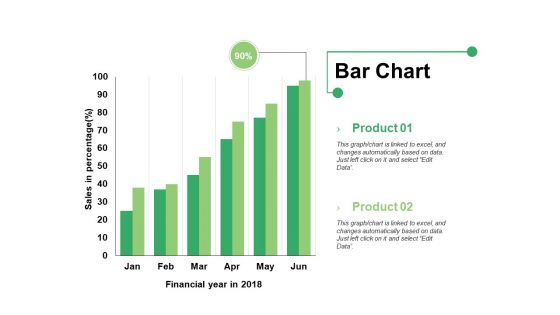
Bar Chart Ppt PowerPoint Presentation Infographics Format Ideas
This is a bar chart ppt powerpoint presentation infographics format ideas. This is a two stage process. The stages in this process are bar graph, product, financial year, sales in percentage.
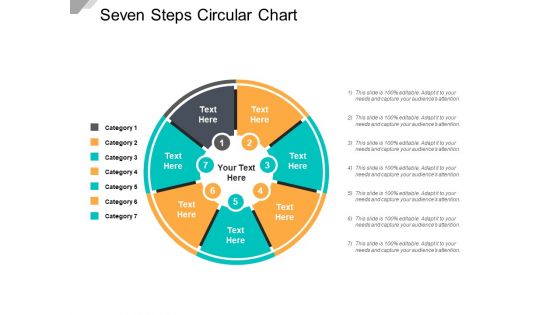
Seven Steps Circular Chart Ppt PowerPoint Presentation Infographics Designs
This is a seven steps circular chart ppt powerpoint presentation infographics designs. This is a seven stage process. The stages in this process are sectioned circle, segmented circle, partitioned circle.
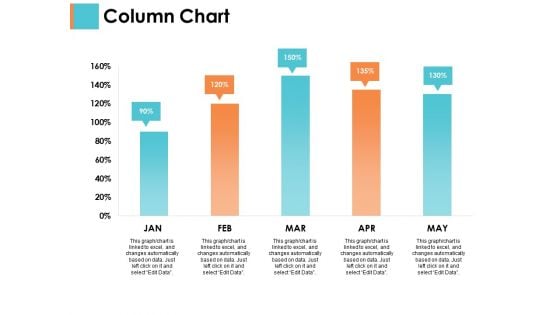
Column Chart Sample Budget Ppt Ppt PowerPoint Presentation Infographics Brochure
This is a column chart sample budget ppt ppt powerpoint presentation infographics brochure. This is a two stage process. The stages in this process are business, management, strategy, analysis, marketing.
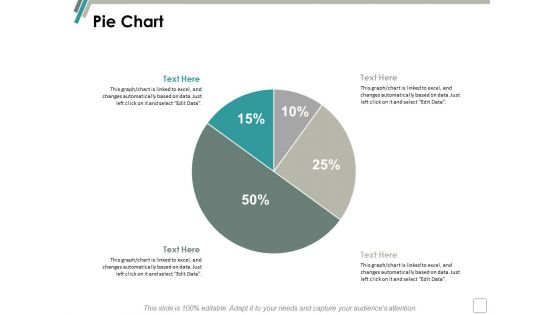
Pie Chart Finance Marketing Ppt Powerpoint Presentation Infographics Background
This is a pie chart finance marketing ppt powerpoint presentation infographics background. This is a two stage process. The stages in this process are finance, marketing, management, investment, analysis.
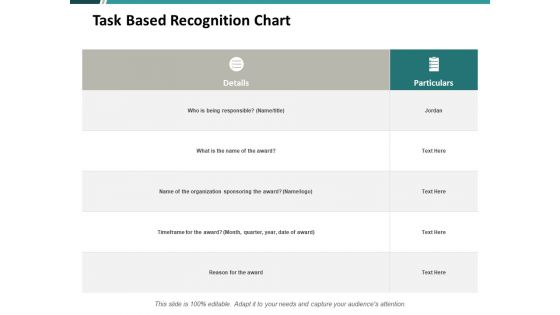
Task Based Recognition Chart Ppt PowerPoint Presentation Infographics Pictures
This is a task based recognition chart ppt powerpoint presentation infographics pictures. This is a three stage process. The stages in this process are compare, marketing, business, management, planning.
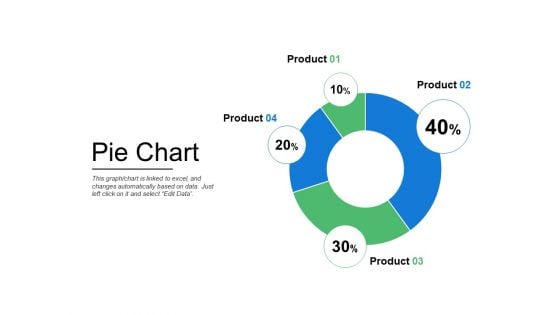
Pie Chart Finance Ppt PowerPoint Presentation Infographics Mockup
This is a pie chart finance ppt powerpoint presentation infographics mockup . This is a four stage process. The stages in this process are finance, marketing, management, investment, analysis.
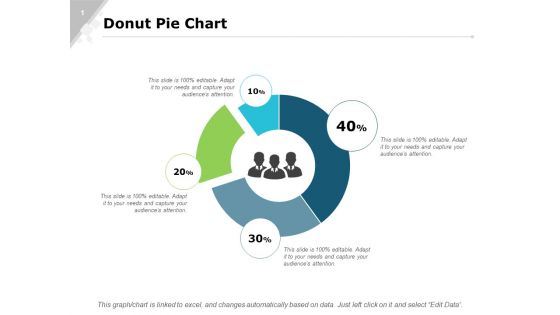
Donut Pie Chart Bar Ppt PowerPoint Presentation Infographics Slide Portrait
This is a donut pie chart bar ppt powerpoint presentation infographics slide portrait. This is a four stage process. The stages in this process are finance, marketing, analysis, investment, million.
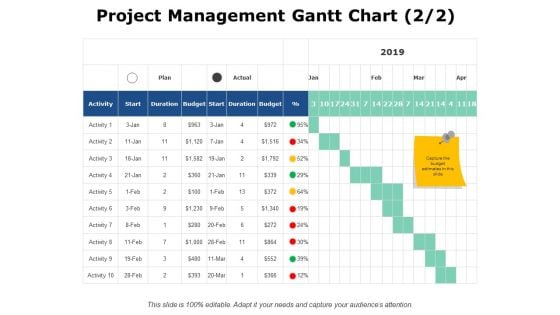
Project Management Gantt Chart Finance Ppt PowerPoint Presentation Infographics Files
This is a project management gantt chart finance ppt powerpoint presentation infographics files. This is a six stage process. The stages in this process are business, planning, strategy, marketing, management.
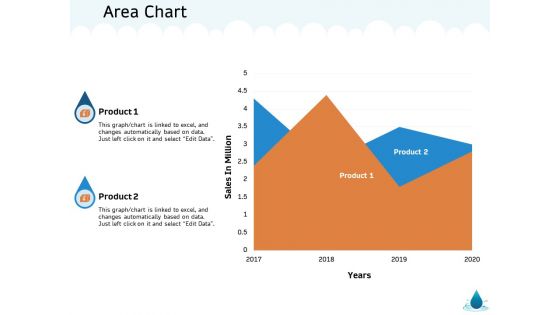
Water NRM Area Chart Ppt Infographics Themes PDF
Presenting this set of slides with name water nrm area chart ppt infographics themes pdf. The topics discussed in these slides are product 1, product 2. This is a completely editable PowerPoint presentation and is available for immediate download. Download now and impress your audience.
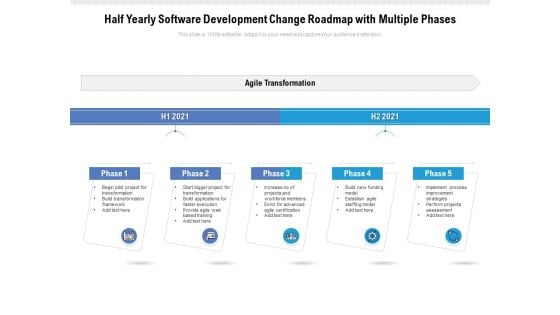
Half Yearly Software Development Change Roadmap With Multiple Phases Infographics
A cohesive work plan is essential for achieving the desired target. Communicate your vision and lay a firm ground in front of your audience with our PowerPoint layout. Align your project milestones, budgets, deliverables, deadlines, and all the requisite information for a dynamic presentation by employing this amazingly designed half yearly software development change roadmap with multiple phases infographics. Maximize team efficiency and streamline a work plan efficiently by introducing our ready made roadmap PowerPoint theme. You can quickly establish coordination between different activities across the organization and present an insight to your colleagues by utilizing this useful business tool. Color code specific tasks, prioritize, and keep a close eye on the deadlines with the help of our eye catchy PowerPoint template. Download our half yearly software development change roadmap with multiple phases infographics for excelling at productive management.
Project Accomplishment Tracking With Different Phases Infographics PDF
Showcasing this set of slides titled project accomplishment tracking with different phases infographics pdf. The topics addressed in these templates are project accomplishment tracking with different phases. All the content presented in this PPT design is completely editable. Download it and make adjustments in color, background, font etc. as per your unique business setting.
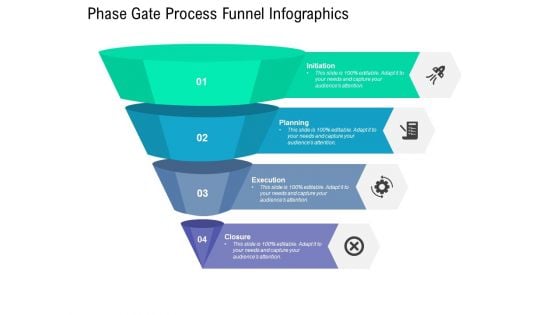
Phase Gate Process Funnel Infographics Ppt PowerPoint Presentation Layouts Layout
Presenting this set of slides with name phase gate process funnel infographics ppt powerpoint presentation layouts layout. This is a four stage process. The stages in this process are project funnel, performance management, planning. This is a completely editable PowerPoint presentation and is available for immediate download. Download now and impress your audience.
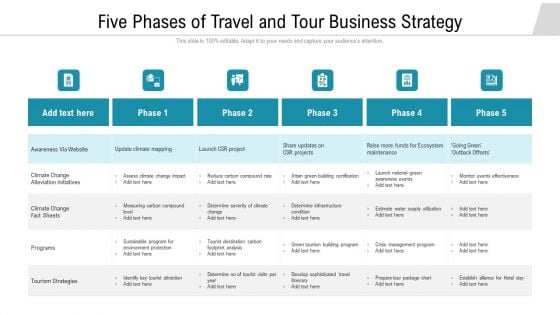
Five Phases Of Travel And Tour Business Strategy Infographics PDF
Showcasing this set of slides titled five phases of travel and tour business strategy infographics pdf. The topics addressed in these templates are climate change alleviation initiatives, tourism strategies, infrastructure. All the content presented in this PPT design is completely editable. Download it and make adjustments in color, background, font etc. as per your unique business setting.
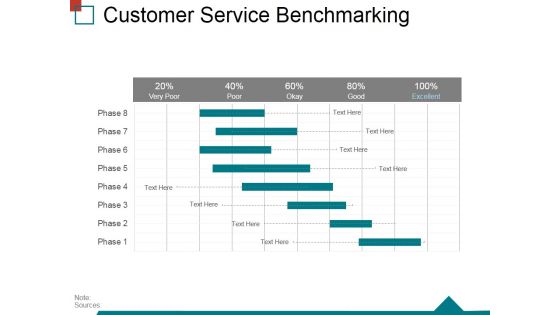
Customer Service Benchmarking Template 1 Ppt PowerPoint Presentation Infographics Themes
This is a customer service benchmarking template 1 ppt powerpoint presentation infographics themes. This is a five stage process. The stages in this process are business, process, marketing, management, customer service benchmarking.
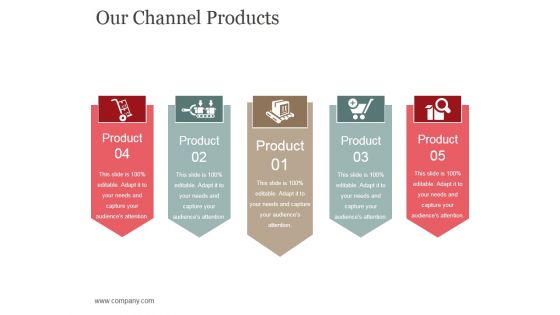
Our Channel Products Template 1 Ppt PowerPoint Presentation Infographics Themes
This is a our channel products template 1 ppt powerpoint presentation infographics themes. This is a five stage process. The stages in this process are channel, business, marketing, innovation, management.
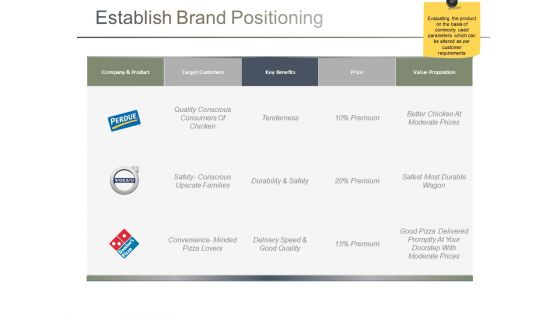
Establish Brand Positioning Ppt PowerPoint Presentation Infographics Themes
This is a establish brand positioning ppt powerpoint presentation infographics themes. This is a three stage process. The stages in this process are target customers, company and product, key benefits, price, value proposition.
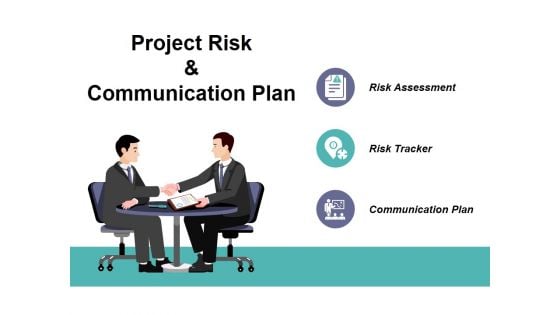
Project Risk And Communication Plan Ppt PowerPoint Presentation Infographics Themes
This is a project risk and communication plan ppt powerpoint presentation infographics themes. This is a three stage process. The stages in this process are risk assessment, risk tracker, communication plan.
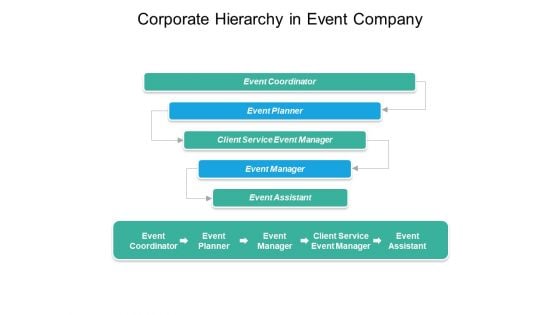
Corporate Hierarchy In Event Company Ppt PowerPoint Presentation Infographics Themes
This is a corporate hierarchy in event company ppt powerpoint presentation infographics themes. This is a five stage process. The stages in this process are project management, event management, event planning.

Cost Performance Index Ppt PowerPoint Presentation Infographics Themes
This is a cost performance index ppt powerpoint presentation infographics themes. This is a two stage process. The stages in this process are cost performance index, ev term, value, finance.
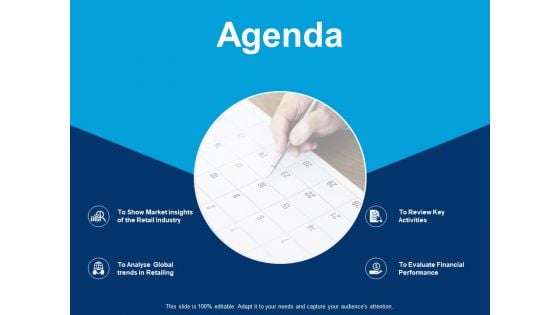
Agenda To Review Key Activities Ppt PowerPoint Presentation Infographics Themes
This is a agenda to review key activities ppt powerpoint presentation infographics themes. This is a four stage process. The stages in this process are business, management, strategy, analysis, marketing.
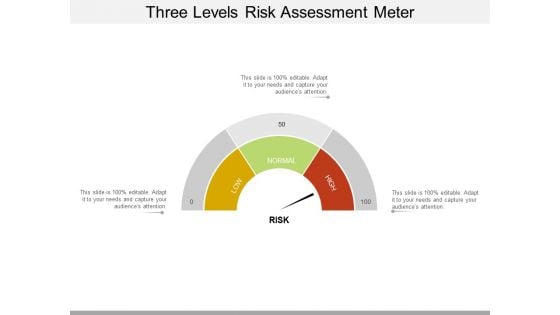
Three Levels Risk Assessment Meter Ppt PowerPoint Presentation Infographics Themes
This is a three levels risk assessment meter ppt powerpoint presentation infographics themes. This is a three stage process. The stages in this process are risk meter, risk speedometer, hazard meter.
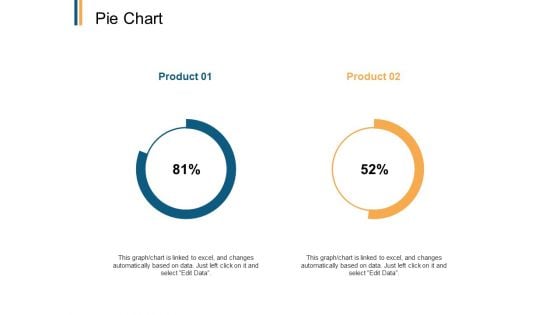
Pie Chart Analysis Ppt PowerPoint Presentation Infographics Diagrams
Presenting this set of slides with name pie chart analysis ppt powerpoint presentation infographics diagrams. The topics discussed in these slides are pie chat, product 01, product 02. This is a completely editable PowerPoint presentation and is available for immediate download. Download now and impress your audience.
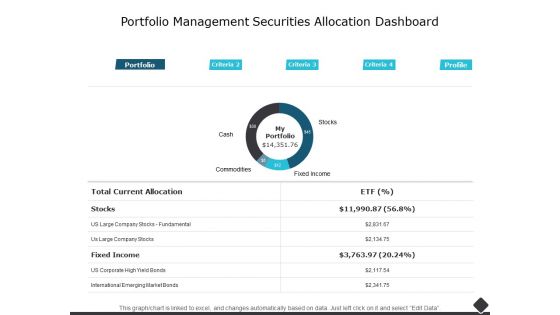
Portfolio Management Securities Allocation Dashboard Ppt PowerPoint Presentation Infographics Examples
This is a portfolio management securities allocation dashboard ppt powerpoint presentation infographics examples. The topics discussed in this diagram are finance, marketing, management, investment, analysis. This is a completely editable PowerPoint presentation, and is available for immediate download.
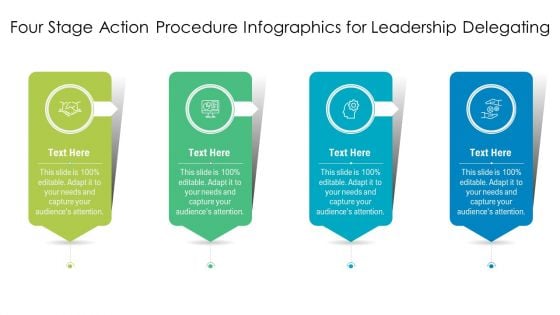
Four Stage Action Procedure Infographics For Leadership Delegating Download PDF
Presenting four stage action procedure infographics for leadership delegating download pdf to dispense important information. This template comprises four stages. It also presents valuable insights into the topics including four stage action procedure infographics for leadership delegating. This is a completely customizable PowerPoint theme that can be put to use immediately. So, download it and address the topic impactfully.
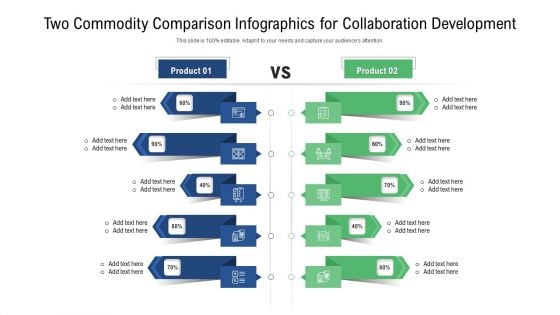
Two Commodity Comparison Infographics For Collaboration Development Background PDF
Presenting two commodity comparison infographics for collaboration development background pdf to dispense important information. This template comprises two stages. It also presents valuable insights into the topics including two commodity comparison infographics for collaboration development. This is a completely customizable PowerPoint theme that can be put to use immediately. So, download it and address the topic impactfully.

Business Diagram Four Staged Infographics Design Presentation Template
Our above slide displays Four Staged Infographics Design. Download our above diagram to express information in a visual way. This diagram offers a way for your audience to visually conceptualize the process.

Our Mission Template 2 Ppt PowerPoint Presentation Infographics Diagrams
This is a our mission template 2 ppt powerpoint presentation infographics diagrams. This is a one stage process. The stages in this process are our mission, business, success, planning, marketing.

 Home
Home