Infographic Icons

Market Sizing Template 1 Ppt PowerPoint Presentation Infographics Diagrams
This is a market sizing template 1 ppt powerpoint presentation infographics diagrams. This is a three stage process. The stages in this process are total available market, serviceable market, our market share.
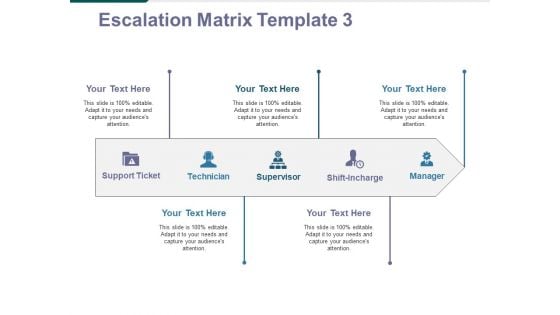
Escalation Matrix Template 3 Ppt PowerPoint Presentation Infographics Diagrams
This is a escalation matrix template 3 ppt powerpoint presentation infographics diagrams. This is a five stage process. The stages in this process are support ticket, technician, supervisor, shift incharge, manager.
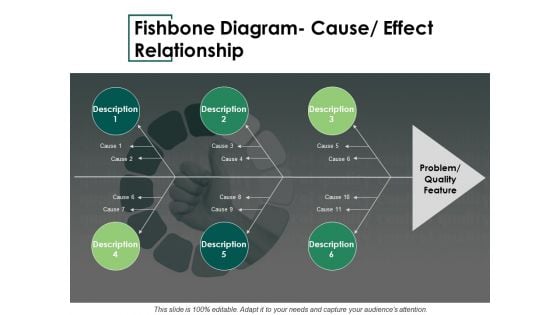
Fishbone Diagram Cause Effect Relationship Ppt PowerPoint Presentation Infographics Slideshow
This is a fishbone diagram cause effect relationship ppt powerpoint presentation infographics slideshow. This is a six stage process. The stages in this process are description, cause, problem quality feature.
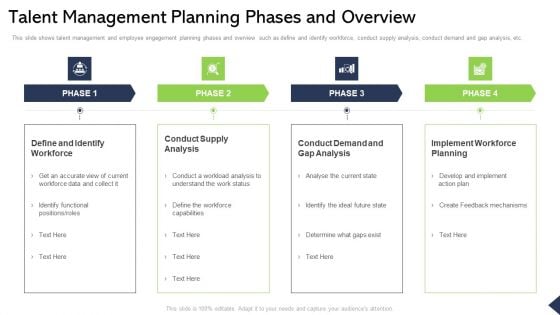
Talent Management Planning Phases And Overview Ppt Infographics Diagrams PDF
This slide shows talent management and employee engagement planning phases and overview such as define and identify workforce, conduct supply analysis, conduct demand and gap analysis, etc. Presenting talent management planning phases and overview ppt infographics diagrams pdf to provide visual cues and insights. Share and navigate important information on four stages that need your due attention. This template can be used to pitch topics like identify workforce, conduct supply analysis, conduct demand and gap analysis, implement workforce planning. In addtion, this PPT design contains high resolution images, graphics, etc, that are easily editable and available for immediate download.

Five Phases Of Recruitment Process Timeline Infographics PDF
The following slide highlights various phases of employment process timeline. The timeline phase begins with candidate screening, application review, interviews, document verification, conditional offer and job offer letter. Presenting five phases of recruitment process timeline infographics pdf to dispense important information. This template comprises five stages. It also presents valuable insights into the topics including application, technical interview, employee onboarding. This is a completely customizable PowerPoint theme that can be put to use immediately. So, download it and address the topic impactfully.
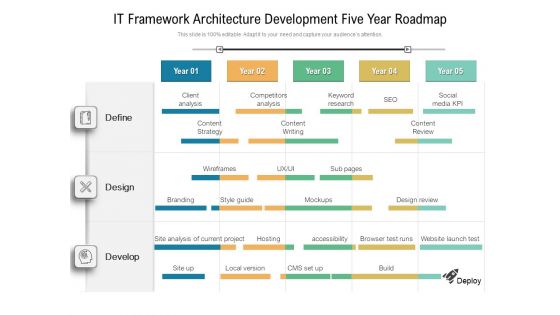
IT Framework Architecture Development Five Year Roadmap Infographics
We present our it framework architecture development five year roadmap infographics. This PowerPoint layout is easy-to-edit so you can change the font size, font type, color, and shape conveniently. In addition to this, the PowerPoint layout is Google Slides compatible, so you can share it with your audience and give them access to edit it. Therefore, download and save this well-researched it framework architecture development five year roadmap infographics in different formats like PDF, PNG, and JPG to smoothly execute your business plan.
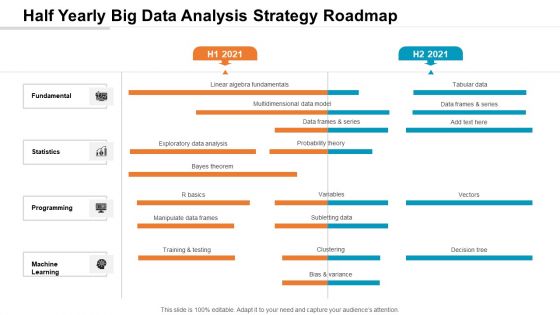
Half Yearly Big Data Analysis Strategy Roadmap Infographics
We present our half yearly big data analysis strategy roadmap infographics. This PowerPoint layout is easy-to-edit so you can change the font size, font type, color, and shape conveniently. In addition to this, the PowerPoint layout is Google Slides compatible, so you can share it with your audience and give them access to edit it. Therefore, download and save this well-researched half yearly big data analysis strategy roadmap infographics in different formats like PDF, PNG, and JPG to smoothly execute your business plan.
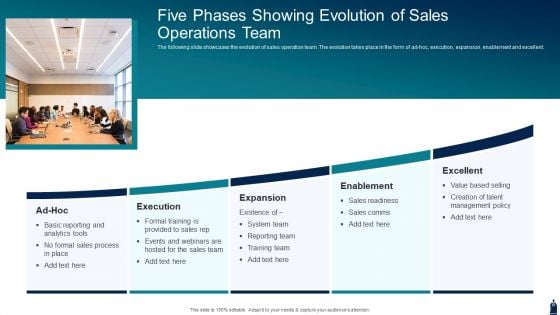
Five Phases Showing Evolution Of Sales Operations Team Infographics PDF
The following slide showcases the evolution of sales operation team. The evolution takes place in the form of ad hoc, execution, expansion, enablement and excellent. Presenting five phases showing evolution of sales operations team infographics pdf to dispense important information. This template comprises five stages. It also presents valuable insights into the topics including execution, expansion, enablement. This is a completely customizable PowerPoint theme that can be put to use immediately. So, download it and address the topic impactfully.
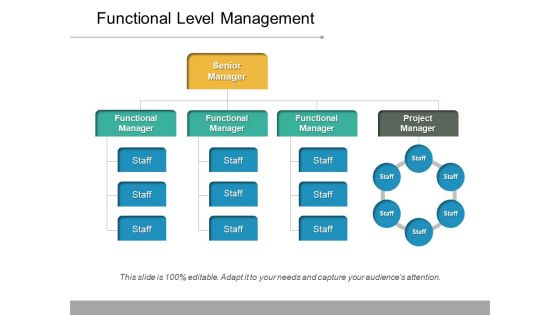
Functional Level Management Ppt PowerPoint Presentation Infographics Images
This is a functional level management ppt powerpoint presentation infographics images. This is a three stage process. The stages in this process are organization chart, org chart, project team structure.
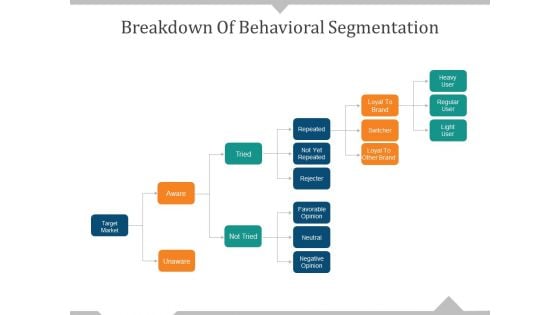
Breakdown Of Behavioral Segmentation Ppt PowerPoint Presentation Infographics Slide Portrait
This is a breakdown of behavioral segmentation ppt powerpoint presentation infographics slide portrait. This is a five stage process. The stages in this process are target market, aware, unaware, not tried, tried, negative opinion.
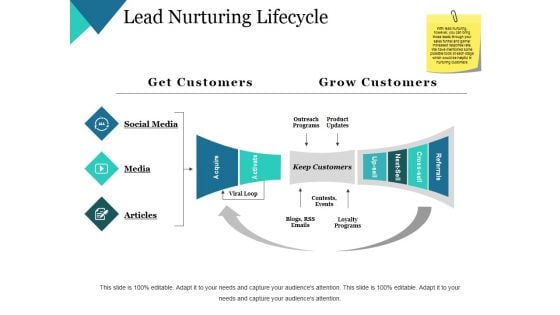
Lead Nurturing Lifecycle Ppt PowerPoint Presentation Infographics Designs
This is a lead nurturing lifecycle ppt powerpoint presentation infographics designs. This is a two stage process. The stages in this process are social media, media, articles, outreach programs, product updates.
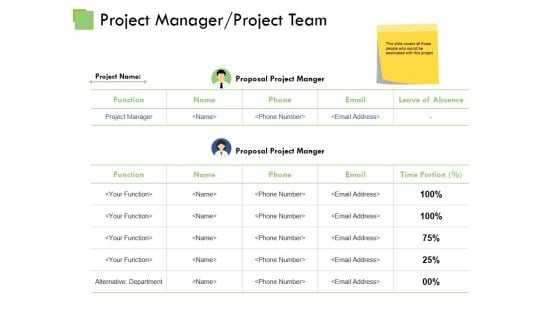
Project Manager Project Team Ppt PowerPoint Presentation Infographics Maker
This is a project manager project team ppt powerpoint presentation infographics maker. This is a four stage process. The stages in this process are business, marketing, strategy, planning, communication.
Software Product Development Process Ppt PowerPoint Presentation Infographics Pictures Cpb
This is a software product development process ppt powerpoint presentation infographics pictures cpb. This is a two stage process. The stages in this process are software product development process.
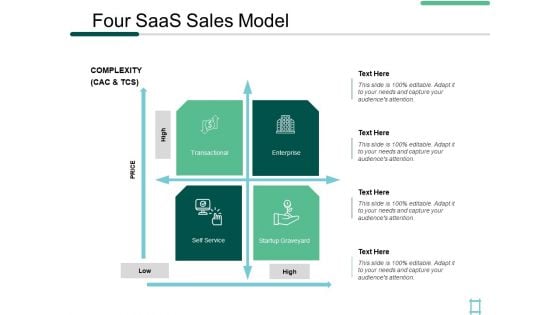
Four Saas Sales Model Enterprise Ppt PowerPoint Presentation Infographics Sample
This is a four saas sales model enterprise ppt powerpoint presentation infographics sample. This is a four stage process. The stages in this process are transactional, enterprise, self service, startup graveyard, planning.
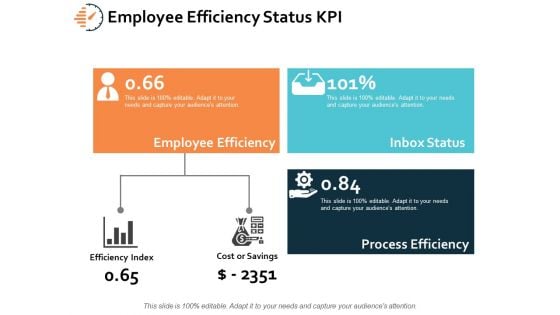
Employee Efficiency Status KPI Ppt PowerPoint Presentation Infographics Images
This is a employee efficiency status kpi ppt powerpoint presentation infographics images. This is a three stage process. The stages in this process are employee efficiency, process efficiency, efficiency index, planning, marketing.

Graph Indicating Clinical Trial Phases Probability Of Success Infographics PDF
This slide compares and visually presents the success rate of each stage with preceding one of the clinical research procedures to represent the achievement of the drug efficacy objective of the firm.Deliver and pitch your topic in the best possible manner with this Graph Indicating Clinical Trial Phases Probability Of Success Infographics PDF Use them to share invaluable insights on Graph Indicating Clinical Trial Phases Probability Of Success and impress your audience. This template can be altered and modified as per your expectations. So, grab it now.
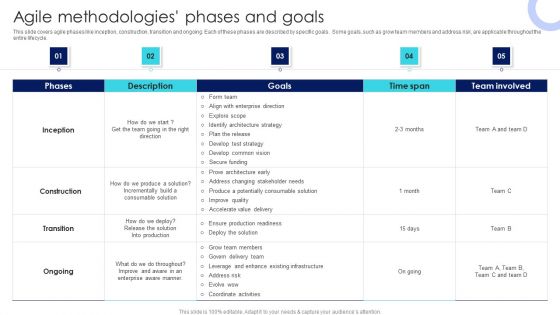
IT Agile Framework Agile Methodologies Phases And Goals Infographics PDF
This slide covers agile phases like inception, construction, transition and ongoing. each of these phases are described by specific goals. some goals, such as grow team members and address risk, are applicable throughout the entire lifecycle. Do you have to make sure that everyone on your team knows about any specific topic I yes, then you should give IT Agile Framework Agile Methodologies Phases And Goals Infographics PDF a try. Our experts have put a lot of knowledge and effort into creating this impeccable IT Agile Framework Agile Methodologies Phases And Goals Infographics PDF. You can use this template for your upcoming presentations, as the slides are perfect to represent even the tiniest detail. You can download these templates from the Slidegeeks website and these are easy to edit. So grab these today.
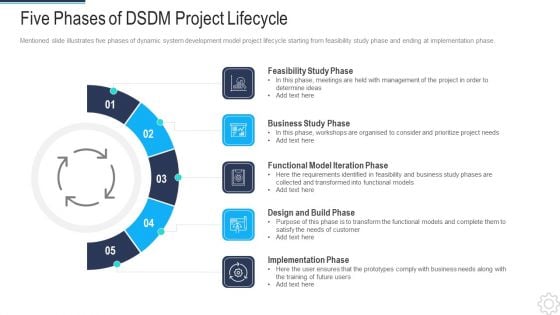
DSDM IT Five Phases Of Dsdm Project Lifecycle Infographics PDF
This is a dsdm it five phases of dsdm project lifecycle infographics pdf template with various stages. Focus and dispense information on five stages using this creative set, that comes with editable features. It contains large content boxes to add your information on topics like feasibility study phase, business study phase, design and build phase. You can also showcase facts, figures, and other relevant content using this PPT layout. Grab it now.
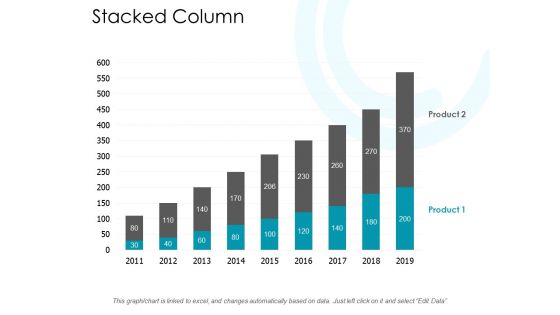
Stacked Column Analysis Ppt PowerPoint Presentation Infographics Themes
Presenting this set of slides with name stacked column analysis ppt powerpoint presentation infographics themes. The topics discussed in these slides are finance, marketing, management, investment, analysis. This is a completely editable PowerPoint presentation and is available for immediate download. Download now and impress your audience.
Weekly Project Schedule Progress Tracking Gantt Chart Infographics PDF
The slide highlights the weekly project plan progress tracking Gantt chart depicting development phase, testing phase and launch phase. Showcasing this set of slides titled Weekly Project Schedule Progress Tracking Gantt Chart Infographics PDF. The topics addressed in these templates are Development, Increased Demand, Increased Anticipation. All the content presented in this PPT design is completely editable. Download it and make adjustments in color, background, font etc. as per your unique business setting.
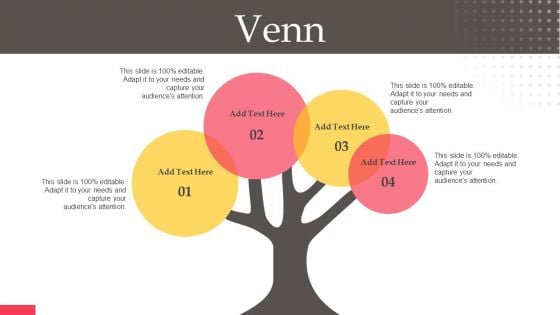
Executing Automotive Marketing Tactics For Sales Boost Venn Infographics PDF
Are you searching for a Executing Automotive Marketing Tactics For Sales Boost Venn Infographics PDF that is uncluttered, straightforward, and original Its easy to edit, and you can change the colors to suit your personal or business branding. For a presentation that expresses how much effort you have put in, this template is ideal With all of its features, including tables, diagrams, statistics, and lists, its perfect for a business plan presentation. Make your ideas more appealing with these professional slides. Download Executing Automotive Marketing Tactics For Sales Boost Venn Infographics PDF from Slidegeeks today.
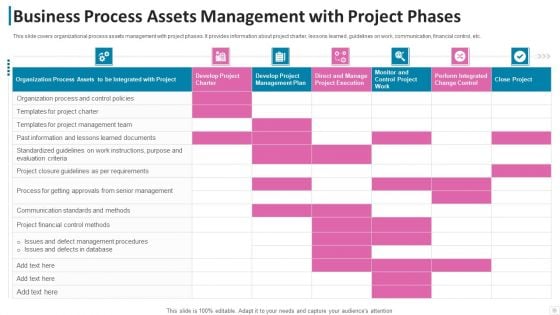
Business Process Assets Management With Project Phases Infographics PDF
This slide covers organizational process assets management with project phases. It provides information about project charter, lessons learned, guidelines on work, communication, financial control, etc. Pitch your topic with ease and precision using this business process assets management with project phases infographics pdf. This layout presents information on business process assets management with project phases. It is also available for immediate download and adjustment. So, changes can be made in the color, design, graphics or any other component to create a unique layout.
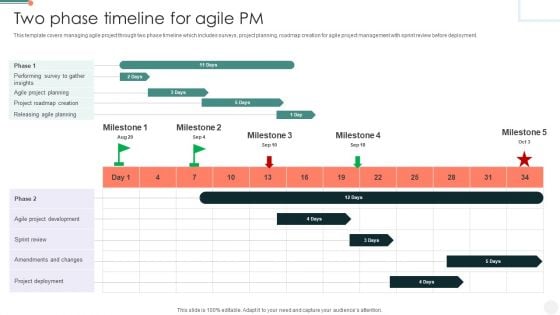
Two Phase Timeline For Agile PM Infographics PDF
This template covers managing agile project through two phase timeline which includes surveys, project planning, roadmap creation for agile project management with sprint review before deployment. Showcasing this set of slides titled Two Phase Timeline For Agile PM Infographics PDF. The topics addressed in these templates are Agile Project Development, Project Roadmap Creation, Phase Timeline. All the content presented in this PPT design is completely editable. Download it and make adjustments in color, background, font etc. as per your unique business setting.
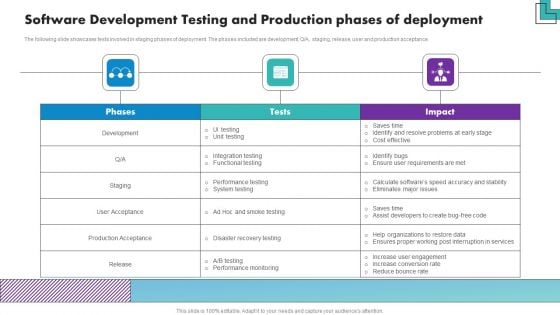
Software Development Testing And Production Phases Of Deployment Infographics PDF
The following slide showcases tests involved in staging phases of deployment. The phases included are development, Q or A, staging, release, user and production acceptance. Showcasing this set of slides titled Software Development Testing And Production Phases Of Deployment Infographics PDF. The topics addressed in these templates are Development, Staging, User Acceptance, Production Acceptance, Release. All the content presented in this PPT design is completely editable. Download it and make adjustments in color, background, font etc. as per your unique business setting.
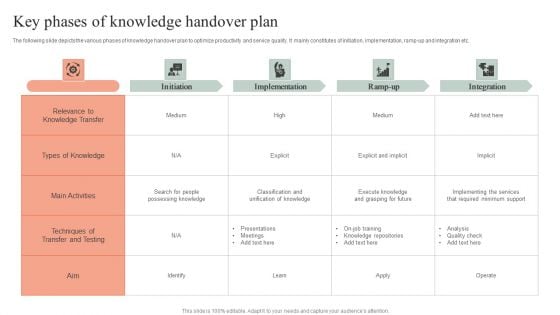
Key Phases Of Knowledge Handover Plan Infographics PDF
The following slide depicts the various phases of knowledge handover plan to optimize productivity and service quality. It mainly constitutes of initiation, implementation, ramp-up and integration etc. Pitch your topic with ease and precision using this Key Phases Of Knowledge Handover Plan Infographics PDF. This layout presents information on Implementation, Required Minimum Support, Analysis. It is also available for immediate download and adjustment. So, changes can be made in the color, design, graphics or any other component to create a unique layout.
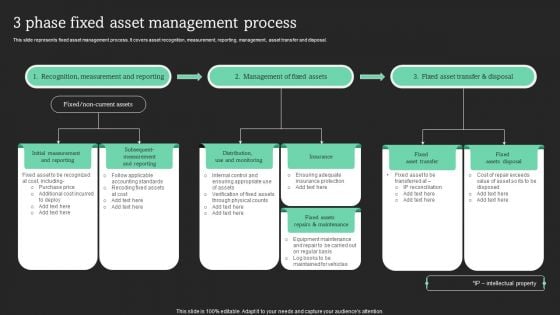
3 Phase Fixed Asset Management Process Infographics PDF
This slide represents fixed asset management process. It covers asset recognition, measurement, reporting, management, asset transfer and disposal. Find a pre designed and impeccable 3 Phase Fixed Asset Management Process Infographics PDF. The templates can ace your presentation without additional effort. You can download these easy to edit presentation templates to make your presentation stand out from others. So, what are you waiting for Download the template from Slidegeeks today and give a unique touch to your presentation.
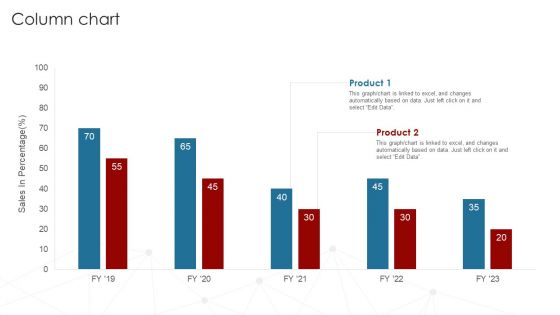
Deployment Of Business Process Column Chart Ppt Infographics Smartart PDF
Get a simple yet stunning designed Deployment Of Business Process Column Chart Ppt Infographics Smartart PDF. It is the best one to establish the tone in your meetings. It is an excellent way to make your presentations highly effective. So, download this PPT today from Slidegeeks and see the positive impacts. Our easy-to-edit Deployment Of Business Process Column Chart Ppt Infographics Smartart PDF can be your go-to option for all upcoming conferences and meetings. So, what are you waiting for Grab this template today.
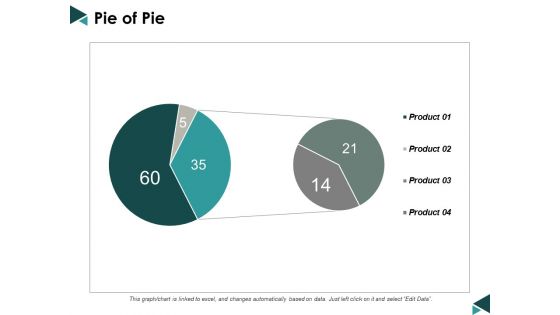
Pie Of Pie Ppt Powerpoint Presentation Infographics Layout Ideas
This is a pie of pie ppt powerpoint presentation infographics layout ideas. This is a four stage process. The stages in this process are pie chart, marketing, business, analysis, management.
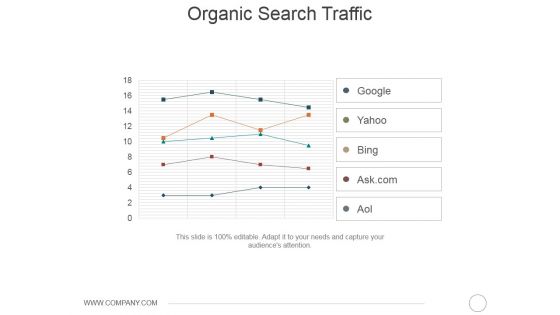
Organic Search Traffic Ppt PowerPoint Presentation Infographics Show
This is a organic search traffic ppt powerpoint presentation infographics show. This is a five stage process. The stages in this process are google, yahoo, bing, ask com, aol.
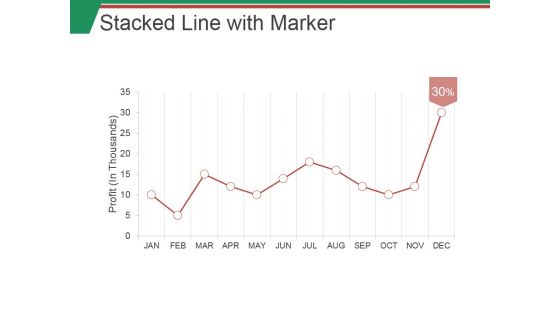
Stacked Line With Marker Ppt PowerPoint Presentation Infographics Images
This is a stacked line with marker ppt powerpoint presentation infographics images. This is a twelve stage process. The stages in this process are business, marketing, strategy, finance, success.
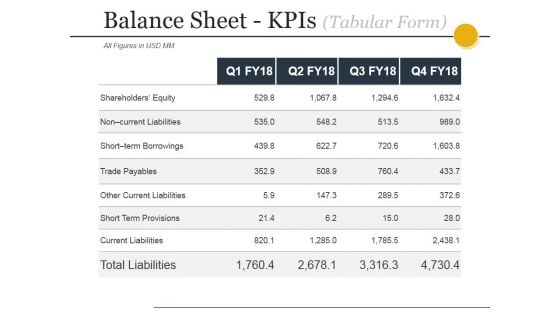
Balance Sheet Kpis Tabular Form Ppt PowerPoint Presentation Infographics Good
This is a balance sheet kpis tabular form ppt powerpoint presentation infographics good. This is a four stage process. The stages in this process are current assets, current liabilities, total assets, total liabilities.
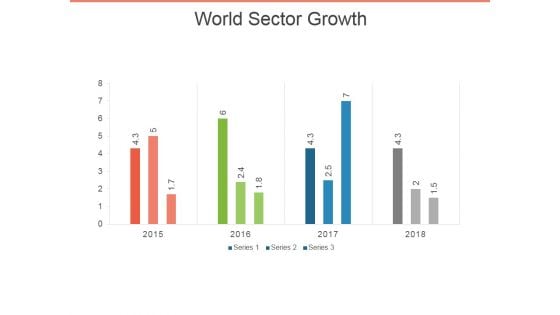
World Sector Growth Ppt PowerPoint Presentation Infographics Objects
This is a world sector growth ppt powerpoint presentation infographics objects. This is a four stage process. The stages in this process are bar graph, business, marketing, success, presentation.
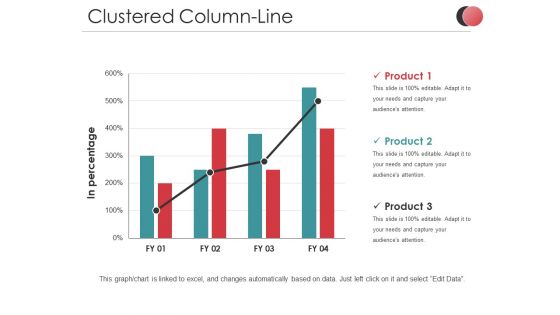
Clustered Column Line Ppt PowerPoint Presentation Infographics Templates
This is a clustered column line ppt powerpoint presentation infographics templates. This is a three stage process. The stages in this process are in percentage, business, marketing, product, finance, graph.
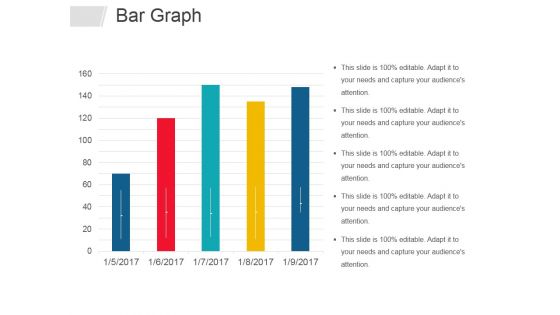
Bar Graph Ppt PowerPoint Presentation Infographics Graphics Design
This is a bar graph ppt powerpoint presentation infographics graphics design. This is a five stage process. The stages in this process are bar graph, business, years, marketing, management.
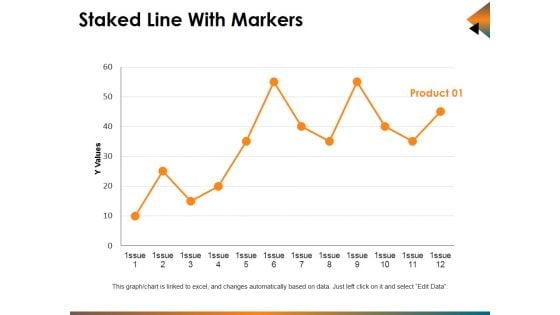
Staked Line With Markers Ppt PowerPoint Presentation Infographics Show
This is a staked line with markers ppt powerpoint presentation infographics show. This is a one stage process. The stages in this process are business, marketing, finance, line, analysis.
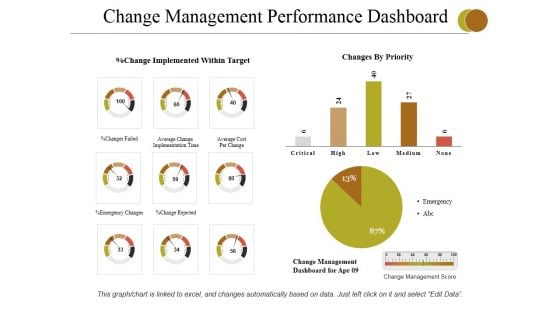
Change Management Performance Dashboard Ppt PowerPoint Presentation Infographics Topics
This is a change management performance dashboard ppt powerpoint presentation infographics topics. This is a Three stage process. The stages in this process are emergency changes, change rejected, changes failed, average cost per change, emergency.
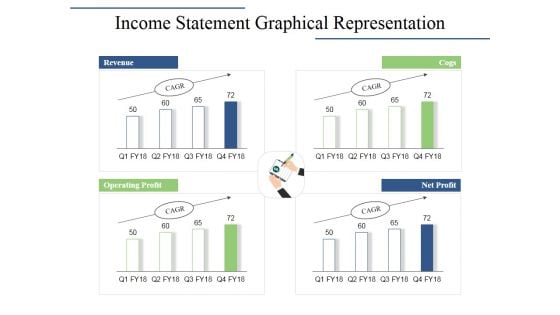
Income Statement Graphical Representation Ppt PowerPoint Presentation Infographics Layouts
This is a income statement graphical representation ppt powerpoint presentation infographics layouts. This is a four stage process. The stages in this process are revenue, cogs, operating profit, net profit.
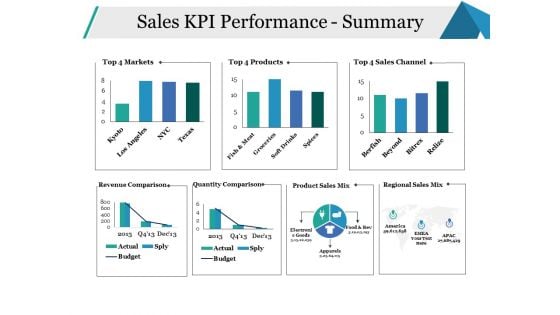
Sales KPI Performance Summary Ppt PowerPoint Presentation Infographics Model
This is a sales kpi performance summary ppt powerpoint presentation infographics model. This is a seven stage process. The stages in this process are sales channel, revenue comparison, quantity comparison, business, marketing.
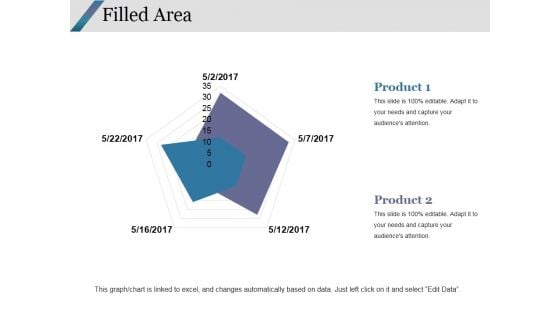
Filled Area Ppt PowerPoint Presentation Infographics Graphics Design
This is a filled area ppt powerpoint presentation infographics graphics design. This is a two stage process. The stages in this process are filled area, finance, marketing, strategy, analysis.
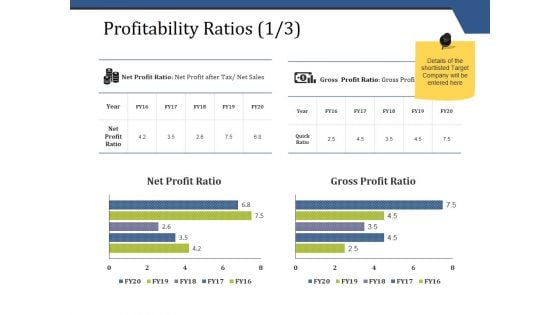
Profitability Ratios Template 1 Ppt PowerPoint Presentation Infographics Mockup
This is a profitability ratios template 1 ppt powerpoint presentation infographics mockup. This is a two stage process. The stages in this process are business, finance, marketing, strategy, analysis.
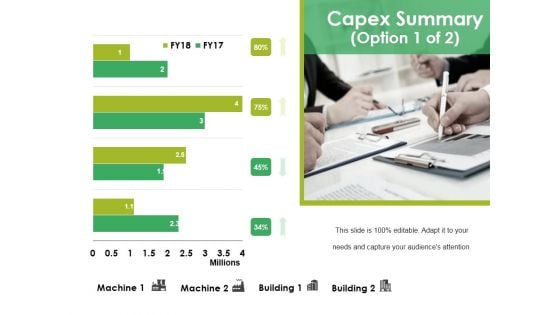
Capex Summary Template 1 Ppt PowerPoint Presentation Infographics Mockup
This is a capex summary template 1 ppt powerpoint presentation infographics mockup. This is a four stage process. The stages in this process are finance, marketing, business, analysis, strategy.
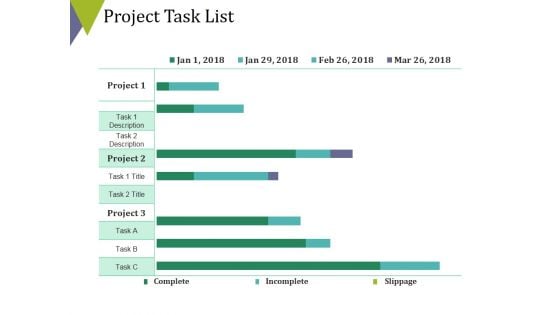
Project Task List Template 2 Ppt PowerPoint Presentation Infographics Brochure
This is a project task list template 2 ppt powerpoint presentation infographics brochure. This is a three stage process. The stages in this process are finance, business, marketing, analysis, strategy.
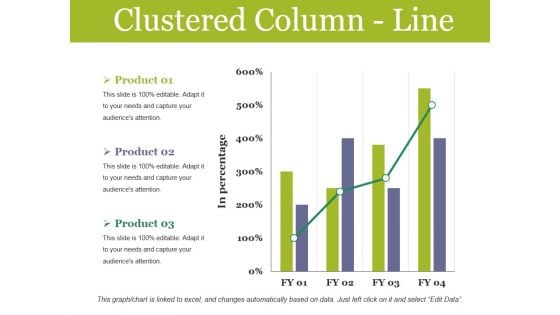
Clustered Column Line Ppt PowerPoint Presentation Infographics Graphics Design
This is a clustered column line ppt powerpoint presentation infographics graphics design. This is a three stage process. The stages in this process are finance, marketing, business, analysis, management.
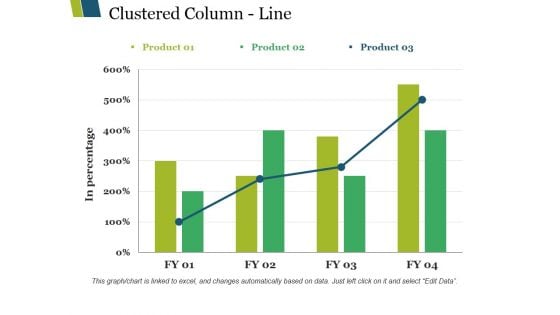
Clustered Column Line Ppt PowerPoint Presentation Infographics Background Images
This is a clustered column line ppt powerpoint presentation infographics background images. This is a three stage process. The stages in this process are clustered column line, finance, analysis, marketing, business.
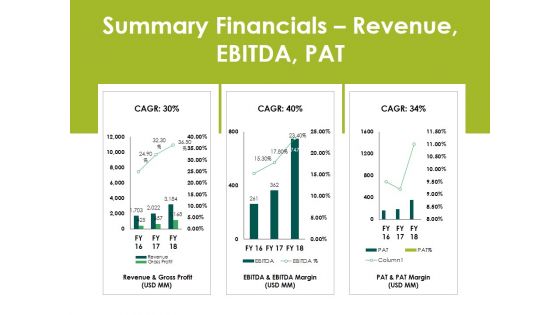
Summary Financials Revenue Ebitda Pat Ppt PowerPoint Presentation Infographics Ideas
This is a summary financials revenue ebitda pat ppt powerpoint presentation infographics ideas. This is a three stage process. The stages in this process are business, finance, analysis, marketing, strategy.
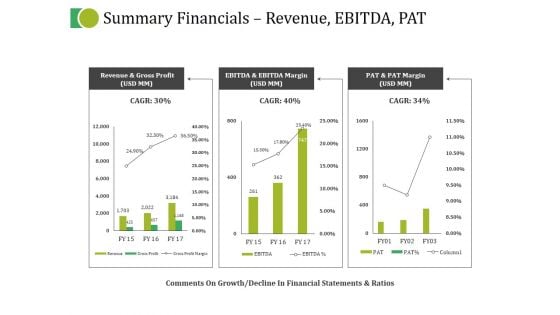
Summary Financials Revenue Ebitda Pat Ppt PowerPoint Presentation Infographics Inspiration
This is a summary financials revenue ebitda pat ppt powerpoint presentation infographics inspiration. This is a three stage process. The stages in this process are business, marketing, strategy, planning, finance.
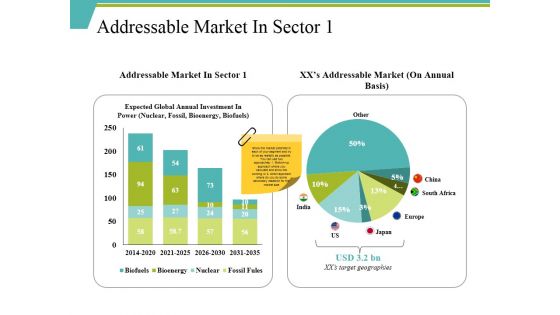
Addressable Market In Sector 1 Ppt PowerPoint Presentation Infographics Show
This is a addressable market in sector 1 ppt powerpoint presentation infographics show. This is a two stage process. The stages in this process are india, japan, europe, south africa, us.
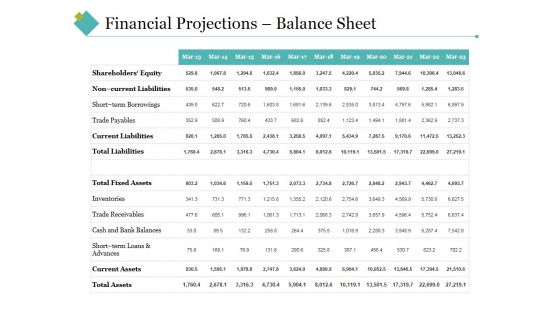
Financial Projections Balance Sheet Ppt PowerPoint Presentation Infographics Clipart Images
This is a financial projections balance sheet ppt powerpoint presentation infographics clipart images. This is a two stage process. The stages in this process are total liabilities, total fixed assets, trade receivables, total assets, inventories.
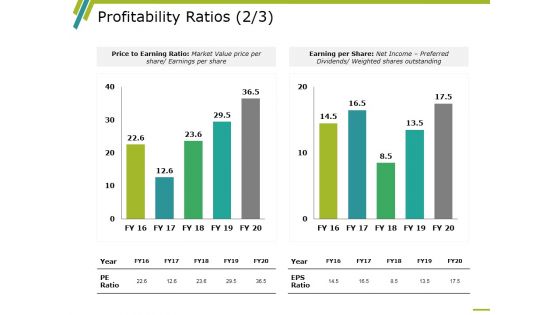
Profitability Ratios Template 4 Ppt PowerPoint Presentation Infographics Rules
This is a profitability ratios template 4 ppt powerpoint presentation infographics rules. This is a two stage process. The stages in this process are business, marketing, graph, price to earning ratio, earning per share.
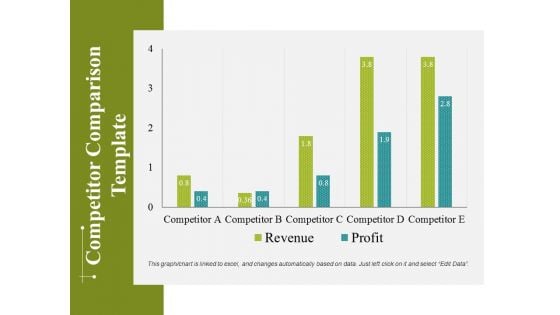
Competitor Comparison Template 2 Ppt PowerPoint Presentation Infographics Objects
This is a competitor comparison template 2 ppt powerpoint presentation infographics objects. This is a five stage process. The stages in this process are business, marketing, graph, finance, strategy.
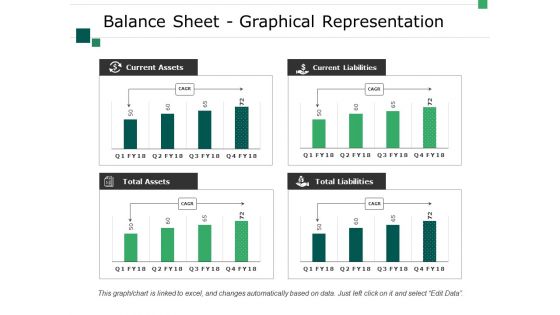
Balance Sheet Graphical Representation Ppt PowerPoint Presentation Infographics Layouts
This is a balance sheet graphical representation ppt powerpoint presentation infographics layouts. This is a four stage process. The stages in this process are business, current assets, total assets, total liabilities, current liabilities.
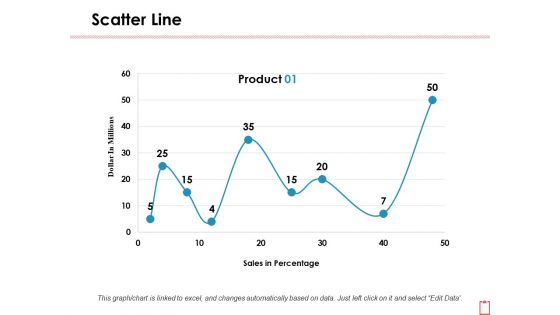
Scatter Line Ppt PowerPoint Presentation Infographics Background Images
This is a scatter line ppt powerpoint presentation infographics background images. This is a one stage process. The stages in this process are dollar in millions, product, sales in percentage.
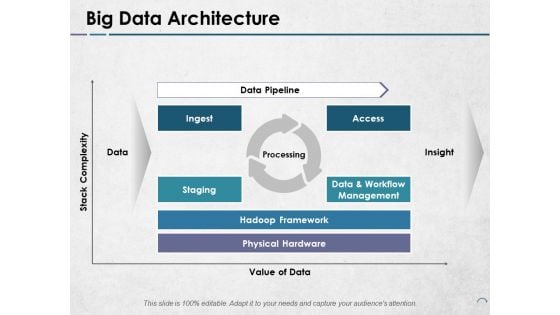
Big Data Architecture Ppt PowerPoint Presentation Infographics Design Inspiration
This is a big data architecture ppt powerpoint presentation infographics design inspiration. This is a four stage process. The stages in this process are data pipeline, processing, insight, value of data, staging.
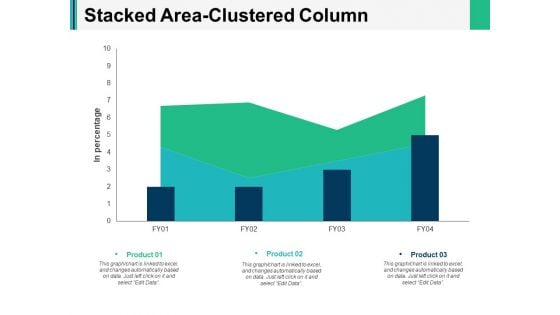
Stacked Area Clustered Column Ppt PowerPoint Presentation Infographics Backgrounds
This is a stacked area clustered column ppt powerpoint presentation infographics backgrounds. This is a three stage process. The stages in this process are finance, marketing, management, investment, analysis.
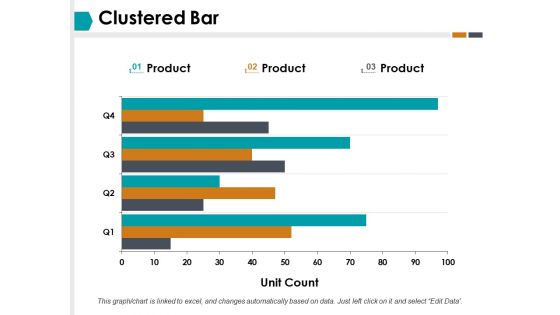
Clustered Bar Finance Ppt PowerPoint Presentation Infographics Graphics Template
This is a clustered bar finance ppt powerpoint presentation infographics graphics template. This is a three stage process. The stages in this process are clustered bar, finance, business, investment, marketing.
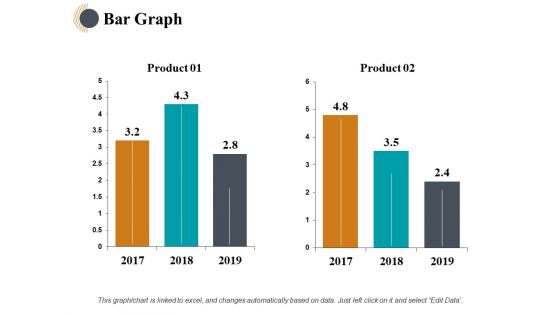
Bar Graph Finance Ppt PowerPoint Presentation Infographics Background Designs
This is a bar graph finance ppt powerpoint presentation infographics background designs. This is a two stage process. The stages in this process are finance, analysis, business, investment, marketing.
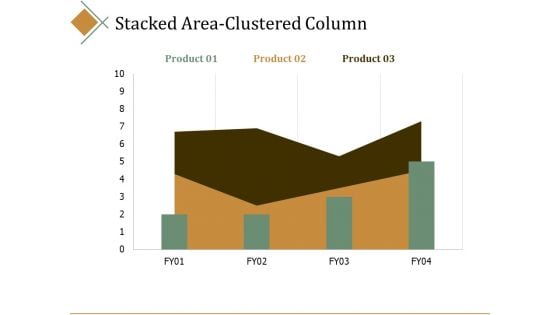
Stacked Area Clustered Column Ppt PowerPoint Presentation Infographics Portrait
This is a stacked area clustered column ppt powerpoint presentation infographics portrait. This is a three stage process. The stages in this process are percentage, product, business, management, marketing.
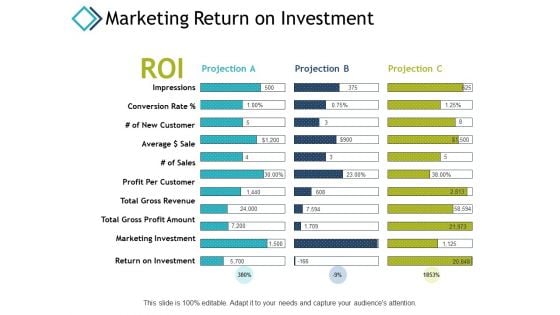
Marketing Return On Investment Ppt PowerPoint Presentation Infographics Files
This is a marketing return on investment ppt powerpoint presentation infographics files. This is a three stage process. The stages in this process are marketing investment, impressions, return on investment, finance, marketing.
Effective Management Virtual Teams Ppt PowerPoint Presentation Infographics Ideas Cpb
This is a effective management virtual teams ppt powerpoint presentation infographics ideas cpb. This is a six stage process. The stages in this process are effective management virtual teams.
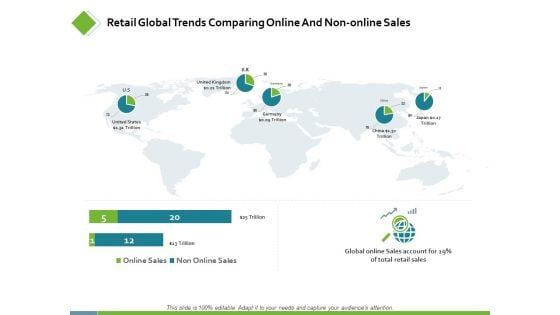
Retail Global Trends Comparing Online Ppt PowerPoint Presentation Infographics Guide
This is a retail global trends comparing online ppt powerpoint presentation infographics guide. This is a two stage process. The stages in this process are finance, analysis, business, investment, marketing.
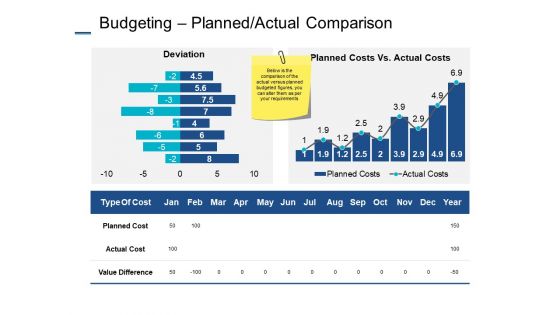
Budgeting Planned Actual Comparison Ppt PowerPoint Presentation Infographics Samples
This is a budgeting planned actual comparison ppt powerpoint presentation infographics samples. This is a two stage process. The stages in this process are deviation, planned cost, actual cost, value difference, planning.
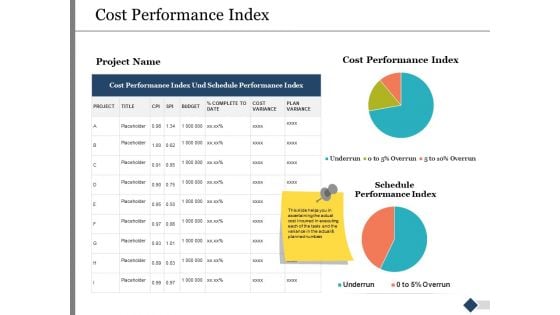
Cost Performance Index Ppt PowerPoint Presentation Infographics Mockup
This is a cost performance index ppt powerpoint presentation infographics mockup. This is a three stage process. The stages in this process are finance, marketing, management, investment, product, percentage.
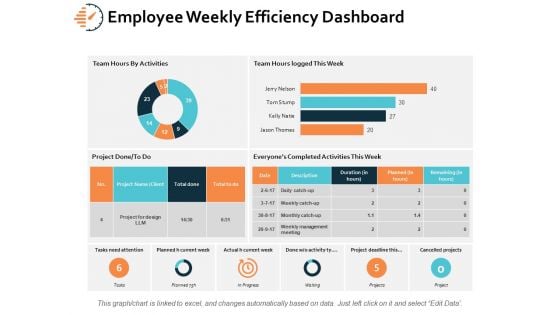
Employee Weekly Efficiency Dashboard Ppt PowerPoint Presentation Infographics Microsoft
This is a employee weekly efficiency dashboard ppt powerpoint presentation infographics microsoft. This is a six stage process. The stages in this process are finance, analysis, business, investment, marketing.

Stacked Column Percentage Product Ppt PowerPoint Presentation Infographics Outfit
This is a stacked column percentage product ppt powerpoint presentation infographics outfit. This is a two stage process. The stages in this process are marketing, business, management, percentage, product.
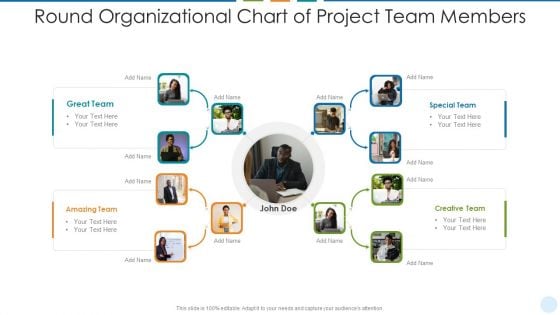
Round Organizational Chart Of Project Team Members Infographics PDF
Presenting round organizational chart of project team members infographics pdf to dispense important information. This template comprises four stages. It also presents valuable insights into the topics including amazing team, creative team, special team. This is a completely customizable PowerPoint theme that can be put to use immediately. So, download it and address the topic impactfully.
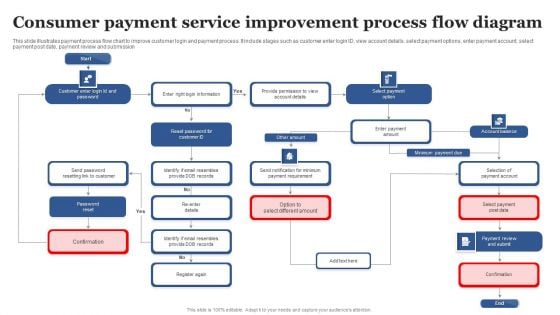
Consumer Payment Service Improvement Process Flow Diagram Infographics PDF
Presenting Consumer Payment Service Improvement Process Flow Diagram Infographics PDF to dispense important information. This template comprises One stage. It also presents valuable insights into the topics including Improvement Process, Flow Diagram. This is a completely customizable PowerPoint theme that can be put to use immediately. So, download it and address the topic impactfully.
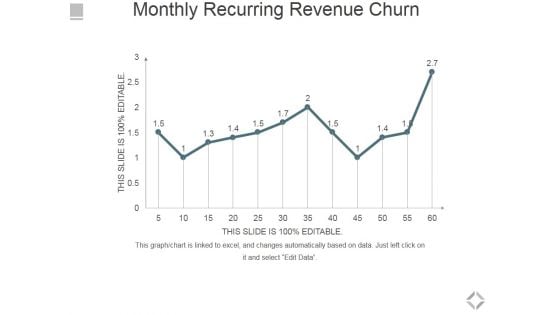
Monthly Recurring Revenue Churn Ppt PowerPoint Presentation Infographics Microsoft
This is a monthly recurring revenue churn ppt powerpoint presentation infographics microsoft. This is a one stage process. The stages in this process are bar graph, business, marketing, success, growth.
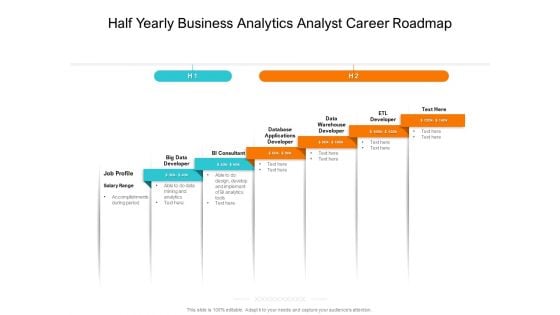
Half Yearly Business Analytics Analyst Career Roadmap Infographics
We present our half yearly business analytics analyst career roadmap infographics. This PowerPoint layout is easy-to-edit so you can change the font size, font type, color, and shape conveniently. In addition to this, the PowerPoint layout is Google Slides compatible, so you can share it with your audience and give them access to edit it. Therefore, download and save this well-researched half yearly business analytics analyst career roadmap infographics in different formats like PDF, PNG, and JPG to smoothly execute your business plan.
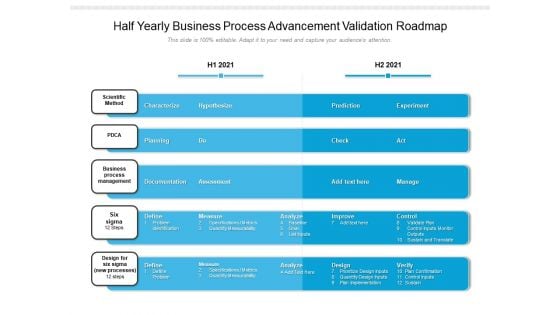
Half Yearly Business Process Advancement Validation Roadmap Infographics
We present our half yearly business process advancement validation roadmap infographics. This PowerPoint layout is easy-to-edit so you can change the font size, font type, color, and shape conveniently. In addition to this, the PowerPoint layout is Google Slides compatible, so you can share it with your audience and give them access to edit it. Therefore, download and save this well-researched half yearly business process advancement validation roadmap infographics in different formats like PDF, PNG, and JPG to smoothly execute your business plan.
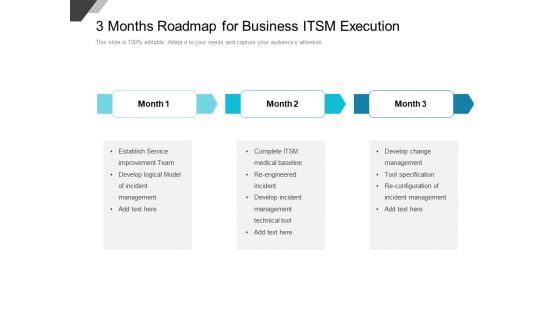
3 Months Roadmap For Business ITSM Execution Infographics
We present our 3 months roadmap for business itsm execution infographics. This PowerPoint layout is easy-to-edit so you can change the font size, font type, color, and shape conveniently. In addition to this, the PowerPoint layout is Google Slides compatible, so you can share it with your audience and give them access to edit it. Therefore, download and save this well-researched 3 months roadmap for business itsm execution infographics in different formats like PDF, PNG, and JPG to smoothly execute your business plan.
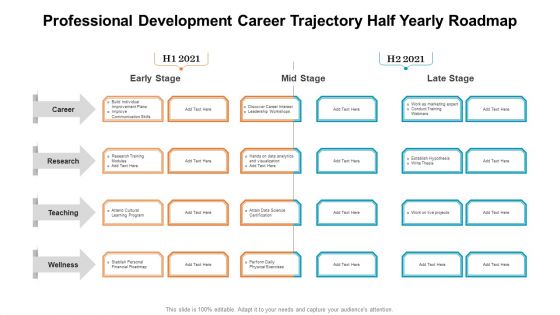
Professional Development Career Trajectory Half Yearly Roadmap Infographics
We present our professional development career trajectory half yearly roadmap infographics. This PowerPoint layout is easy-to-edit so you can change the font size, font type, color, and shape conveniently. In addition to this, the PowerPoint layout is Google Slides compatible, so you can share it with your audience and give them access to edit it. Therefore, download and save this well-researched professional development career trajectory half yearly roadmap infographics in different formats like PDF, PNG, and JPG to smoothly execute your business plan.
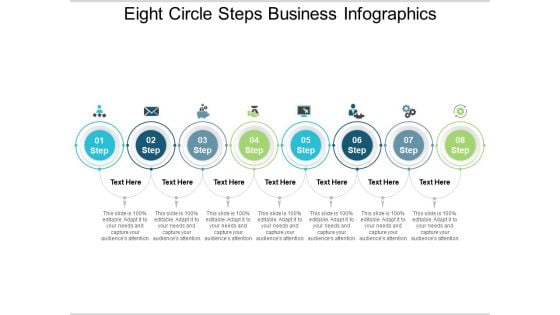
Eight Circle Steps Business Infographics Ppt PowerPoint Presentation Summary Slides
This is a eight circle steps business infographics ppt powerpoint presentation summary slides. This is a eight stage process. The stages in this process are 10 circle, 10 circular diagram, 10 cycle.
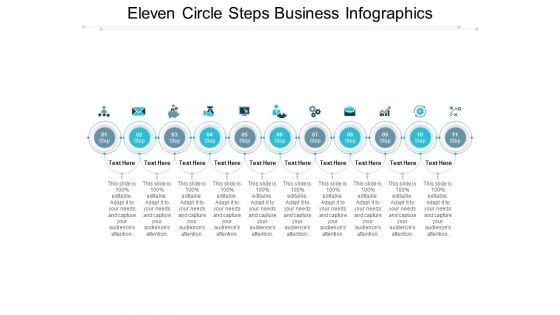
Eleven Circle Steps Business Infographics Ppt PowerPoint Presentation Layouts Example
This is a eleven circle steps business infographics ppt powerpoint presentation layouts example. This is a eleven stage process. The stages in this process are 10 circle, 10 circular diagram, 10 cycle.
Nine Circle Steps Business Infographics Ppt PowerPoint Presentation Shapes
This is a nine circle steps business infographics ppt powerpoint presentation shapes. This is a nine stage process. The stages in this process are 10 circle, 10 circular diagram, 10 cycle.
Ten Circle Steps Business Infographics Ppt PowerPoint Presentation Gallery Ideas
This is a ten circle steps business infographics ppt powerpoint presentation gallery ideas. This is a ten stage process. The stages in this process are 10 circle, 10 circular diagram, 10 cycle.
Twelve Circle Steps Business Infographics Ppt PowerPoint Presentation Gallery Information
This is a twelve circle steps business infographics ppt powerpoint presentation gallery information. This is a twelve stage process. The stages in this process are 10 circle, 10 circular diagram, 10 cycle.
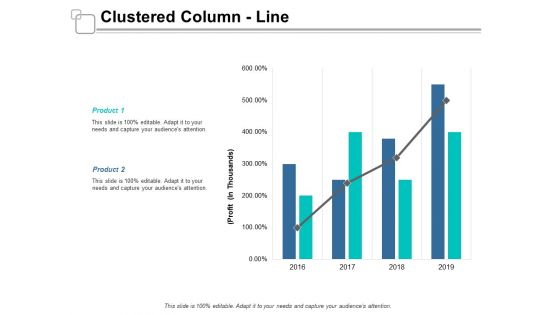
Clustered Column Line Ppt Powerpoint Presentation Infographics Show
This is a clustered column line ppt powerpoint presentation infographics show. The topics discussed in this diagram are finance, management, marketing, strategy, business. This is a completely editable PowerPoint presentation, and is available for immediate download.
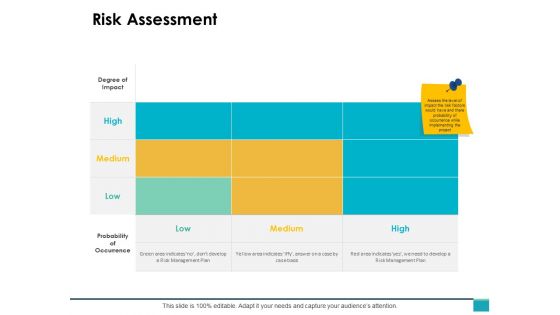
Risk Assessment Ppt PowerPoint Presentation Infographics Background Images
This is a risk assessment ppt powerpoint presentation infographics background images. The topics discussed in this diagram are business, management, marketing. This is a completely editable PowerPoint presentation, and is available for immediate download.
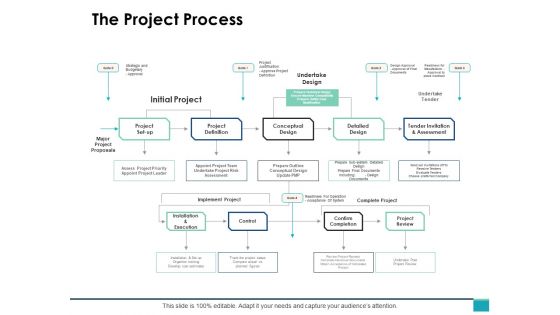
The Project Process Ppt PowerPoint Presentation Infographics Deck
This is a the project process ppt powerpoint presentation infographics deck. The topics discussed in this diagram are business, management, planning, strategy, marketing. This is a completely editable PowerPoint presentation, and is available for immediate download.
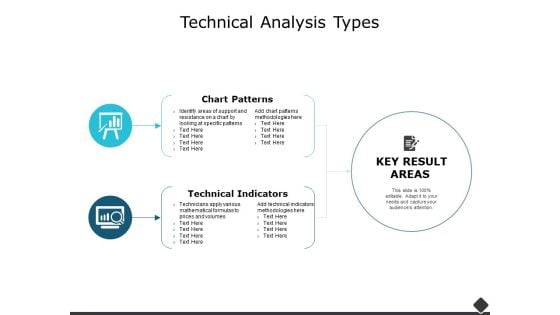
Technical Analysis Types Ppt PowerPoint Presentation Infographics Designs Download
This is a technical analysis types ppt powerpoint presentation infographics designs download. The topics discussed in this diagram are business, management, marketing. This is a completely editable PowerPoint presentation, and is available for immediate download.

Customer Purchase Stage Ppt PowerPoint Presentation Infographics Designs
This is a customer purchase stage ppt powerpoint presentation infographics designs. The topics discussed in this diagram are marketing, business, management, planning, strategy This is a completely editable PowerPoint presentation, and is available for immediate download.
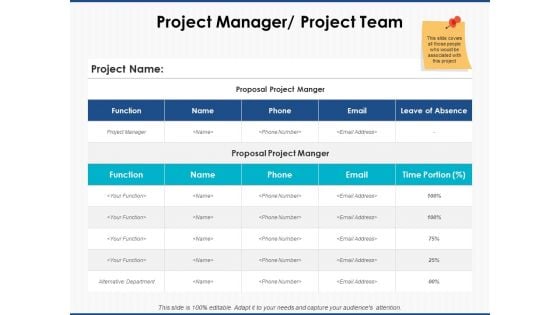
Project Manager Project Team Management Ppt PowerPoint Presentation Infographics Background
This is a project manager project team management ppt powerpoint presentation infographics background. The topics discussed in this diagram are marketing, business, management, planning, strategy This is a completely editable PowerPoint presentation, and is available for immediate download.
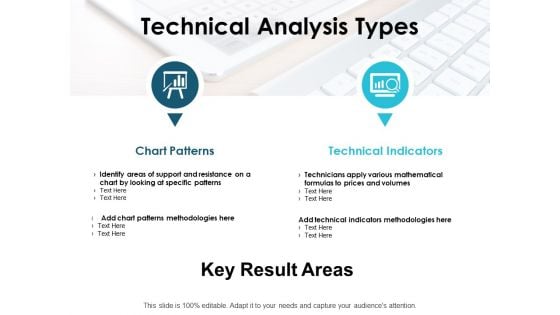
Technical Analysis Types Ppt PowerPoint Presentation Infographics Graphic Images
This is a technical analysis types ppt powerpoint presentation infographics graphic images. The topics discussed in this diagram are management, marketing, business, strategy, planning. This is a completely editable PowerPoint presentation, and is available for immediate download.
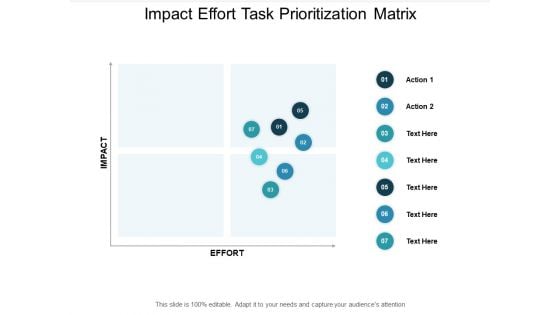
Impact Effort Task Prioritization Matrix Ppt PowerPoint Presentation Infographics Show
This is a impact effort task prioritization matrix ppt powerpoint presentation infographics show. The topics discussed in this diagram are priority matrix, responsibility matrix, action matrix. This is a completely editable PowerPoint presentation, and is available for immediate download.
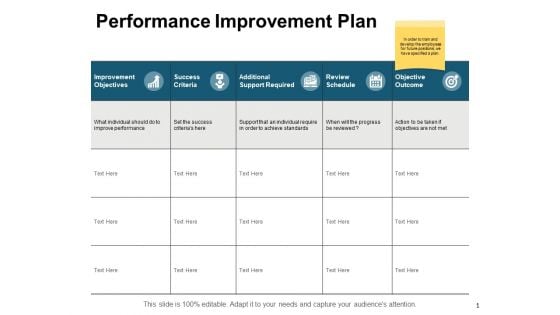
Performance Improvement Plan Ppt PowerPoint Presentation Infographics Microsoft
This is a performance improvement plan ppt powerpoint presentation infographics microsoft. The topics discussed in this diagram are marketing, business, management, planning, strategy This is a completely editable PowerPoint presentation, and is available for immediate download.
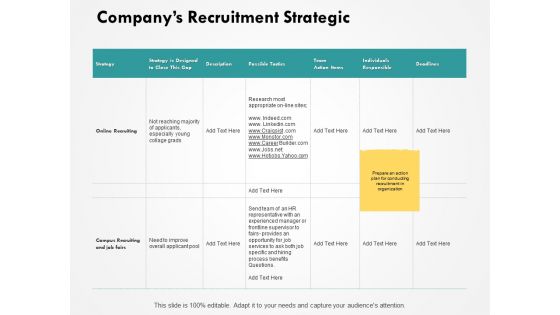
Companys Recruitment Strategic Ppt PowerPoint Presentation Infographics Skills
This is a companys recruitment strategic ppt powerpoint presentation infographics skills. The topics discussed in this diagram are management, marketing, business, strategy, planning. This is a completely editable PowerPoint presentation, and is available for immediate download.
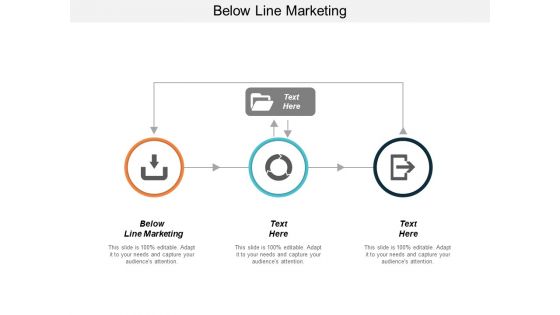
Below Line Marketing Ppt PowerPoint Presentation Infographics Deck Cpb
This is a below line marketing ppt powerpoint presentation infographics deck cpb. The topics discussed in this diagram are below line marketing. This is a completely editable PowerPoint presentation and is available for immediate download.
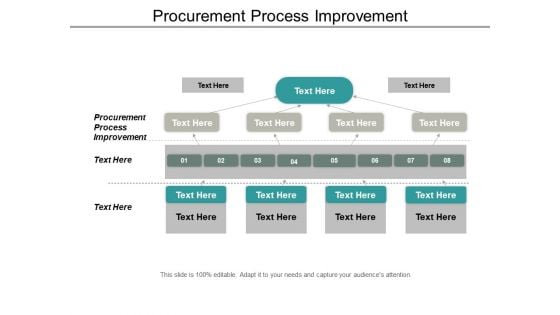
Procurement Process Improvement Ppt PowerPoint Presentation Infographics Rules Cpb
This is a procurement process improvement ppt powerpoint presentation infographics rules cpb. The topics discussed in this diagram are procurement process improvement. This is a completely editable PowerPoint presentation, and is available for immediate download.

Assortment Of Colourful Candies Ppt Powerpoint Presentation Infographics Visuals
This is a assortment of colourful candies ppt powerpoint presentation infographics visuals. The topics discussed in this diagram are christmas, candy cane, cane shaped stick. This is a completely editable PowerPoint presentation, and is available for immediate download.
Our Goal And Targets Ppt PowerPoint Presentation Infographics Designs
This is a our goal and targets ppt powerpoint presentation infographics designs. The topics discussed in this diagram are marketing, business, management, planning, strategy This is a completely editable PowerPoint presentation and is available for immediate download.
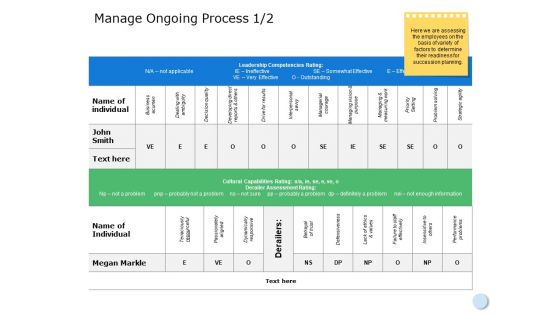
Manage Ongoing Process Ppt PowerPoint Presentation Infographics Background Image
This is a manage ongoing process ppt powerpoint presentation infographics background image. The topics discussed in this diagram are compare, marketing, business, management, planning. This is a completely editable PowerPoint presentation, and is available for immediate download.
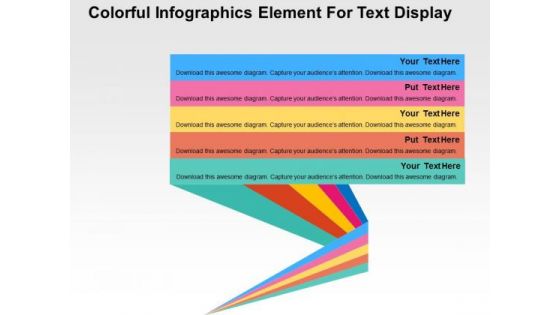
Colorful Infographics Element For Text Display PowerPoint Templates
Our above slide has a theme of colorful text boxes. This Infographics slide is best to describe text I information. You can provide a fantastic explanation of the topic with this slide.
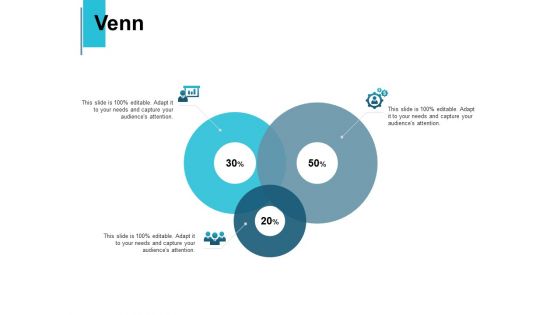
Venn Audiences Attention Ppt PowerPoint Presentation Infographics Deck
Presenting this set of slides with name venn audiences attention ppt powerpoint presentation infographics deck. This is a three stage process. The stages in this process are venn, sales review, marketing, strategy, planning. This is a completely editable PowerPoint presentation and is available for immediate download. Download now and impress your audience.
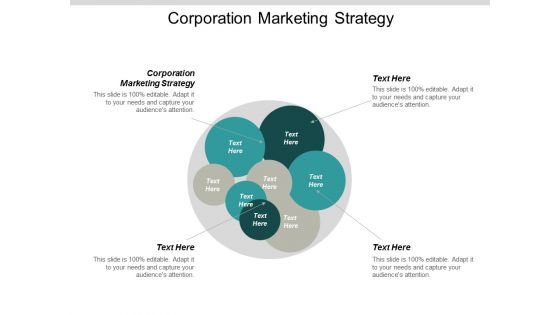
Corporation Marketing Strategy Ppt Powerpoint Presentation Infographics Graphics Pictures Cpb
Presenting this set of slides with name corporation marketing strategy ppt powerpoint presentation infographics graphics pictures cpb. This is a four stage process. The stages in this process are corporation marketing strategy. This is a completely editable PowerPoint presentation and is available for immediate download. Download now and impress your audience.
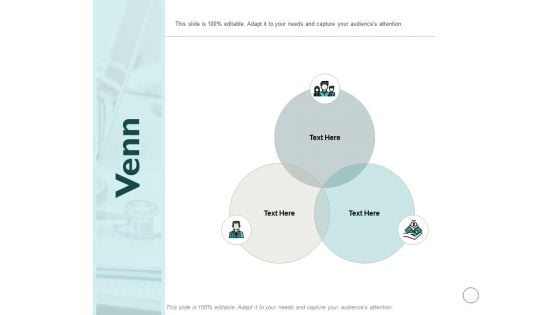
Venn Sales Marketing Ppt PowerPoint Presentation Infographics Graphics Design
Presenting this set of slides with name venn sales marketing ppt powerpoint presentation infographics graphics design. This is a three stage process. The stages in this process are venn, sales, marketing, strategy, management. This is a completely editable PowerPoint presentation and is available for immediate download. Download now and impress your audience.
Venn Sales Review Ppt PowerPoint Presentation Infographics Vector
Presenting this set of slides with name venn sales review ppt powerpoint presentation infographics vector. This is a four stage process. The stages in this process are venn, sales review, marketing, strategy, planning. This is a completely editable PowerPoint presentation and is available for immediate download. Download now and impress your audience.
Venn Sales Marketing Ppt PowerPoint Presentation Infographics Gallery
Presenting this set of slides with name venn sales marketing ppt powerpoint presentation infographics gallery. This is a four stage process. The stages in this process are venn, sales, marketing, management, strategy. This is a completely editable PowerPoint presentation and is available for immediate download. Download now and impress your audience.

Venn Innovation Growth Ppt PowerPoint Presentation Infographics Information
Presenting this set of slides with name venn innovation growth ppt powerpoint presentation infographics information. This is a three stage process. The stages in this process are venn, marketing, strategy, planning, management. This is a completely editable PowerPoint presentation and is available for immediate download. Download now and impress your audience.
Venn Marketing Sales Ppt PowerPoint Presentation Infographics Graphics Example
Presenting this set of slides with name venn marketing sales ppt powerpoint presentation infographics graphics example. This is a four stage process. The stages in this process are venn, marketing, sales, management, marketing. This is a completely editable PowerPoint presentation and is available for immediate download. Download now and impress your audience.
Venn Sales Marketing Ppt PowerPoint Presentation Infographics Show
Presenting this set of slides with name venn sales marketing ppt powerpoint presentation infographics show. This is a three stage process. The stages in this process are venn, sales, marketing, management, strategy. This is a completely editable PowerPoint presentation and is available for immediate download. Download now and impress your audience.
Venn Sales Marketing Ppt PowerPoint Presentation Infographics Example Introduction
Presenting this set of slides with name venn sales marketing ppt powerpoint presentation infographics example introduction. This is a three stage process. The stages in this process are venn, sales, marketing, management, strategy. This is a completely editable PowerPoint presentation and is available for immediate download. Download now and impress your audience.
Venn Sales Marketing Ppt PowerPoint Presentation Infographics Objects
Presenting this set of slides with name venn sales marketing ppt powerpoint presentation infographics objects. This is a four stage process. The stages in this process are venn. This is a completely editable PowerPoint presentation and is available for immediate download. Download now and impress your audience.
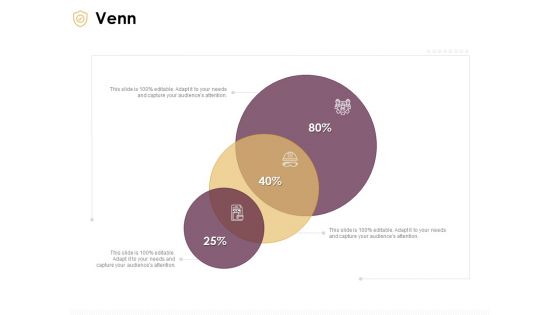
Preventive Measures Workplace Venn Ppt Show Infographics PDF
Presenting this set of slides with name preventive measures workplace venn ppt show infographics pdf. This is a three stage process. The stages in this process are venn. This is a completely editable PowerPoint presentation and is available for immediate download. Download now and impress your audience.

Waterfall Project Prioritization Methodology Venn Ppt Infographics Visual Aids PDF
Presenting this set of slides with name waterfall project prioritization methodology venn ppt infographics visual aids pdf. This is a four stage process. The stages in this process are venn. This is a completely editable PowerPoint presentation and is available for immediate download. Download now and impress your audience.
Firm Productivity Administration Venn Ppt PowerPoint Presentation Infographics Outfit PDF
Presenting this set of slides with name firm productivity administration venn ppt powerpoint presentation infographics outfit pdf. This is a ten stage process. The stages in this process are venn. This is a completely editable PowerPoint presentation and is available for immediate download. Download now and impress your audience.
Eco Friendly And Feasibility Management Venn Infographics PDF
Presenting eco friendly and feasibility management venn infographics pdf. to provide visual cues and insights. Share and navigate important information on three stages that need your due attention. This template can be used to pitch topics like venn. In addtion, this PPT design contains high-resolution images, graphics, etc, that are easily editable and available for immediate download.
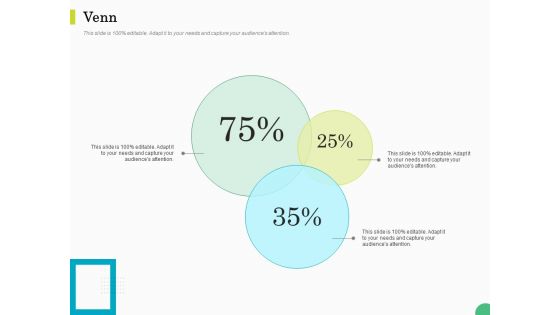
Evaluating Rank Prospects Venn Ppt File Infographics PDF
This is a evaluating rank prospects venn ppt file infographics pdf template with various stages. Focus and dispense information on three stages using this creative set, that comes with editable features. It contains large content boxes to add your information on topics like venn. You can also showcase facts, figures, and other relevant content using this PPT layout. Grab it now.
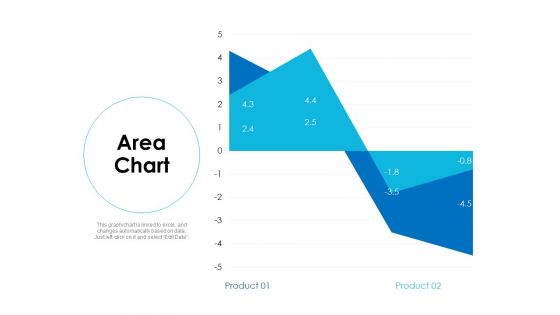
Area Chart Analysis Ppt Powerpoint Presentation Infographics Aids
Presenting this set of slides with name area chart analysis ppt powerpoint presentation infographics aids. The topics discussed in these slides are area chart, finance, marketing, investment, analysis. This is a completely editable PowerPoint presentation and is available for immediate download. Download now and impress your audience.
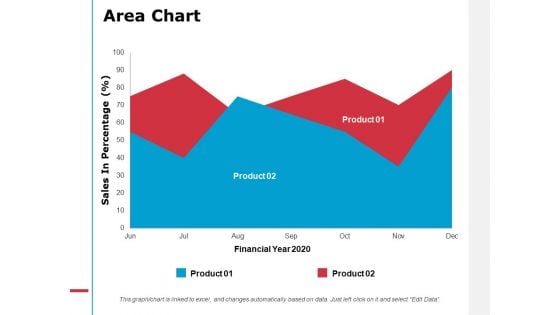
Area Chart Analysis Ppt PowerPoint Presentation Infographics Deck
Presenting this set of slides with name area chart analysis ppt powerpoint presentation infographics deck. The topics discussed in these slides are area chart. This is a completely editable PowerPoint presentation and is available for immediate download. Download now and impress your audience.
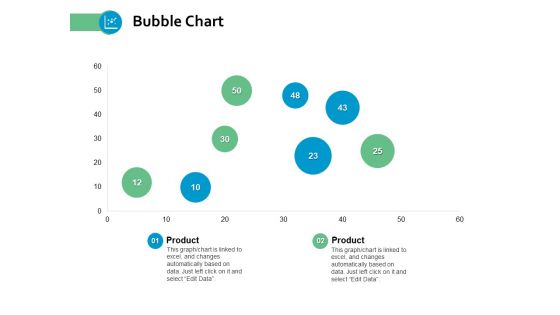
Bubble Chart Investment Ppt Powerpoint Presentation Infographics Guidelines
Presenting this set of slides with name bubble chart investment ppt powerpoint presentation infographics guidelines. The topics discussed in these slide is bubble chart. This is a completely editable PowerPoint presentation and is available for immediate download. Download now and impress your audience.
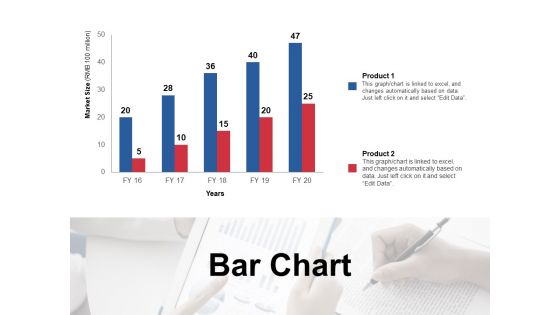
Bar Chart Analysis Ppt PowerPoint Presentation Infographics Example Introduction
Presenting this set of slides with name bar chart analysis ppt powerpoint presentation infographics example introduction. The topics discussed in these slide is bar chart. This is a completely editable PowerPoint presentation and is available for immediate download. Download now and impress your audience.
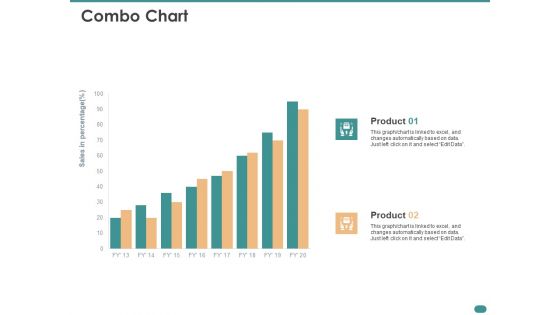
Configuration Management With Puppet Combo Chart Ppt Infographics Sample PDF
Presenting this set of slides with name configuration management with puppet combo chart ppt infographics sample pdf. The topics discussed in these slide is combo chart. This is a completely editable PowerPoint presentation and is available for immediate download. Download now and impress your audience.
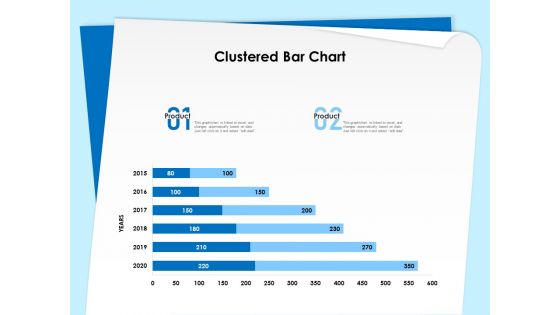
Executive Leadership Programs Clustered Bar Chart Ppt Infographics Guide PDF
Presenting this set of slides with name executive leadership programs clustered bar chart ppt infographics guide pdf. The topics discussed in these slides are clustered bar chart, 2015 to 2020. This is a completely editable PowerPoint presentation and is available for immediate download. Download now and impress your audience.
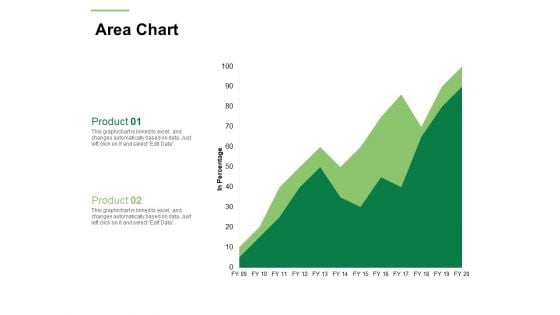
Business Working Condition Area Chart Ppt Professional Infographics PDF
Presenting this set of slides with name business working condition area chart ppt professional infographics pdf. The topics discussed in these slide is area chart. This is a completely editable PowerPoint presentation and is available for immediate download. Download now and impress your audience.
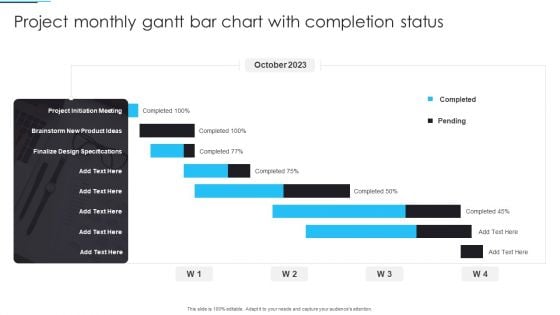
Project Monthly Gantt Bar Chart With Completion Status Infographics PDF
Pitch your topic with ease and precision using this Project Monthly Gantt Bar Chart With Completion Status Infographics PDF. This layout presents information on Project, Monthly Gantt Bar Chart. It is also available for immediate download and adjustment. So, changes can be made in the color, design, graphics or any other component to create a unique layout.
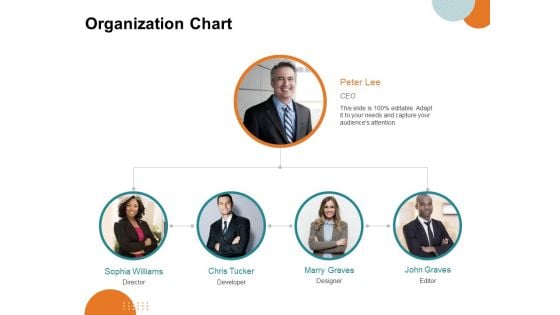
Key Product Distribution Channels Organization Chart Ppt Styles Infographics PDF
Presenting this set of slides with name key product distribution channels organization chart ppt styles infographics pdf. This is a five stage process. The stages in this process are organization chart. This is a completely editable PowerPoint presentation and is available for immediate download. Download now and impress your audience.
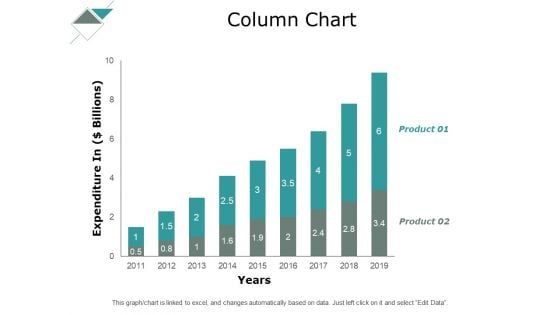
Column Chart Analysis Ppt PowerPoint Presentation Infographics Layout
Presenting this set of slides with name column chart analysis ppt powerpoint presentation infographics layout. The topics discussed in these slides are finance, marketing, management, investment, analysis. This is a completely editable PowerPoint presentation and is available for immediate download. Download now and impress your audience.
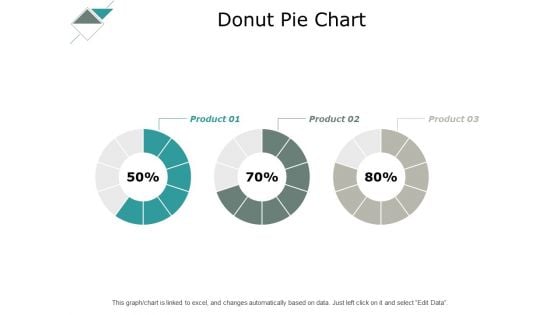
Donut Pie Chart Analysis Ppt PowerPoint Presentation Infographics Maker
Presenting this set of slides with name donut pie chart analysis ppt powerpoint presentation infographics maker. The topics discussed in these slides are finance, marketing, management, investment, analysis. This is a completely editable PowerPoint presentation and is available for immediate download. Download now and impress your audience.
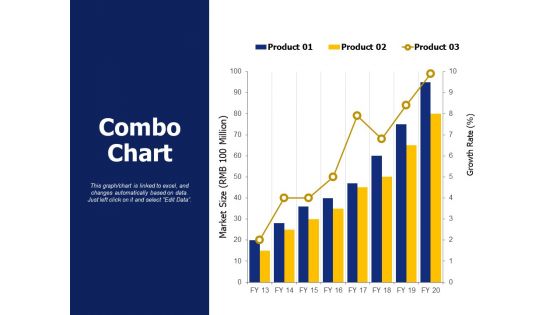
Combo Chart Investment Ppt PowerPoint Presentation Infographics Graphics
Presenting this set of slides with name combo chart investment ppt powerpoint presentation infographics graphics. The topics discussed in these slides are market size, growth rate. This is a completely editable PowerPoint presentation and is available for immediate download. Download now and impress your audience.
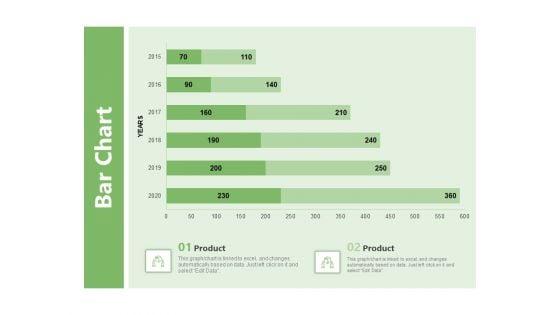
Raising Funds Company Bar Chart Ppt Infographics Deck PDF
Presenting this set of slides with name raising funds company bar chart ppt infographics deck pdf. The topics discussed in these slides are product 1, product 2. This is a completely editable PowerPoint presentation and is available for immediate download. Download now and impress your audience.
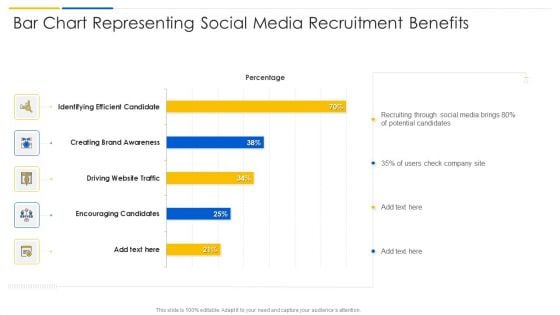
Bar Chart Representing Social Media Recruitment Benefits Infographics PDF
Pitch your topic with ease and precision using this bar chart representing social media recruitment benefits infographics pdf. This layout presents information on encouraging candidates, driving website traffic, creating brand awareness. It is also available for immediate download and adjustment. So, changes can be made in the color, design, graphics or any other component to create a unique layout.
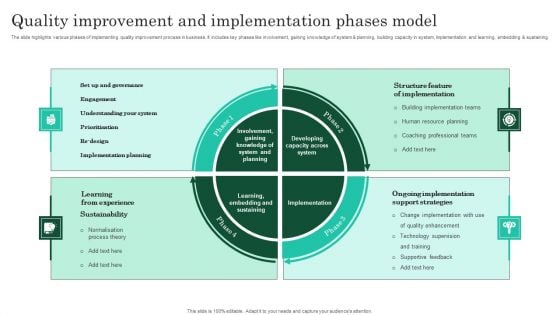
Quality Improvement And Implementation Phases Model Infographics PDF
The slide highlights various phases of implementing quality improvement process in business. It includes key phases like involvement, gaining knowledge of system and planning, building capacity in system, implementation and learning, embedding and sustaining. Presenting Quality Improvement And Implementation Phases Model Infographics PDF to dispense important information. This template comprises four stages. It also presents valuable insights into the topics including Structure Feature Of Implementation, Ongoing Implementation Support Strategies, Implementation Planning. This is a completely customizable PowerPoint theme that can be put to use immediately. So, download it and address the topic impactfully.
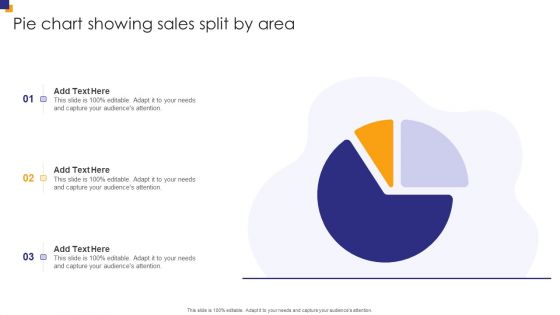
Pie Chart Showing Sales Split By Area Infographics PDF
Pitch your topic with ease and precision using this Pie Chart Showing Sales Split By Area Infographics PDF. This layout presents information on Pie Chart Showing, Sales Split Area. It is also available for immediate download and adjustment. So, changes can be made in the color, design, graphics or any other component to create a unique layout.
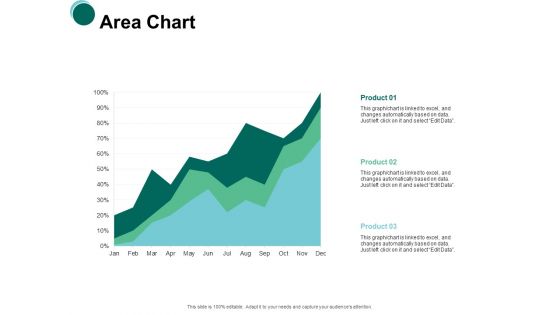
Area Chart Graph Ppt PowerPoint Presentation Infographics Slide Download
Presenting this set of slides with name area chart graph ppt powerpoint presentation infographics slide download. The topics discussed in these slides are marketing, business, management, planning, strategy. This is a completely editable PowerPoint presentation and is available for immediate download. Download now and impress your audience.

Donut Pie Chart Finance Ppt PowerPoint Presentation Infographics Slides
Presenting this set of slides with name donut pie chart finance ppt powerpoint presentation infographics slides. This is a four stage process. The stages in this process are finance, marketing, management, investment, analysis. This is a completely editable PowerPoint presentation and is available for immediate download. Download now and impress your audience.
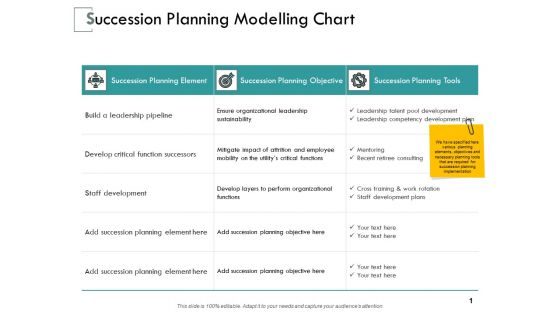
Succession Planning Modelling Chart Ppt PowerPoint Presentation Infographics Slide Portrait
Presenting this set of slides with name succession planning modelling chart ppt powerpoint presentation infographics slide portrait. The topics discussed in these slides are succession, planning, organizational, leadership, sustainability . This is a completely editable PowerPoint presentation and is available for immediate download. Download now and impress your audience.
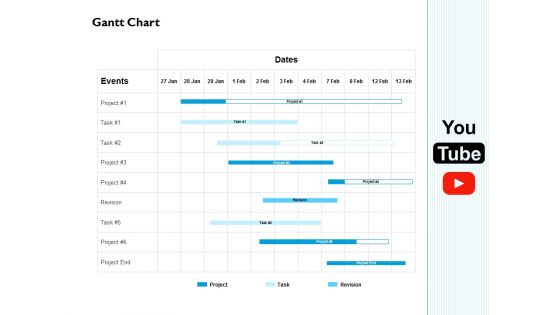
Gantt Chart Management Ppt PowerPoint Presentation Infographics Graphics Pictures
Presenting this set of slides with name gantt chart management ppt powerpoint presentation infographics graphics pictures. The topics discussed in these slides are business, management, planning, strategy, marketing. This is a completely editable PowerPoint presentation and is available for immediate download. Download now and impress your audience.
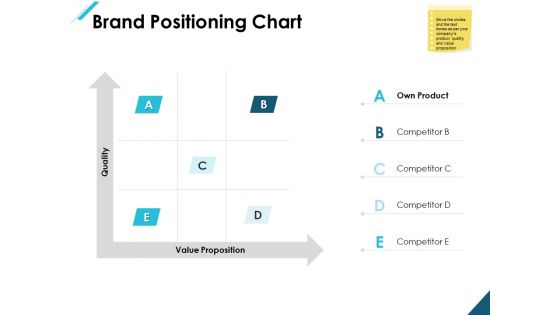
Brand Positioning Chart Ppt PowerPoint Presentation Infographics Layout
Presenting this set of slides with name brand positioning chart ppt powerpoint presentation infographics layout. This is a five stage process. The stages in this process are brand positioning, business, management, planning, strategy. This is a completely editable PowerPoint presentation and is available for immediate download. Download now and impress your audience.
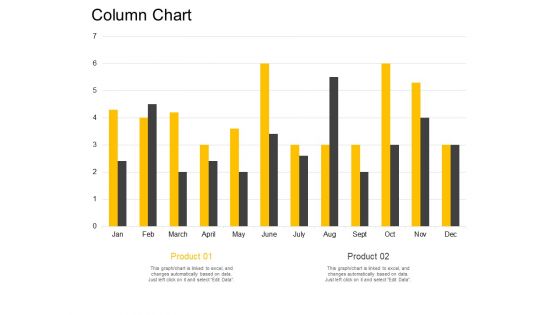
Column Chart Bar Ppt PowerPoint Presentation Infographics Slide Download
Presenting this set of slides with name column chart bar ppt powerpoint presentation infographics slide download. The topics discussed in these slides are marketing, business, management, planning, strategy. This is a completely editable PowerPoint presentation and is available for immediate download. Download now and impress your audience.
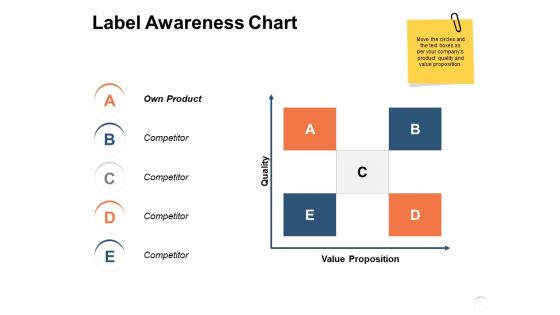
Label Awareness Chart Ppt PowerPoint Presentation Infographics Pictures
Presenting this set of slides with name label awareness chart ppt powerpoint presentation infographics pictures. This is a five stage process. The stages in this process are quality, value proposition, competitor. This is a completely editable PowerPoint presentation and is available for immediate download. Download now and impress your audience.
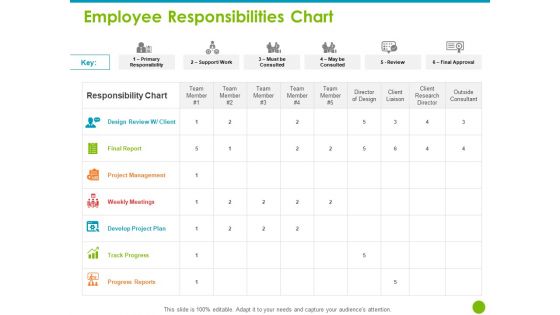
Project Capabilities Employee Responsibilities Chart Ppt Infographics File Formats PDF
Presenting this set of slides with name project capabilities employee responsibilities chart ppt infographics file formats pdf. The topics discussed in these slides are progress reports, track progress, develop project plan, weekly meetings, project management, final report. This is a completely editable PowerPoint presentation and is available for immediate download. Download now and impress your audience.
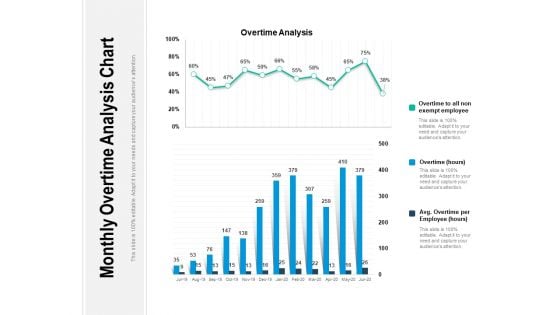
Monthly Overtime Analysis Chart Ppt PowerPoint Presentation File Infographics PDF
Showcasing this set of slides titled monthly overtime analysis chart ppt powerpoint presentation file infographics pdf. The topics addressed in these templates are analysis, employee, overtime. All the content presented in this PPT design is completely editable. Download it and make adjustments in color, background, font etc. as per your unique business setting.
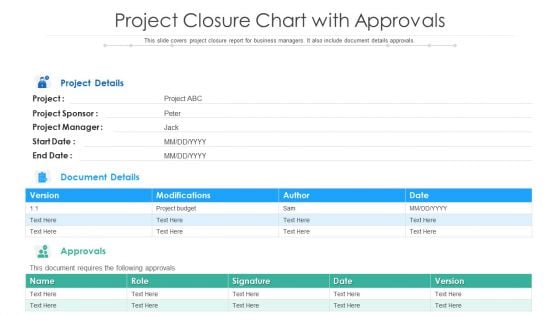
Project Closure Chart With Approvals Ppt Infographics Ideas PDF
Showcasing this set of slides titled project closure chart with approvals ppt infographics ideas pdf. The topics addressed in these templates are project details, document details, approvals. All the content presented in this PPT design is completely editable. Download it and make adjustments in color, background, font etc. as per your unique business setting.
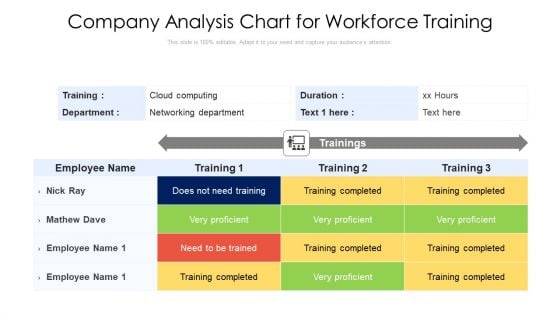
Company Analysis Chart For Workforce Training Ppt Infographics Show PDF
Showcasing this set of slides titled company analysis chart for workforce training ppt infographics show pdf. The topics addressed in these templates are cloud computing, duration, employee. All the content presented in this PPT design is completely editable. Download it and make adjustments in color, background, font etc. as per your unique business setting.
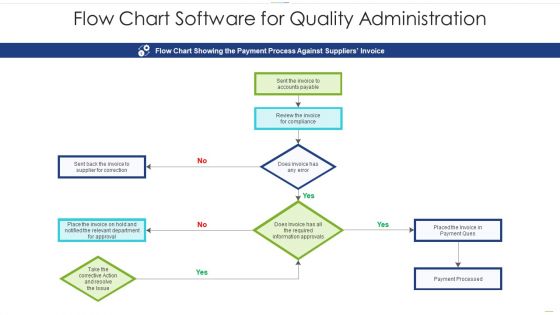
Flow Chart Software For Quality Administration Infographics PDF
Showcasing this set of slides titled flow chart software for quality administration infographics pdf. The topics addressed in these templates are information, required, payment. All the content presented in this PPT design is completely editable. Download it and make adjustments in color, background, font etc. as per your unique business setting.
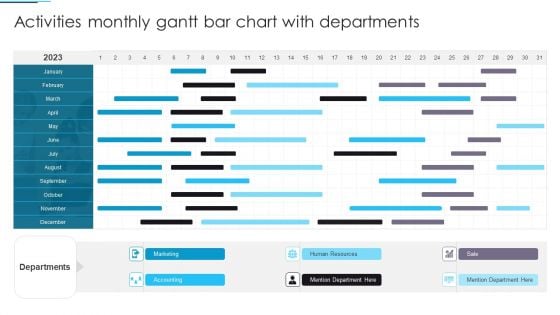
Activities Monthly Gantt Bar Chart With Departments Infographics PDF
Showcasing this set of slides titled Activities Monthly Gantt Bar Chart With Departments Infographics PDF. The topics addressed in these templates are Marketing, Accounting, Human Resources. All the content presented in this PPT design is completely editable. Download it and make adjustments in color, background, font etc. as per your unique business setting.
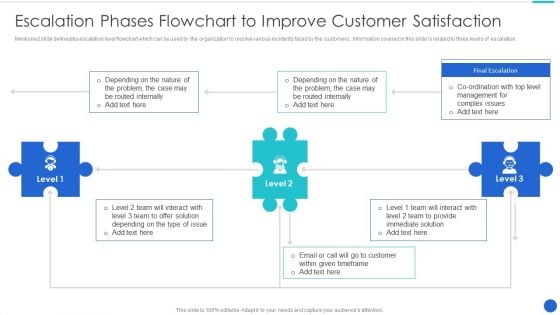
Escalation Phases Flowchart To Improve Customer Satisfaction Infographics PDF
Mentioned slide delineates escalation level flowchart which can be used by the organization to resolve various incidents faced by the customers . Information covered in this slide is related to three levels of escalation.Presenting Escalation Phases Flowchart To Improve Customer Satisfaction Infographics PDF to dispense important information. This template comprises three stages. It also presents valuable insights into the topics including Final Escalation, Immediate Solution, Routed Internally This is a completely customizable PowerPoint theme that can be put to use immediately. So, download it and address the topic impactfully.
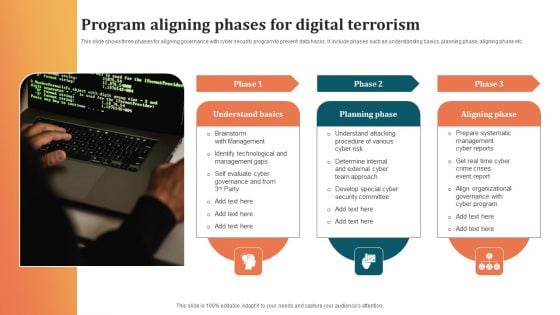
Program Aligning Phases For Digital Terrorism Infographics PDF
This slide shows three phases for aligning governance with cyber security program to prevent data hacks. It include phases such as understanding basics, planning phase, aligning phase etc. Persuade your audience using this Program Aligning Phases For Digital Terrorism Infographics PDF. This PPT design covers three stages, thus making it a great tool to use. It also caters to a variety of topics including Planning Phase, Aligning Phase, Understand Basics. Download this PPT design now to present a convincing pitch that not only emphasizes the topic but also showcases your presentation skills.
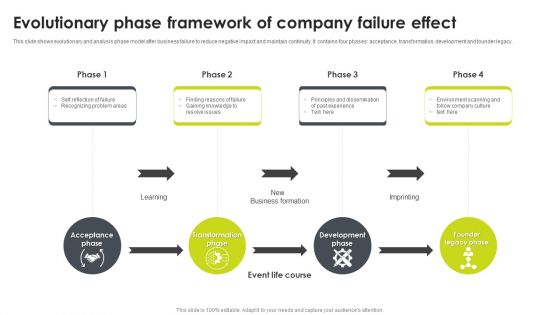
Evolutionary Phase Framework Of Company Failure Effect Infographics PDF
This slide shows evolutionary and analysis phase model after business failure to reduce negative impact and maintain continuity. It contains four phases acceptance, transformation, development and founder legacy. Persuade your audience using this Evolutionary Phase Framework Of Company Failure Effect Infographics PDF. This PPT design covers four stages, thus making it a great tool to use. It also caters to a variety of topics including Business Formation, Development Phase, Transformation Phase. Download this PPT design now to present a convincing pitch that not only emphasizes the topic but also showcases your presentation skills.
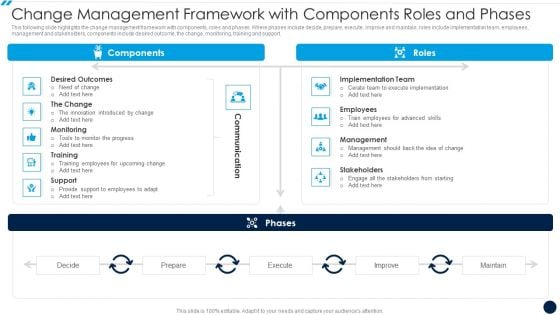
Change Management Framework With Components Roles And Phases Infographics PDF
This following slide highlights the change management framework with components, roles and phases. Where phases include decide, prepare, execute, improve and maintain, roles include implementation team, employees, management and stakeholders, components include desired outcome, the change, monitoring, training and support. Persuade your audience using this Change Management Framework With Components Roles And Phases Infographics PDF. This PPT design covers two stages, thus making it a great tool to use. It also caters to a variety of topics including Components, Roles. Download this PPT design now to present a convincing pitch that not only emphasizes the topic but also showcases your presentation skills.
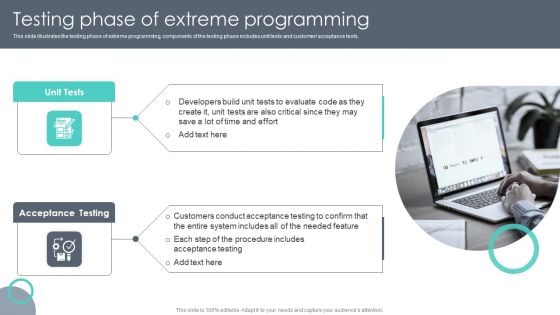
Extreme Programming Methodology Testing Phase Of Extreme Programming Infographics PDF
This slide illustrates the testing phase of extreme programming, components of the testing phase includes unit tests and customer or acceptance tests. The best PPT templates are a great way to save time, energy, and resources. Slidegeeks have 100 percent editable powerpoint slides making them incredibly versatile. With these quality presentation templates, you can create a captivating and memorable presentation by combining visually appealing slides and effectively communicating your message. Download Extreme Programming Methodology Testing Phase Of Extreme Programming Infographics PDF from Slidegeeks and deliver a wonderful presentation.
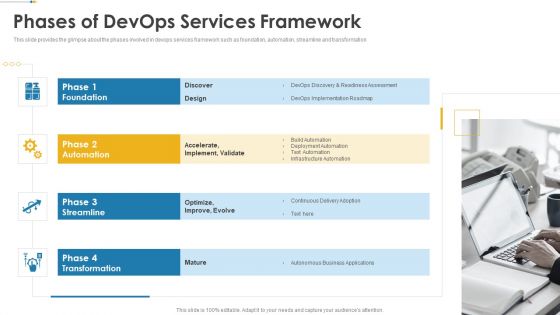
IT Operations Automation Phases Of Devops Services Framework Infographics PDF
This slide provides the glimpse about the phases involved in devops services framework such as foundation, automation, streamline and transformation This is a It operations automation phases of devops services framework infographics pdf template with various stages. Focus and dispense information on four stages using this creative set, that comes with editable features. It contains large content boxes to add your information on topics like accelerate, implement validate, devops implementation roadmap, autonomous business applications. You can also showcase facts, figures, and other relevant content using this PPT layout. Grab it now.
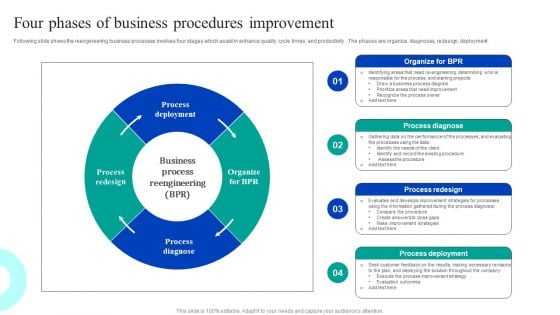
Four Phases Of Business Procedures Improvement Infographics PDF
Following slide shows the reengineering business processes involves four stages which assist in enhance quality, cycle times, and productivity . The phases are organize, diagnoses, redesign, deployment. Persuade your audience using this Four Phases Of Business Procedures Improvement Infographics PDF. This PPT design covers four stages, thus making it a great tool to use. It also caters to a variety of topics including Process Diagnose, Process Redesign, Process Deployment. Download this PPT design now to present a convincing pitch that not only emphasizes the topic but also showcases your presentation skills.
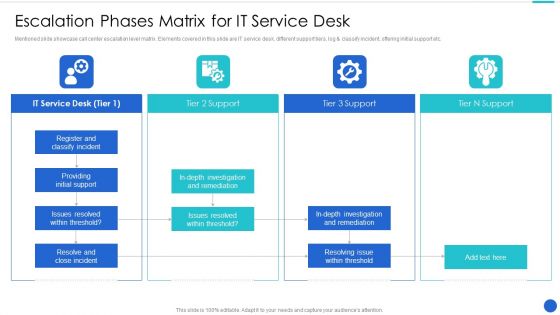
Escalation Phases Matrix For IT Service Desk Infographics PDF
Mentioned slide showcase call center escalation level matrix. Elements covered in this slide are IT service desk, different support tiers, log and classify incident, offering initial support etc. Persuade your audience using this Escalation Phases Matrix For IT Service Desk Infographics PDF This PPT design covers four stages, thus making it a great tool to use. It also caters to a variety of topics including Classify Incident, Resolve Incident, Investigation Remediation Download this PPT design now to present a convincing pitch that not only emphasizes the topic but also showcases your presentation skills.
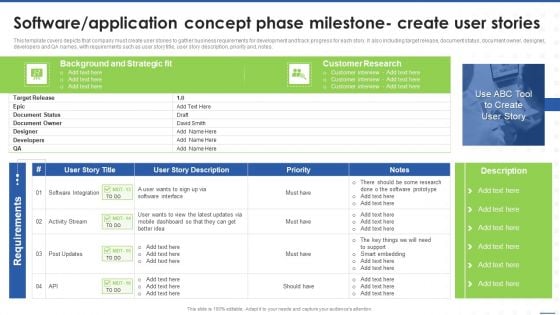
Software Application Concept Phase Milestone Create User Stories Infographics PDF
This template covers depicts that company must create user stories to gather business requirements for development and track progress for each story. It also including target release, document status, document owner, designer, developers and QA names, with requirements such as user story title, user story description, priority and, notes.Deliver and pitch your topic in the best possible manner with this Software Application Concept Phase Milestone Create User Stories Infographics PDF. Use them to share invaluable insights on Software Integration, Smart Embedding, Customer Interview and impress your audience. This template can be altered and modified as per your expectations. So, grab it now.
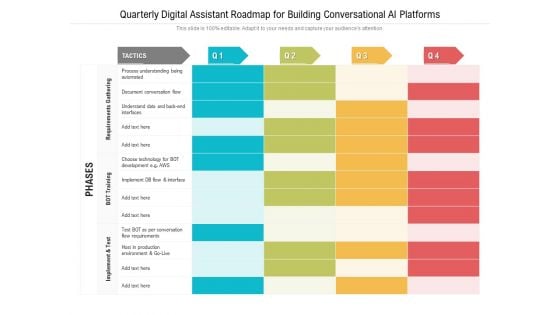
Quarterly Digital Assistant Roadmap For Building Conversational AI Platforms Infographics
We present our quarterly digital assistant roadmap for building conversational ai platforms infographics. This PowerPoint layout is easy-to-edit so you can change the font size, font type, color, and shape conveniently. In addition to this, the PowerPoint layout is Google Slides compatible, so you can share it with your audience and give them access to edit it. Therefore, download and save this well-researched quarterly digital assistant roadmap for building conversational ai platforms infographics in different formats like PDF, PNG, and JPG to smoothly execute your business plan.
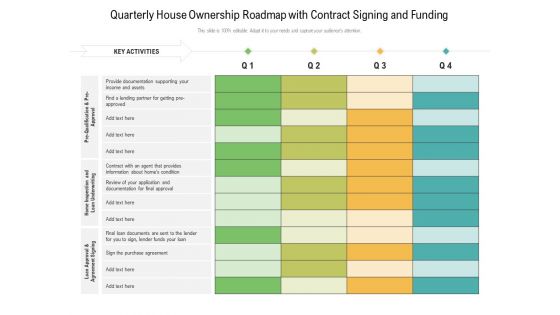
Quarterly House Ownership Roadmap With Contract Signing And Funding Infographics
We present our quarterly house ownership roadmap with contract signing and funding infographics. This PowerPoint layout is easy-to-edit so you can change the font size, font type, color, and shape conveniently. In addition to this, the PowerPoint layout is Google Slides compatible, so you can share it with your audience and give them access to edit it. Therefore, download and save this well-researched quarterly house ownership roadmap with contract signing and funding infographics in different formats like PDF, PNG, and JPG to smoothly execute your business plan.
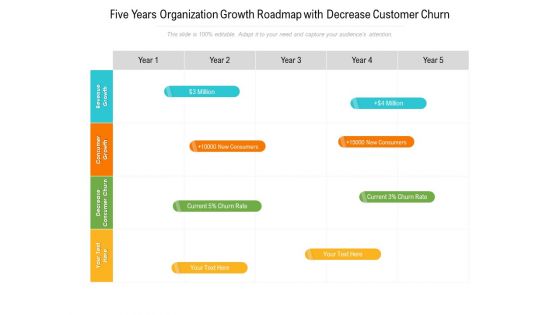
Five Years Organization Growth Roadmap With Decrease Customer Churn Infographics
We present our five years organization growth roadmap with decrease customer churn infographics. This PowerPoint layout is easy to edit so you can change the font size, font type, color, and shape conveniently. In addition to this, the PowerPoint layout is Google Slides compatible, so you can share it with your audience and give them access to edit it. Therefore, download and save this well researched five years organization growth roadmap with decrease customer churn infographics in different formats like PDF, PNG, and JPG to smoothly execute your business plan.
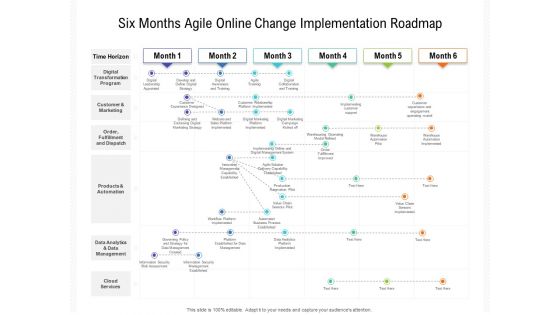
Six Months Agile Online Change Implementation Roadmap Infographics
We present our six months agile online change implementation roadmap infographics. This PowerPoint layout is easy to edit so you can change the font size, font type, color, and shape conveniently. In addition to this, the PowerPoint layout is Google Slides compatible, so you can share it with your audience and give them access to edit it. Therefore, download and save this well researched six months agile online change implementation roadmap infographics in different formats like PDF, PNG, and JPG to smoothly execute your business plan.
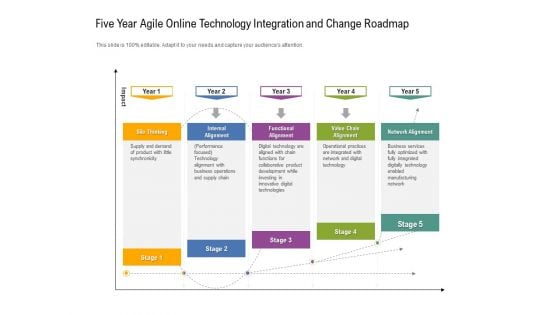
Five Year Agile Online Technology Integration And Change Roadmap Infographics
We present our five year agile online technology integration and change roadmap infographics. This PowerPoint layout is easy-to-edit so you can change the font size, font type, color, and shape conveniently. In addition to this, the PowerPoint layout is Google Slides compatible, so you can share it with your audience and give them access to edit it. Therefore, download and save this well-researched five year agile online technology integration and change roadmap infographics in different formats like PDF, PNG, and JPG to smoothly execute your business plan.
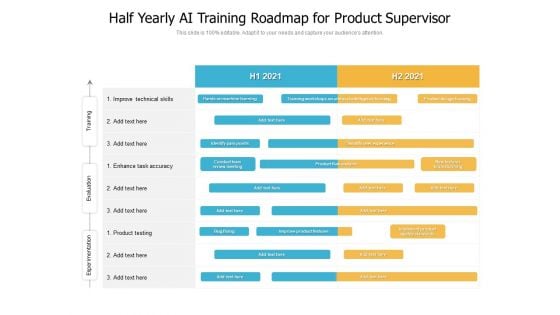
Half Yearly AI Training Roadmap For Product Supervisor Infographics
We present our half yearly ai training roadmap for product supervisor infographics. This PowerPoint layout is easy to edit so you can change the font size, font type, color, and shape conveniently. In addition to this, the PowerPoint layout is Google Slides compatible, so you can share it with your audience and give them access to edit it. Therefore, download and save this well-researched half yearly ai training roadmap for product supervisor infographics in different formats like PDF, PNG, and JPG to smoothly execute your business plan.
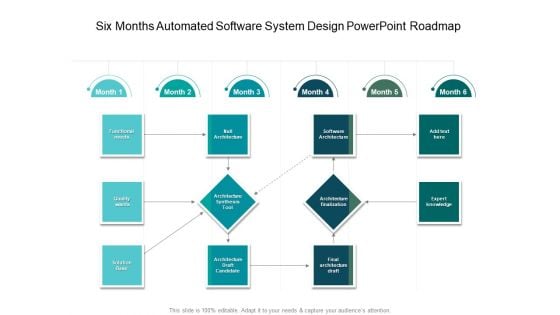
Six Months Automated Software System Design PowerPoint Roadmap Infographics
We present our six months automated software system design powerpoint roadmap infographics. This PowerPoint layout is easy to edit so you can change the font size, font type, color, and shape conveniently. In addition to this, the PowerPoint layout is Google Slides compatible, so you can share it with your audience and give them access to edit it. Therefore, download and save this well researched six months automated software system design powerpoint roadmap infographics in different formats like PDF, PNG, and JPG to smoothly execute your business plan.
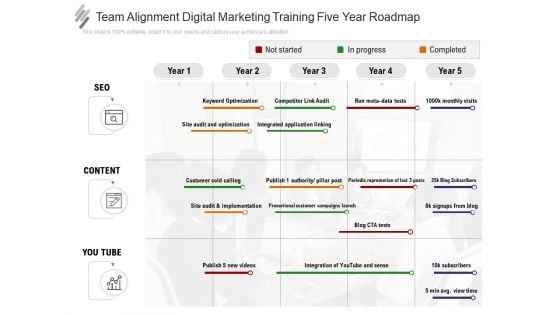
Team Alignment Digital Marketing Training Five Year Roadmap Infographics
We present our team alignment digital marketing training five year roadmap infographics. This PowerPoint layout is easy to edit so you can change the font size, font type, color, and shape conveniently. In addition to this, the PowerPoint layout is Google Slides compatible, so you can share it with your audience and give them access to edit it. Therefore, download and save this well researched team alignment digital marketing training five year roadmap infographics in different formats like PDF, PNG, and JPG to smoothly execute your business plan.

Technical Department Six Months Roadmap With Multiple Activities Infographics
We present our technical department six months roadmap with multiple activities infographics. This PowerPoint layout is easy to edit so you can change the font size, font type, color, and shape conveniently. In addition to this, the PowerPoint layout is Google Slides compatible, so you can share it with your audience and give them access to edit it. Therefore, download and save this well researched technical department six months roadmap with multiple activities infographics in different formats like PDF, PNG, and JPG to smoothly execute your business plan.
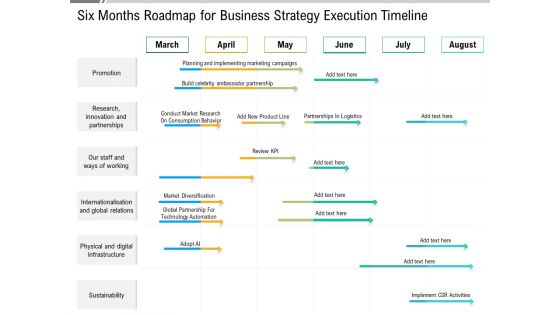
Six Months Roadmap For Business Strategy Execution Timeline Infographics
We present our six months roadmap for business strategy execution timeline infographics. This PowerPoint layout is easy to edit so you can change the font size, font type, color, and shape conveniently. In addition to this, the PowerPoint layout is Google Slides compatible, so you can share it with your audience and give them access to edit it. Therefore, download and save this well researched six months roadmap for business strategy execution timeline infographics in different formats like PDF, PNG, and JPG to smoothly execute your business plan.
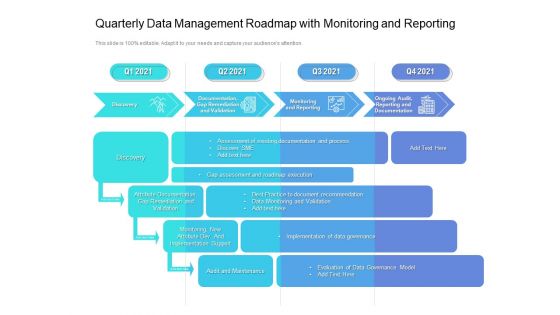
Quarterly Data Management Roadmap With Monitoring And Reporting Infographics
We present our quarterly data management roadmap with monitoring and reporting infographics. This PowerPoint layout is easy-to-edit so you can change the font size, font type, color, and shape conveniently. In addition to this, the PowerPoint layout is Google Slides compatible, so you can share it with your audience and give them access to edit it. Therefore, download and save this well-researched quarterly data management roadmap with monitoring and reporting infographics in different formats like PDF, PNG, and JPG to smoothly execute your business plan.
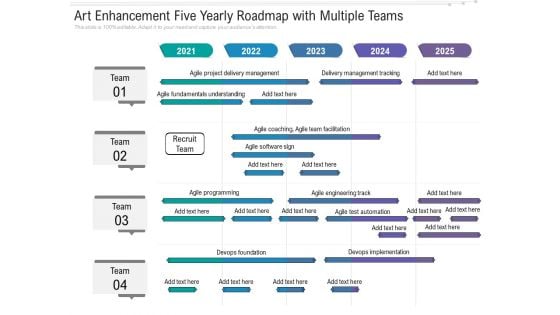
Art Enhancement Five Yearly Roadmap With Multiple Teams Infographics
We present our art enhancement five yearly roadmap with multiple teams infographics. This PowerPoint layout is easy to edit so you can change the font size, font type, color, and shape conveniently. In addition to this, the PowerPoint layout is Google Slides compatible, so you can share it with your audience and give them access to edit it. Therefore, download and save this well researched art enhancement five yearly roadmap with multiple teams infographics in different formats like PDF, PNG, and JPG to smoothly execute your business plan.
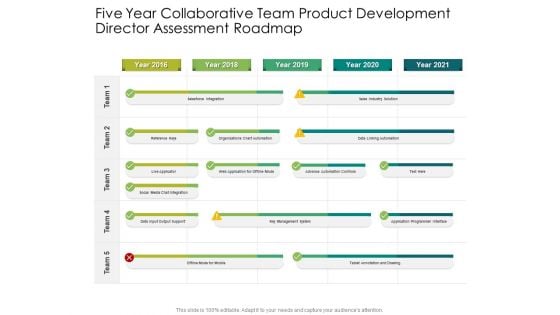
Five Year Collaborative Team Product Development Director Assessment Roadmap Infographics
We present our five year collaborative team product development director assessment roadmap infographics. This PowerPoint layout is easy to edit so you can change the font size, font type, color, and shape conveniently. In addition to this, the PowerPoint layout is Google Slides compatible, so you can share it with your audience and give them access to edit it. Therefore, download and save this well researched five year collaborative team product development director assessment roadmap infographics in different formats like PDF, PNG, and JPG to smoothly execute your business plan.
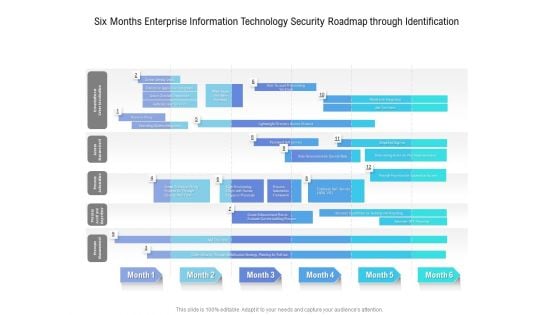
Six Months Enterprise Information Technology Security Roadmap Through Identification Infographics
We present our six months enterprise information technology security roadmap through identification infographics. This PowerPoint layout is easy to edit so you can change the font size, font type, color, and shape conveniently. In addition to this, the PowerPoint layout is Google Slides compatible, so you can share it with your audience and give them access to edit it. Therefore, download and save this well researched six months enterprise information technology security roadmap through identification infographics in different formats like PDF, PNG, and JPG to smoothly execute your business plan.
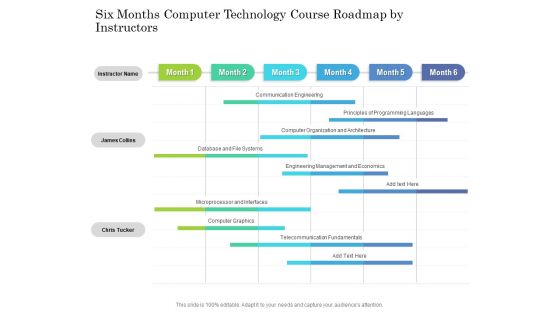
Six Months Computer Technology Course Roadmap By Instructors Infographics
We present our six months computer technology course roadmap by instructors infographics. This PowerPoint layout is easy-to-edit so you can change the font size, font type, color, and shape conveniently. In addition to this, the PowerPoint layout is Google Slides compatible, so you can share it with your audience and give them access to edit it. Therefore, download and save this well-researched six months computer technology course roadmap by instructors infographics in different formats like PDF, PNG, and JPG to smoothly execute your business plan.
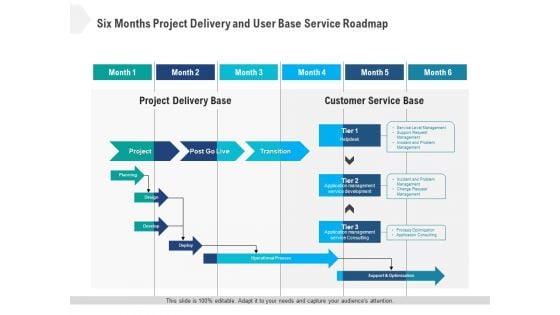
Six Months Project Delivery And User Base Service Roadmap Infographics
We present our six months project delivery and user base service roadmap infographics. This PowerPoint layout is easy to edit so you can change the font size, font type, color, and shape conveniently. In addition to this, the PowerPoint layout is Google Slides compatible, so you can share it with your audience and give them access to edit it. Therefore, download and save this well researched six months project delivery and user base service roadmap infographics in different formats like PDF, PNG, and JPG to smoothly execute your business plan.
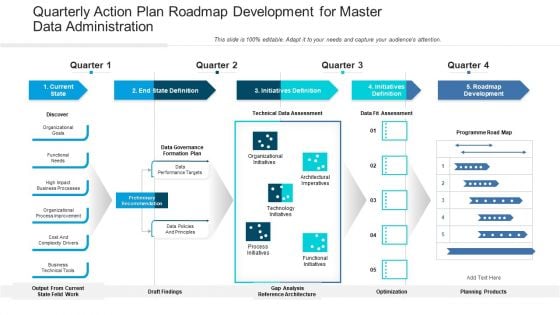
Quarterly Action Plan Roadmap Development For Master Data Administration Infographics
We present our quarterly action plan roadmap development for master data administration infographics. This PowerPoint layout is easy to edit so you can change the font size, font type, color, and shape conveniently. In addition to this, the PowerPoint layout is Google Slides compatible, so you can share it with your audience and give them access to edit it. Therefore, download and save this well researched quarterly action plan roadmap development for master data administration infographics in different formats like PDF, PNG, and JPG to smoothly execute your business plan.
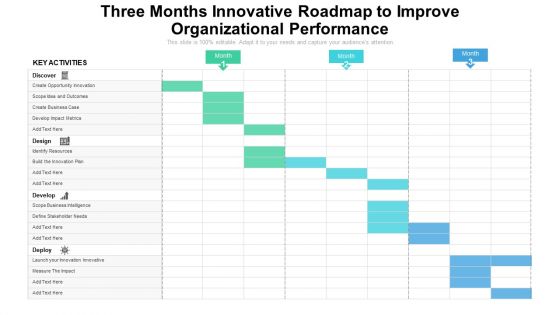
Three Months Innovative Roadmap To Improve Organizational Performance Infographics
We present our three months innovative roadmap to improve organizational performance infographics. This PowerPoint layout is easy to edit so you can change the font size, font type, color, and shape conveniently. In addition to this, the PowerPoint layout is Google Slides compatible, so you can share it with your audience and give them access to edit it. Therefore, download and save this well researched three months innovative roadmap to improve organizational performance infographics in different formats like PDF, PNG, and JPG to smoothly execute your business plan.
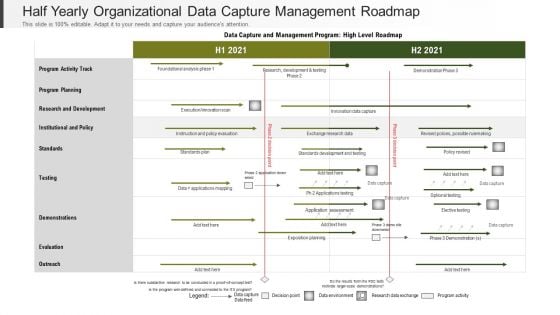
Half Yearly Organizational Data Capture Management Roadmap Infographics
We present our half yearly organizational data capture management roadmap infographics. This PowerPoint layout is easy to edit so you can change the font size, font type, color, and shape conveniently. In addition to this, the PowerPoint layout is Google Slides compatible, so you can share it with your audience and give them access to edit it. Therefore, download and save this well researched half yearly organizational data capture management roadmap infographics in different formats like PDF, PNG, and JPG to smoothly execute your business plan.
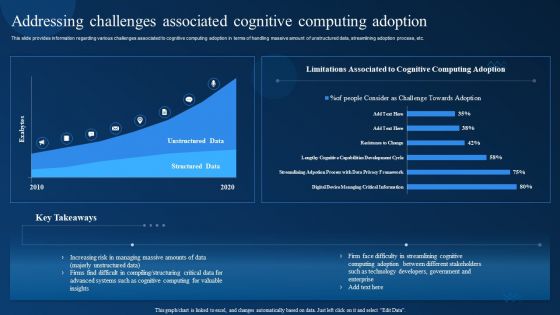
Addressing Challenges Associated Cognitive Computing Adoption Infographics PDF
This slide provides information regarding various challenges associated to cognitive computing adoption in terms of handling massive amount of unstructured data, streamlining adoption process, etc. Presenting this PowerPoint presentation, titled Addressing Challenges Associated Cognitive Computing Adoption Infographics PDF, with topics curated by our researchers after extensive research. This editable presentation is available for immediate download and provides attractive features when used. Download now and captivate your audience. Presenting this Addressing Challenges Associated Cognitive Computing Adoption Infographics PDF. Our researchers have carefully researched and created these slides with all aspects taken into consideration. This is a completely customizable Addressing Challenges Associated Cognitive Computing Adoption Infographics PDF that is available for immediate downloading. Download now and make an impact on your audience. Highlight the attractive features available with our PPTs.
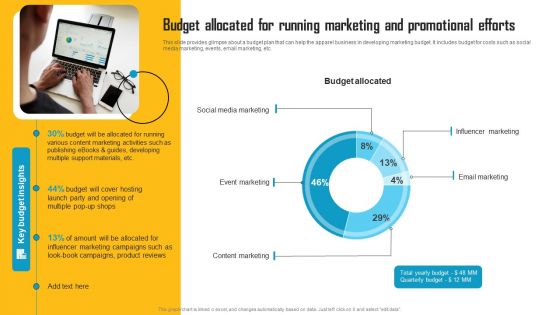
Budget Allocated For Running Marketing And Promotional Efforts Infographics PDF
This slide provides glimpse about a budget plan that can help the apparel business in developing marketing budget. It includes budget for costs such as social media marketing, events, email marketing, etc. Presenting this PowerPoint presentation, titled Budget Allocated For Running Marketing And Promotional Efforts Infographics PDF, with topics curated by our researchers after extensive research. This editable presentation is available for immediate download and provides attractive features when used. Download now and captivate your audience. Presenting this Budget Allocated For Running Marketing And Promotional Efforts Infographics PDF. Our researchers have carefully researched and created these slides with all aspects taken into consideration. This is a completely customizable Budget Allocated For Running Marketing And Promotional Efforts Infographics PDF that is available for immediate downloading. Download now and make an impact on your audience. Highlight the attractive features available with our PPTs.
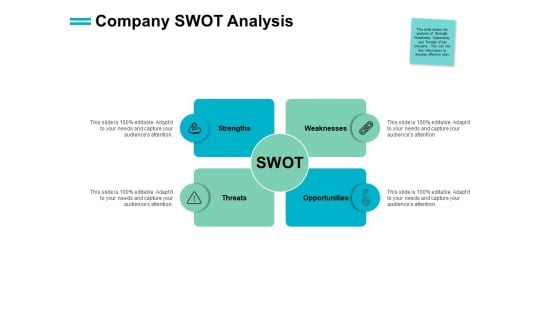
Company Swot Analysis Opportunities Ppt PowerPoint Presentation Infographics Themes
Presenting this set of slides with name company swot analysis opportunities ppt powerpoint presentation infographics themes. This is a four stage process. The stages in this process are strength, opportunity, weakness, threat, marketing. This is a completely editable PowerPoint presentation and is available for immediate download. Download now and impress your audience.
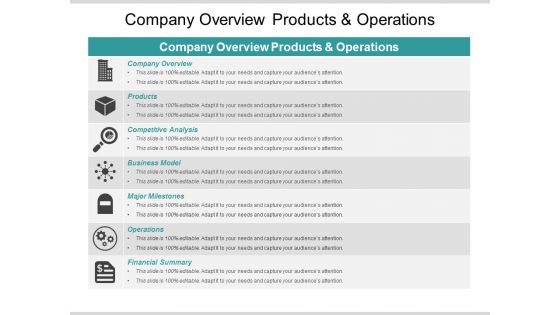
Company Overview Products And Operations Ppt PowerPoint Presentation Infographics Themes
Presenting this set of slides with name company overview products and operations ppt powerpoint presentation infographics themes. The topics discussed in these slides are business plan executive summary, business strategy, market plan. This is a completely editable PowerPoint presentation and is available for immediate download. Download now and impress your audience.
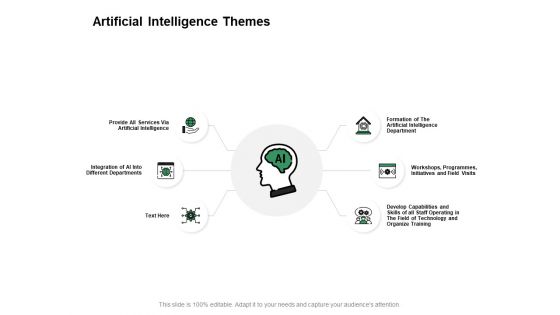
Artificial Intelligence Themes Ppt PowerPoint Presentation Infographics Samples
Presenting this set of slides with name artificial intelligence themes ppt powerpoint presentation infographics samples. This is a six stage process. The stages in this process are mind map, knowledge, management, marketing, business. This is a completely editable PowerPoint presentation and is available for immediate download. Download now and impress your audience.

Cost Summary ROI Analysis Example Ppt PowerPoint Presentation Infographics Themes
Presenting this set of slides with name cost summary roi analysis example ppt powerpoint presentation infographics themes. The topics discussed in these slides are business, management, planning, strategy, marketing. This is a completely editable PowerPoint presentation and is available for immediate download. Download now and impress your audience.
Business Process Modelling Enterprise Ppt PowerPoint Presentation Infographics Themes Cpb
Presenting this set of slides with name business process modelling enterprise ppt powerpoint presentation infographics themes cpb. This is a three stage process. The stages in this process are business process modelling enterprise. This is a completely editable PowerPoint presentation and is available for immediate download. Download now and impress your audience.
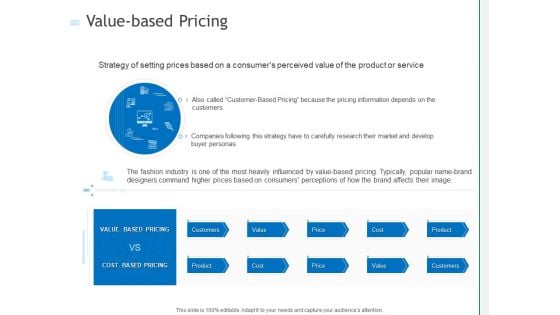
Value Based Pricing Ppt PowerPoint Presentation Infographics Themes PDF
Presenting this set of slides with name value based pricing ppt powerpoint presentation infographics themes pdf. This is a one stage process. The stages in this process are value based pricing, cost based pricing, customer-based pricing, strategy, carefully research, customers, value, price, cost, product, customers. This is a completely editable PowerPoint presentation and is available for immediate download. Download now and impress your audience.
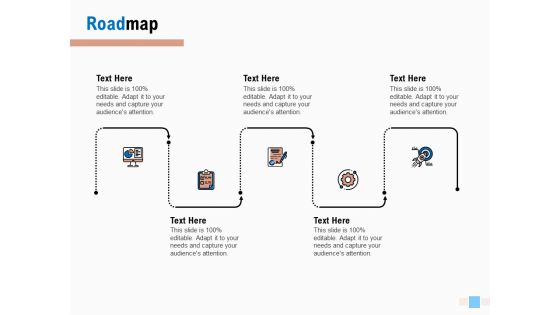
Email Advertising Proposal Roadmap Ppt Infographics Themes PDF
Presenting email advertising proposal roadmap ppt infographics themes pdf to provide visual cues and insights. Share and navigate important information on five stages that need your due attention. This template can be used to pitch topics like roadmap. In addtion, this PPT design contains high resolution images, graphics, etc, that are easily editable and available for immediate download.
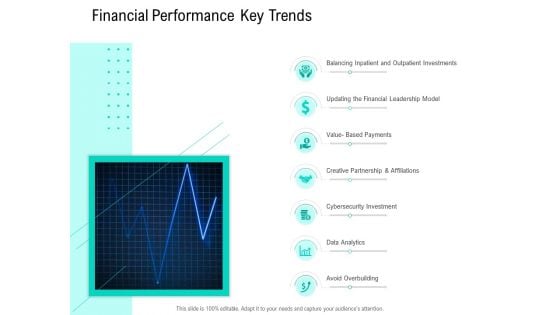
Nursing Administration Financial Performance Key Trends Ppt Infographics Themes PDF
Deliver an awe inspiring pitch with this creative nursing administration financial performance key trends ppt infographics themes pdf bundle. Topics like data analytics, avoid overbuilding, cybersecurity investment, value based payments, updating the financial leadership model can be discussed with this completely editable template. It is available for immediate download depending on the needs and requirements of the user.

Car Exhibition At Auto Expo Event Ppt Infographics Themes PDF
Showcasing this set of slides titled car exhibition at auto expo event ppt infographics themes pdf. The topics addressed in these templates are car exhibition at auto expo event. All the content presented in this PPT design is completely editable. Download it and make adjustments in color, background, font etc. as per your unique business setting.
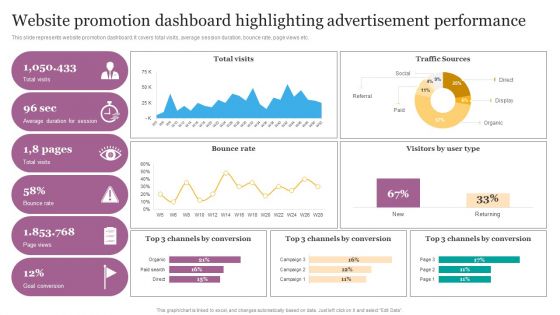
Website Promotion Dashboard Highlighting Advertisement Performance Ppt Infographics Portfolio PDF
This slide represents website promotion dashboard. It covers total visits, average session duration, bounce rate, page views etc. Create an editable Website Promotion Dashboard Highlighting Advertisement Performance Ppt Infographics Portfolio PDF that communicates your idea and engages your audience. Whether youre presenting a business or an educational presentation, pre designed presentation templates help save time. Website Promotion Dashboard Highlighting Advertisement Performance Ppt Infographics Portfolio PDF is highly customizable and very easy to edit, covering many different styles from creative to business presentations. Slidegeeks has creative team members who have crafted amazing templates. So, go and get them without any delay.
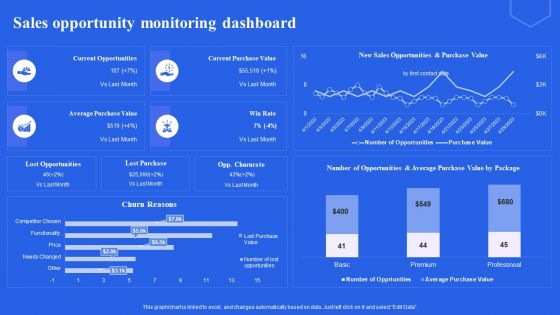
Sales Opportunity Monitoring Dashboard Ppt Infographics Good PDF
Explore a selection of the finest Sales Opportunity Monitoring Dashboard Ppt Infographics Good PDF here. With a plethora of professionally designed and pre made slide templates, you can quickly and easily find the right one for your upcoming presentation. You can use our Sales Opportunity Monitoring Dashboard Ppt Infographics Good PDF to effectively convey your message to a wider audience. Slidegeeks has done a lot of research before preparing these presentation templates. The content can be personalized and the slides are highly editable. Grab templates today from Slidegeeks.
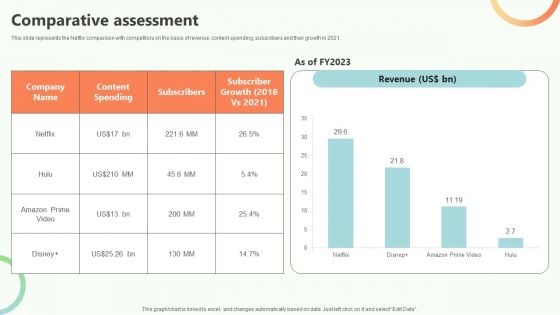
Online Video Content Provider Business Profile Comparative Assessment Infographics PDF
This slide represents the Netflix comparison with competitors on the basis of revenue, content spending, subscribers and their growth in 2021. Create an editable Online Video Content Provider Business Profile Comparative Assessment Infographics PDF that communicates your idea and engages your audience. Whether youre presenting a business or an educational presentation, pre designed presentation templates help save time. Online Video Content Provider Business Profile Comparative Assessment Infographics PDF is highly customizable and very easy to edit, covering many different styles from creative to business presentations. Slidegeeks has creative team members who have crafted amazing templates. So, go and get them without any delay.
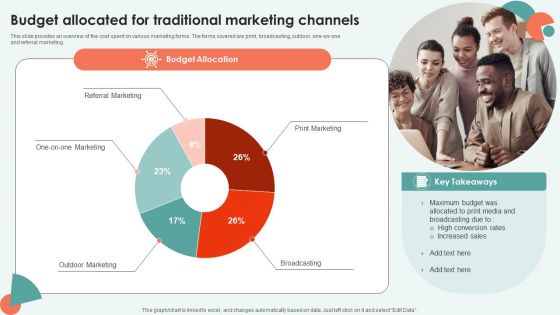
Budget Allocated For Traditional Marketing Channels Ppt Infographics Styles PDF
This slide provides an overview of the cost spent on various marketing forms. The forms covered are print, broadcasting, outdoor, one on one and referral marketing. Create an editable Budget Allocated For Traditional Marketing Channels Ppt Infographics Styles PDF that communicates your idea and engages your audience. Whether you are presenting a business or an educational presentation, pre designed presentation templates help save time. Budget Allocated For Traditional Marketing Channels Ppt Infographics Styles PDF is highly customizable and very easy to edit, covering many different styles from creative to business presentations. Slidegeeks has creative team members who have crafted amazing templates. So, go and get them without any delay.

Risk Based Methodology Fault Tree Analysis Method Infographics PDF
This slide covers quality risk management tool such as Fault-tree Analysis for obtaining understanding of the system and problems related to it. This Risk Based Methodology Fault Tree Analysis Method Infographics PDF is perfect for any presentation, be it in front of clients or colleagues. It is a versatile and stylish solution for organizing your meetings. The Risk Based Methodology Fault Tree Analysis Method Infographics PDF features a modern design for your presentation meetings. The adjustable and customizable slides provide unlimited possibilities for acing up your presentation. Slidegeeks has done all the homework before launching the product for you. So, do not wait, grab the presentation templates today

 Home
Home