Infographic Icons
Administration Team Discussing Product Analysis Report Infographics PDF
Presenting Administration Team Discussing Product Analysis Report Infographics PDF to dispense important information. This template comprises four stages. It also presents valuable insights into the topics including Administration Team, Discussing Product Analysis Report. This is a completely customizable PowerPoint theme that can be put to use immediately. So, download it and address the topic impactfully.
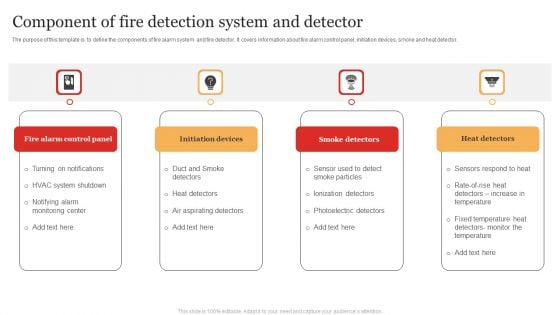
Component Of Fire Detection System And Detector Infographics PDF
Presenting Component Of Fire Detection System And Detector Infographics PDF to dispense important information. This template comprises four stages. It also presents valuable insights into the topics including Initiation Devices, Smoke Detectors, Heat Detectors . This is a completely customizable PowerPoint theme that can be put to use immediately. So, download it and address the topic impactfully.
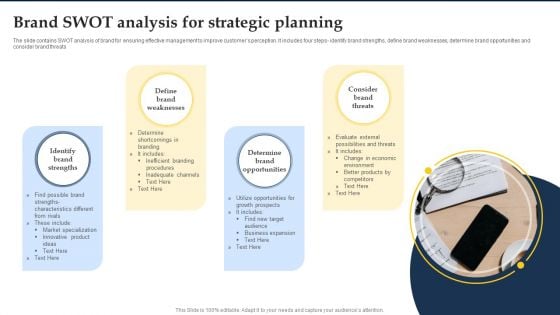
Brand Swot Analysis For Strategic Planning Infographics PDF
Presenting Brand Swot Analysis For Strategic Planning Infographics PDF to dispense important information. This template comprises One stages. It also presents valuable insights into the topics including Identify , Define, Determine. This is a completely customizable PowerPoint theme that can be put to use immediately. So, download it and address the topic impactfully.
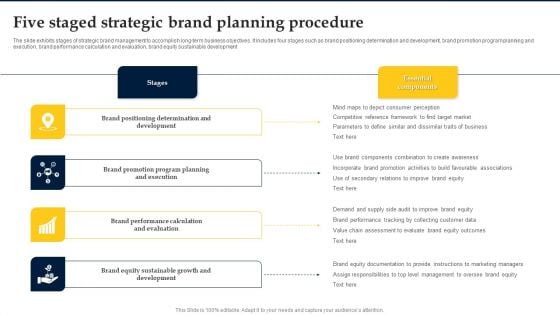
Five Staged Strategic Brand Planning Procedure Infographics PDF
Presenting Five Staged Strategic Brand Planning Procedure Infographics PDF to dispense important information. This template comprises Four stages. It also presents valuable insights into the topics including Stages, Essential, Brand. This is a completely customizable PowerPoint theme that can be put to use immediately. So, download it and address the topic impactfully.
Tracking And Assessment Framework For Healthcare Industry Infographics PDF
Presenting Tracking And Assessment Framework For Healthcare Industry Infographics PDF to dispense important information. This template comprises Five stages. It also presents valuable insights into the topics including Medicine Development, Learnings And Changes, Healthcare Industry. This is a completely customizable PowerPoint theme that can be put to use immediately. So, download it and address the topic impactfully.
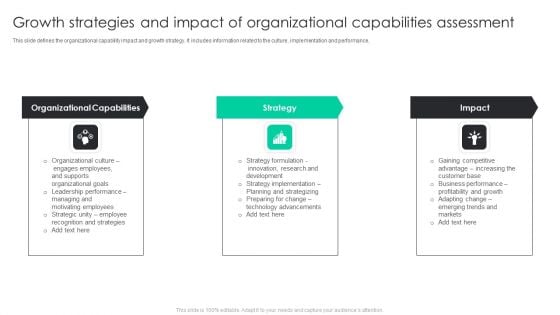
Growth Strategies And Impact Of Organizational Capabilities Assessment Infographics PDF
Presenting Growth Strategies And Impact Of Organizational Capabilities Assessment Infographics PDF to dispense important information. This template comprises three stages. It also presents valuable insights into the topics including Organizational Capabilities, Recognition Strategies, Technology Advancements. This is a completely customizable PowerPoint theme that can be put to use immediately. So, download it and address the topic impactfully.
Transformation Shift Ppt PowerPoint Presentation File Infographics PDF
Presenting Transformation Shift Ppt PowerPoint Presentation File Infographics PDF to dispense important information. This template comprises two stages. It also presents valuable insights into the topics including Transformation Shift. This is a completely customizable PowerPoint theme that can be put to use immediately. So, download it and address the topic impactfully.
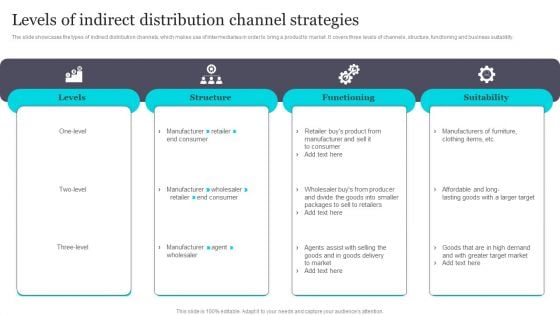
Levels Of Indirect Distribution Channel Strategies Infographics PDF
Presenting Levels Of Indirect Distribution Channel Strategies Infographics PDF to dispense important information. This template comprises four stages. It also presents valuable insights into the topics including Manufacturer Retailer, Manufacturer Wholesaler, Manufacturer Sell . This is a completely customizable PowerPoint theme that can be put to use immediately. So, download it and address the topic impactfully.
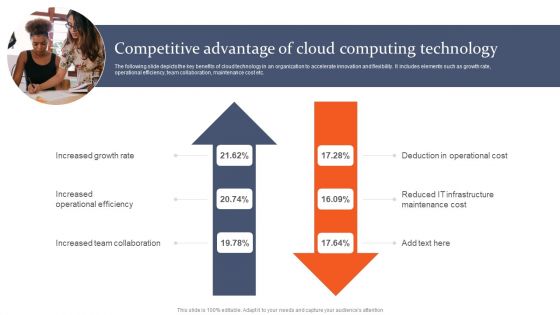
Competitive Advantage Of Cloud Computing Technology Infographics PDF
Presenting Competitive Advantage Of Cloud Computing Technology Infographics PDF to dispense important information. This template comprises one stage. It also presents valuable insights into the topics including Team Collaboration, Operational Efficiency, Deduction Operational Cost. This is a completely customizable PowerPoint theme that can be put to use immediately. So, download it and address the topic impactfully.
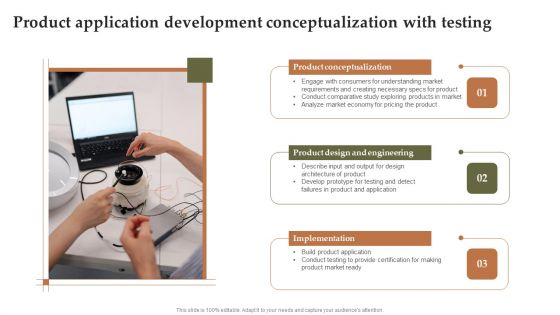
Product Application Development Conceptualization With Testing Infographics PDF
Presenting Product Application Development Conceptualization With Testing Infographics PDF to dispense important information. This template comprises three stages. It also presents valuable insights into the topics including Product Conceptualization, Implementation, Product Engineering. This is a completely customizable PowerPoint theme that can be put to use immediately. So, download it and address the topic impactfully.

Thanks For Watching Ppt PowerPoint Presentation File Infographics PDF
Presenting Thanks For Watching Ppt PowerPoint Presentation File Infographics PDF to dispense important information. This template comprises Three stages. It also presents valuable insights into the topics including Thankyou. This is a completely customizable PowerPoint theme that can be put to use immediately. So, download it and address the topic impactfully.
Project Risk Administration Plan To Eliminate Uncertain Events Infographics PDF
Presenting Project Risk Administration Plan To Eliminate Uncertain Events Infographics PDF to dispense important information. This template comprises three stages. It also presents valuable insights into the topics including Project Risk Administration, Plan Eliminate, Uncertain Events. This is a completely customizable PowerPoint theme that can be put to use immediately. So, download it and address the topic impactfully.
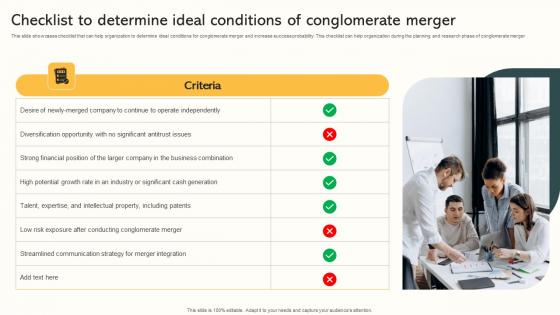
Checklist To Determine Ideal Conditions Market Expansion Through Infographics Pdf
This slide showcases checklist that can help organization to determine ideal conditions for conglomerate merger and increase success probability. This checklist can help organization during the planning and research phase of conglomerate merger. Are you searching for a Checklist To Determine Ideal Conditions Market Expansion Through Infographics Pdf that is uncluttered, straightforward, and original It is easy to edit, and you can change the colors to suit your personal or business branding. For a presentation that expresses how much effort you have put in, this template is ideal With all of its features, including tables, diagrams, statistics, and lists, it is perfect for a business plan presentation. Make your ideas more appealing with these professional slides. Download Checklist To Determine Ideal Conditions Market Expansion Through Infographics Pdf from Slidegeeks today. This slide showcases checklist that can help organization to determine ideal conditions for conglomerate merger and increase success probability. This checklist can help organization during the planning and research phase of conglomerate merger.
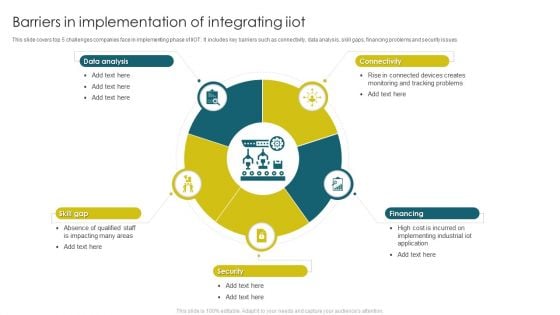
Barriers In Implementation Of Integrating Iiot Infographics PDF
This slide covers top 5 challenges companies face in implementing phase of IIOT. It includes key barriers such as connectivity, data analysis, skill gaps, financing problems and security issues. Presenting Barriers In Implementation Of Integrating Iiot Infographics PDF to dispense important information. This template comprises five stages. It also presents valuable insights into the topics including Data Analysis, Connectivity, Financing. This is a completely customizable PowerPoint theme that can be put to use immediately. So, download it and address the topic impactfully.
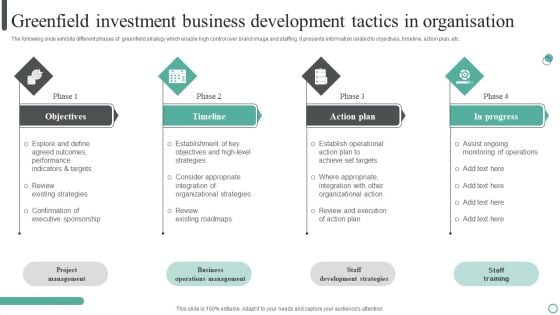
Greenfield Investment Business Development Tactics In Organisation Infographics PDF
The following slide exhibits different phases of greenfield strategy which enable high control over brand image and staffing. It presents information related to objectives, timeline, action plan, etc. Presenting Greenfield Investment Business Development Tactics In Organisation Infographics PDF to dispense important information. This template comprises four stages. It also presents valuable insights into the topics including Objectives, Timeline, Action Plan. This is a completely customizable PowerPoint theme that can be put to use immediately. So, download it and address the topic impactfully.
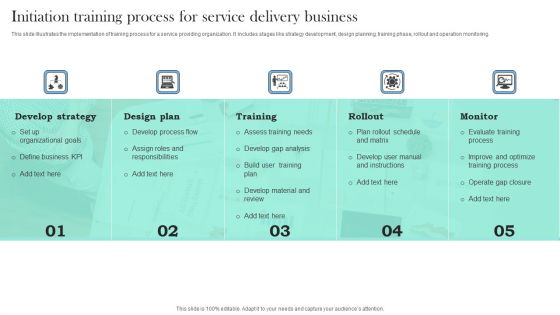
Initiation Training Process For Service Delivery Business Infographics PDF
This slide illustrates the implementation of training process for a service providing organization. It includes stages like strategy development, design planning, training phase, rollout and operation monitoring. Presenting Initiation Training Process For Service Delivery Business Infographics PDF to dispense important information. This template comprises five stages. It also presents valuable insights into the topics including Develop Strategy, Design Plan, Training. This is a completely customizable PowerPoint theme that can be put to use immediately. So, download it and address the topic impactfully.
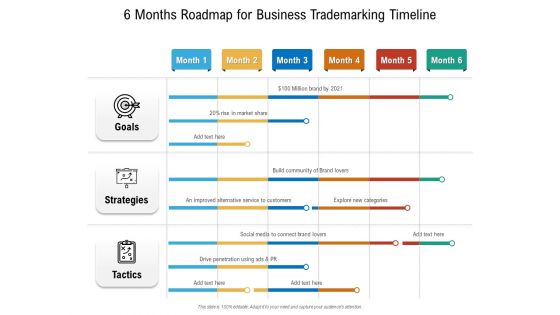
6 Months Roadmap For Business Trademarking Timeline Infographics
Presenting our innovatively-structured 6 months roadmap for business trademarking timeline infographics Template. Showcase your roadmap process in different formats like PDF, PNG, and JPG by clicking the download button below. This PPT design is available in both Standard Screen and Widescreen aspect ratios. It can also be easily personalized and presented with modified font size, font type, color, and shapes to measure your progress in a clear way.
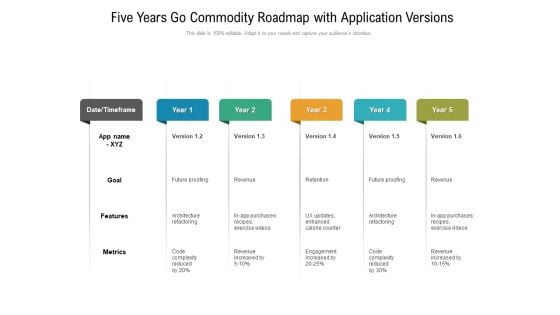
Five Years Go Commodity Roadmap With Application Versions Infographics
Presenting our innovatively-structured five years go commodity roadmap with application versions infographics Template. Showcase your roadmap process in different formats like PDF, PNG, and JPG by clicking the download button below. This PPT design is available in both Standard Screen and Widescreen aspect ratios. It can also be easily personalized and presented with modified font size, font type, color, and shapes to measure your progress in a clear way.
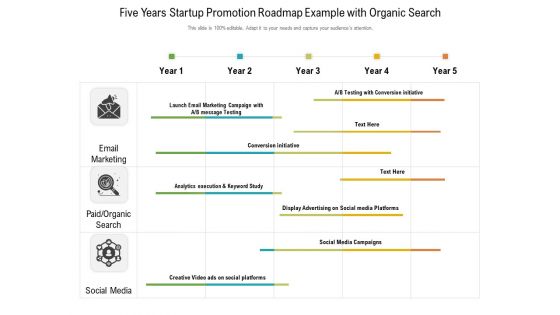
Five Years Startup Promotion Roadmap Example With Organic Search Infographics
Presenting our innovatively-structured five years startup promotion roadmap example with organic search infographics Template. Showcase your roadmap process in different formats like PDF, PNG, and JPG by clicking the download button below. This PPT design is available in both Standard Screen and Widescreen aspect ratios. It can also be easily personalized and presented with modified font size, font type, color, and shapes to measure your progress in a clear way.
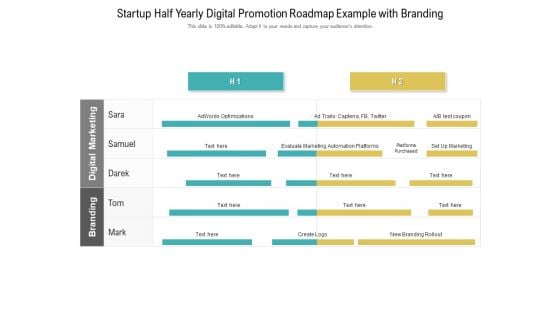
Startup Half Yearly Digital Promotion Roadmap Example With Branding Infographics
Presenting our innovatively-structured startup half yearly digital promotion roadmap example with branding infographics Template. Showcase your roadmap process in different formats like PDF, PNG, and JPG by clicking the download button below. This PPT design is available in both Standard Screen and Widescreen aspect ratios. It can also be easily personalized and presented with modified font size, font type, color, and shapes to measure your progress in a clear way.
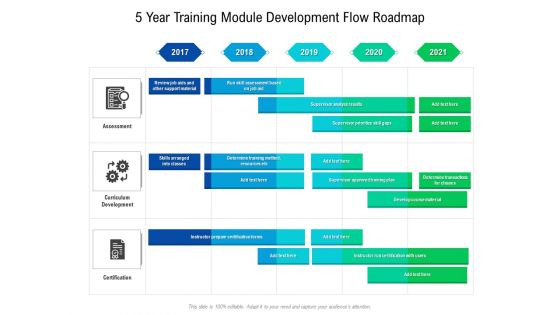
5 Year Training Module Development Flow Roadmap Infographics
Presenting our innovatively-structured 5 year training module development flow roadmap infographics Template. Showcase your roadmap process in different formats like PDF, PNG, and JPG by clicking the download button below. This PPT design is available in both Standard Screen and Widescreen aspect ratios. It can also be easily personalized and presented with modified font size, font type, color, and shapes to measure your progress in a clear way.
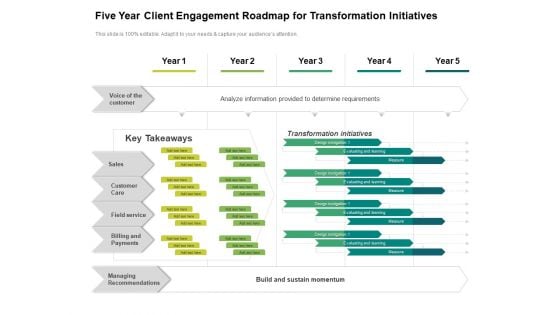
Five Year Client Engagement Roadmap For Transformation Initiatives Infographics
Presenting our innovatively structured five year client engagement roadmap for transformation initiatives infographics Template. Showcase your roadmap process in different formats like PDF, PNG, and JPG by clicking the download button below. This PPT design is available in both Standard Screen and Widescreen aspect ratios. It can also be easily personalized and presented with modified font size, font type, color, and shapes to measure your progress in a clear way.
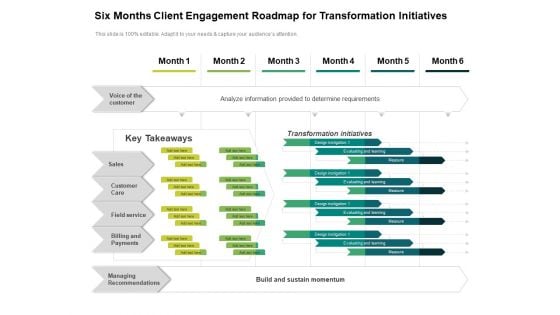
Six Months Client Engagement Roadmap For Transformation Initiatives Infographics
Presenting our innovatively structured six months client engagement roadmap for transformation initiatives infographics Template. Showcase your roadmap process in different formats like PDF, PNG, and JPG by clicking the download button below. This PPT design is available in both Standard Screen and Widescreen aspect ratios. It can also be easily personalized and presented with modified font size, font type, color, and shapes to measure your progress in a clear way.
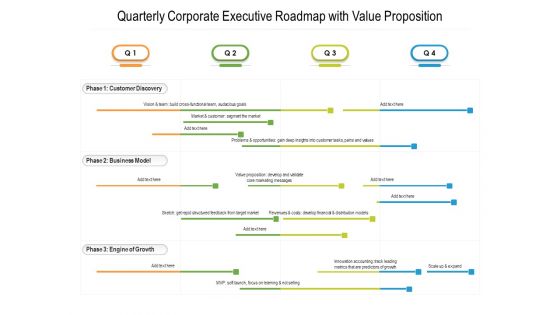
Quarterly Corporate Executive Roadmap With Value Proposition Infographics
Presenting our innovatively structured quarterly corporate executive roadmap with value proposition infographics Template. Showcase your roadmap process in different formats like PDF, PNG, and JPG by clicking the download button below. This PPT design is available in both Standard Screen and Widescreen aspect ratios. It can also be easily personalized and presented with modified font size, font type, color, and shapes to measure your progress in a clear way.
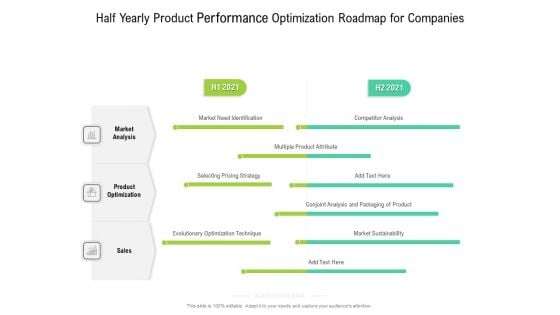
Half Yearly Product Performance Optimization Roadmap For Companies Infographics
Presenting our innovatively structured half yearly product performance optimization roadmap for companies infographics Template. Showcase your roadmap process in different formats like PDF, PNG, and JPG by clicking the download button below. This PPT design is available in both Standard Screen and Widescreen aspect ratios. It can also be easily personalized and presented with modified font size, font type, color, and shapes to measure your progress in a clear way.
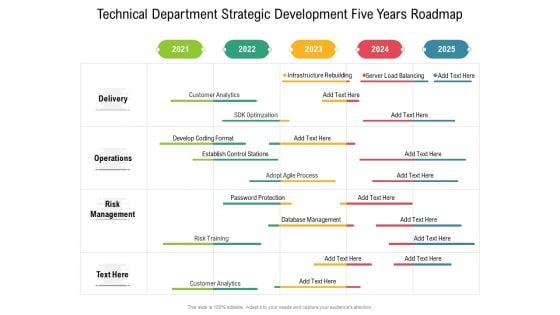
Technical Department Strategic Development Five Years Roadmap Infographics
Presenting our innovatively structured technical department strategic development five years roadmap infographics Template. Showcase your roadmap process in different formats like PDF, PNG, and JPG by clicking the download button below. This PPT design is available in both Standard Screen and Widescreen aspect ratios. It can also be easily personalized and presented with modified font size, font type, color, and shapes to measure your progress in a clear way.
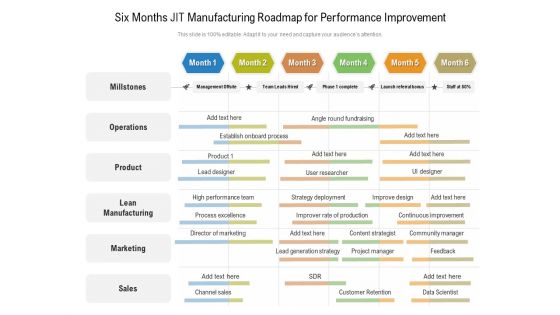
Six Months JIT Manufacturing Roadmap For Performance Improvement Infographics
Presenting our innovatively-structured six months jit manufacturing roadmap for performance improvement infographics Template. Showcase your roadmap process in different formats like PDF, PNG, and JPG by clicking the download button below. This PPT design is available in both Standard Screen and Widescreen aspect ratios. It can also be easily personalized and presented with modified font size, font type, color, and shapes to measure your progress in a clear way.
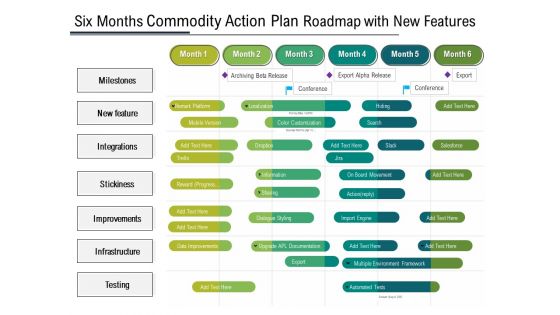
Six Months Product Strategy Roadmap With New Features Infographics
Presenting our innovatively-structured six months product strategy roadmap with new features infographics Template. Showcase your roadmap process in different formats like PDF, PNG, and JPG by clicking the download button below. This PPT design is available in both Standard Screen and Widescreen aspect ratios. It can also be easily personalized and presented with modified font size, font type, color, and shapes to measure your progress in a clear way.
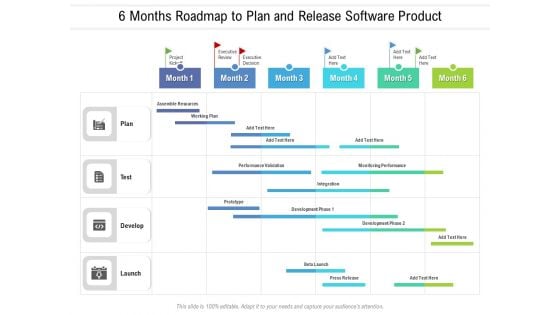
6 Months Roadmap To Plan And Release Software Product Infographics
Presenting our innovatively structured 6 months roadmap to plan and release software product infographics Template. Showcase your roadmap process in different formats like PDF, PNG, and JPG by clicking the download button below. This PPT design is available in both Standard Screen and Widescreen aspect ratios. It can also be easily personalized and presented with modified font size, font type, color, and shapes to measure your progress in a clear way.
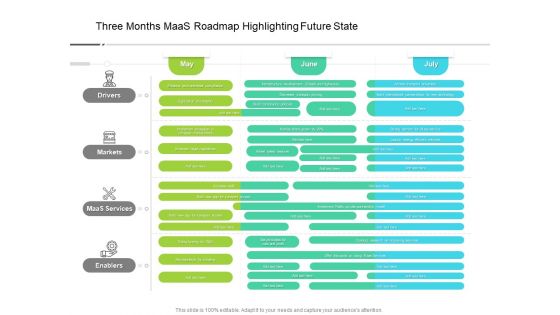
Three Months Maas Roadmap Highlighting Future State Infographics
Presenting our innovatively-structured three months maas roadmap highlighting future state infographics Template. Showcase your roadmap process in different formats like PDF, PNG, and JPG by clicking the download button below. This PPT design is available in both Standard Screen and Widescreen aspect ratios. It can also be easily personalized and presented with modified font size, font type, color, and shapes to measure your progress in a clear way.
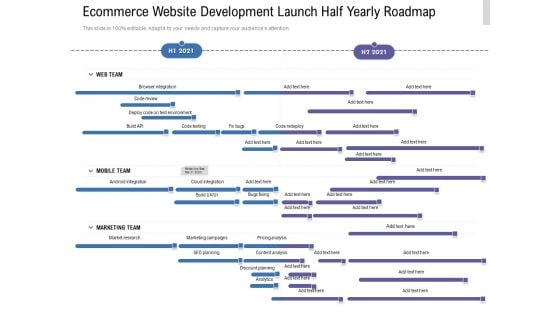
Ecommerce Website Development Launch Half Yearly Roadmap Infographics
Presenting our innovatively-structured ecommerce website development launch half yearly roadmap infographics Template. Showcase your roadmap process in different formats like PDF, PNG, and JPG by clicking the download button below. This PPT design is available in both Standard Screen and Widescreen aspect ratios. It can also be easily personalized and presented with modified font size, font type, color, and shapes to measure your progress in a clear way.
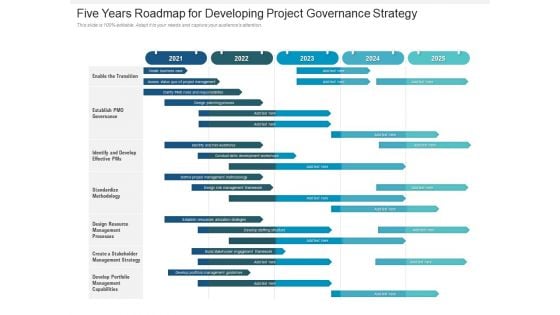
Five Years Roadmap For Developing Project Governance Strategy Infographics
Presenting our innovatively structured five years roadmap for developing project governance strategy infographics Template. Showcase your roadmap process in different formats like PDF, PNG, and JPG by clicking the download button below. This PPT design is available in both Standard Screen and Widescreen aspect ratios. It can also be easily personalized and presented with modified font size, font type, color, and shapes to measure your progress in a clear way.
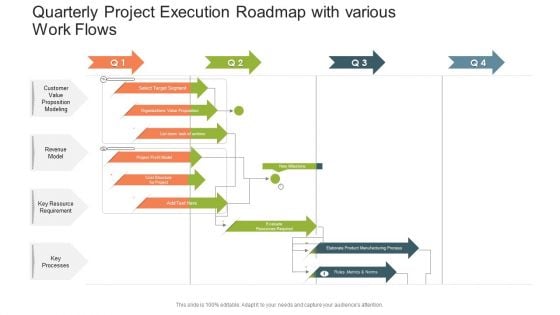
Quarterly Project Execution Roadmap With Various Work Flows Infographics PDF
Presenting our jaw-dropping quarterly project execution roadmap with various work flows infographics pdf. You can alternate the color, font size, font type, and shapes of this PPT layout according to your strategic process. This PPT presentation is compatible with Google Slides and is available in both standard screen and widescreen aspect ratios. You can also download this well-researched PowerPoint template design in different formats like PDF, JPG, and PNG. So utilize this visually-appealing design by clicking the download button given below.
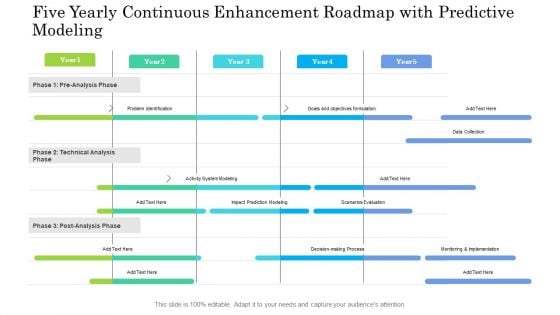
Five Yearly Continuous Enhancement Roadmap With Predictive Modeling Infographics
Presenting our innovatively structured five yearly continuous enhancement roadmap with predictive modeling infographics Template. Showcase your roadmap process in different formats like PDF, PNG, and JPG by clicking the download button below. This PPT design is available in both Standard Screen and Widescreen aspect ratios. It can also be easily personalized and presented with modified font size, font type, color, and shapes to measure your progress in a clear way.
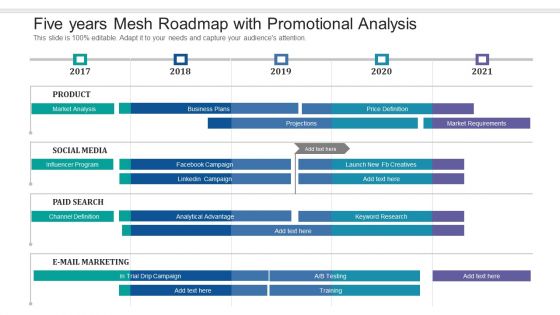
Five Years Mesh Roadmap With Promotional Analysis Infographics
Presenting our innovatively structured five years mesh roadmap with promotional analysis infographics Template. Showcase your roadmap process in different formats like PDF, PNG, and JPG by clicking the download button below. This PPT design is available in both Standard Screen and Widescreen aspect ratios. It can also be easily personalized and presented with modified font size, font type, color, and shapes to measure your progress in a clear way.
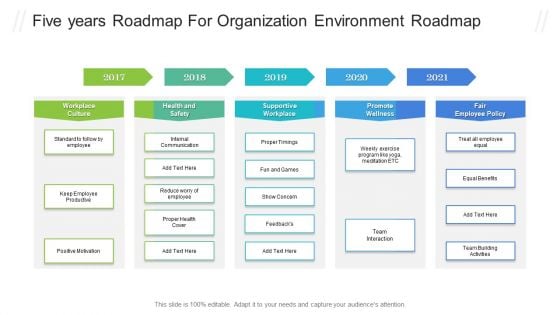
Five Years Roadmap For Organization Environment Roadmap Infographics PDF
Introducing our five years roadmap for organization environment roadmap infographics pdf. This PPT presentation is Google Slides compatible, therefore, you can share it easily with the collaborators for measuring the progress. Also, the presentation is available in both standard screen and widescreen aspect ratios. So edit the template design by modifying the font size, font type, color, and shapes as per your requirements. As this PPT design is fully editable it can be presented in PDF, JPG and PNG formats.

Three Months Cryptocurrency File Project Implementation Roadmap Infographics PDF
Presenting our innovatively-structured three months cryptocurrency file project implementation roadmap infographics pdf Template. Showcase your roadmap process in different formats like PDF, PNG, and JPG by clicking the download button below. This PPT design is available in both Standard Screen and Widescreen aspect ratios. It can also be easily personalized and presented with modified font size, font type, color, and shapes to measure your progress in a clear way.
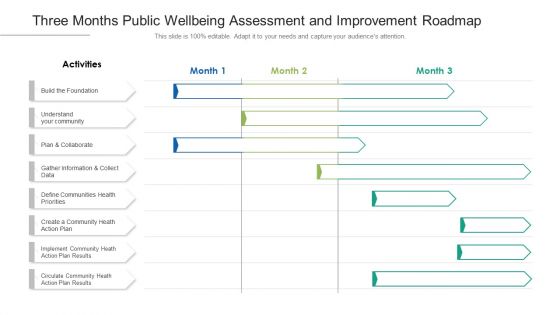
Three Months Public Wellbeing Assessment And Improvement Roadmap Infographics
Presenting our innovatively structured three months public wellbeing assessment and improvement roadmap infographics Template. Showcase your roadmap process in different formats like PDF, PNG, and JPG by clicking the download button below. This PPT design is available in both Standard Screen and Widescreen aspect ratios. It can also be easily personalized and presented with modified font size, font type, color, and shapes to measure your progress in a clear way.
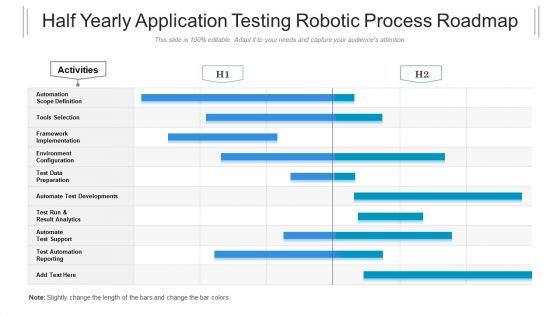
Half Yearly Application Testing Robotic Process Roadmap Infographics
Presenting our innovatively structured half yearly application testing robotic process roadmap infographics Template. Showcase your roadmap process in different formats like PDF, PNG, and JPG by clicking the download button below. This PPT design is available in both Standard Screen and Widescreen aspect ratios. It can also be easily personalized and presented with modified font size, font type, color, and shapes to measure your progress in a clear way.
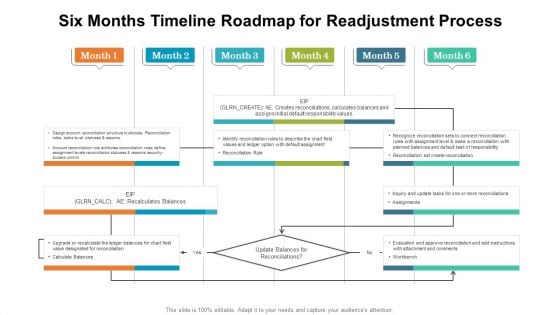
Six Months Timeline Roadmap For Readjustment Process Infographics PDF
Presenting our jaw-dropping six months timeline roadmap for readjustment process infographics pdf. You can alternate the color, font size, font type, and shapes of this PPT layout according to your strategic process. This PPT presentation is compatible with Google Slides and is available in both standard screen and widescreen aspect ratios. You can also download this well-researched PowerPoint template design in different formats like PDF, JPG, and PNG. So utilize this visually-appealing design by clicking the download button given below.

Half Yearly Roadmap For Consumer And Technological Assistance Framework Infographics
Presenting our innovatively-structured half yearly roadmap for consumer and technological assistance framework infographics Template. Showcase your roadmap process in different formats like PDF, PNG, and JPG by clicking the download button below. This PPT design is available in both Standard Screen and Widescreen aspect ratios. It can also be easily personalized and presented with modified font size, font type, color, and shapes to measure your progress in a clear way.
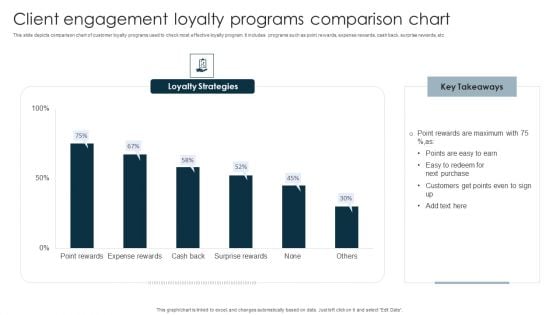
Client Engagement Loyalty Programs Comparison Chart Infographics PDF
This slide depicts comparison chart of customer loyalty programs used to check most effective loyalty program. It includes programs such as point rewards, expense rewards, cash back, surprise rewards, etc. Pitch your topic with ease and precision using this Client Engagement Loyalty Programs Comparison Chart Infographics PDF. This layout presents information on Point Rewards, Next Purchase, Customers. It is also available for immediate download and adjustment. So, changes can be made in the color, design, graphics or any other component to create a unique layout.
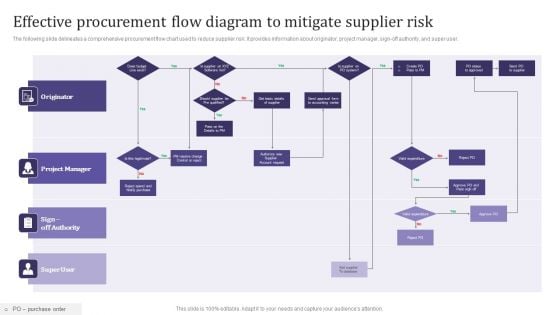
Effective Procurement Flow Diagram To Mitigate Supplier Risk Infographics PDF
The following slide delineates a comprehensive procurement flow chart used to reduce supplier risk. It provides information about originator, project manager, sign-off authority, and super user. Persuade your audience using this Effective Procurement Flow Diagram To Mitigate Supplier Risk Infographics PDF. This PPT design covers four stages, thus making it a great tool to use. It also caters to a variety of topics including Project Manager, Originator, Super User. Download this PPT design now to present a convincing pitch that not only emphasizes the topic but also showcases your presentation skills.
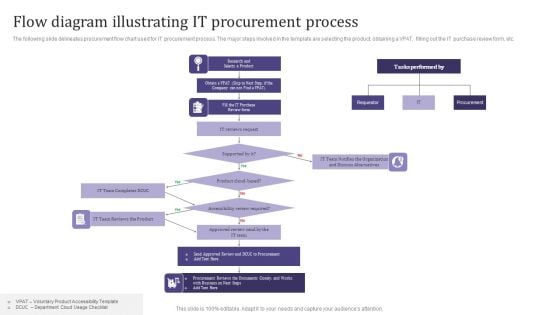
Flow Diagram Illustrating It Procurement Process Infographics PDF
The following slide delineates procurement flow chart used for IT procurement process. The major steps involved in the template are selecting the product, obtaining a VPAT, filling out the IT purchase review form, etc. Persuade your audience using this Flow Diagram Illustrating It Procurement Process Infographics PDF. This PPT design covers one stages, thus making it a great tool to use. It also caters to a variety of topics including Product, Required, Organization. Download this PPT design now to present a convincing pitch that not only emphasizes the topic but also showcases your presentation skills.
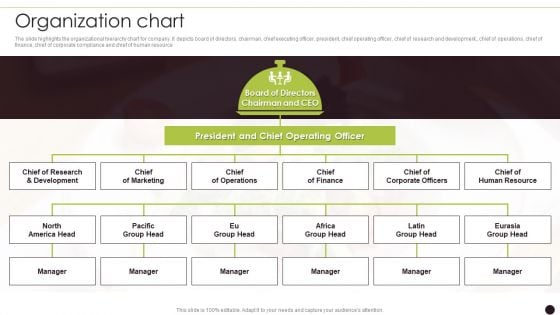
Canned Food Company Profile Organization Chart Infographics PDF
The slide highlights the organizational hierarchy chart for company. It depicts board of directors, chairman, chief executing officer, president, chief operating officer, chief of research and development,, chief of operations, chief of finance, chief of corporate compliance and chief of human resource This is a Canned Food Company Profile Organization Chart Infographics PDF template with various stages. Focus and dispense information on six stages using this creative set, that comes with editable features. It contains large content boxes to add your information on topics like Chief Marketing, Chief Operations, Chief Finance You can also showcase facts, figures, and other relevant content using this PPT layout. Grab it now.
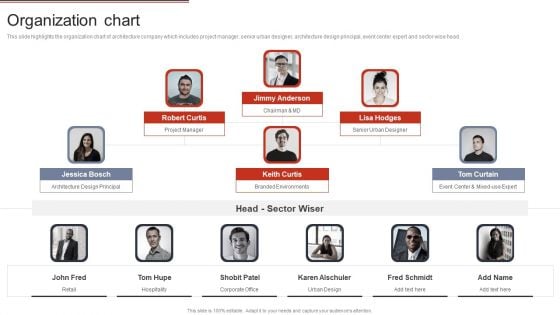
Building Design Firm Details Organization Chart Ppt Infographics Deck PDF
This slide highlights the organization chart of architecture company which includes project manager, senior urban designer, architecture design principal, event center expert and sector wise head. This is a Building Design Firm Details Organization Chart Ppt Infographics Deck PDF template with various stages. Focus and dispense information on four stages using this creative set, that comes with editable features. It contains large content boxes to add your information on topics like Retail, Hospitality, Corporate Office. You can also showcase facts, figures, and other relevant content using this PPT layout. Grab it now.
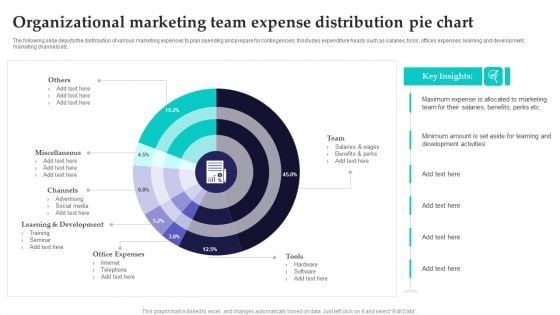
Organizational Marketing Team Expense Distribution Pie Chart Infographics PDF
The following slide depicts the distribution of various marketing expenses to plan spending and prepare for contingencies. It includes expenditure heads such as salaries, tools, offices expenses, learning and development, marketing channels etc. Pitch your topic with ease and precision using this Organizational Marketing Team Expense Distribution Pie Chart Infographics PDF. This layout presents information on Development, Office Expenses, Internet. It is also available for immediate download and adjustment. So, changes can be made in the color, design, graphics or any other component to create a unique layout.
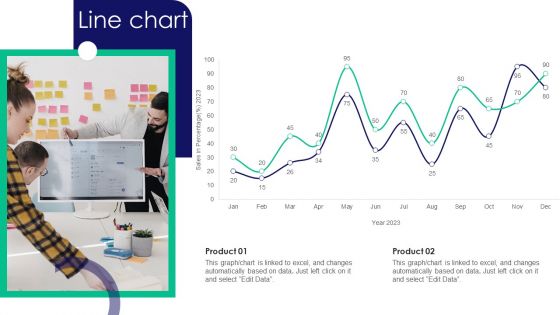
Guide To Business Customer Acquisition Line Chart Infographics PDF
Coming up with a presentation necessitates that the majority of the effort goes into the content and the message you intend to convey. The visuals of a PowerPoint presentation can only be effective if it supplements and supports the story that is being told. Keeping this in mind our experts created Guide To Business Customer Acquisition Line Chart Infographics PDF to reduce the time that goes into designing the presentation. This way, you can concentrate on the message while our designers take care of providing you with the right template for the situation.
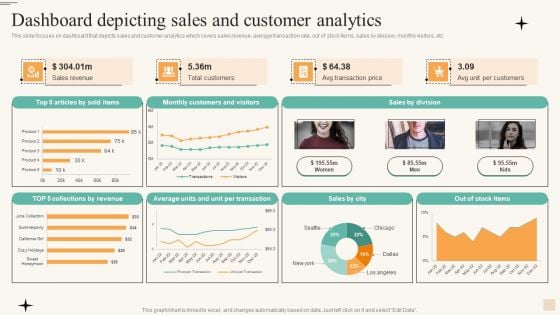
Dashboard Depicting Sales And Customer Analytics Infographics PDF
This slide focuses on dashboard that depicts sales and customer analytics which covers sales revenue, average transaction rate, out of stock items, sales by division, monthly visitors, etc. If you are looking for a format to display your unique thoughts, then the professionally designed Dashboard Depicting Sales And Customer Analytics Infographics PDF is the one for you. You can use it as a Google Slides template or a PowerPoint template. Incorporate impressive visuals, symbols, images, and other charts. Modify or reorganize the text boxes as you desire. Experiment with shade schemes and font pairings. Alter, share or cooperate with other people on your work. Download Dashboard Depicting Sales And Customer Analytics Infographics PDF and find out how to give a successful presentation. Present a perfect display to your team and make your presentation unforgettable.
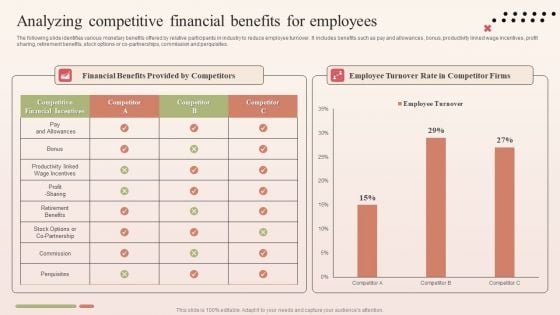
Analyzing Competitive Financial Benefits For Employees Infographics PDF
The following slide identifies various monetary benefits offered by relative participants in industry to reduce employee turnover. It includes benefits such as pay and allowances, bonus, productivity linked wage incentives, profit sharing, retirement benefits, stock options or co-partnerships, commission and perquisites. If you are looking for a format to display your unique thoughts, then the professionally designed Analyzing Competitive Financial Benefits For Employees Infographics PDF is the one for you. You can use it as a Google Slides template or a PowerPoint template. Incorporate impressive visuals, symbols, images, and other charts. Modify or reorganize the text boxes as you desire. Experiment with shade schemes and font pairings. Alter, share or cooperate with other people on your work. Download Analyzing Competitive Financial Benefits For Employees Infographics PDF and find out how to give a successful presentation. Present a perfect display to your team and make your presentation unforgettable.
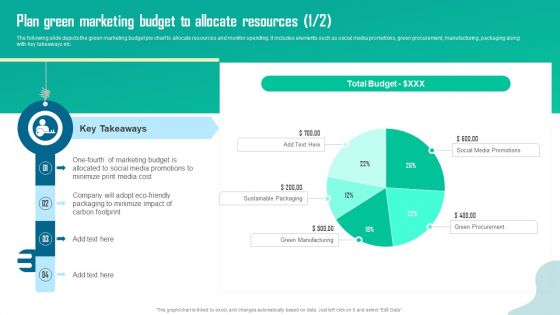
Plan Green Marketing Budget To Allocate Resources Infographics PDF
The following slide depicts the green marketing budget pie chart to allocate resources and monitor spending. It includes elements such as social media promotions, green procurement, manufacturing, packaging along with key takeaways etc. Do you have to make sure that everyone on your team knows about any specific topic I yes, then you should give Plan Green Marketing Budget To Allocate Resources Infographics PDF a try. Our experts have put a lot of knowledge and effort into creating this impeccable Plan Green Marketing Budget To Allocate Resources Infographics PDF. You can use this template for your upcoming presentations, as the slides are perfect to represent even the tiniest detail. You can download these templates from the Slidegeeks website and these are easy to edit. So grab these today.
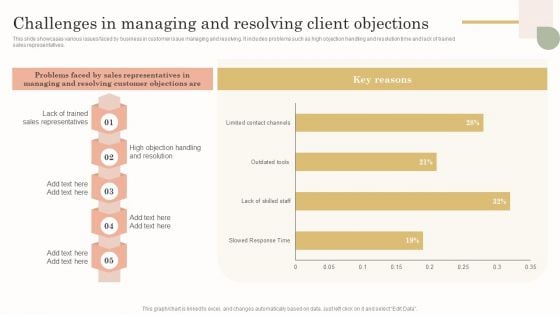
Challenges In Managing And Resolving Client Objections Infographics PDF
This slide showcases various issues faced by business in customer issue managing and resolving. It includes problems such as high objection handling and resolution time and lack of trained sales representatives. If you are looking for a format to display your unique thoughts, then the professionally designed Challenges In Managing And Resolving Client Objections Infographics PDF is the one for you. You can use it as a Google Slides template or a PowerPoint template. Incorporate impressive visuals, symbols, images, and other charts. Modify or reorganize the text boxes as you desire. Experiment with shade schemes and font pairings. Alter, share or cooperate with other people on your work. Download Challenges In Managing And Resolving Client Objections Infographics PDF and find out how to give a successful presentation. Present a perfect display to your team and make your presentation unforgettable.
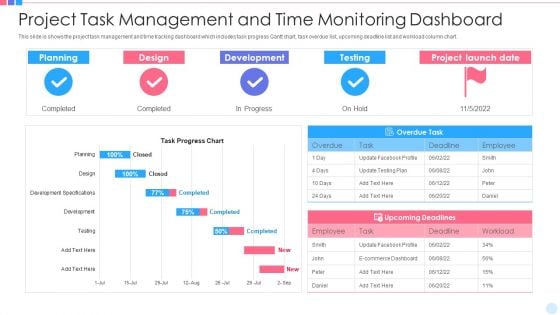
Project Task Management And Time Monitoring Dashboard Infographics PDF
This slide is shows the project task management and time tracking dashboard which includes task progress Gantt chart, task overdue list, upcoming deadline list and workload column chart. Pitch your topic with ease and precision using this project task management and time monitoring dashboard infographics pdf. This layout presents information on planning, design, development. It is also available for immediate download and adjustment. So, changes can be made in the color, design, graphics or any other component to create a unique layout.
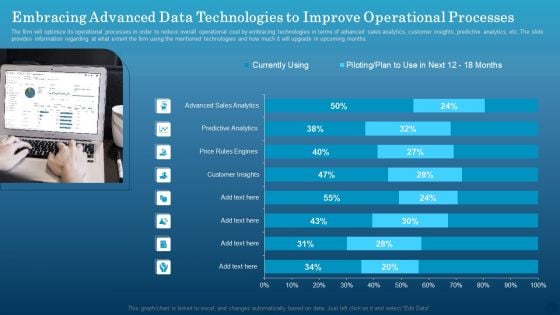
Embracing Advanced Data Technologies To Improve Operational Processes Infographics PDF
The firm will optimize its operational processes in order to reduce overall operational cost by embracing technologies in terms of advanced sales analytics, customer insights, predictive analytics, etc. The slide provides information regarding at what extent the firm using the mentioned technologies and how much it will upgrade in upcoming months. Formulating a presentation can take up a lot of effort and time, so the content and message should always be the primary focus. The visuals of the PowerPoint can enhance the presenters message, so our Embracing Advanced Data Technologies To Improve Operational Processes Infographics PDF was created to help save time. Instead of worrying about the design, the presenter can concentrate on the message while our designers work on creating the ideal templates for whatever situation is needed. Slidegeeks has experts for everything from amazing designs to valuable content, we have put everything into Embracing Advanced Data Technologies To Improve Operational Processes Infographics PDF.
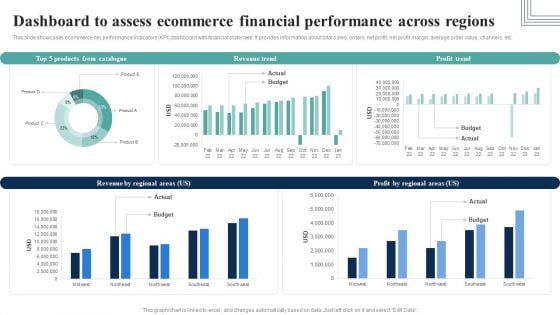
Dashboard To Assess Ecommerce Financial Performance Across Regions Infographics PDF
This slide showcases ecommerce key performance indicators KPI dashboard with financial statement. It provides information about total sales, orders, net profit, net profit margin, average order value, channels, etc.Here you can discover an assortment of the finest PowerPoint and Google Slides templates. With these templates, you can create presentations for a variety of purposes while simultaneously providing your audience with an eye-catching visual experience. Download Dashboard To Assess Ecommerce Financial Performance Across Regions Infographics PDF to deliver an impeccable presentation. These templates will make your job of preparing presentations much quicker, yet still, maintain a high level of quality. Slidegeeks has experienced researchers who prepare these templates and write high-quality content for you. Later on, you can personalize the content by editing the Dashboard To Assess Ecommerce Financial Performance Across Regions Infographics PDF.

Enterprise Risk Management Enterprise Cyber Risk Management Dashboard Infographics PDF
This slide represents dashboard representing details related to management of strategic risks in the organization. It includes details related to risk rating breakdown, risk heat map, top 5 vulnerabilities etc. Do you have an important presentation coming up Are you looking for something that will make your presentation stand out from the rest Look no further than Enterprise Risk Management Enterprise Cyber Risk Management Dashboard Infographics PDF. With our professional designs, you can trust that your presentation will pop and make delivering it a smooth process. And with Slidegeeks, you can trust that your presentation will be unique and memorable. So why wait Grab Enterprise Risk Management Enterprise Cyber Risk Management Dashboard Infographics PDF today and make your presentation stand out from the rest.
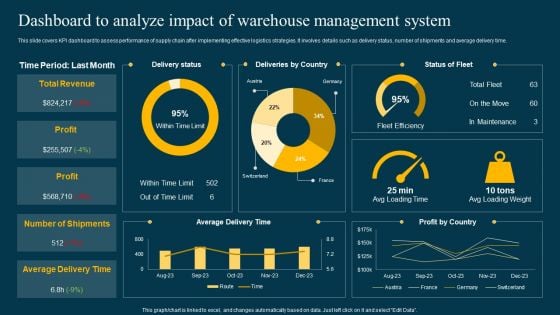
Dashboard To Analyze Impact Of Warehouse Management System Infographics PDF
This slide covers cost analysis for implementing automation procurement tools in logistics and supply chain management. It involves optimization tools, cost involved on monthly basis and its impact on operations. Get a simple yet stunning designed Dashboard To Analyze Impact Of Warehouse Management System Infographics PDF. It is the best one to establish the tone in your meetings. It is an excellent way to make your presentations highly effective. So, download this PPT today from Slidegeeks and see the positive impacts. Our easy-to-edit Dashboard To Analyze Impact Of Warehouse Management System Infographics PDF can be your go-to option for all upcoming conferences and meetings. So, what are you waiting for. Grab this template today.
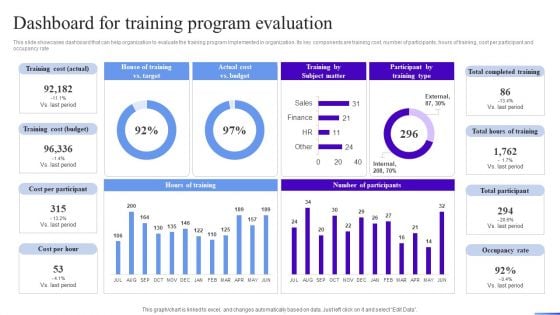
Business Development Program Dashboard For Training Program Evaluation Infographics PDF
This slide showcases dashboard that can help organization to evaluate the training program implemented in organization. Its key components are training cost, number of participants, hours of training, cost per participant and occupancy rate. Get a simple yet stunning designed Business Development Program Dashboard For Training Program Evaluation Infographics PDF. It is the best one to establish the tone in your meetings. It is an excellent way to make your presentations highly effective. So, download this PPT today from Slidegeeks and see the positive impacts. Our easy-to-edit Business Development Program Dashboard For Training Program Evaluation Infographics PDF can be your go-to option for all upcoming conferences and meetings. So, what are you waiting for Grab this template today.
Marketing Activities Tracking Dashboard For Insurance Agency Infographics PDF
This slide provides glimpse about essential marketing activities tracking dashboard for insurance agency in terms of campaign spend by product line, marketing calendar, campaign revenue analysis, etc. Find highly impressive Marketing Activities Tracking Dashboard For Insurance Agency Infographics PDF on Slidegeeks to deliver a meaningful presentation. You can save an ample amount of time using these presentation templates. No need to worry to prepare everything from scratch because Slidegeeks experts have already done a huge research and work for you. You need to download Marketing Activities Tracking Dashboard For Insurance Agency Infographics PDF for your upcoming presentation. All the presentation templates are 100 percent editable and you can change the color and personalize the content accordingly. Download now
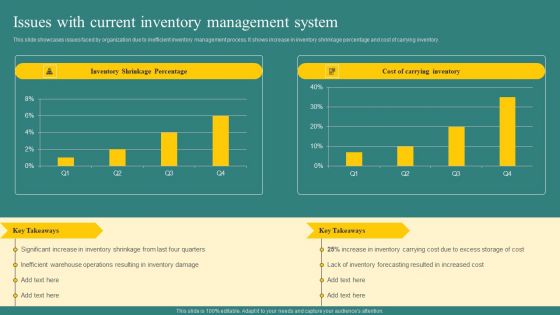
Issues With Current Inventory Management System Infographics PDF
This slide showcases issues faced by organization due to inefficient inventory management process. It shows increase in inventory shrinkage percentage and cost of carrying inventory. Do you have to make sure that everyone on your team knows about any specific topic I yes, then you should give Issues With Current Inventory Management System Infographics PDF a try. Our experts have put a lot of knowledge and effort into creating this impeccable Issues With Current Inventory Management System Infographics PDF. You can use this template for your upcoming presentations, as the slides are perfect to represent even the tiniest detail. You can download these templates from the Slidegeeks website and these are easy to edit. So grab these today.

 Home
Home