Infographic Icons
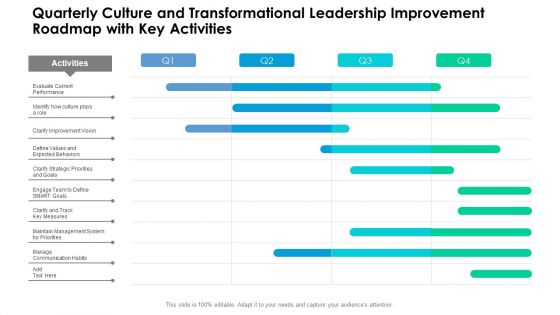
Quarterly Culture And Transformational Leadership Improvement Roadmap With Key Activities Infographics
We present our quarterly culture and transformational leadership improvement roadmap with key activities infographics. This PowerPoint layout is easy to edit so you can change the font size, font type, color, and shape conveniently. In addition to this, the PowerPoint layout is Google Slides compatible, so you can share it with your audience and give them access to edit it. Therefore, download and save this well researched quarterly culture and transformational leadership improvement roadmap with key activities infographics in different formats like PDF, PNG, and JPG to smoothly execute your business plan.
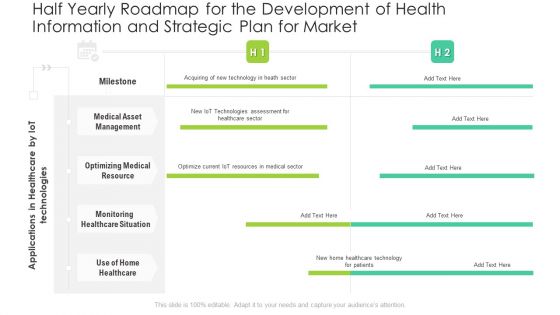
Half Yearly Roadmap For The Development Of Health Information And Strategic Plan For Market Infographics
We present our half yearly roadmap for the development of health information and strategic plan for market infographics. This PowerPoint layout is easy to edit so you can change the font size, font type, color, and shape conveniently. In addition to this, the PowerPoint layout is Google Slides compatible, so you can share it with your audience and give them access to edit it. Therefore, download and save this well researched half yearly roadmap for the development of health information and strategic plan for market infographics in different formats like PDF, PNG, and JPG to smoothly execute your business plan.
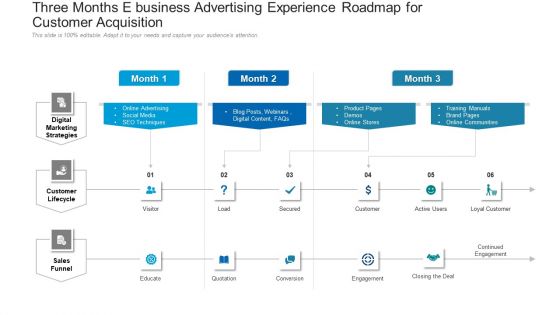
Three Months E Business Advertising Experience Roadmap For Customer Acquisition Infographics
We present our three months e business advertising experience roadmap for customer acquisition infographics. This PowerPoint layout is easy to edit so you can change the font size, font type, color, and shape conveniently. In addition to this, the PowerPoint layout is Google Slides compatible, so you can share it with your audience and give them access to edit it. Therefore, download and save this well researched three months e business advertising experience roadmap for customer acquisition infographics in different formats like PDF, PNG, and JPG to smoothly execute your business plan.

Half Yearly Agile Strategic Roadmap For Game Deployment Action Layout Infographics
We present our half yearly agile strategic roadmap for game deployment action layout infographics. This PowerPoint layout is easy to edit so you can change the font size, font type, color, and shape conveniently. In addition to this, the PowerPoint layout is Google Slides compatible, so you can share it with your audience and give them access to edit it. Therefore, download and save this well researched half yearly agile strategic roadmap for game deployment action layout infographics in different formats like PDF, PNG, and JPG to smoothly execute your business plan.
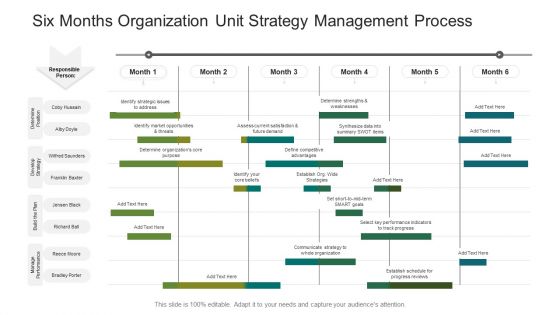
Six Months Organization Unit Strategy Management Process Ppt Infographics Themes PDF
Introducing our six months organization unit strategy management process ppt infographics themes pdf. This PPT presentation is Google Slides compatible, therefore, you can share it easily with the collaborators for measuring the progress. Also, the presentation is available in both standard screen and widescreen aspect ratios. So edit the template design by modifying the font size, font type, color, and shapes as per your requirements. As this PPT design is fully editable it can be presented in PDF, JPG and PNG formats.
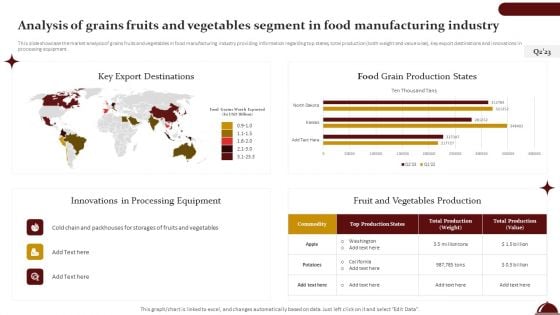
Analysis Of Grains Fruits And Vegetables Segment In Food Manufacturing Industry Infographics PDF
This slide showcase the market analysis of grains fruits and vegetables in food manufacturing industry providing information regarding top states, total production both weight and value wise, key export destinations and innovations in processing equipment. Presenting this PowerPoint presentation, titled Analysis Of Grains Fruits And Vegetables Segment In Food Manufacturing Industry Infographics PDF, with topics curated by our researchers after extensive research. This editable presentation is available for immediate download and provides attractive features when used. Download now and captivate your audience. Presenting this Analysis Of Grains Fruits And Vegetables Segment In Food Manufacturing Industry Infographics PDF. Our researchers have carefully researched and created these slides with all aspects taken into consideration. This is a completely customizable Analysis Of Grains Fruits And Vegetables Segment In Food Manufacturing Industry Infographics PDF that is available for immediate downloading. Download now and make an impact on your audience. Highlight the attractive features available with our PPTs.
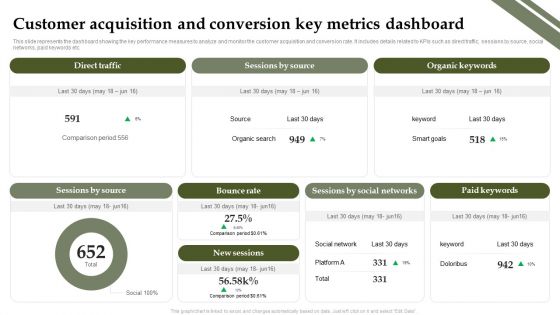
Analyzing And Deploying Effective CMS Customer Acquisition And Conversion Key Metrics Dashboard Infographics PDF
This slide represents the dashboard showing the key performance measures to analyze and monitor the customer acquisition and conversion rate. It includes details related to KPIs such as direct traffic, sessions by source, social networks, paid keywords etc. Presenting this PowerPoint presentation, titled Analyzing And Deploying Effective CMS Customer Acquisition And Conversion Key Metrics Dashboard Infographics PDF, with topics curated by our researchers after extensive research. This editable presentation is available for immediate download and provides attractive features when used. Download now and captivate your audience. Presenting this Analyzing And Deploying Effective CMS Customer Acquisition And Conversion Key Metrics Dashboard Infographics PDF. Our researchers have carefully researched and created these slides with all aspects taken into consideration. This is a completely customizable Analyzing And Deploying Effective CMS Customer Acquisition And Conversion Key Metrics Dashboard Infographics PDF that is available for immediate downloading. Download now and make an impact on your audience. Highlight the attractive features available with our PPTs.
Strategies To Maintain Transportation Shipping And Logistics Tracking Dashboard With Shipments Ppt Infographics Information PDF
This slide covers Key performance indicators to track the automation system of the company. This dashboard includes Logistics Efficiency Status, delivery time accuracy etc. Presenting this PowerPoint presentation, titled Strategies To Maintain Transportation Shipping And Logistics Tracking Dashboard With Shipments Ppt Infographics Information PDF, with topics curated by our researchers after extensive research. This editable presentation is available for immediate download and provides attractive features when used. Download now and captivate your audience. Presenting this Strategies To Maintain Transportation Shipping And Logistics Tracking Dashboard With Shipments Ppt Infographics Information PDF. Our researchers have carefully researched and created these slides with all aspects taken into consideration. This is a completely customizable Strategies To Maintain Transportation Shipping And Logistics Tracking Dashboard With Shipments Ppt Infographics Information PDF that is available for immediate downloading. Download now and make an impact on your audience. Highlight the attractive features available with our PPTs.
Marketers Guide To Data Analysis Optimization KPI Dashboard For Tracking Email Marketing Campaign Infographics PDF
This slide covers the dashboard for analyzing email marketing metrics such as overall open rate, click-through rate, click-to-open ratio, unsubscribe rate, hard bounce rate, soft rate, monthly open rate, total monthly subscribers, etc. Presenting this PowerPoint presentation, titled Marketers Guide To Data Analysis Optimization KPI Dashboard For Tracking Email Marketing Campaign Infographics PDF, with topics curated by our researchers after extensive research. This editable presentation is available for immediate download and provides attractive features when used. Download now and captivate your audience. Presenting this Marketers Guide To Data Analysis Optimization KPI Dashboard For Tracking Email Marketing Campaign Infographics PDF. Our researchers have carefully researched and created these slides with all aspects taken into consideration. This is a completely customizable Marketers Guide To Data Analysis Optimization KPI Dashboard For Tracking Email Marketing Campaign Infographics PDF that is available for immediate downloading. Download now and make an impact on your audience. Highlight the attractive features available with our PPTs.
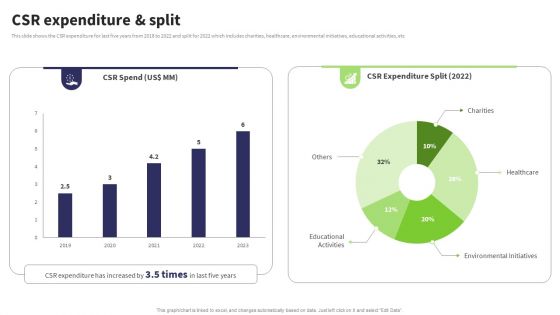
Website Design And Development Services Company Profile Csr Expenditure Infographics PDF
This slide shows the CSR expenditure for last five years from 2018 to 2022 and split for 2022 which includes charities, healthcare, environmental initiatives, educational activities, etc. Presenting this PowerPoint presentation, titled Website Design And Development Services Company Profile Csr Expenditure Infographics PDF, with topics curated by our researchers after extensive research. This editable presentation is available for immediate download and provides attractive features when used. Download now and captivate your audience. Presenting this Website Design And Development Services Company Profile Csr Expenditure Infographics PDF. Our researchers have carefully researched and created these slides with all aspects taken into consideration. This is a completely customizable Website Design And Development Services Company Profile Csr Expenditure Infographics PDF that is available for immediate downloading. Download now and make an impact on your audience. Highlight the attractive features available with our PPTs.
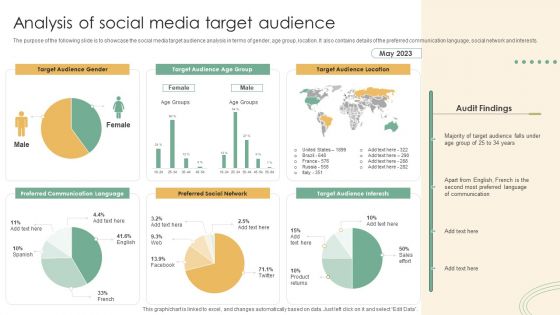
Online Marketing Techniques Assessment Approach Analysis Of Social Media Target Audience Infographics PDF
Presenting this PowerPoint presentation, titled Online Marketing Techniques Assessment Approach Analysis Of Social Media Target Audience Infographics PDF, with topics curated by our researchers after extensive research. This editable presentation is available for immediate download and provides attractive features when used. Download now and captivate your audience. Presenting this Online Marketing Techniques Assessment Approach Analysis Of Social Media Target Audience Infographics PDF. Our researchers have carefully researched and created these slides with all aspects taken into consideration. This is a completely customizable Online Marketing Techniques Assessment Approach Analysis Of Social Media Target Audience Infographics PDF that is available for immediate downloading. Download now and make an impact on your audience. Highlight the attractive features available with our PPTs.
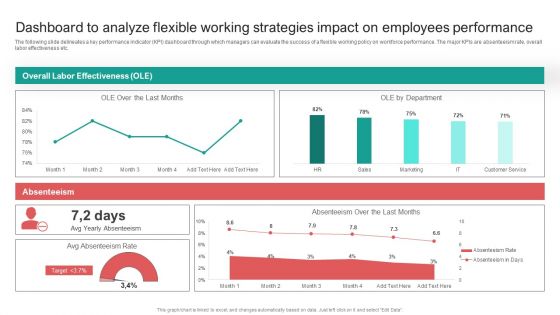
Dashboard To Analyze Flexible Working Strategies Impact On Employees Performance Infographics PDF
The following slide delineates a key performance indicator KPI dashboard through which managers can evaluate the success of a flexible working policy on workforce performance. The major KPIs are absenteeism rate, overall labor effectiveness etc. Presenting this PowerPoint presentation, titled Dashboard To Analyze Flexible Working Strategies Impact On Employees Performance Infographics PDF, with topics curated by our researchers after extensive research. This editable presentation is available for immediate download and provides attractive features when used. Download now and captivate your audience. Presenting this Dashboard To Analyze Flexible Working Strategies Impact On Employees Performance Infographics PDF. Our researchers have carefully researched and created these slides with all aspects taken into consideration. This is a completely customizable Dashboard To Analyze Flexible Working Strategies Impact On Employees Performance Infographics PDF that is available for immediate downloading. Download now and make an impact on your audience. Highlight the attractive features available with our PPTs.
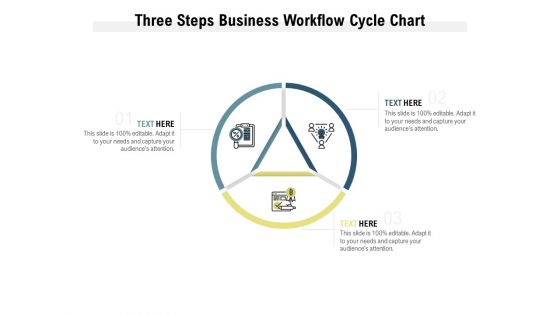
Three Steps Business Workflow Cycle Chart Ppt PowerPoint Presentation Infographics Vector
Presenting this set of slides with name three steps business workflow cycle chart ppt powerpoint presentation infographics vector. This is a three stage process. The stages in this process are three steps business workflow cycle chart. This is a completely editable PowerPoint presentation and is available for immediate download. Download now and impress your audience.
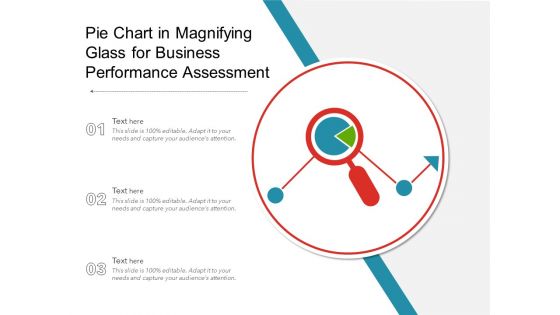
Pie Chart In Magnifying Glass For Business Performance Assessment Ppt PowerPoint Presentation Gallery Infographics PDF
Presenting this set of slides with name pie chart in magnifying glass for business performance assessment ppt powerpoint presentation gallery infographics pdf. This is a three stage process. The stages in this process are pie chart in magnifying glass for business performance assessment. This is a completely editable PowerPoint presentation and is available for immediate download. Download now and impress your audience.
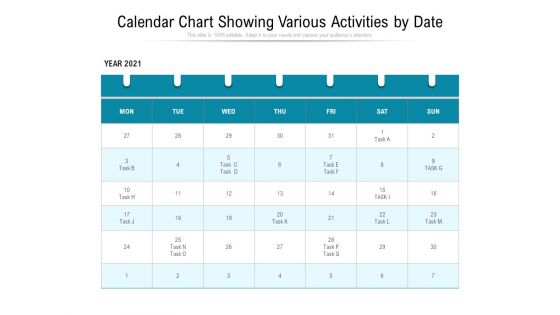
Calendar Chart Showing Various Activities By Date Ppt PowerPoint Presentation Infographics Maker PDF
Pitch your topic with ease and precision using this calendar chart showing various activities by date ppt powerpoint presentation infographics maker pdf. This layout presents information on calendar chart showing various activities by date. It is also available for immediate download and adjustment. So, changes can be made in the color, design, graphics or any other component to create a unique layout.
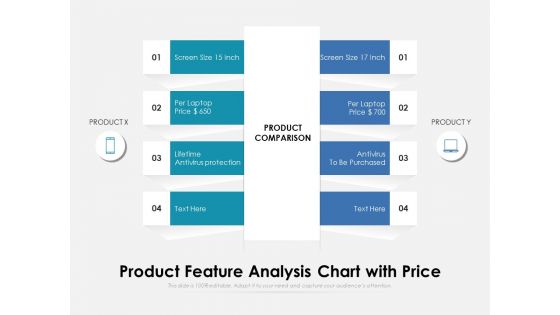
Product Feature Analysis Chart With Price Ppt PowerPoint Presentation Gallery Infographics PDF
Pitch your topic with ease and precision using this product feature analysis chart with price ppt powerpoint presentation gallery infographics pdf. This layout presents information on product feature analysis chart with price. It is also available for immediate download and adjustment. So, changes can be made in the color, design, graphics or any other component to create a unique layout.
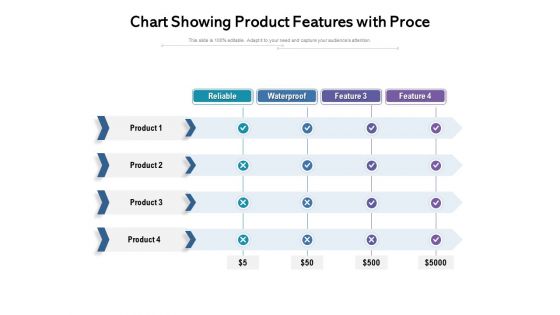
Chart Showing Product Features With Proce Ppt PowerPoint Presentation File Infographics PDF
Pitch your topic with ease and precision using this chart showing product features with proce ppt powerpoint presentation file infographics pdf. This layout presents information on chart showing product features with proce. It is also available for immediate download and adjustment. So, changes can be made in the colour, design, graphics or any other component to create a unique layout.
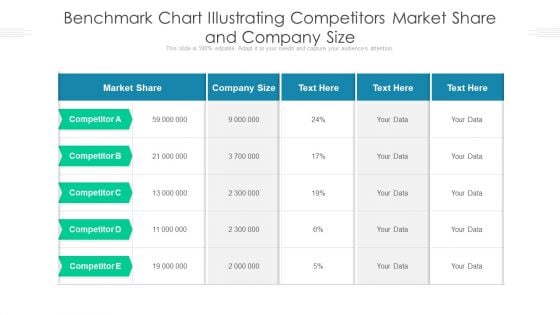
Benchmark Chart Illustrating Competitors Market Share And Company Size Ppt PowerPoint Presentation Infographics Graphics PDF
Showcasing this set of slides titled benchmark chart illustrating competitors market share and company size ppt powerpoint presentation infographics graphics pdf. The topics addressed in these templates are benchmark chart illustrating competitors market share and company size. All the content presented in this PPT design is completely editable. Download it and make adjustments in color, background, font etc. as per your unique business setting.
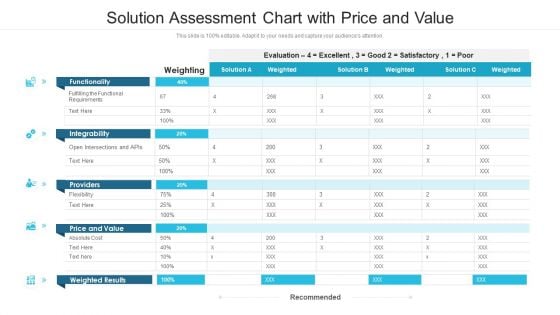
Solution Assessment Chart With Price And Value Ppt PowerPoint Presentation Infographics Sample PDF
Showcasing this set of slides titled solution assessment chart with price and value ppt powerpoint presentation infographics sample pdf. The topics addressed in these templates are solution assessment chart with price and value. All the content presented in this PPT design is completely editable. Download it and make adjustments in color, background, font etc. as per your unique business setting.
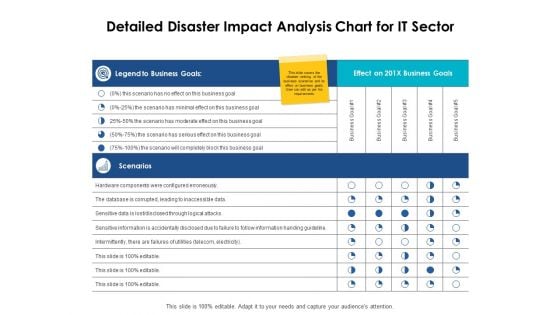
Detailed Disaster Impact Analysis Chart For It Sector Ppt PowerPoint Presentation Infographics Portrait
Presenting this set of slides with name detailed disaster impact analysis chart for it sector ppt powerpoint presentation infographics portrait. The topics discussed in these slides are strength, marketing, business, management, planning. This is a completely editable PowerPoint presentation and is available for immediate download. Download now and impress your audience.
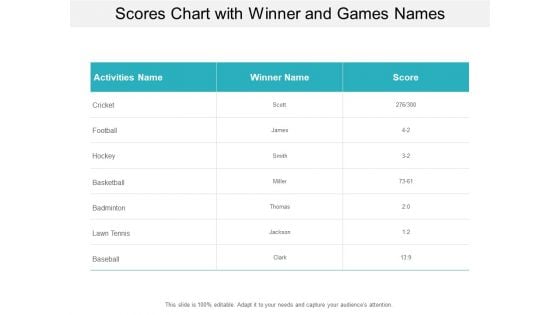
Scores Chart With Winner And Games Names Ppt PowerPoint Presentation Infographics Skills
Presenting this set of slides with name scores chart with winner and games names ppt powerpoint presentation infographics skills. The topics discussed in these slides are marketing, strategy, management. This is a completely editable PowerPoint presentation and is available for immediate download. Download now and impress your audience.
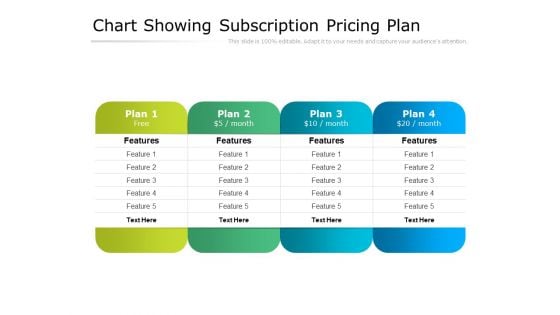
Chart Showing Subscription Pricing Plan Ppt PowerPoint Presentation Infographics Graphics Download
Presenting this set of slides with name chart showing subscription pricing plan ppt powerpoint presentation infographics graphics download. This is a four stage process. The stages in this process are features, plan. This is a completely editable PowerPoint presentation and is available for immediate download. Download now and impress your audience.
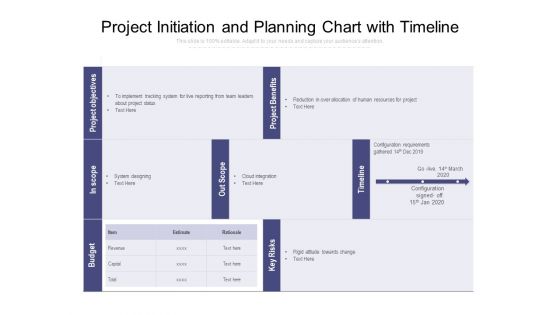
Project Initiation And Planning Chart With Timeline Ppt PowerPoint Presentation Infographics Skills PDF
Presenting this set of slides with name project initiation and planning chart with timeline ppt powerpoint presentation infographics skills pdf. The topics discussed in these slides are timeline, key risks, budget, in scope, project objectives, project benefits. This is a completely editable PowerPoint presentation and is available for immediate download. Download now and impress your audience.
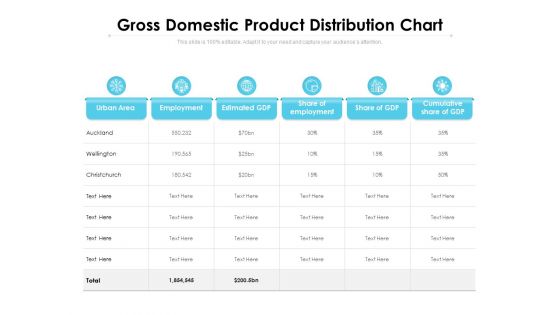
Gross Domestic Product Distribution Chart Ppt PowerPoint Presentation Infographics Show PDF
Presenting this set of slides with name gross domestic product distribution chart ppt powerpoint presentation infographics show pdf. The topics discussed in these slides are urban area, employment, estimated gdp, share of employment, share of gdp, cumulative share of gdp. This is a completely editable PowerPoint presentation and is available for immediate download. Download now and impress your audience.
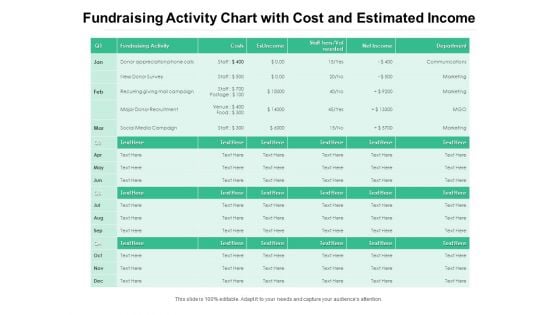
Fundraising Activity Chart With Cost And Estimated Income Ppt PowerPoint Presentation Infographics Design Templates PDF
Presenting this set of slides with name fundraising activity chart with cost and estimated income ppt powerpoint presentation infographics design templates pdf. The topics discussed in these slides are fundraising activity, costs, est income, net income, department, communications, marketing. This is a completely editable PowerPoint presentation and is available for immediate download. Download now and impress your audience.
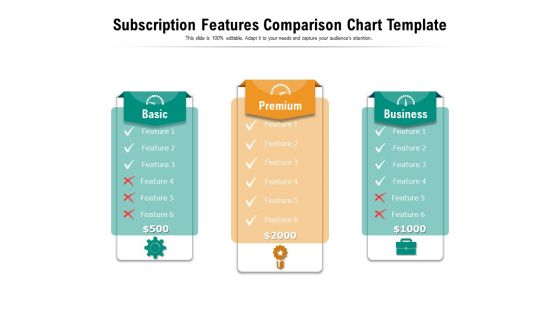
Subscription Features Comparison Chart Template Ppt PowerPoint Presentation Pictures Infographics PDF
Presenting this set of slides with name subscription features comparison chart template ppt powerpoint presentation pictures infographics pdf. This is a three stage process. The stages in this process are basic, premium, business. This is a completely editable PowerPoint presentation and is available for immediate download. Download now and impress your audience.
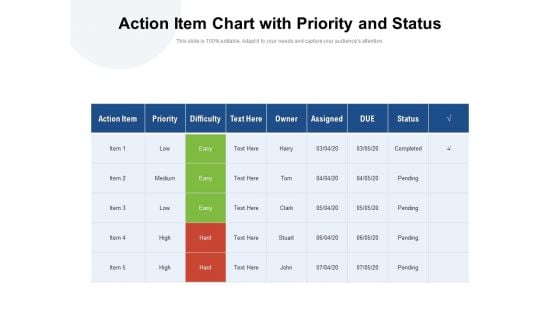
Action Item Chart With Priority And Status Ppt PowerPoint Presentation Infographics Design Templates PDF
Presenting this set of slides with name action item chart with priority and status ppt powerpoint presentation infographics design templates pdf. The topics discussed in these slides are action item, priority, difficulty, owner, assigned, due, status. This is a completely editable PowerPoint presentation and is available for immediate download. Download now and impress your audience.
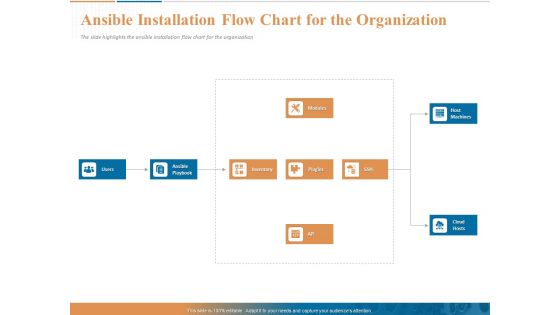
Ansible Installation Flow Chart For The Organization Ppt PowerPoint Presentation Infographics Microsoft PDF
Presenting this set of slides with name ansible installation flow chart for the organization ppt powerpoint presentation infographics microsoft pdf. This is a nine stage process. The stages in this process are modules, host machines, cloud, hosts, api, inventory, plugins, ssh, ansible playbook, users. This is a completely editable PowerPoint presentation and is available for immediate download. Download now and impress your audience.
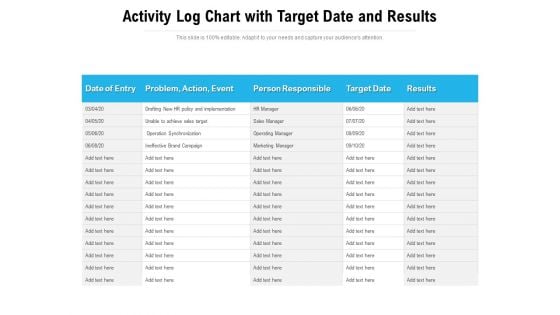
Activity Log Chart With Target Date And Results Ppt PowerPoint Presentation Infographics Ideas PDF
Presenting this set of slides with name activity log chart with target date and results ppt powerpoint presentation infographics ideas pdf. The topics discussed in these slides are date of entry, problem, action, event, person responsible, target date, ineffective brand campaign. This is a completely editable PowerPoint presentation and is available for immediate download. Download now and impress your audience.
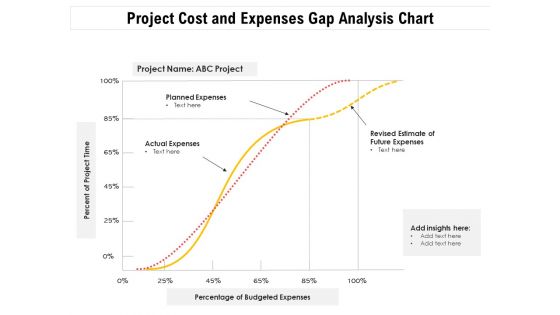
Project Cost And Expenses Gap Analysis Chart Ppt PowerPoint Presentation Infographics Graphics PDF
Presenting this set of slides with name project cost and expenses gap analysis chart ppt powerpoint presentation infographics graphics pdf. The topics discussed in these slides are planned expenses, actual expenses, revised estimate of future expenses, percent of project time, percentage of budgeted expenses. This is a completely editable PowerPoint presentation and is available for immediate download. Download now and impress your audience.
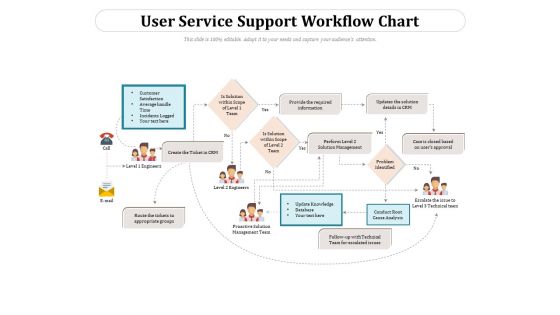
User Service Support Workflow Chart Ppt PowerPoint Presentation Gallery Infographics PDF
Presenting this set of slides with name user service support workflow chart ppt powerpoint presentation gallery infographics pdf. This is a one stage process. The stages in this process are management, technical, analysis. This is a completely editable PowerPoint presentation and is available for immediate download. Download now and impress your audience.

Benefits Realization Management Process Flow Chart Ppt PowerPoint Presentation Infographics Background Images PDF
Presenting this set of slides with name benefits realization management process flow chart ppt powerpoint presentation infographics background images pdf. This is a five stage process. The stages in this process are enabler, business changes, intermediate benefits, end benefits objective. This is a completely editable PowerPoint presentation and is available for immediate download. Download now and impress your audience.
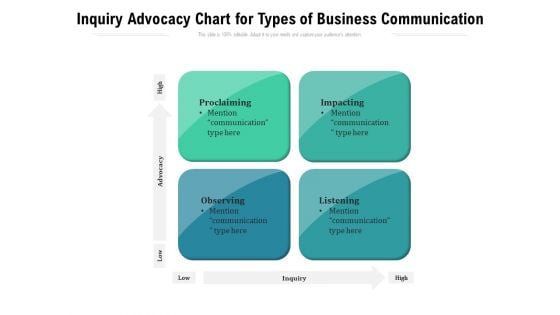
Inquiry Advocacy Chart For Types Of Business Communication Ppt PowerPoint Presentation Infographics Summary PDF
Presenting this set of slides with name inquiry advocacy chart for types of business communication ppt powerpoint presentation infographics summary pdf. This is a four stage process. The stages in this process are proclaiming, impacting, observing, listening, mention communication, inquiry, high, low. This is a completely editable PowerPoint presentation and is available for immediate download. Download now and impress your audience.
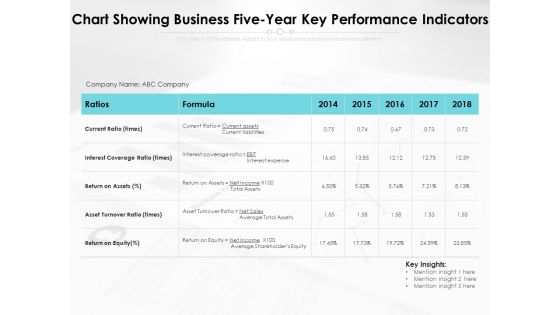
Chart Showing Business Five Year Key Performance Indicators Ppt PowerPoint Presentation File Infographics PDF
Presenting this set of slides with name chart showing business five year key performance indicators ppt powerpoint presentation file infographics pdf. The topics discussed in these slides are liabilities, equity, assets. This is a completely editable PowerPoint presentation and is available for immediate download. Download now and impress your audience.
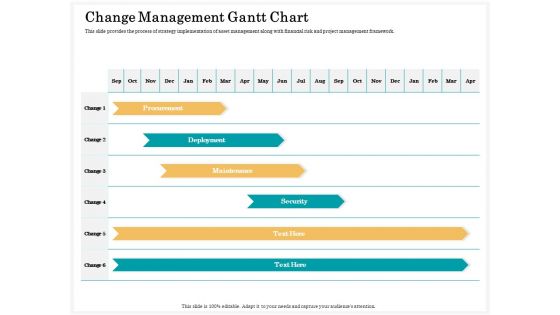
Application Life Cycle Analysis Capital Assets Change Management Gantt Chart Infographics PDF
Presenting this set of slides with name application life cycle analysis capital assets change management gantt chart infographics pdf. The topics discussed in these slides are procurement, deployment, maintenance, security. This is a completely editable PowerPoint presentation and is available for immediate download. Download now and impress your audience.
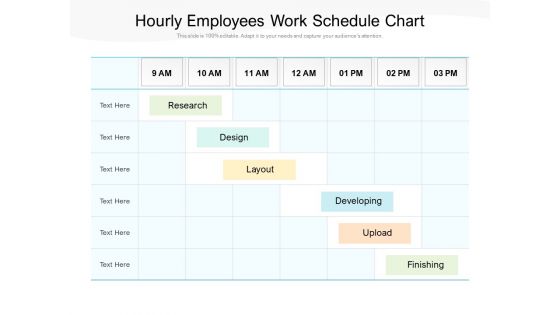
Hourly Employees Work Schedule Chart Ppt PowerPoint Presentation Infographics Example PDF
Pitch your topic with ease and precision using this hourly employees work schedule chart ppt powerpoint presentation infographics example pdf. This layout presents information on research, design, layout, developing, upload, finishing. It is also available for immediate download and adjustment. So, changes can be made in the color, design, graphics or any other component to create a unique layout.
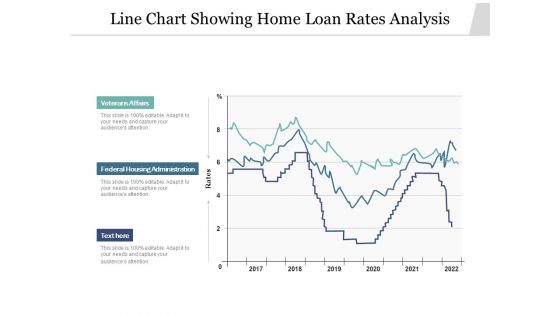
Line Chart Showing Home Loan Rates Analysis Ppt PowerPoint Presentation Inspiration Infographics PDF
Pitch your topic with ease and precision using this line chart showing home loan rates analysis ppt powerpoint presentation inspiration infographics pdf. This layout presents information on veterans affairs, federal housing administration, 2017 to 2022. It is also available for immediate download and adjustment. So, changes can be made in the color, design, graphics or any other component to create a unique layout.
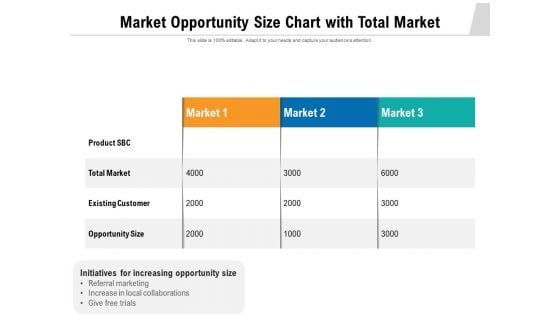
Market Opportunity Size Chart With Total Market Ppt PowerPoint Presentation Infographics Maker PDF
Pitch your topic with ease and precision using this market opportunity size chart with total market ppt powerpoint presentation infographics maker pdf. This layout presents information on product SBC, total market, existing customer, opportunity size. It is also available for immediate download and adjustment. So, changes can be made in the color, design, graphics or any other component to create a unique layout.
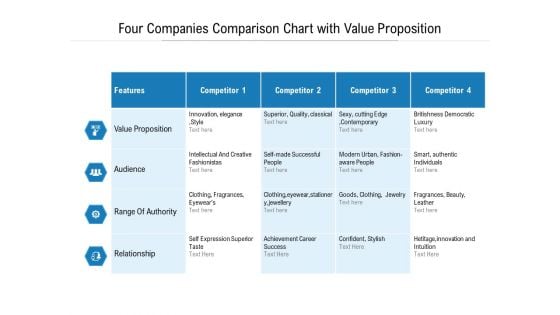
Four Companies Comparison Chart With Value Proposition Ppt PowerPoint Presentation Infographics Smartart PDF
Showcasing this set of slides titled four companies comparison chart with value proposition ppt powerpoint presentation infographics smartart pdf. The topics addressed in these templates are value proposition, audience, range authority, relationship. All the content presented in this PPT design is completely editable. Download it and make adjustments in color, background, font etc. as per your unique business setting.
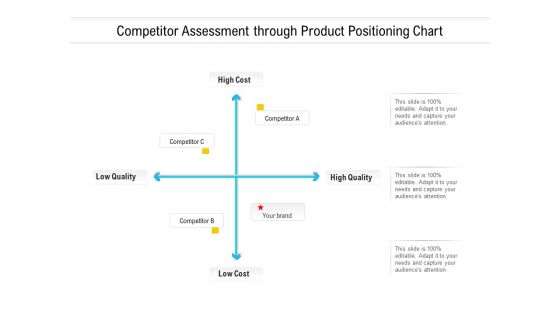
Competitor Assessment Through Product Positioning Chart Ppt PowerPoint Presentation Portfolio Infographics PDF
Showcasing this set of slides titled competitor assessment through product positioning chart ppt powerpoint presentation portfolio infographics pdf. The topics addressed in these templates are competitor, high cost, low quality, low cost, high quality. All the content presented in this PPT design is completely editable. Download it and make adjustments in color, background, font etc. as per your unique business setting.
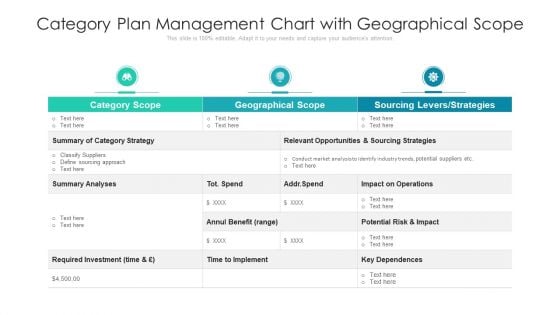
Category Plan Management Chart With Geographical Scope Ppt Infographics Designs Download PDF
Showcasing this set of slides titled category plan management chart with geographical scope ppt infographics designs download pdf. The topics addressed in these templates are opportunities, investment, impact on operations. All the content presented in this PPT design is completely editable. Download it and make adjustments in color, background, font etc. as per your unique business setting.
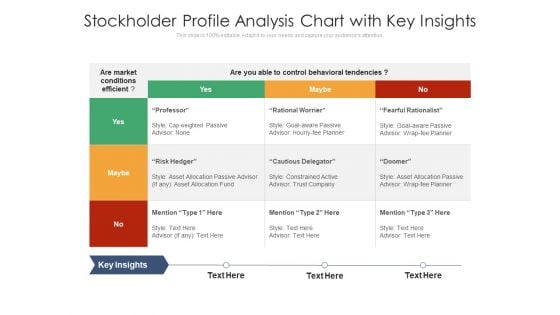
Stockholder Profile Analysis Chart With Key Insights Ppt PowerPoint Presentation Visual Aids Infographics PDF
Showcasing this set of slides titled stockholder profile analysis chart with key insights ppt powerpoint presentation visual aids infographics pdf. The topics addressed in these templates are professor, rational worrier, fearful rationalist. All the content presented in this PPT design is completely editable. Download it and make adjustments in color, background, font etc. as per your unique business setting.
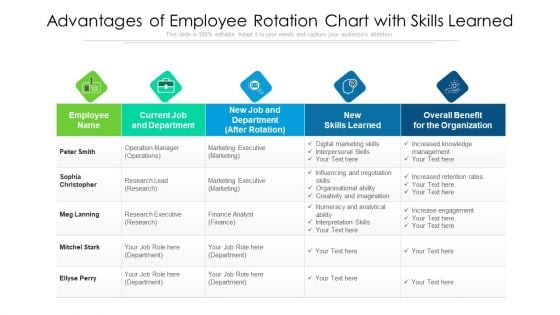
Advantages Of Employee Rotation Chart With Skills Learned Ppt PowerPoint Presentation File Infographics PDF
Showcasing this set of slides titled advantages of employee rotation chart with skills learned ppt powerpoint presentation file infographics pdf. The topics addressed in these templates are imagination, organisational, influencing. All the content presented in this PPT design is completely editable. Download it and make adjustments in color, background, font etc. as per your unique business setting.
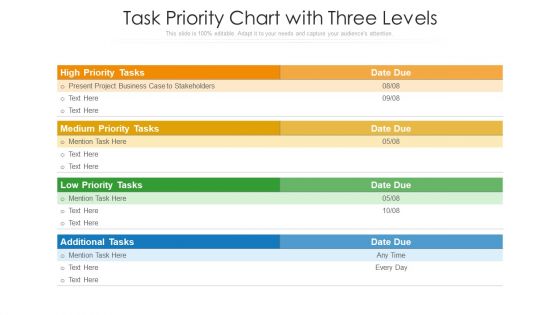
Task Priority Chart With Three Levels Ppt Infographics Graphics Pictures PDF
Pitch your topic with ease and precision using this task priority chart with three levels ppt infographics graphics pictures pdf. This layout presents information on project business, low priority tasks, stakeholders. It is also available for immediate download and adjustment. So, changes can be made in the color, design, graphics or any other component to create a unique layout.
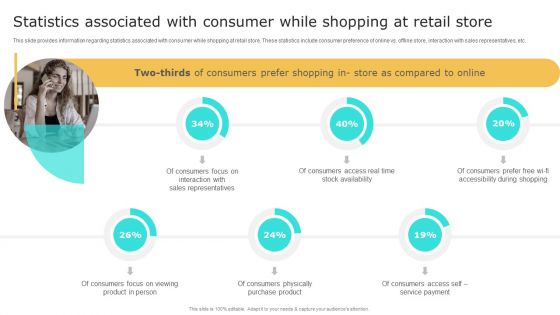
Retail Shop Administration Statistics Associated With Consumer While Shopping At Retail Store Infographics PDF
Crafting an eye-catching presentation has never been more straightforward. Let your presentation shine with this tasteful yet straightforward Retail Shop Administration Statistics Associated With Consumer While Shopping At Retail Store Infographics PDF template. It offers a minimalistic and classy look that is great for making a statement. The colors have been employed intelligently to add a bit of playfulness while still remaining professional. Construct the ideal Retail Shop Administration Statistics Associated With Consumer While Shopping At Retail Store Infographics PDF that effortlessly grabs the attention of your audience Begin now and be certain to wow your customers.
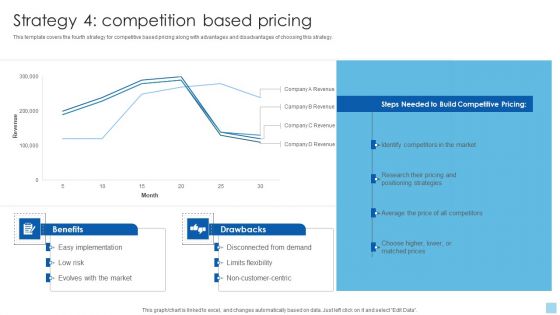
Strategies To Select Effective Strategy 4 Competition Based Pricing Infographics PDF
This template covers the fourth strategy for competitive based pricing along with advantages and disadvantages of choosing this strategy. Get a simple yet stunning designed Strategies To Select Effective Strategy 4 Competition Based Pricing Infographics PDF. It is the best one to establish the tone in your meetings. It is an excellent way to make your presentations highly effective. So, download this PPT today from Slidegeeks and see the positive impacts. Our easy-to-edit Strategies To Select Effective Strategy 4 Competition Based Pricing Infographics PDF can be your go-to option for all upcoming conferences and meetings. So, what are you waiting for Grab this template today.
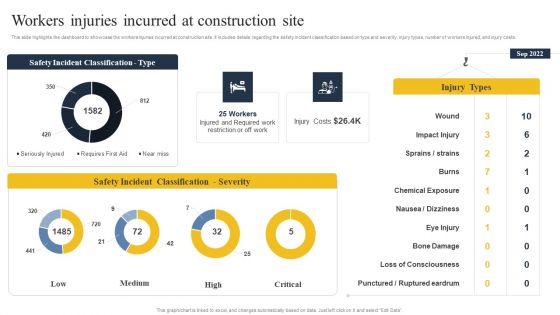
Security Control Techniques For Real Estate Project Workers Injuries Incurred At Construction Site Infographics PDF
Find highly impressive Security Control Techniques For Real Estate Project Workers Injuries Incurred At Construction Site Infographics PDF on Slidegeeks to deliver a meaningful presentation. You can save an ample amount of time using these presentation templates. No need to worry to prepare everything from scratch because Slidegeeks experts have already done a huge research and work for you. You need to download Security Control Techniques For Real Estate Project Workers Injuries Incurred At Construction Site Infographics PDF for your upcoming presentation. All the presentation templates are 100 percent editable and you can change the color and personalize the content accordingly. Download now.
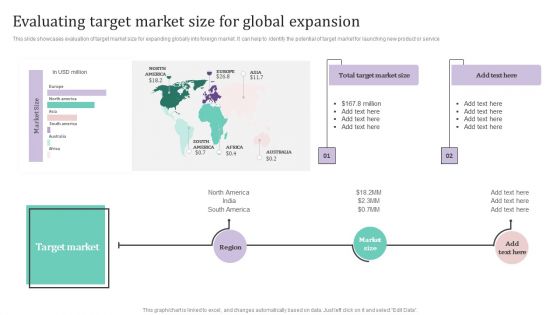
Evaluating Target Market Size For Global Expansion Ppt PowerPoint Presentation File Infographics PDF
Do you have to make sure that everyone on your team knows about any specific topic I yes, then you should give Evaluating Target Market Size For Global Expansion Ppt PowerPoint Presentation File Infographics PDF a try. Our experts have put a lot of knowledge and effort into creating this impeccable Evaluating Target Market Size For Global Expansion Ppt PowerPoint Presentation File Infographics PDF. You can use this template for your upcoming presentations, as the slides are perfect to represent even the tiniest detail. You can download these templates from the Slidegeeks website and these are easy to edit. So grab these today
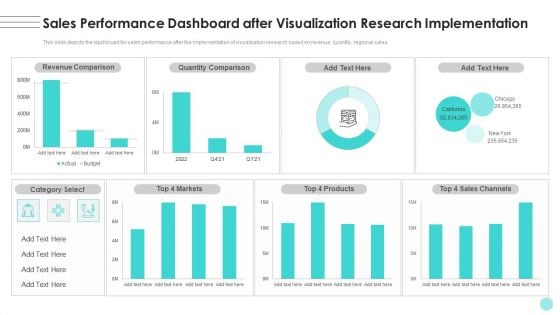
Branches For Visualization Research And Development Sales Performance Dashboard After Infographics PDF
This slide depicts the dashboard for sales performance after the implementation of visualization research based on revenue, quantity, regional sales. Crafting an eye-catching presentation has never been more straightforward. Let your presentation shine with this tasteful yet straightforward Branches For Visualization Research And Development Sales Performance Dashboard After Infographics PDF template. It offers a minimalistic and classy look that is great for making a statement. The colors have been employed intelligently to add a bit of playfulness while still remaining professional. Construct the ideal Branches For Visualization Research And Development Sales Performance Dashboard After Infographics PDF that effortlessly grabs the attention of your audience Begin now and be certain to wow your customers.
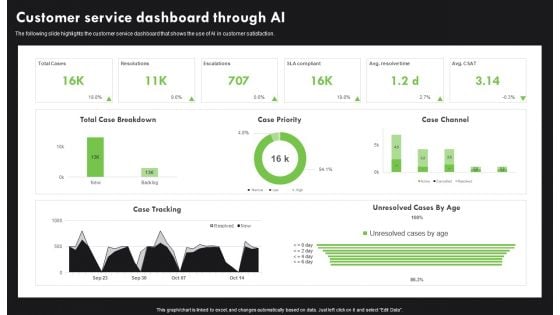
AI Deployment In IT Process Customer Service Dashboard Through AI Infographics PDF
The following slide highlights the customer service dashboard that shows the use of AI in customer satisfaction. Explore a selection of the finest AI Deployment In IT Process Customer Service Dashboard Through AI Infographics PDF here. With a plethora of professionally designed and pre made slide templates, you can quickly and easily find the right one for your upcoming presentation. You can use our AI Deployment In IT Process Customer Service Dashboard Through AI Infographics PDF to effectively convey your message to a wider audience. Slidegeeks has done a lot of research before preparing these presentation templates. The content can be personalized and the slides are highly editable. Grab templates today from Slidegeeks.
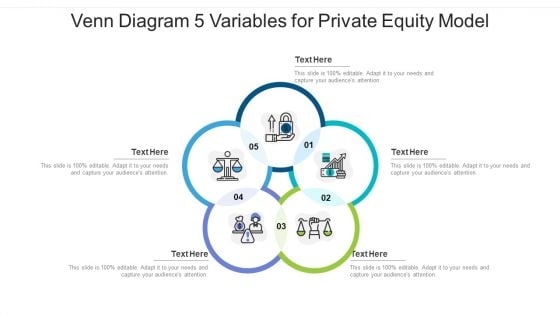
Venn Diagram 5 Variables For Private Equity Model Ppt PowerPoint Presentation File Infographics PDF
Presenting venn diagram 5 variables for private equity model ppt powerpoint presentation file infographics pdf to dispense important information. This template comprises five stages. It also presents valuable insights into the topics including venn diagram 5 variables for private equity model. This is a completely customizable PowerPoint theme that can be put to use immediately. So, download it and address the topic impactfully.
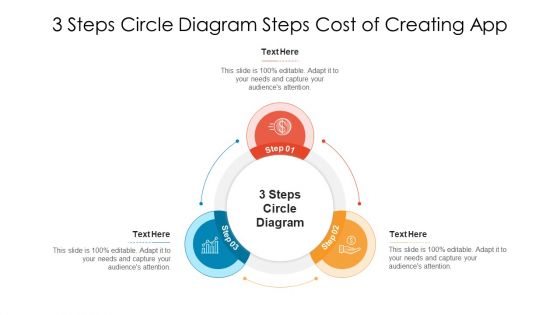
3 Steps Circle Diagram Steps Cost Of Creating App Infographics PDF
Presenting 3 steps circle diagram steps cost of creating app infographics pdf to dispense important information. This template comprises three stages. It also presents valuable insights into the topics including 3 steps circle diagram steps cost of creating app. This is a completely customizable PowerPoint theme that can be put to use immediately. So, download it and address the topic impactfully.

Three Area Ppt Diagram For High Tech Manufacturing Ppt PowerPoint Presentation Gallery Infographics PDF
Presenting three area ppt diagram for high tech manufacturing ppt powerpoint presentation gallery infographics pdf to dispense important information. This template comprises three stages. It also presents valuable insights into the topics including three area ppt diagram for high tech manufacturing. This is a completely customizable PowerPoint theme that can be put to use immediately. So, download it and address the topic impactfully.
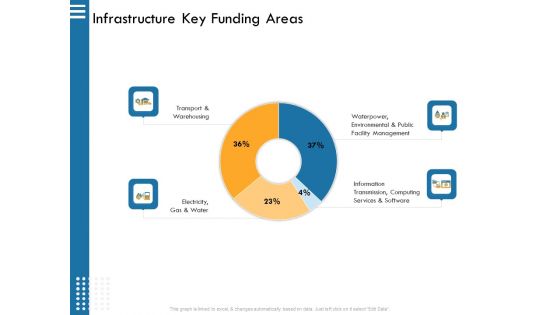
IT Infrastructure Governance Infrastructure Key Funding Areas Ppt Infographics Themes PDF
Deliver and pitch your topic in the best possible manner with this it infrastructure governance infrastructure key funding areas ppt infographics themes pdf. Use them to share invaluable insights on waterpower, environmental and public facility management, information transmission, computing services and software, electricity, gas and water, transport and warehousing and impress your audience. This template can be altered and modified as per your expectations. So, grab it now.
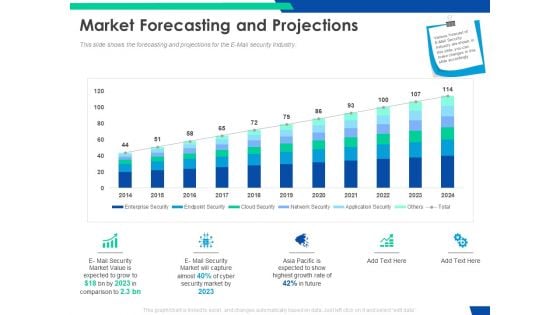
Cloud Based Email Security Market Report Market Forecasting And Projections Ppt Infographics Themes PDF
This slide shows the forecasting and projections for the E Mail security Industry. Deliver and pitch your topic in the best possible manner with this cloud based email security market report market forecasting and projections ppt infographics themes pdf. Use them to share invaluable insights on market forecasting and projections and impress your audience. This template can be altered and modified as per your expectations. So, grab it now.
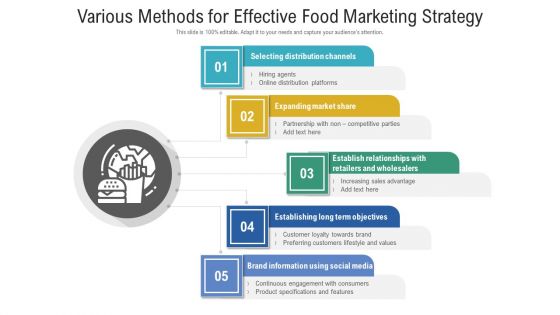
Various Methods For Effective Food Marketing Strategy Ppt Infographics Diagrams PDF
Presenting various methods for effective food marketing strategy ppt infographics diagrams pdf to dispense important information. This template comprises five stages. It also presents valuable insights into the topics including distribution channels, market share, long term objectives, social media, wholesalers. This is a completely customizable PowerPoint theme that can be put to use immediately. So, download it and address the topic impactfully.
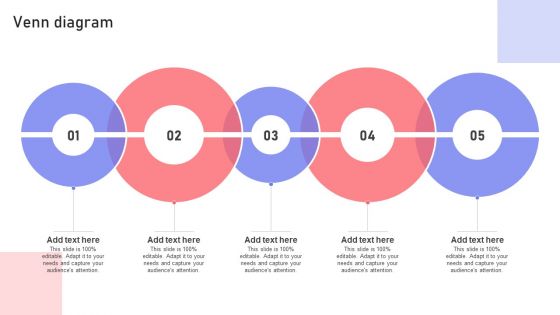
Venn Diagram Marketing Guide For Segmentation Targeting And Positioning To Enhance Promotional Strategy Infographics PDF
If your project calls for a presentation, then Slidegeeks is your go to partner because we have professionally designed, easy to edit templates that are perfect for any presentation. After downloading, you can easily edit Venn Diagram Marketing Guide For Segmentation Targeting And Positioning To Enhance Promotional Strategy Infographics PDF and make the changes accordingly. You can rearrange slides or fill them with different images. Check out all the handy templates.
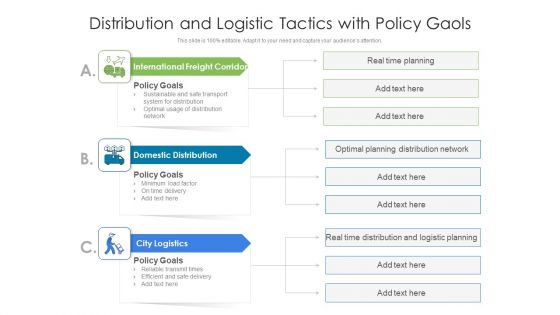
Distribution And Logistic Tactics With Policy Gaols Ppt Outline Infographics PDF
Presenting distribution and logistic tactics with policy gaols ppt outline infographics pdf to dispense important information. This template comprises three stages. It also presents valuable insights into the topics including international freight corridors, domestic distribution, city logistics. This is a completely customizable PowerPoint theme that can be put to use immediately. So, download it and address the topic impactfully.
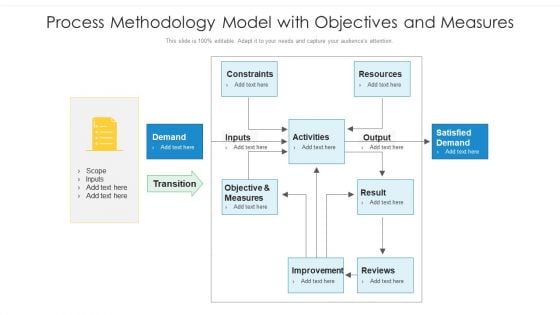
Process Methodology Model With Objectives And Measures Ppt PowerPoint Presentation Infographics Outline PDF
Presenting process methodology model with objectives and measures ppt powerpoint presentation infographics outline pdf to dispense important information. This template comprises two stages. It also presents valuable insights into the topics including constraints, resources, activities, objective and measures, improvement. This is a completely customizable PowerPoint theme that can be put to use immediately. So, download it and address the topic impactfully.
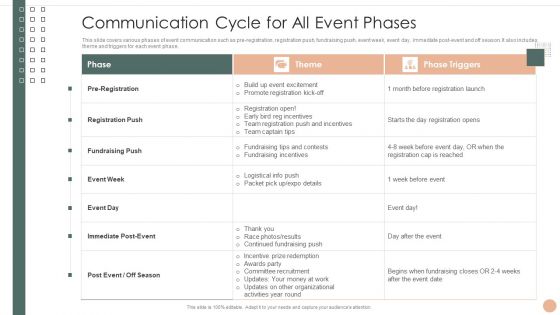
Effective Company Event Communication Tactics Communication Cycle For All Event Phases Infographics PDF
This slide covers various phases of event communication such as pre-registration, registration push, fundraising push, event week, event day, immediate post-event and off season. It also includes theme and triggers for each event phase. Deliver an awe inspiring pitch with this creative Effective Company Event Communication Tactics Communication Cycle For All Event Phases Infographics PDF bundle. Topics like Registration Push, Fundraising Push, Promote Registration can be discussed with this completely editable template. It is available for immediate download depending on the needs and requirements of the user.


 Continue with Email

 Home
Home


