Information Technology Icons
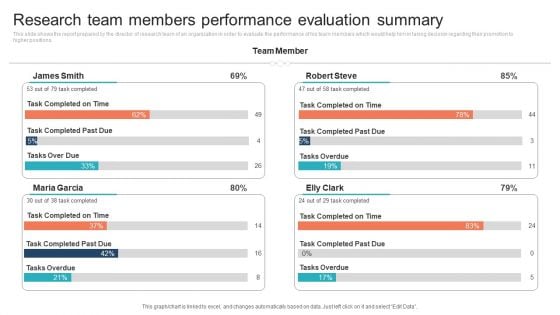
Research Team Members Performance Evaluation Summary Portrait PDF
This slide shows the report prepared by the director of research team of an organization in order to evaluate the performance of his team members which would help him in taking decision regarding their promotion to higher positions. Pitch your topic with ease and precision using this Research Team Members Performance Evaluation Summary Portrait PDF. This layout presents information on Research Team Members, Performance Evaluation Summary. It is also available for immediate download and adjustment. So, changes can be made in the color, design, graphics or any other component to create a unique layout.
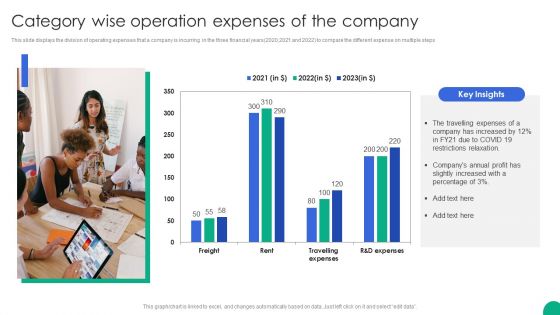
Category Wise Operation Expenses Of The Company Topics PDF
This slide displays the division of operating expenses that a company is incurring in the three financial years 2020,2021 and 2022 to compare the different expense on multiple steps.Pitch your topic with ease and precision using this Category Wise Operation Expenses Of The Company Topics PDF. This layout presents information on Travelling Expenses, Increased Restrictions, Relaxation. It is also available for immediate download and adjustment. So, changes can be made in the color, design, graphics or any other component to create a unique layout.
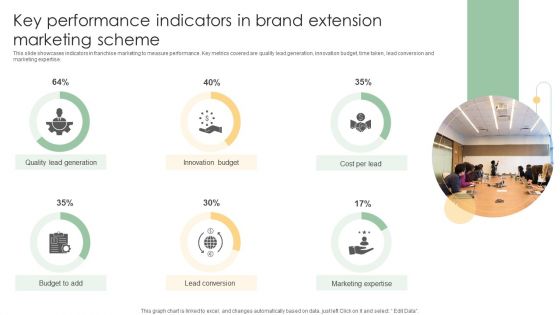
Key Performance Indicators In Brand Extension Marketing Scheme Ideas PDF
This slide showcases indicators in franchise marketing to measure performance. Key metrics covered are quality lead generation, innovation budget, time taken, lead conversion and marketing expertise.Pitch your topic with ease and precision using this Key Performance Indicators In Brand Extension Marketing Scheme Ideas PDF. This layout presents information on Quality Lead Generation, Innovation Budget, Lead Conversion. It is also available for immediate download and adjustment. So, changes can be made in the color, design, graphics or any other component to create a unique layout.
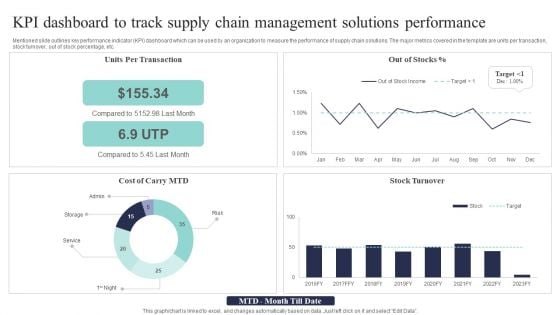
KPI Dashboard To Track Supply Chain Management Solutions Performance Background PDF
Mentioned slide outlines key performance indicator KPI dashboard which can be used by an organization to measure the performance of supply chain solutions. The major metrics covered in the template are units per transaction, stock turnover, out of stock percentage, etc. Pitch your topic with ease and precision using this KPI Dashboard To Track Supply Chain Management Solutions Performance Background PDF. This layout presents information on Per Transaction, Compared Last, Stock Turnover. It is also available for immediate download and adjustment. So, changes can be made in the color, design, graphics or any other component to create a unique layout.
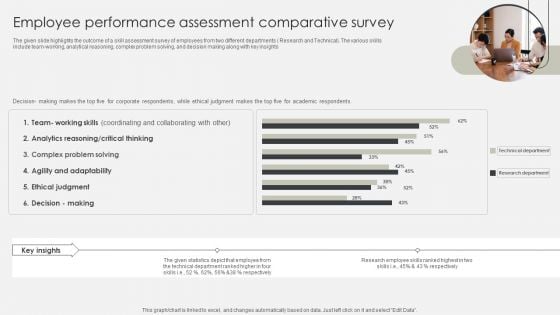
Employee Performance Assessment Comparative Survey Ideas PDF
The given slide highlights the outcome of a skill assessment survey of employees from two different departments Research and Technical. The various skills include team-working, analytical reasoning, complex problem solving, and decision making along with key insights. Pitch your topic with ease and precision using this Employee Performance Assessment Comparative Survey Ideas PDF. This layout presents information on Agility And Adaptability, Team, Research Department. It is also available for immediate download and adjustment. So, changes can be made in the color, design, graphics or any other component to create a unique layout.
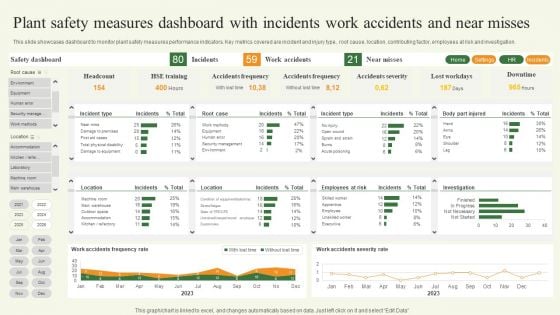
Plant Safety Measures Dashboard With Incidents Work Accidents And Near Misses Template PDF
This slide showcases dashboard to monitor plant safety measures performance indicators. Key metrics covered are incident and injury type, root cause, location, contributing factor, employees at risk and investigation. Pitch your topic with ease and precision using this Plant Safety Measures Dashboard With Incidents Work Accidents And Near Misses Template PDF. This layout presents information on Plant Safety Measures Dashboard, Incidents Work Accidents. It is also available for immediate download and adjustment. So, changes can be made in the color, design, graphics or any other component to create a unique layout.
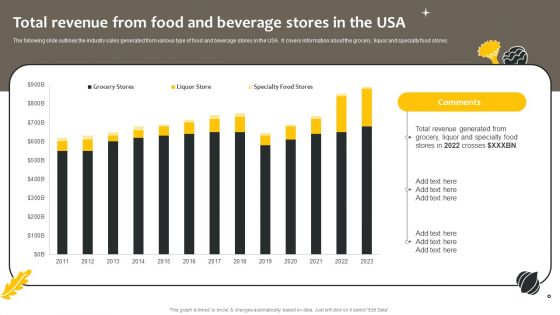
Effective Online And Offline Promotional Total Revenue From Food And Beverage Stores Introduction PDF
The following slide outlines the industry sales generated from various type of food and beverage stores in the USA. It covers information about the grocery, liquor and specialty food stores. The best PPT templates are a great way to save time, energy, and resources. Slidegeeks have 100 percent editable powerpoint slides making them incredibly versatile. With these quality presentation templates, you can create a captivating and memorable presentation by combining visually appealing slides and effectively communicating your message. Download Effective Online And Offline Promotional Total Revenue From Food And Beverage Stores Introduction PDF from Slidegeeks and deliver a wonderful presentation.
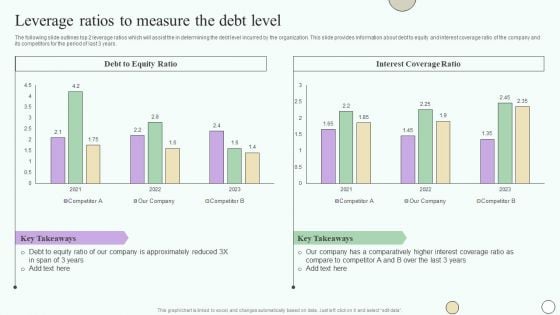
Estimating Business Overall Leverage Ratios To Measure The Debt Level Professional PDF
The following slide outlines top 2 leverage ratios which will assist the in determining the debt level incurred by the organization. This slide provides information about debt to equity and interest coverage ratio of the company and its competitors for the period of last 3 years. If your project calls for a presentation, then Slidegeeks is your go-to partner because we have professionally designed, easy-to-edit templates that are perfect for any presentation. After downloading, you can easily edit Estimating Business Overall Leverage Ratios To Measure The Debt Level Professional PDF and make the changes accordingly. You can rearrange slides or fill them with different images. Check out all the handy templates.
Multiple Project Progress Tracking Report Dashboard With Key Performance Indicators Brochure PDF
This slide shows the dashboard representing status of various projects and tracking their performance with the help of key performance indicators which are as follows schedule, budget, resources, risk and issues and quality of projects.Pitch your topic with ease and precision using this Multiple Project Progress Tracking Report Dashboard With Key Performance Indicators Brochure PDF. This layout presents information on Risks Issues, Quality Open Defects, Techno Blogger. It is also available for immediate download and adjustment. So, changes can be made in the color, design, graphics or any other component to create a unique layout.
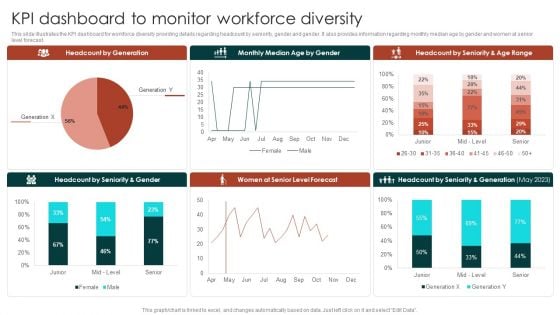
Diversity Management Plan To Improve Workplace Culture KPI Dashboard To Monitor Workforce Microsoft PDF
This slide illustrates the KPI dashboard for workforce diversity providing details regarding headcount by seniority, gender and gender. It also provides information regarding monthly median age by gender and women at senior level forecast.Find a pre-designed and impeccable Diversity Management Plan To Improve Workplace Culture KPI Dashboard To Monitor Workforce Microsoft PDF. The templates can ace your presentation without additional effort. You can download these easy-to-edit presentation templates to make your presentation stand out from others. So, what are you waiting for. Download the template from Slidegeeks today and give a unique touch to your presentation.
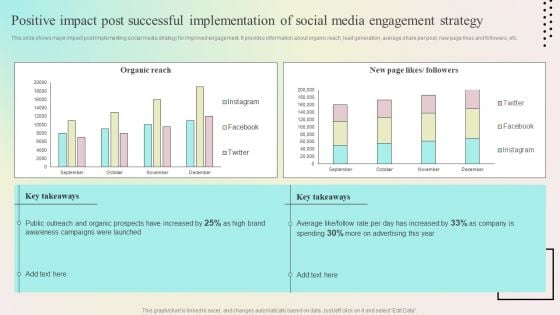
Enhancing Organic Reach Positive Impact Post Successful Implementation Of Social Media Background PDF
This slide shows major impact post implementing social media strategy for improved engagement. It provides information about organic reach, lead generation, average share per post, new page likes and followers, etc. If your project calls for a presentation, then Slidegeeks is your go-to partner because we have professionally designed, easy-to-edit templates that are perfect for any presentation. After downloading, you can easily edit Enhancing Organic Reach Positive Impact Post Successful Implementation Of Social Media Background PDF and make the changes accordingly. You can rearrange slides or fill them with different images. Check out all the handy templates.
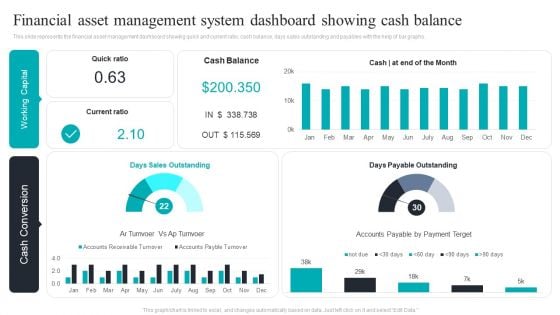
Financial Asset Management System Dashboard Showing Cash Balance Download PDF
This slide represents the financial asset management dashboard showing quick and current ratio, cash balance, days sales outstanding and payables with the help of bar graphs. Pitch your topic with ease and precision using this Financial Asset Management System Dashboard Showing Cash Balance Download PDF. This layout presents information on Financial Asset, Management System, Dashboard Showing, Cash Balance. It is also available for immediate download and adjustment. So, changes can be made in the color, design, graphics or any other component to create a unique layout.

KPI Dashboard To Track Sales And Operations Process Of Manufacturing Enterprise Brochure PDF
This slide depicts a dashboard to track the key performance metrics in sales and operations process of a manufacturing enterprise to analyze deviations in the actual and planned output. The key performing indicators are percentage deviation, dollar deviation, inventory in hand etc.Pitch your topic with ease and precision using this KPI Dashboard To Track Sales And Operations Process Of Manufacturing Enterprise Brochure PDF. This layout presents information on Planned Output, Yearly Growth, Inventory Hand. It is also available for immediate download and adjustment. So, changes can be made in the color, design, graphics or any other component to create a unique layout.
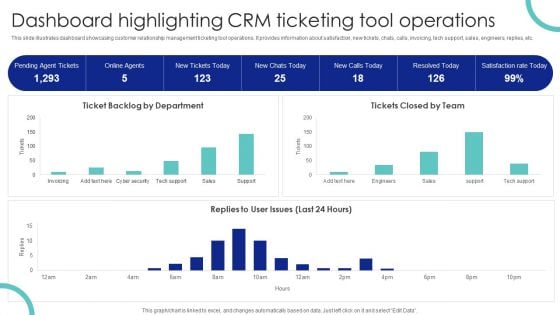
Dashboard Highlighting CRM Ticketing Tool Operations Ppt PowerPoint Presentation File Professional PDF
This slide illustrates dashboard showcasing customer relationship management ticketing tool operations. It provides information about satisfaction, new tickets, chats, calls, invoicing, tech support, sales, engineers, replies, etc. Want to ace your presentation in front of a live audience Our Dashboard Highlighting CRM Ticketing Tool Operations Ppt PowerPoint Presentation File Professional PDF can help you do that by engaging all the users towards you. Slidegeeks experts have put their efforts and expertise into creating these impeccable powerpoint presentations so that you can communicate your ideas clearly. Moreover, all the templates are customizable, and easy to edit and downloadable. Use these for both personal and commercial use.
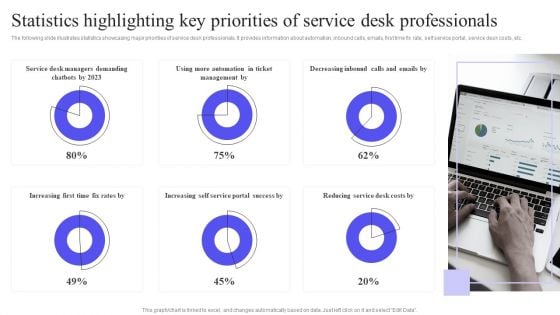
Statistics Highlighting Key Priorities Of Service Desk Professionals Graphics PDF
The following slide illustrates statistics showcasing major priorities of service desk professionals. It provides information about automation, inbound calls, emails, first time fix rate, self service portal, service desk costs, etc. If your project calls for a presentation, then Slidegeeks is your go to partner because we have professionally designed, easy to edit templates that are perfect for any presentation. After downloading, you can easily edit Statistics Highlighting Key Priorities Of Service Desk Professionals Graphics PDF and make the changes accordingly. You can rearrange slides or fill them with different images. Check out all the handy templates.
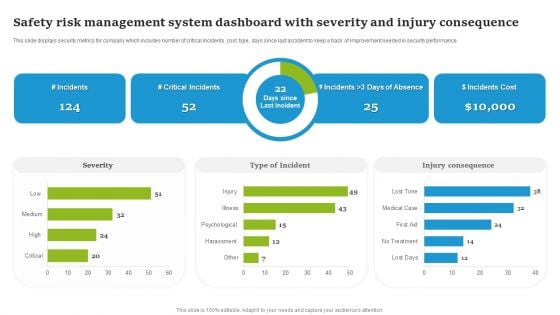
Safety Risk Management System Dashboard With Severity And Injury Consequence Clipart PDF
This slide displays security metrics for company which includes number of critical incidents, cost, type, days since last accident to keep a track of Improvement needed in security performance. Pitch your topic with ease and precision using this Safety Risk Management System Dashboard With Severity And Injury Consequence Clipart PDF. This layout presents information on Severity, Type Of Incident, Injury Consequence . It is also available for immediate download and adjustment. So, changes can be made in the color, design, graphics or any other component to create a unique layout.
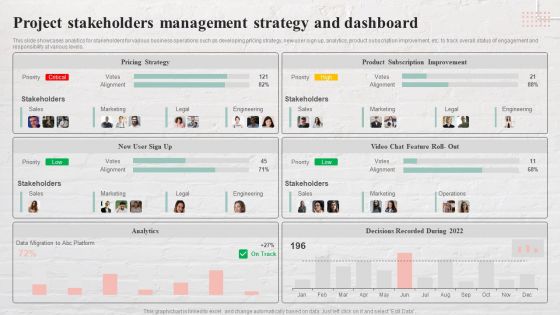
Project Stakeholders Management Strategy And Dashboard Sample PDF
This slide showcases analytics for stakeholders for various business operations such as developing pricing strategy, new user sign up, analytics, product subscription improvement, etc. to track overall status of engagement and responsibility at various levels. Pitch your topic with ease and precision using this Project Stakeholders Management Strategy And Dashboard Sample PDF. This layout presents information on Pricing Strategy, Product Subscription Improvement. It is also available for immediate download and adjustment. So, changes can be made in the color, design, graphics or any other component to create a unique layout.

Stakeholders Management Strategy With Engagement Dashboard Infographics PDF
The following slide displays key parameters to map involvement of stakeholders in the business by analyzing them on the basis of influence, interest and impact to monitor and improve overall communication strategies of organization. Pitch your topic with ease and precision using this Stakeholders Management Strategy With Engagement Dashboard Infographics PDF. This layout presents information on Influence, Interest, Impact. It is also available for immediate download and adjustment. So, changes can be made in the color, design, graphics or any other component to create a unique layout.
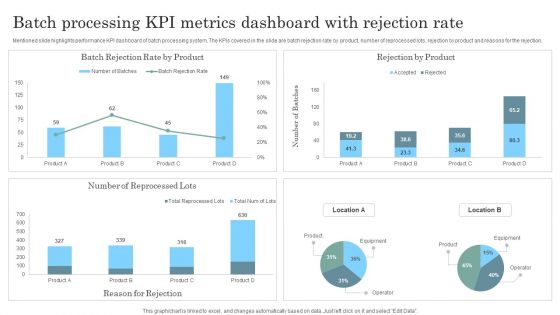
Batch Processing KPI Metrics Dashboard With Rejection Rate Topics PDF
Mentioned slide highlights performance KPI dashboard of batch processing system. The KPIs covered in the slide are batch rejection rate by product, number of reprocessed lots, rejection by product and reasons for the rejection. Pitch your topic with ease and precision using this Batch Processing KPI Metrics Dashboard With Rejection Rate Topics PDF. This layout presents information on Batch Processing KPI Metrics, Dashboard Rejection Rate. It is also available for immediate download and adjustment. So, changes can be made in the color, design, graphics or any other component to create a unique layout.
KPI Dashboard For Tracking Commercial Banking And Financial Activities Download PDF
This slide depicts a dashboard for tracking the banking and financial activities of a business enterprise to measure the income and expenses. The key performing indicators are business accounts, paid, pending and cancelled transactions etc. Pitch your topic with ease and precision using this KPI Dashboard For Tracking Commercial Banking And Financial Activities Download PDF. This layout presents information on KPI Dashboard, Tracking Commercial Banking, Financial Activities. It is also available for immediate download and adjustment. So, changes can be made in the color, design, graphics or any other component to create a unique layout.

Maintenance Administration Manufacturing Firm At Glance Graphics PDF
The purpose of this slide is to showcase the corporate identity of manufacturing firm by providing details regarding the vision, mission and production hubs across the globe. It also contains information regarding the financial, production and human capital highlights. Find a pre-designed and impeccable Maintenance Administration Manufacturing Firm At Glance Graphics PDF. The templates can ace your presentation without additional effort. You can download these easy-to-edit presentation templates to make your presentation stand out from others. So, what are you waiting for Download the template from Slidegeeks today and give a unique touch to your presentation.
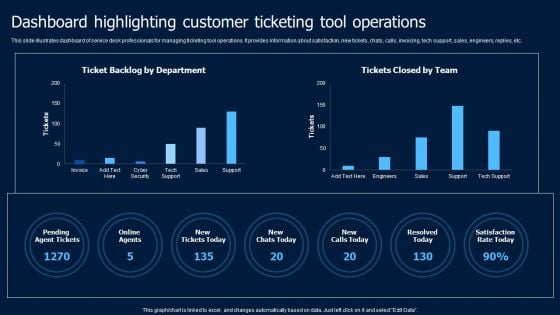
Help Desk Ticketing Dashboard Highlighting Customer Ticketing Tool Operations Introduction PDF
This slide illustrates dashboard of service desk professionals for managing ticketing tool operations. It provides information about satisfaction, new tickets, chats, calls, invoicing, tech support, sales, engineers, replies, etc. Crafting an eye-catching presentation has never been more straightforward. Let your presentation shine with this tasteful yet straightforward Help Desk Ticketing Dashboard Highlighting Customer Ticketing Tool Operations Introduction PDF maining professional. Construct the ideal Help Desk Ticketing Dashboard Highlighting Customer Ticketing Tool Operations Introduction PDF that effortlessly grabs the attention of your audience Begin now and be certain to wow your customers.
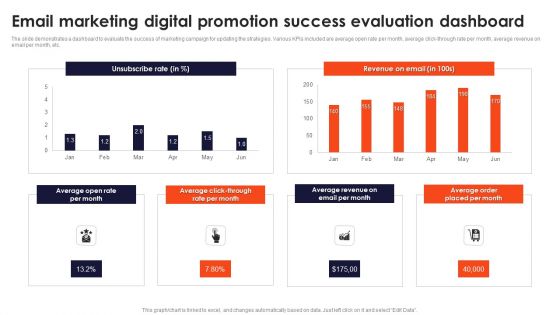
Email Marketing Digital Promotion Success Evaluation Dashboard Sample PDF
The slide demonstrates a dashboard to evaluate the success of marketing campaign for updating the strategies. Various KPIs included are average open rate per month, average click-through rate per month, average revenue on email per month, etc. Pitch your topic with ease and precision using this Email Marketing Digital Promotion Success Evaluation Dashboard Sample PDF. This layout presents information on Open Rate Per Month, Order Placed Per Month. It is also available for immediate download and adjustment. So, changes can be made in the color, design, graphics or any other component to create a unique layout.
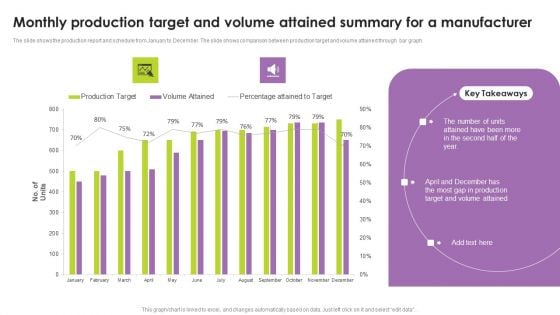
Monthly Production Target And Volume Attained Summary For A Manufacturer Portrait PDF
The slide shows the production report and schedule from January to December. The slide shows comparison between production target and volume attained through bar graph. Pitch your topic with ease and precision using this Monthly Production Target And Volume Attained Summary For A Manufacturer Portrait PDF. This layout presents information on Monthly Production Target, Volume Attained Summary, Manufacturer. It is also available for immediate download and adjustment. So, changes can be made in the color, design, graphics or any other component to create a unique layout.
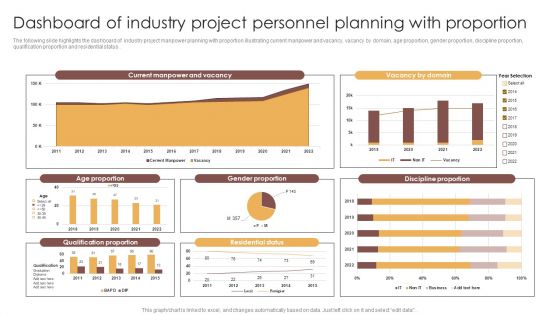
Dashboard Of Industry Project Personnel Planning With Proportion Professional PDF
The following slide highlights the dashboard of industry project manpower planning with proportion illustrating current manpower and vacancy, vacancy by domain, age proportion, gender proportion, discipline proportion, qualification proportion and residential status. Pitch your topic with ease and precision using this Dashboard Of Industry Project Personnel Planning With Proportion Professional PDF. This layout presents information on Current Manpower And Vacancy, Gender Proportion, Qualification Proportion. It is also available for immediate download and adjustment. So, changes can be made in the color, design, graphics or any other component to create a unique layout.
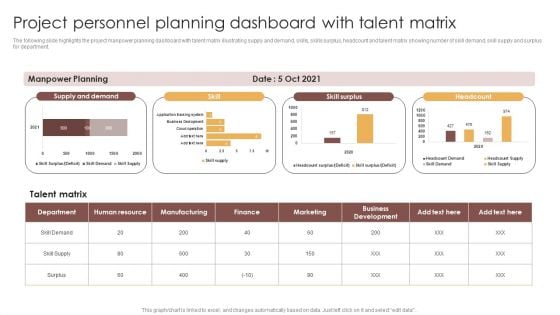
Project Personnel Planning Dashboard With Talent Matrix Demonstration Structure PDF
The following slide highlights the project manpower planning dashboard with talent matrix illustrating supply and demand, skills, skills surplus, headcount and talent matrix showing number of skill demand, skill supply and surplus for department. Pitch your topic with ease and precision using this Project Personnel Planning Dashboard With Talent Matrix Demonstration Structure PDF. This layout presents information on Supply And Demand, Skill Surplus, Headcount. It is also available for immediate download and adjustment. So, changes can be made in the color, design, graphics or any other component to create a unique layout.
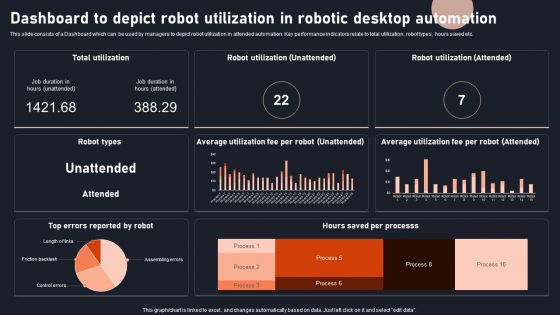
Dashboard To Depict Robot Utilization In Robotic Desktop Automation Download PDF
This slide consists of a Dashboard which can be used by managers to depict robot utilization in attended automation. Key performance indicators relate to total utilization, robot types, hours saved etc. Pitch your topic with ease and precision using this Dashboard To Depict Robot Utilization In Robotic Desktop Automation Download PDF. This layout presents information on Dashboard, Depict Robot Utilization, Robotic Desktop Automation. It is also available for immediate download and adjustment. So, changes can be made in the color, design, graphics or any other component to create a unique layout.
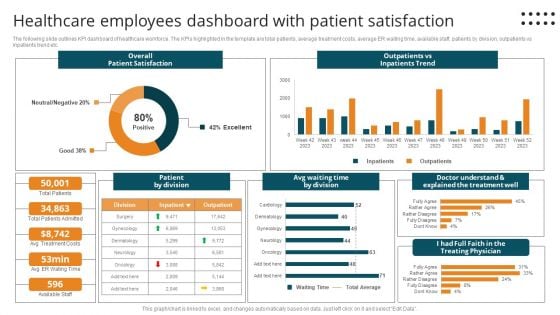
Healthcare Employees Dashboard With Patient Satisfaction Mockup PDF
The following slide outlines KPI dashboard of healthcare workforce. The KPIs highlighted in the template are total patients, average treatment costs, average ER waiting time, available staff, patients by division, outpatients vs inpatients trend etc.Pitch your topic with ease and precision using this Healthcare Employees Dashboard With Patient Satisfaction Mockup PDF. This layout presents information on Patient Satisfaction, Outpatients Inpatients Trend, Doctor Understand. It is also available for immediate download and adjustment. So, changes can be made in the color, design, graphics or any other component to create a unique layout.
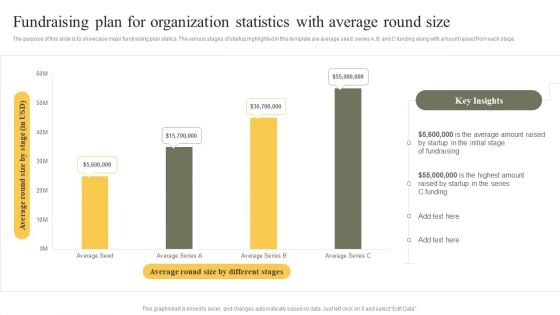
Fundraising Plan For Organization Statistics With Average Round Size Topics PDF
The purpose of this slide is to showcase major fundraising plan statics. The various stages of startup highlighted in this template are average seed, series A, B and C funding along with amount raised from each stage. Pitch your topic with ease and precision using this Fundraising Plan For Organization Statistics With Average Round Size Topics PDF. This layout presents information on Key Insights, Fundraising, Average. It is also available for immediate download and adjustment. So, changes can be made in the color, design, graphics or any other component to create a unique layout.
Cloud Platform Dashboard For Tracking Project Team Activities Microsoft PDF
The following slide depicts project team task tracking cloud dashboard. It provides information about hours worked, projects worked, time spent, daily limit, product design, weekly activity, etc. Create an editable Cloud Platform Dashboard For Tracking Project Team Activities Microsoft PDF that communicates your idea and engages your audience. Whether you are presenting a business or an educational presentation, pre-designed presentation templates help save time. Cloud Platform Dashboard For Tracking Project Team Activities Microsoft PDF is highly customizable and very easy to edit, covering many different styles from creative to business presentations. Slidegeeks has creative team members who have crafted amazing templates. So, go and get them without any delay.
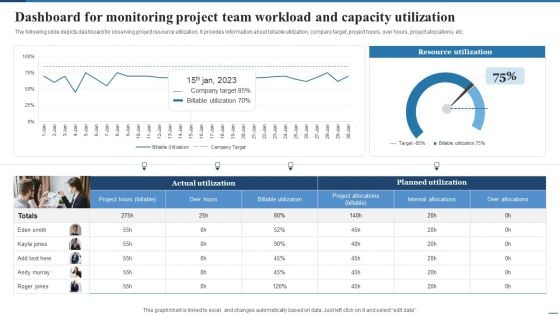
Dashboard For Monitoring Project Team Workload And Capacity Utilization Background PDF
The following slide depicts dashboard for observing project resource utilization. It provides information about billable utilization, company target, project hours, over hours, project allocations, etc.Present like a pro with Dashboard For Monitoring Project Team Workload And Capacity Utilization Background PDF Create beautiful presentations together with your team, using our easy-to-use presentation slides. Share your ideas in real-time and make changes on the fly by downloading our templates. So whether you are in the office, on the go, or in a remote location, you can stay in sync with your team and present your ideas with confidence. With Slidegeeks presentation got a whole lot easier. Grab these presentations today.
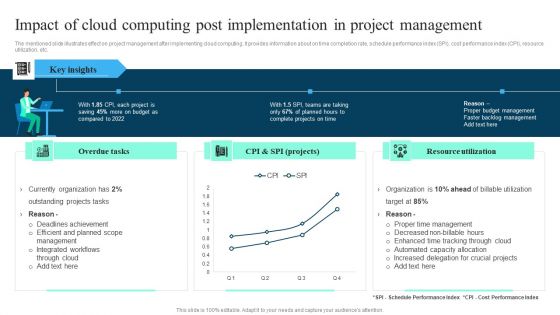
Impact Of Cloud Computing Post Implementation In Project Management Ppt PowerPoint Presentation File Ideas PDF
The mentioned slide illustrates effect on project management after implementing cloud computing. It provides information about on time completion rate, schedule performance index SPI, cost performance index CPI, resource utilization, etc. Make sure to capture your audiences attention in your business displays with our gratis customizable Impact Of Cloud Computing Post Implementation In Project Management Ppt PowerPoint Presentation File Ideas PDF. These are great for business strategies, office conferences, capital raising or task suggestions. If you desire to acquire more customers for your tech business and ensure they stay satisfied, create your own sales presentation with these plain slides.
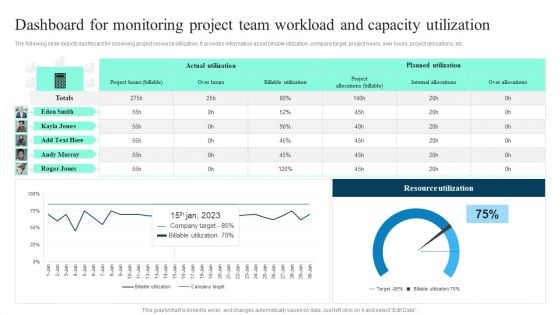
Dashboard For Monitoring Project Team Workload And Capacity Utilization Topics PDF
The following slide depicts dashboard for observing project resource utilization. It provides information about billable utilization, company target, project hours, over hours, project allocations, etc. Take your projects to the next level with our ultimate collection of Dashboard For Monitoring Project Team Workload And Capacity Utilization Topics PDF. Slidegeeks has designed a range of layouts that are perfect for representing task or activity duration, keeping track of all your deadlines at a glance. Tailor these designs to your exact needs and give them a truly corporate look with your own brand colors they will make your projects stand out from the rest.
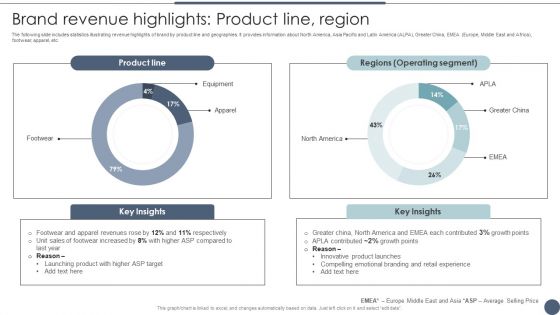
Brand Revenue Highlights Product Line Region Utilizing Emotional And Rational Branding For Improved Consumer Clipart PDF
The following slide includes statistics illustrating revenue highlights of brand by product line and geographies. It provides information about North America, Asia Pacific and Latin America ALPA, Greater China, EMEA Europe, Middle East and Africa, footwear, apparel, etc. There are so many reasons you need a Brand Revenue Highlights Product Line Region Utilizing Emotional And Rational Branding For Improved Consumer Clipart PDF. The first reason is you can not spend time making everything from scratch, Thus, Slidegeeks has made presentation templates for you too. You can easily download these templates from our website easily.
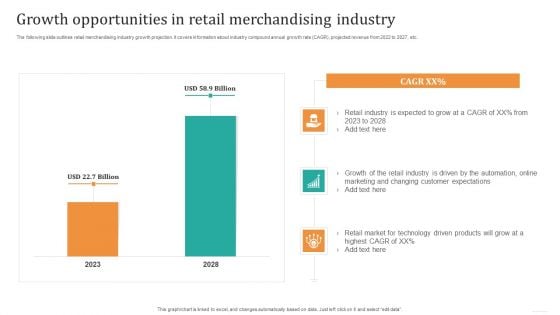
Growth Opportunities In Retail Merchandising Industry Slides PDF
The following slide outlines retail merchandising industry growth projection. It covers information about industry compound annual growth rate CAGR, projected revenue from 2022 to 2027, etc. If your project calls for a presentation, then Slidegeeks is your go to partner because we have professionally designed, easy to edit templates that are perfect for any presentation. After downloading, you can easily edit Growth Opportunities In Retail Merchandising Industry Slides PDF and make the changes accordingly. You can rearrange slides or fill them with different images. Check out all the handy templates.
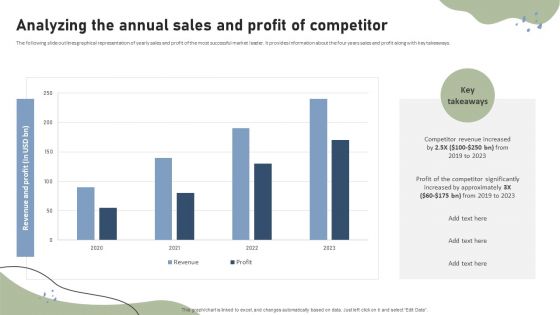
Brand Building Techniques Enhance Customer Engagement Loyalty Analyzing The Annual Sales Slides PDF
The following slide outlines graphical representation of yearly sales and profit of the most successful market leader. It provides information about the four years sales and profit along with key takeaways. Find a pre designed and impeccable Brand Building Techniques Enhance Customer Engagement Loyalty Analyzing The Annual Sales Slides PDF. The templates can ace your presentation without additional effort. You can download these easy to edit presentation templates to make your presentation stand out from others. So, what are you waiting for Download the template from Slidegeeks today and give a unique touch to your presentation.
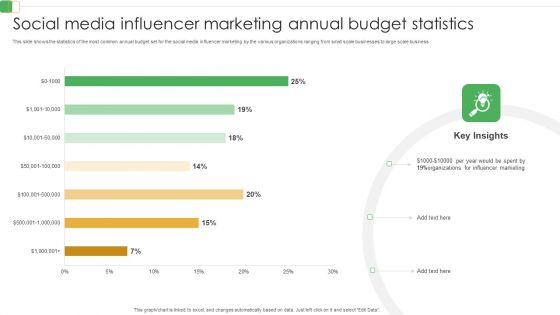
Social Media Influencer Marketing Annual Budget Statistics Ppt PowerPoint Presentation File Professional PDF
This slide shows the statistics of the most common annual budget set for the social media influencer marketing by the various organizations ranging from small scale businesses to large scale business. Pitch your topic with ease and precision using this Social Media Influencer Marketing Annual Budget Statistics Ppt PowerPoint Presentation File Professional PDF. This layout presents information on Social Media, Influencer Marketing, Annual Budget Statistics. It is also available for immediate download and adjustment. So, changes can be made in the color, design, graphics or any other component to create a unique layout.
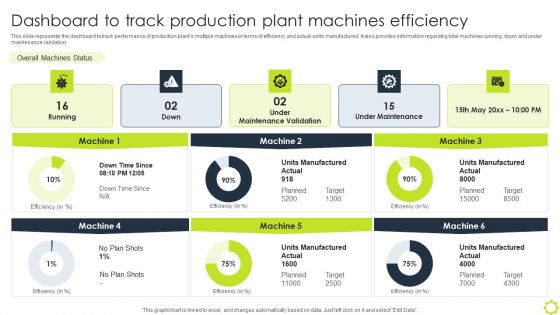
Machine Repairing And Servicing Dashboard To Track Production Plant Machines Formats PDF
This slide represents the dashboard to track performance of production plants multiple machines in terms of efficiency and actual units manufactured. It also provides information regarding total machines running, down and under maintenance validation. Want to ace your presentation in front of a live audience Our Machine Repairing And Servicing Dashboard To Track Production Plant Machines Formats PDF can help you do that by engaging all the users towards you. Slidegeeks experts have put their efforts and expertise into creating these impeccable powerpoint presentations so that you can communicate your ideas clearly. Moreover, all the templates are customizable, and easy-to-edit and downloadable. Use these for both personal and commercial use.
Brand Awareness Activities Tracking Dashboard Comprehensive Guide For Brand Recognition Download PDF
This slide provides information regarding brand activities tracking dashboard in terms of site traffic, attention, search, brand mentions, inbound traffic, etc. Slidegeeks is one of the best resources for PowerPoint templates. You can download easily and regulate Brand Awareness Activities Tracking Dashboard Comprehensive Guide For Brand Recognition Download PDF for your personal presentations from our wonderful collection. A few clicks is all it takes to discover and get the most relevant and appropriate templates. Use our Templates to add a unique zing and appeal to your presentation and meetings. All the slides are easy to edit and you can use them even for advertisement purposes.
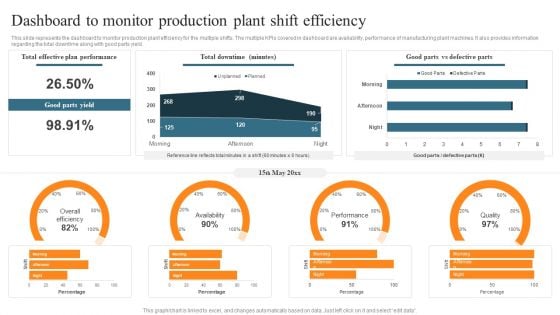
Leveraging Predictive Maintenance To Enhance Production Process Dashboard To Monitor Production Plant Shift Efficiency Structure PDF
This slide represents the dashboard to monitor production plant efficiency for the multiple shifts. The multiple KPIs covered in dashboard are availability, performance of manufacturing plant machines. It also provides information regarding the total downtime along with good parts yield. There are so many reasons you need a Leveraging Predictive Maintenance To Enhance Production Process Dashboard To Monitor Production Plant Shift Efficiency Structure PDF. The first reason is you cant spend time making everything from scratch, Thus, Slidegeeks has made presentation templates for you too. You can easily download these templates from our website easily.
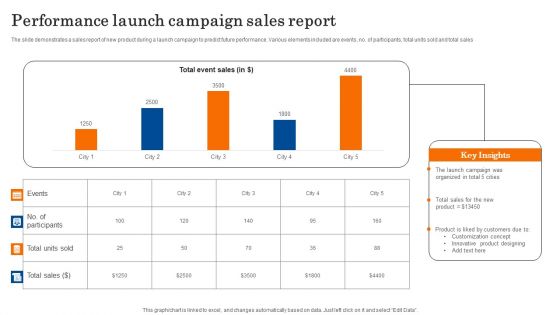
Performance Launch Campaign Sales Report Demonstration PDF
The slide demonstrates a sales report of new product during a launch campaign to predict future performance. Various elements included are events, no. of participants, total units sold and total sales. Pitch your topic with ease and precision using this Performance Launch Campaign Sales Report Demonstration PDF. This layout presents information on Sales, Product, Customization Concept. It is also available for immediate download and adjustment. So, changes can be made in the color, design, graphics or any other component to create a unique layout.
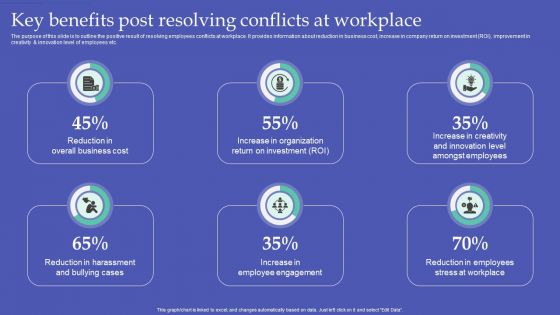
Resolving Team Disputes In Organization Key Benefits Post Resolving Conflicts At Workplace Formats PDF
The purpose of this slide is to outline the positive result of resolving employees conflicts at workplace. It provides information about reduction in business cost, increase in company return on investment ROI, improvement in creativity and innovation level of employees etc. There are so many reasons you need a Resolving Team Disputes In Organization Key Benefits Post Resolving Conflicts At Workplace Formats PDF. The first reason is you can not spend time making everything from scratch, Thus, Slidegeeks has made presentation templates for you too. You can easily download these templates from our website easily.
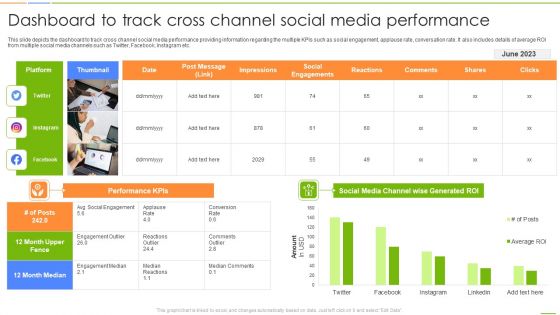
Social Media Channels Auditing Dashboard To Track Cross Channel Social Media Performance Formats PDF
This slide depicts the dashboard to track cross channel social media performance providing information regarding the multiple KPIs such as social engagement, applause rate, conversation rate. It also includes details of average ROI from multiple social media channels such as Twitter, Facebook, Instagram etc. From laying roadmaps to briefing everything in detail, our templates are perfect for you. You can set the stage with your presentation slides. All you have to do is download these easy-to-edit and customizable templates. Social Media Channels Auditing Dashboard To Track Cross Channel Social Media Performance Formats PDF will help you deliver an outstanding performance that everyone would remember and praise you for. Do download this presentation today.
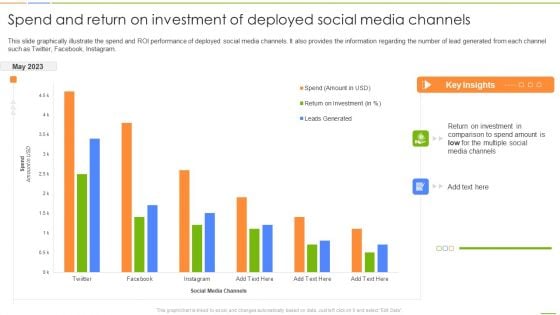
Social Media Channels Auditing Spend And Return On Investment Of Deployed Social Professional PDF
This slide graphically illustrate the spend and ROI performance of deployed social media channels. It also provides the information regarding the number of lead generated from each channel such as Twitter, Facebook, Instagram. Make sure to capture your audiences attention in your business displays with our gratis customizable Social Media Channels Auditing Spend And Return On Investment Of Deployed Social Professional PDF. These are great for business strategies, office conferences, capital raising or task suggestions. If you desire to acquire more customers for your tech business and ensure they stay satisfied, create your own sales presentation with these plain slides.
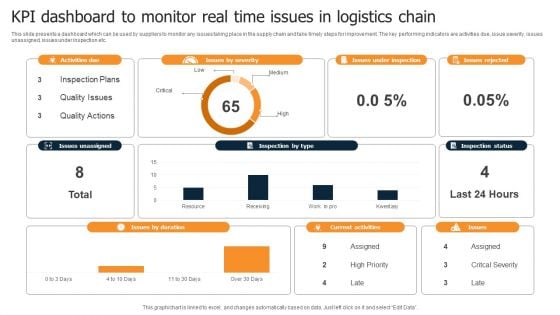
KPI Dashboard To Monitor Real Time Issues In Logistics Chain Rules PDF
This slide presents a dashboard which can be used by suppliers to monitor any issues taking place in the supply chain and take timely steps for improvement. The key performing indicators are activities due, issue severity, issues unassigned, issues under inspection etc. Pitch your topic with ease and precision using this KPI Dashboard To Monitor Real Time Issues In Logistics Chain Rules PDF. This layout presents information on Activities Due, Issues By Severity, Issues Rejected, Inspection Status. It is also available for immediate download and adjustment. So, changes can be made in the color, design, graphics or any other component to create a unique layout.
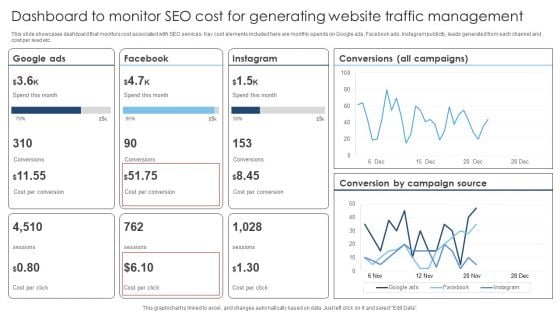
Dashboard To Monitor SEO Cost For Generating Website Traffic Management Slides PDF
This slide showcases dashboard that monitors cost associated with SEO services. Key cost elements included here are monthly spends on Google ads, Facebook ads, Instagram publicity, leads generated from each channel and cost per lead etc. Pitch your topic with ease and precision using this Dashboard To Monitor SEO Cost For Generating Website Traffic Management Slides PDF. This layout presents information on Google Ads, Conversions, Cost Per Conversion. It is also available for immediate download and adjustment. So, changes can be made in the color, design, graphics or any other component to create a unique layout.
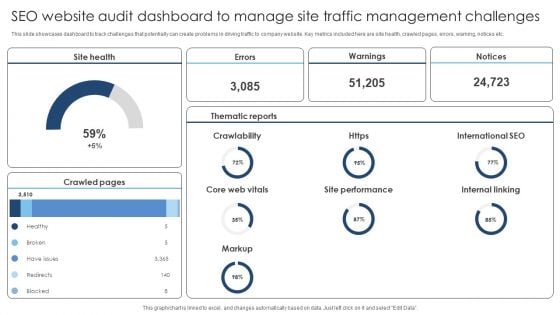
SEO Website Audit Dashboard To Manage Site Traffic Management Challenges Summary PDF
This slide showcases dashboard to track challenges that potentially can create problems in driving traffic to company website. Key metrics included here are site health, crawled pages, errors, warning, notices etc. Pitch your topic with ease and precision using this SEO Website Audit Dashboard To Manage Site Traffic Management Challenges Summary PDF. This layout presents information on Site Health, Errors, Warnings. It is also available for immediate download and adjustment. So, changes can be made in the color, design, graphics or any other component to create a unique layout.
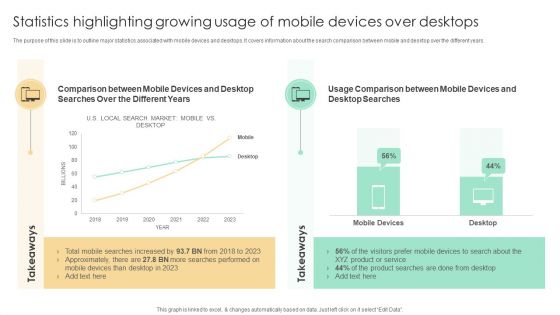
Top SEO Techniques Statistics Highlighting Growing Usage Of Mobile Devices Ideas PDF
The purpose of this slide is to outline major statistics associated with mobile devices and desktops. It covers information about the search comparison between mobile and desktop over the different years. Make sure to capture your audiences attention in your business displays with our gratis customizable Top SEO Techniques Statistics Highlighting Growing Usage Of Mobile Devices Ideas PDF. These are great for business strategies, office conferences, capital raising or task suggestions. If you desire to acquire more customers for your tech business and ensure they stay satisfied, create your own sales presentation with these plain slides.
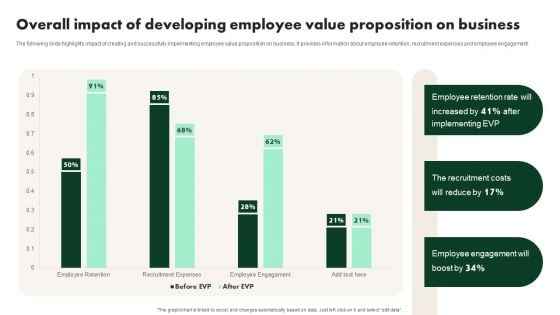
Creating Employee Value Proposition Overall Impact Of Developing Employee Value Topics PDF
The following slide highlights impact of creating and successfully implementing employee value proposition on business. It provides information about employee retention, recruitment expenses and employee engagement. Create an editable Creating Employee Value Proposition Overall Impact Of Developing Employee Value Topics PDF that communicates your idea and engages your audience. Whether youre presenting a business or an educational presentation, pre-designed presentation templates help save time. Creating Employee Value Proposition Overall Impact Of Developing Employee Value Topics PDF is highly customizable and very easy to edit, covering many different styles from creative to business presentations. Slidegeeks has creative team members who have crafted amazing templates. So, go and get them without any delay.
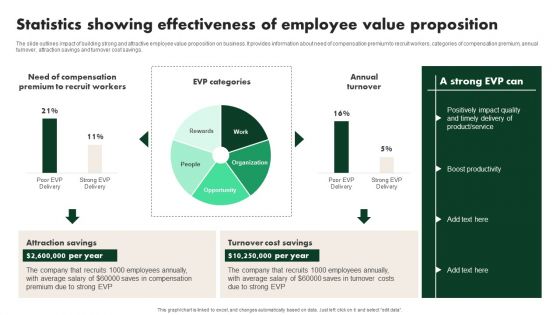
Creating Employee Value Proposition Statistics Showing Effectiveness Of Employee Value Ideas PDF
The slide outlines impact of building strong and attractive employee value proposition on business. It provides information about need of compensation premium to recruit workers, categories of compensation premium, annual turnover, attraction savings and turnover cost savings. There are so many reasons you need a Creating Employee Value Proposition Statistics Showing Effectiveness Of Employee Value Ideas PDF. The first reason is you cant spend time making everything from scratch, Thus, Slidegeeks has made presentation templates for you too. You can easily download these templates from our website easily.
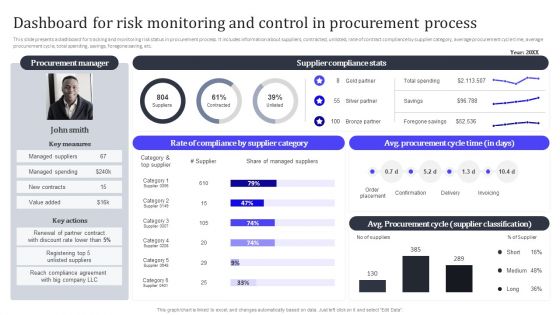
Dashboard For Risk Monitoring And Control In Procurement Process Structure PDF
This slide presents a dashboard for tracking and monitoring risk status in procurement process. It includes information about suppliers, contracted, unlisted, rate of contract compliance by supplier category, average procurement cycle time, average procurement cycle, total spending, savings, foregone saving, etc. Find a pre designed and impeccable Dashboard For Risk Monitoring And Control In Procurement Process Structure PDF. The templates can ace your presentation without additional effort. You can download these easy to edit presentation templates to make your presentation stand out from others. So, what are you waiting for Download the template from Slidegeeks today and give a unique touch to your presentation.
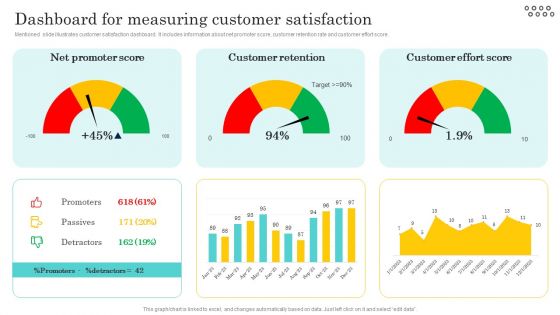
Optimizing And Managing Retail Dashboard For Measuring Customer Formats PDF
Mentioned slide illustrates customer satisfaction dashboard. It includes information about net promoter score, customer retention rate and customer effort score.. From laying roadmaps to briefing everything in detail, our templates are perfect for you. You can set the stage with your presentation slides. All you have to do is download these easy-to-edit and customizable templates. Optimizing And Managing Retail Dashboard For Measuring Customer Formats PDF will help you deliver an outstanding performance that everyone would remember and praise you for. Do download this presentation today.
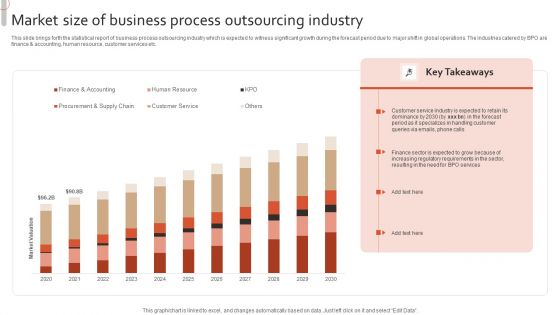
Market Size Of Business Process Outsourcing Industry Structure PDF
This slide brings forth the statistical report of business process outsourcing industry which is expected to witness significant growth during the forecast period due to major shift in global operations. The industries catered by BPO are finance and accounting, human resource, customer services etc. Pitch your topic with ease and precision using this Market Size Of Business Process Outsourcing Industry Structure PDF. This layout presents information on Customer Service, Phone Calls, Queries Via Emails. It is also available for immediate download and adjustment. So, changes can be made in the color, design, graphics or any other component to create a unique layout.
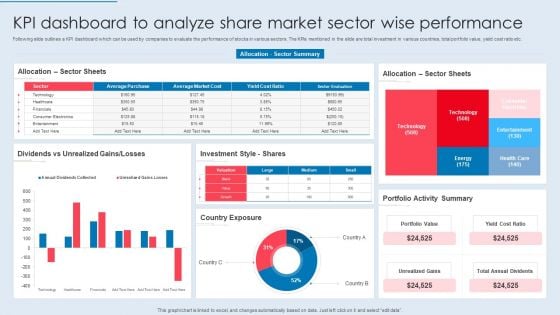
KPI Dashboard To Analyze Share Market Sector Wise Performance Summary PDF
Following slide outlines a KPI dashboard which can be used by companies to evaluate the performance of stocks in various sectors. The KPIs mentioned in the slide are total investment in various countries, total portfolio value, yield cost ratio etc. Pitch your topic with ease and precision using this KPI Dashboard To Analyze Share Market Sector Wise Performance Summary PDF. This layout presents information on Sector Sheets, Dividends Vs Unrealized, Investment Style. It is also available for immediate download and adjustment. So, changes can be made in the color, design, graphics or any other component to create a unique layout.
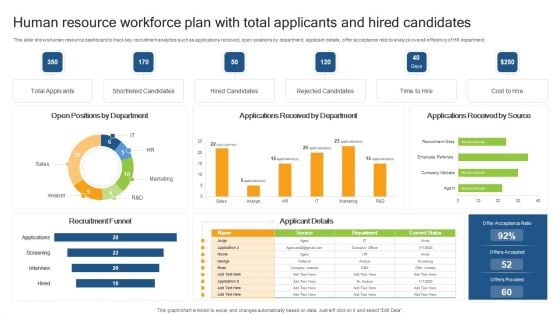
Human Resource Workforce Plan With Total Applicants And Hired Candidates Clipart PDF
This slide shows human resource dashboard to track key recruitment analytics such as applications received, open positions by department, applicant details, offer acceptance ratio to analyze overall efficiency of HR department. Pitch your topic with ease and precision using this Human Resource Workforce Plan With Total Applicants And Hired Candidates Clipart PDF. This layout presents information on Total Applicants, Shortlisted Candidates, Recruitment Funnel. It is also available for immediate download and adjustment. So, changes can be made in the color, design, graphics or any other component to create a unique layout.
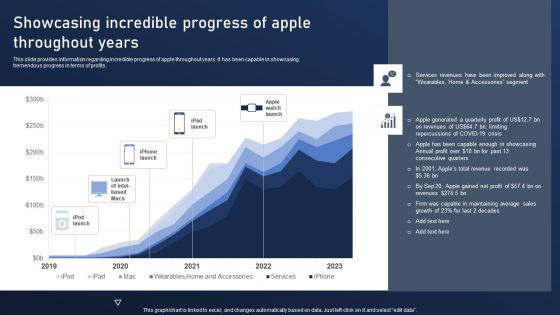
Discovering Apples Billion Dollar Branding Secret Showcasing Incredible Progress Of Apple Throughout Years Brochure PDF
This slide provides information regarding incredible progress of apple throughout years. It has been capable in showcasing tremendous progress in terms of profits. Take your projects to the next level with our ultimate collection of Discovering Apples Billion Dollar Branding Secret Showcasing Incredible Progress Of Apple Throughout Years Brochure PDF. Slidegeeks has designed a range of layouts that are perfect for representing task or activity duration, keeping track of all your deadlines at a glance. Tailor these designs to your exact needs and give them a truly corporate look with your own brand colors they will make your projects stand out from the rest.
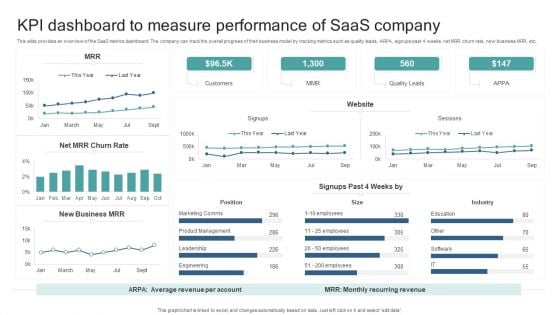
KPI Dashboard To Measure Performance Of Saas Company Introduction PDF
This slide provides an overview of the SaaS metrics dashboard. The company can track the overall progress of their business model by tracking metrics such as quality leads, ARPA, signups past 4 weeks, net MRR churn rate, new business MRR, etc. Pitch your topic with ease and precision using this KPI Dashboard To Measure Performance Of Saas Company Introduction PDF. This layout presents information on Industry, Position, Customers, Quality Leads. It is also available for immediate download and adjustment. So, changes can be made in the color, design, graphics or any other component to create a unique layout.
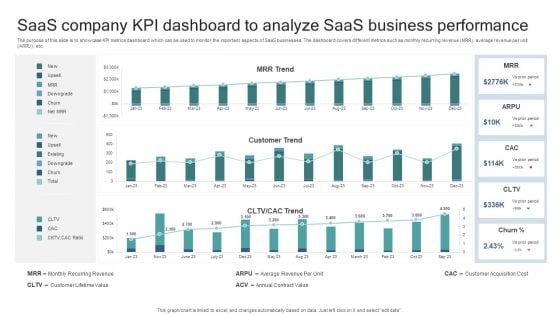
Saas Company KPI Dashboard To Analyze Saas Business Performance Elements PDF
The purpose of this slide is to showcase KPI metrics dashboard which can be used to monitor the important aspects of SaaS businesses. The dashboard covers different metrics such as monthly recurring revenue MRR, average revenue per unit ARPU, etc. Pitch your topic with ease and precision using this Saas Company KPI Dashboard To Analyze Saas Business Performance Elements PDF. This layout presents information on Monthly Recurring Revenue, Customer Lifetime Value, Average Revenue Per Unit, Annual Contract Value, Customer Acquisition Cost. It is also available for immediate download and adjustment. So, changes can be made in the color, design, graphics or any other component to create a unique layout.
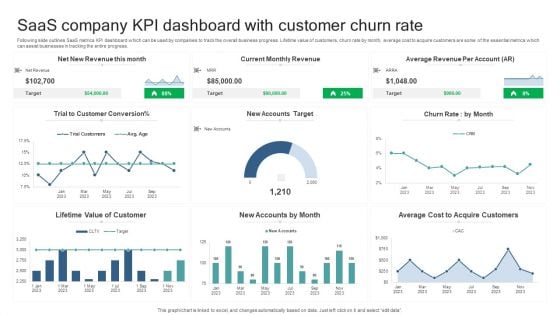
Saas Company KPI Dashboard With Customer Churn Rate Microsoft PDF
Following slide outlines SaaS metrics KPI dashboard which can be used by companies to track the overall business progress. Lifetime value of customers, churn rate by month, average cost to acquire customers are some of the essential metrics which can assist businesses in tracking the entire progress. Pitch your topic with ease and precision using this Saas Company KPI Dashboard With Customer Churn Rate Microsoft PDF. This layout presents information on Lifetime Value Of Customer, New Accounts By Month, Average Cost Acquire Customers. It is also available for immediate download and adjustment. So, changes can be made in the color, design, graphics or any other component to create a unique layout.
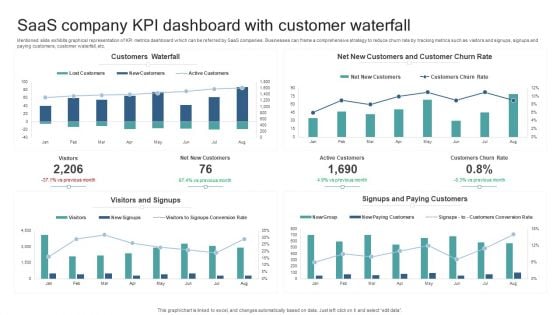
Saas Company KPI Dashboard With Customer Waterfall Slides PDF
Mentioned slide exhibits graphical representation of KPI metrics dashboard which can be referred by SaaS companies. Businesses can frame a comprehensive strategy to reduce churn rate by tracking metrics such as visitors and signups, signups and paying customers, customer waterfall, etc. Pitch your topic with ease and precision using this Saas Company KPI Dashboard With Customer Waterfall Slides PDF. This layout presents information on Customers Waterfall, Visitors And Signups, Signups And Paying Customers. It is also available for immediate download and adjustment. So, changes can be made in the color, design, graphics or any other component to create a unique layout.


 Continue with Email

 Home
Home


