Investment Dashboard
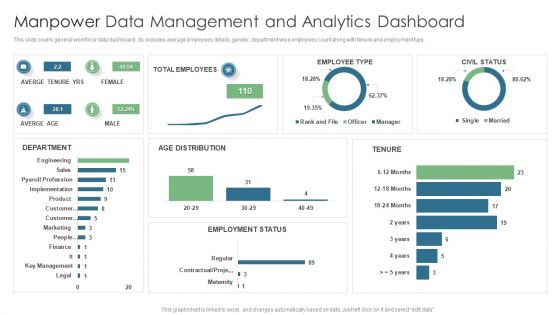
Manpower Data Management And Analytics Dashboard Topics PDF
This slide covers general workforce data dashboard . Its includes average employees details, gender, department wise employees count along with tenure and employment type. Pitch your topic with ease and precision using this Manpower Data Management And Analytics Dashboard Topics PDF. This layout presents information on Total Employees, Averge Tenure Yrs, Employee Type. It is also available for immediate download and adjustment. So, changes can be made in the color, design, graphics or any other component to create a unique layout.
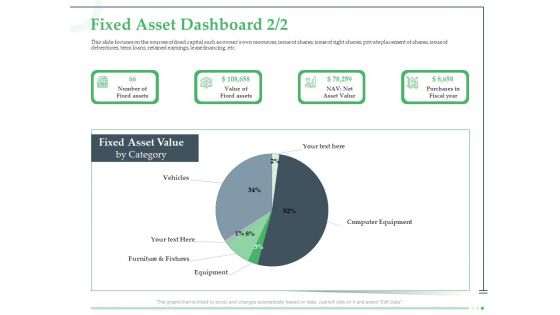
Funds Requisite Evaluation Fixed Asset Dashboard Brochure Demonstration PDF
Presenting this set of slides with name funds requisite evaluation fixed asset dashboard brochure demonstration pdf. The topics discussed in these slides are fixed assets, value, fiscal year. This is a completely editable PowerPoint presentation and is available for immediate download. Download now and impress your audience.
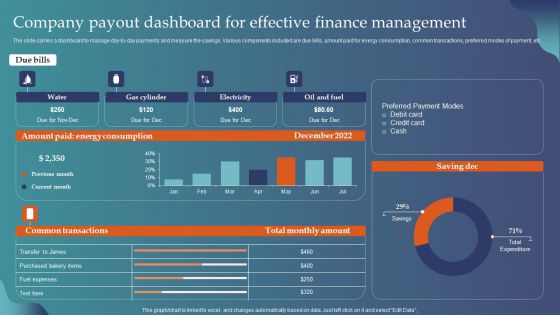
Company Payout Dashboard For Effective Finance Management Introduction PDF
The slide carries a dashboard to manage day-to-day payments and measure the savings. Various components included are due bills, amount paid for energy consumption, common transactions, preferred modes of payment, etc. Pitch your topic with ease and precision using this Company Payout Dashboard For Effective Finance Management Introduction PDF. This layout presents information on Electricity, Oil And Fuel, Gas Cylinder. It is also available for immediate download and adjustment. So, changes can be made in the color, design, graphics or any other component to create a unique layout.
Web Access Control Solution Secure Web Gateway Performance Tracking Dashboard
This slide represents a dashboard to maintain the record of various functions of Secure Web Gateway. The main components are top blocked web malware, web usage trend, top web application categories, risky web isolations, etc. Get a simple yet stunning designed Web Access Control Solution Secure Web Gateway Performance Tracking Dashboard. It is the best one to establish the tone in your meetings. It is an excellent way to make your presentations highly effective. So, download this PPT today from Slidegeeks and see the positive impacts. Our easy-to-edit Web Access Control Solution Secure Web Gateway Performance Tracking Dashboard can be your go-to option for all upcoming conferences and meetings. So, what are you waiting for Grab this template today. This slide represents a dashboard to maintain the record of various functions of Secure Web Gateway. The main components are top blocked web malware, web usage trend, top web application categories, risky web isolations, etc.
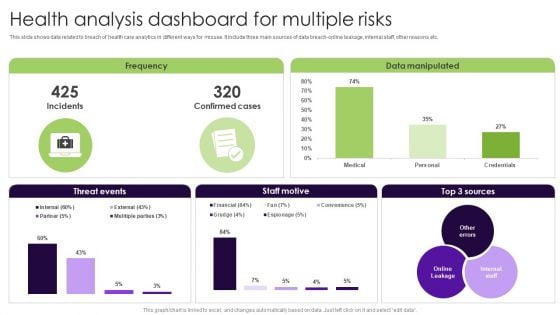
Health Analysis Dashboard For Multiple Risks Elements PDF
This slide shows data related to breach of health care analytics in different ways for misuse. It include three main sources of data breach-online leakage, internal staff, other reasons etc. Showcasing this set of slides titled Health Analysis Dashboard For Multiple Risks Elements PDF. The topics addressed in these templates are Health Analysis Dashboard, Multiple Risks. All the content presented in this PPT design is completely editable. Download it and make adjustments in color, background, font etc. as per your unique business setting.
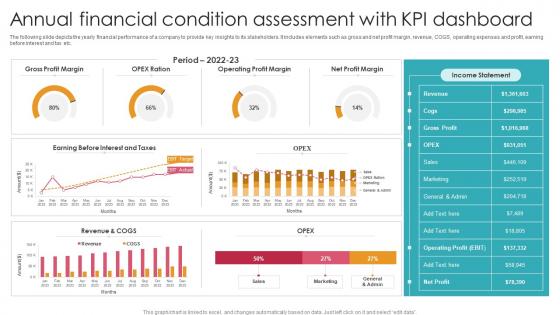
Annual Financial Condition Assessment With KPI Dashboard Ideas Pdf
The following slide depicts the yearly financial performance of a company to provide key insights to its stakeholders. It includes elements such as gross and net profit margin, revenue, COGS, operating expenses and profit, earning before interest and tax etc. Showcasing this set of slides titled Annual Financial Condition Assessment With KPI Dashboard Ideas Pdf. The topics addressed in these templates are Gross Profit Margin, Operating Profit Margin, Net Profit Margin. All the content presented in this PPT design is completely editable. Download it and make adjustments in color, background, font etc. as per your unique business setting. The following slide depicts the yearly financial performance of a company to provide key insights to its stakeholders. It includes elements such as gross and net profit margin, revenue, COGS, operating expenses and profit, earning before interest and tax etc.
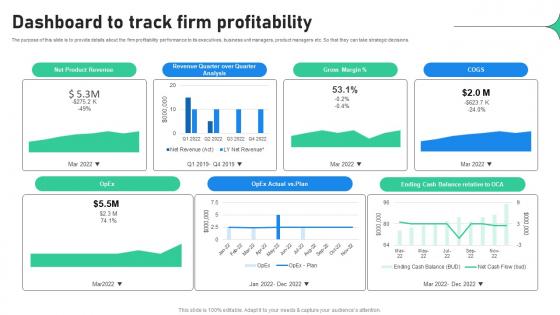
Dashboard To Track Firm Profitability Increasing Profitability Through Better Product
The purpose of this slide is to provide details about the firm profitability performance to its executives, business unit managers, product managers etc. So that they can take strategic decisions. From laying roadmaps to briefing everything in detail, our templates are perfect for you. You can set the stage with your presentation slides. All you have to do is download these easy-to-edit and customizable templates. Dashboard To Track Firm Profitability Increasing Profitability Through Better Product will help you deliver an outstanding performance that everyone would remember and praise you for. Do download this presentation today. The purpose of this slide is to provide details about the firm profitability performance to its executives, business unit managers, product managers etc. So that they can take strategic decisions.
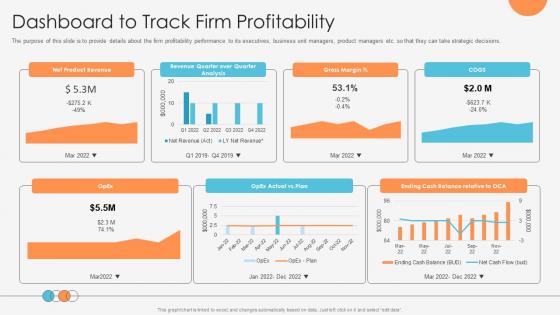
Enhancing Profitability Modelling Dashboard To Track Firm Profitability
The purpose of this slide is to provide details about the firm profitability performance to its executives, business unit managers, product managers etc. so that they can take strategic decisions. From laying roadmaps to briefing everything in detail, our templates are perfect for you. You can set the stage with your presentation slides. All you have to do is download these easy-to-edit and customizable templates. Enhancing Profitability Modelling Dashboard To Track Firm Profitability will help you deliver an outstanding performance that everyone would remember and praise you for. Do download this presentation today. The purpose of this slide is to provide details about the firm profitability performance to its executives, business unit managers, product managers etc. so that they can take strategic decisions.
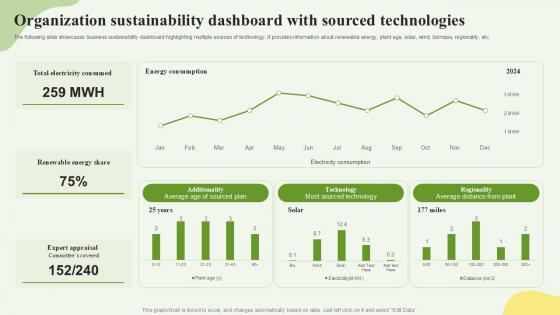
Organization Sustainability Dashboard With Sourced Technologies Ppt Example SS
The following slide showcases techniques to bring sustainability in startups. It provides information about sustainable solutions, eco point, electric vehicles, ozone generator, etc. Retrieve professionally designed Organization Sustainability Dashboard With Sourced Technologies Ppt Example SS to effectively convey your message and captivate your listeners. Save time by selecting pre-made slideshows that are appropriate for various topics, from business to educational purposes. These themes come in many different styles, from creative to corporate, and all of them are easily adjustable and can be edited quickly. Access them as PowerPoint templates or as Google Slides themes. You do not have to go on a hunt for the perfect presentation because Slidegeeks got you covered from everywhere. The following slide showcases techniques to bring sustainability in startups. It provides information about sustainable solutions, eco point, electric vehicles, ozone generator, etc.

Property Dealer Sales Dashboard By Power BI Ppt Presentation SS
The following slide showcases figures highlighting sustainability plans taken by corporates. It provides information about competitors, energy reduction, waste management, operations, employee retention, etc. Do you know about Slidesgeeks Property Dealer Sales Dashboard By Power BI Ppt Presentation SS These are perfect for delivering any kind od presentation. Using it, create PowerPoint presentations that communicate your ideas and engage audiences. Save time and effort by using our pre-designed presentation templates that are perfect for a wide range of topic. Our vast selection of designs covers a range of styles, from creative to business, and are all highly customizable and easy to edit. Download as a PowerPoint template or use them as Google Slides themes. The following slide showcases figures highlighting sustainability plans taken by corporates. It provides information about competitors, energy reduction, waste management, operations, employee retention, etc.
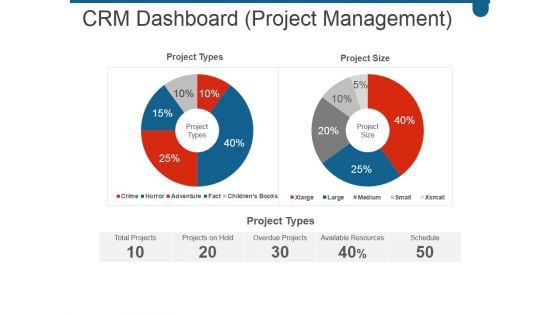
Crm Dashboard Project Management Ppt PowerPoint Presentation Show
This is a crm dashboard project management ppt powerpoint presentation show. This is a two stage process. The stages in this process are total projects, projects on hold, overdue projects, available resources, schedule.
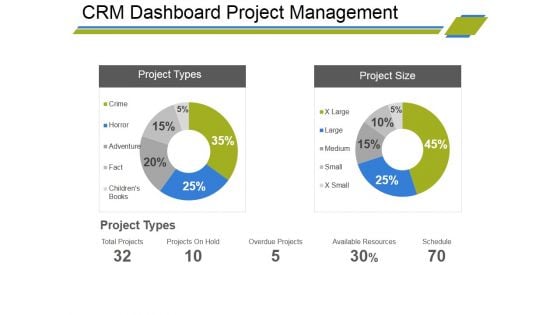
Crm Dashboard Project Management Ppt PowerPoint Presentation Professional Background Designs
This is a crm dashboard project management ppt powerpoint presentation professional background designs. This is a two stage process. The stages in this process are total projects, projects on hold, overdue projects, available resources, schedule.
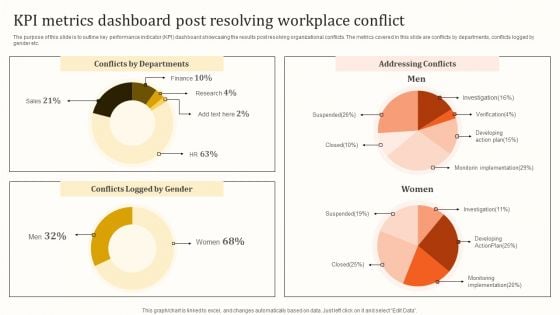
KPI Metrics Dashboard Post Resolving Workplace Conflict Template PDF
The purpose of this slide is to outline key performance indicator KPI dashboard showcasing the results post resolving organizational conflicts. The metrics covered in this slide are conflicts by departments, conflicts logged by gender etc. Presenting this PowerPoint presentation, titled KPI Metrics Dashboard Post Resolving Workplace Conflict Template PDF, with topics curated by our researchers after extensive research. This editable presentation is available for immediate download and provides attractive features when used. Download now and captivate your audience. Presenting this KPI Metrics Dashboard Post Resolving Workplace Conflict Template PDF. Our researchers have carefully researched and created these slides with all aspects taken into consideration. This is a completely customizable KPI Metrics Dashboard Post Resolving Workplace Conflict Template PDF that is available for immediate downloading. Download now and make an impact on your audience. Highlight the attractive features available with our PPTs.
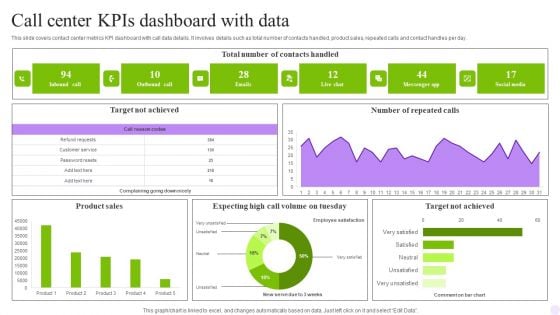
Call Center Kpis Dashboard With Data Graphics PDF
This slide covers contact center team performance metrics KPI dashboard. It involves details such as resolutions, response time, call data management and daily response time. Showcasing this set of slides titled Call Center Kpis Dashboard With Data Graphics PDF. The topics addressed in these templates are Response Time, Data Management, Resolution Rate. All the content presented in this PPT design is completely editable. Download it and make adjustments in color, background, font etc. as per your unique business setting.
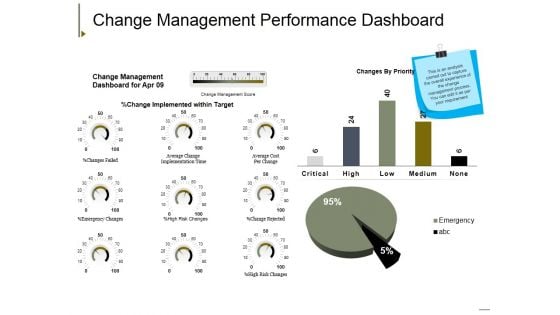
Change Management Performance Dashboard Ppt PowerPoint Presentation Summary Background Image
This is a change management performance dashboard ppt powerpoint presentation summary background image. This is a three stage process. The stages in this process are high risk changes, average change, implementation time, emergency changes, average cost per change, change rejected.

Sales Product Performance Dashboard Ppt PowerPoint Presentation Model Graphics Design
This is a sales product performance dashboard ppt powerpoint presentation model graphics design. This is a four stage process. The stages in this process are top products in revenue, incremental sales, cost of goods.
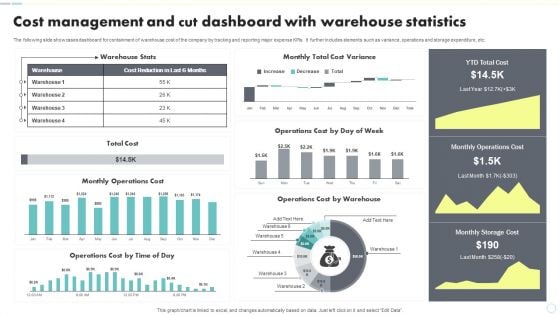
Cost Management And Cut Dashboard With Warehouse Statistics Sample PDF
The following slide showcases dashboard for containment of warehouse cost of the company by tracking and reporting major expense KPIs. It further includes elements such as variance, operations and storage expenditure, etc. Showcasing this set of slides titled Cost Management And Cut Dashboard With Warehouse Statistics Sample PDF. The topics addressed in these templates are Monthly Operations Cost, Monthly Storage Cost, Warehouse Stats. All the content presented in this PPT design is completely editable. Download it and make adjustments in color, background, font etc. as per your unique business setting.
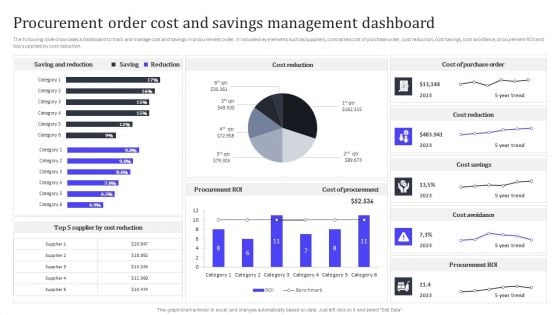
Procurement Order Cost And Savings Management Dashboard Ideas PDF
The following slide showcases a dashboard to track and manage cost and savings in procurement order. It includes key elements such as suppliers, contracted cost of purchase order, cost reduction, cost savings, cost avoidance, procurement ROI and top suppliers by cost reduction. There are so many reasons you need a Procurement Order Cost And Savings Management Dashboard Ideas PDF. The first reason is you can not spend time making everything from scratch, Thus, Slidegeeks has made presentation templates for you too. You can easily download these templates from our website easily.
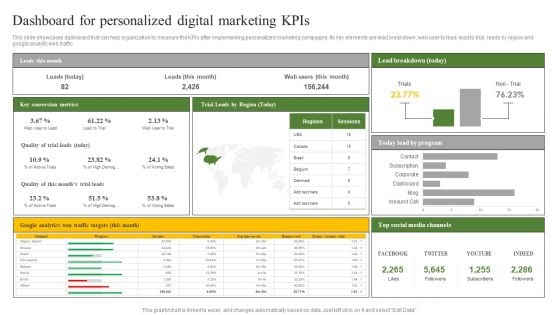
Dashboard For Personalized Digital Marketing Kpis Ppt Background Designs PDF
This slide showcases dashboard that can help organization to measure the KPIs after implementing personalized marketing campaigns. Its key elements are lead breakdown, web user to lead, lead to trial, leads by region and google analytic web traffic. Presenting this PowerPoint presentation, titled Dashboard For Personalized Digital Marketing Kpis Ppt Background Designs PDF, with topics curated by our researchers after extensive research. This editable presentation is available for immediate download and provides attractive features when used. Download now and captivate your audience. Presenting this Dashboard For Personalized Digital Marketing Kpis Ppt Background Designs PDF. Our researchers have carefully researched and created these slides with all aspects taken into consideration. This is a completely customizable Dashboard For Personalized Digital Marketing Kpis Ppt Background Designs PDF that is available for immediate downloading. Download now and make an impact on your audience. Highlight the attractive features available with our PPTs.
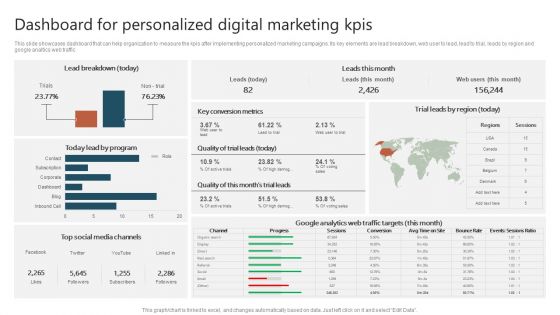
Dashboard For Personalized Digital Marketing Kpis Ppt File Layouts PDF
This slide showcases dashboard that can help organization to measure the KPIs after implementing personalized marketing campaigns. Its key elements are lead breakdown, web user to lead, lead to trial, leads by region and google analytic web traffic. Presenting this PowerPoint presentation, titled Dashboard For Personalized Digital Marketing Kpis Ppt File Layouts PDF, with topics curated by our researchers after extensive research. This editable presentation is available for immediate download and provides attractive features when used. Download now and captivate your audience. Presenting this Dashboard For Personalized Digital Marketing Kpis Ppt File Layouts PDF. Our researchers have carefully researched and created these slides with all aspects taken into consideration. This is a completely customizable Dashboard For Personalized Digital Marketing Kpis Ppt File Layouts PDF that is available for immediate downloading. Download now and make an impact on your audience. Highlight the attractive features available with our PPTs.
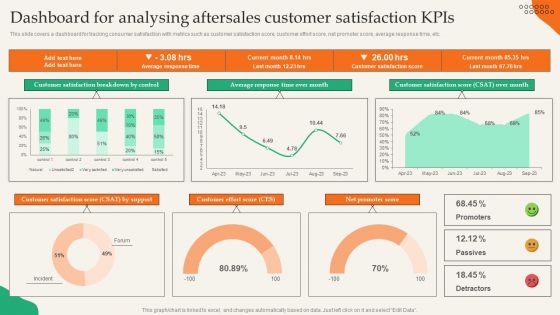
Dashboard For Analysing Aftersales Customer Satisfaction Kpis Structure PDF
This slide covers a dashboard for tracking consumer satisfaction with metrics such as customer satisfaction score, customer effort score, net promoter score, average response time, etc. Presenting this PowerPoint presentation, titled Dashboard For Analysing Aftersales Customer Satisfaction Kpis Structure PDF, with topics curated by our researchers after extensive research. This editable presentation is available for immediate download and provides attractive features when used. Download now and captivate your audience. Presenting this Dashboard For Analysing Aftersales Customer Satisfaction Kpis Structure PDF. Our researchers have carefully researched and created these slides with all aspects taken into consideration. This is a completely customizable Dashboard For Analysing Aftersales Customer Satisfaction Kpis Structure PDF that is available for immediate downloading. Download now and make an impact on your audience. Highlight the attractive features available with our PPTs.
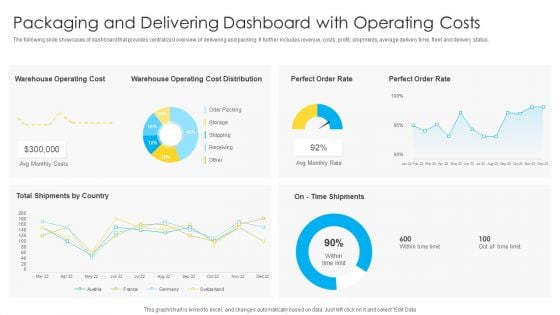
Packaging And Delivering Dashboard With Operating Costs Topics PDF
The following slide showcases of dashboard that provides centralized overview of delivering and packing. It further includes revenue, costs, profit, shipments, average delivery time, fleet and delivery status. Showcasing this set of slides titled Packaging And Delivering Dashboard With Operating Costs Topics PDF. The topics addressed in these templates are Warehouse Operating Cost, Perfect Order Rate, Avg Monthly Costs. All the content presented in this PPT design is completely editable. Download it and make adjustments in color, background, font etc. as per your unique business setting.
KPI Dashboard For Tracking Supply Chain Costs Inspiration PDF
This slide represents the KPI dashboard to track the multiple cost associated with supply chain in food manufacturing industry. It includes information regarding cash to cash cycle in days, carry cost of inventory along with details of net sales. Deliver an awe inspiring pitch with this creative KPI Dashboard For Tracking Supply Chain Costs Inspiration PDF bundle. Topics like Supply Chain Costs, Average Cash, Service can be discussed with this completely editable template. It is available for immediate download depending on the needs and requirements of the user.
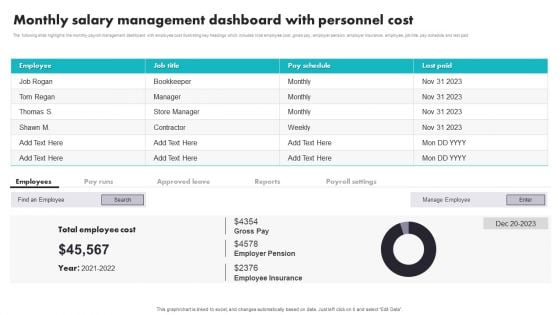
Monthly Salary Management Dashboard With Personnel Cost Background PDF
The following slide highlights the monthly payroll management dashboard with employee cost illustrating key headings which includes total employee cost, gross pay, employer pension, employer insurance, employee, job title, pay schedule and last paid. Showcasing this set of slides titled Monthly Salary Management Dashboard With Personnel Cost Background PDF. The topics addressed in these templates are Employee Cost, Employer Pension, Employee Insurance. All the content presented in this PPT design is completely editable. Download it and make adjustments in color, background, font etc. as per your unique business setting.
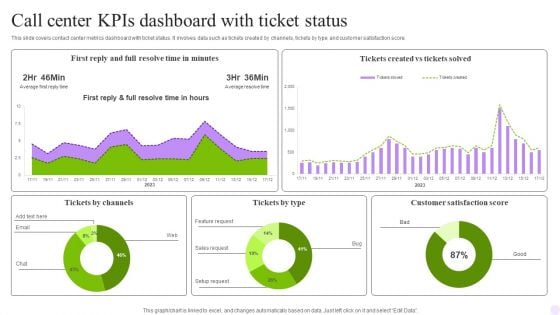
Call Center Kpis Dashboard With Ticket Status Diagrams PDF
This slide covers contact center metrics dashboard with ticket status. It involves data such as tickets created by channels, tickets by type and customer satisfaction score. Showcasing this set of slides titled Call Center Kpis Dashboard With Ticket Status Diagrams PDF. The topics addressed in these templates are Status, Minutes, Call. All the content presented in this PPT design is completely editable. Download it and make adjustments in color, background, font etc. as per your unique business setting.
KPI Dashboard For Organizational Debt Management Ppt Professional Icons PDF
This slide shows the KPI dashboard for debt management which can be used by an organization to track debt performance. It includes KPIs such as current bank balance, amount due, creditors, etc. Showcasing this set of slides titled KPI Dashboard For Organizational Debt Management Ppt Professional Icons PDF. The topics addressed in these templates are Total Amount Due, Current Bank Balance, Invoiced vs Paid. All the content presented in this PPT design is completely editable. Download it and make adjustments in color, background, font etc. as per your unique business setting.
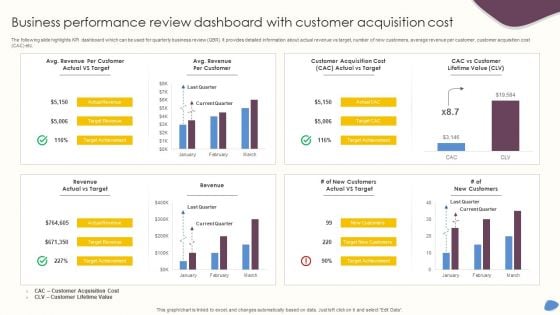
Business Performance Review Dashboard With Customer Acquisition Cost Diagrams PDF
The following slide highlights KPI dashboard which can be used for quarterly business review QBR. It provides detailed information about actual revenue vs target, number of new customers, average revenue per customer, customer acquisition cost CAC etc. Pitch your topic with ease and precision using this Business Performance Review Dashboard With Customer Acquisition Cost Diagrams PDF. This layout presents information on Revenue, Customer Acquisition Cost, Current Quarter. It is also available for immediate download and adjustment. So, changes can be made in the color, design, graphics or any other component to create a unique layout.
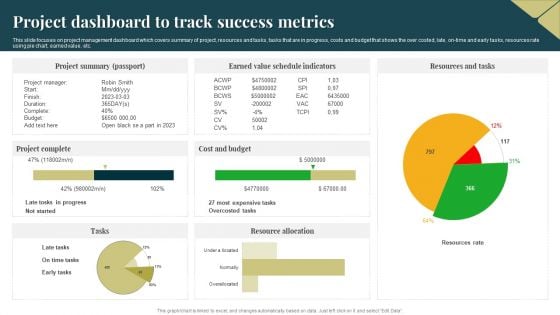
Project Dashboard To Track Success Metrics Background PDF
This slide focuses on project management dashboard which covers summary of project, resources and tasks, tasks that are in progress, costs and budget that shows the over costed, late, on time and early tasks, resources rate using pie chart, earned value, etc. Pitch your topic with ease and precision using this Project Dashboard To Track Success Metrics Background PDF. This layout presents information on Cost And Budget, Project Summary, Resource Allocation. It is also available for immediate download and adjustment. So, changes can be made in the color, design, graphics or any other component to create a unique layout.
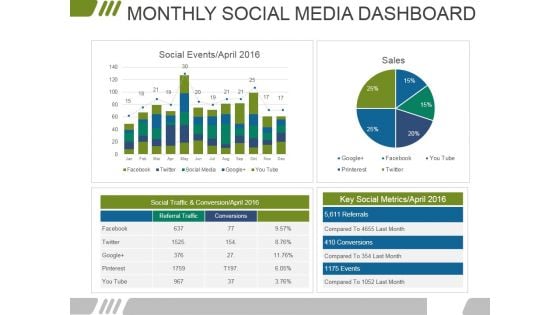
Monthly Social Media Dashboard Ppt PowerPoint Presentation Infographics Files
This is a monthly social media dashboard ppt powerpoint presentation infographics files. This is a four stage process. The stages in this process are marketing, business, financial, data analysis, management.
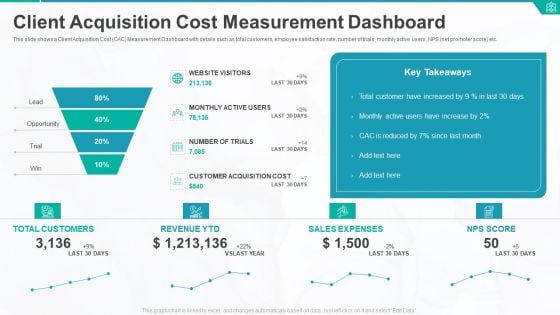
Client Acquisition Cost Measurement Dashboard Ppt Portfolio Graphic Tips PDF
This slide shows a Client Acquisition Cost CAC Measurement Dashboard with details such as total customers, employee satisfaction rate, number of trials, monthly active users, NPS net promoter score etc. Deliver and pitch your topic in the best possible manner with this client acquisition cost measurement dashboard ppt portfolio graphic tips pdf. Use them to share invaluable insights on total customers, revenue, sales expenses, nps score and impress your audience. This template can be altered and modified as per your expectations. So, grab it now.
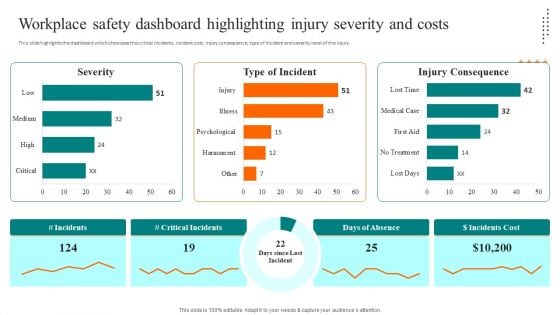
Workplace Safety Dashboard Highlighting Injury Severity And Costs Rules PDF
This slide highlights the dashboard which showcase the critical incidents, incident cost, injury consequence, type of incident and severity level of the injury. Want to ace your presentation in front of a live audience Our Workplace Safety Dashboard Highlighting Injury Severity And Costs Rules PDF can help you do that by engaging all the users towards you. Slidegeeks experts have put their efforts and expertise into creating these impeccable powerpoint presentations so that you can communicate your ideas clearly. Moreover, all the templates are customizable, and easy to edit and downloadable. Use these for both personal and commercial use.
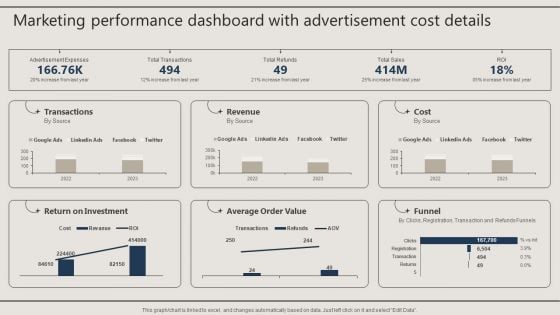
Marketing Performance Dashboard With Advertisement Cost Details Download PDF
Here you can discover an assortment of the finest PowerPoint and Google Slides templates. With these templates, you can create presentations for a variety of purposes while simultaneously providing your audience with an eye catching visual experience. Download Marketing Performance Dashboard With Advertisement Cost Details Download PDF to deliver an impeccable presentation. These templates will make your job of preparing presentations much quicker, yet still, maintain a high level of quality. Slidegeeks has experienced researchers who prepare these templates and write high quality content for you. Later on, you can personalize the content by editing the Marketing Performance Dashboard With Advertisement Cost Details Download PDF.
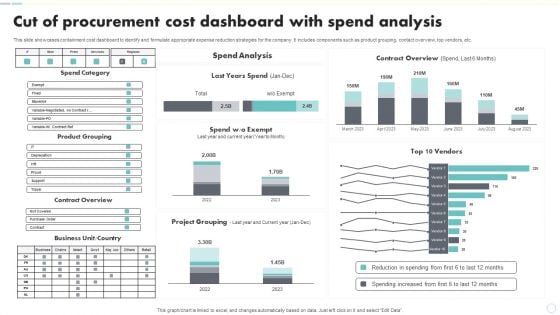
Cut Of Procurement Cost Dashboard With Spend Analysis Elements PDF
This slide showcases containment cost dashboard to identify and formulate appropriate expense reduction strategies for the company. It includes components such as product grouping, contact overview, top vendors, etc. Showcasing this set of slides titled Cut Of Procurement Cost Dashboard With Spend Analysis Elements PDF. The topics addressed in these templates are Spend Category, Product Grouping, Contract Overview. All the content presented in this PPT design is completely editable. Download it and make adjustments in color, background, font etc. as per your unique business setting.

Enterprise Recruitment Dashboard With Cost Per Hire Graphics PDF
The following slide showcases KPI dashboard to get real- time insights about efficiency of corporate staffing process in the organization. It includes elements such as hired, days to fill, sources contribution, etc. Pitch your topic with ease and precision using this Enterprise Recruitment Dashboard With Cost Per Hire Graphics PDF. This layout presents information on Enterprise, Contribution, Cost. It is also available for immediate download and adjustment. So, changes can be made in the color, design, graphics or any other component to create a unique layout.
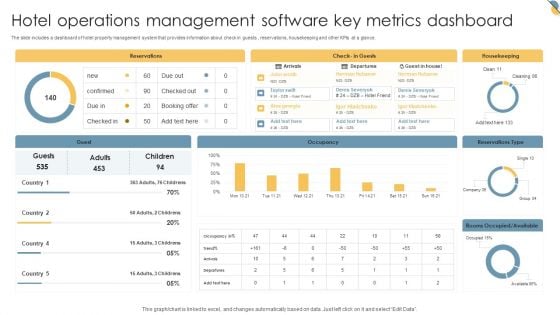
Hotel Operations Management Software Key Metrics Dashboard Inspiration PDF
The slide includes a dashboard of hotel property management system that provides information about check in guests , reservations, housekeeping and other KPIs at a glance. Pitch your topic with ease and precision using this Hotel Operations Management Software Key Metrics Dashboard Inspiration PDF. This layout presents information on Reservations, Housekeeping, Occupancy. It is also available for immediate download and adjustment. So, changes can be made in the color, design, graphics or any other component to create a unique layout.
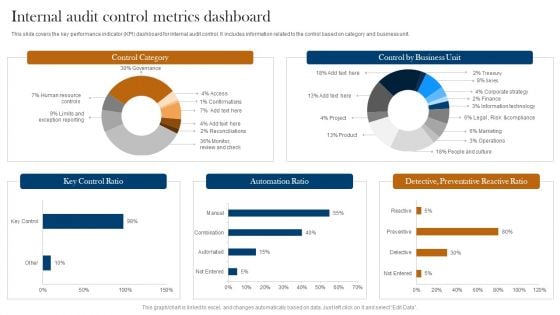
Internal Audit Control Metrics Dashboard Ppt Professional Design Templates PDF
This slide covers the key performance indicator KPI dashboard for internal audit control. It includes information related to the control based on category and business unit. Showcasing this set of slides titled Internal Audit Control Metrics Dashboard Ppt Professional Design Templates PDF. The topics addressed in these templates are Control Category, Key Control Ratio, Automation Ratio. All the content presented in this PPT design is completely editable. Download it and make adjustments in color, background, font etc. as per your unique business setting.
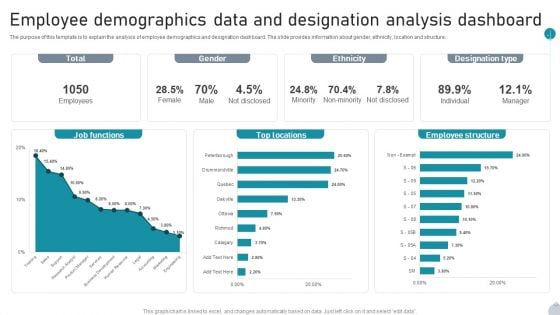
Employee Demographics Data And Designation Analysis Dashboard Introduction PDF
The purpose of this template is to explain the analysis of employee demographics and designation dashboard. The slide provides information about gender, ethnicity, location and structure. Pitch your topic with ease and precision using this Employee Demographics Data And Designation Analysis Dashboard Introduction PDF. This layout presents information on Job Functions, Top Locations, Employee Structure It is also available for immediate download and adjustment. So, changes can be made in the color, design, graphics or any other component to create a unique layout.
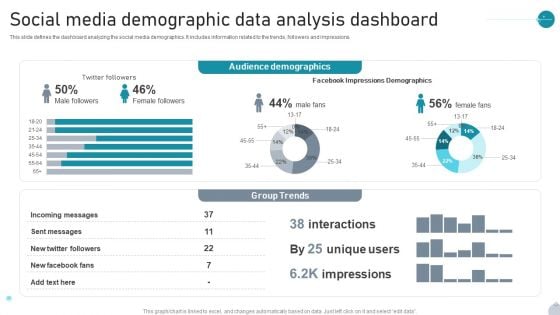
Social Media Demographic Data Analysis Dashboard Infographics PDF
This slide defines the dashboard analyzing the social media demographics. It includes information related to the trends, followers and impressions. Pitch your topic with ease and precision using this Social Media Demographic Data Analysis Dashboard Infographics PDF. This layout presents information on Audience Demographics, Group Trends, Impressions Demographics It is also available for immediate download and adjustment. So, changes can be made in the color, design, graphics or any other component to create a unique layout.
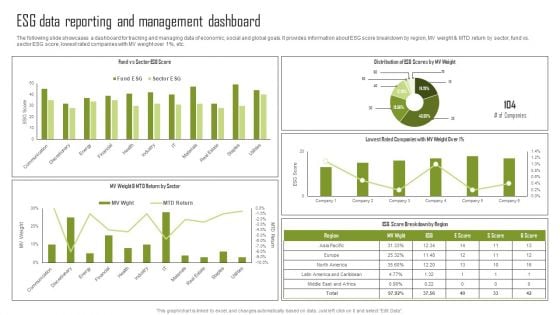
ESG Data Reporting And Management Dashboard Download PDF
The following slide showcases a dashboard for tracking and managing data of economic, social and global goals. It provides information about ESG score breakdown by region, MV weight and MTD return by sector, fund vs. sector ESG score, lowest rated companies with MV weight over 1 percent, etc. Formulating a presentation can take up a lot of effort and time, so the content and message should always be the primary focus. The visuals of the PowerPoint can enhance the presenters message, so our ESG Data Reporting And Management Dashboard Download PDF was created to help save time. Instead of worrying about the design, the presenter can concentrate on the message while our designers work on creating the ideal templates for whatever situation is needed. Slidegeeks has experts for everything from amazing designs to valuable content, we have put everything into ESG Data Reporting And Management Dashboard Download PDF.
Software Implementation Project Progress Tracking Dashboard Summary PDF
This slide represents the dashboard to track the progress of software implementation project. It includes details related to health, tasks, project, time, cost and workload of software implementation project. If you are looking for a format to display your unique thoughts, then the professionally designed Software Implementation Project Progress Tracking Dashboard Summary PDF is the one for you. You can use it as a Google Slides template or a PowerPoint template. Incorporate impressive visuals, symbols, images, and other charts. Modify or reorganize the text boxes as you desire. Experiment with shade schemes and font pairings. Alter, share or cooperate with other people on your work. Download Software Implementation Project Progress Tracking Dashboard Summary PDFSoftware Implementation Project Progress Tracking Dashboard Summary PDF and find out how to give a successful presentation. Present a perfect display to your team and make your presentation unforgettable.
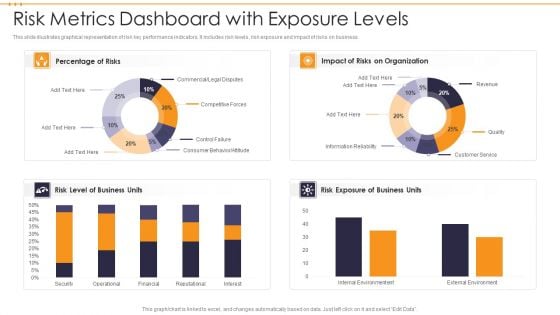
Risk Metrics Dashboard With Exposure Levels Template PDF
This slide illustrates graphical representation of risk key performance indicators. It includes risk levels, risk exposure and impact of risks on business. Pitch your topic with ease and precision using this Risk Metrics Dashboard With Exposure Levels Template PDF. This layout presents information on Risk Metrics Dashboard With Exposure Levels. It is also available for immediate download and adjustment. So, changes can be made in the color, design, graphics or any other component to create a unique layout.
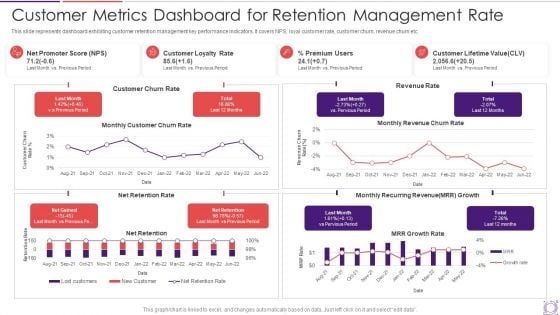
Customer Metrics Dashboard For Retention Management Rate Information PDF
This slide represents dashboard exhibiting customer retention management key performance indicators. It covers NPS, loyal customer rate, customer churn, revenue churn etc. Showcasing this set of slides titled customer metrics dashboard for retention management rate information pdf. The topics addressed in these templates are customer, premium users. All the content presented in this PPT design is completely editable. Download it and make adjustments in color, background, font etc. as per your unique business setting.
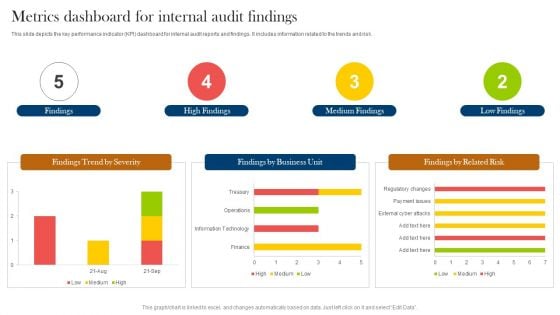
Metrics Dashboard For Internal Audit Findings Ppt Styles Gallery PDF
This slide depicts the key performance indicator KPI dashboard for internal audit reports and findings. It includes information related to the trends and risk. Pitch your topic with ease and precision using this Metrics Dashboard For Internal Audit Findings Ppt Styles Gallery PDF. This layout presents information on Findings, High Findings, Medium Findings, Low Findings. It is also available for immediate download and adjustment. So, changes can be made in the color, design, graphics or any other component to create a unique layout.
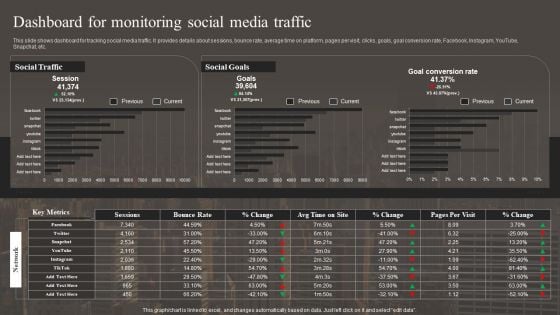
Dashboard For Monitoring Social Media Traffic Microsoft PDF
This slide shows dashboard for tracking social media traffic. It provides details about sessions, bounce rate, average time on platform, pages per visit, clicks, goals, goal conversion rate, Facebook, Instagram, YouTube, Snapchat, etc. Deliver an awe inspiring pitch with this creative Dashboard For Monitoring Social Media Traffic Microsoft PDF bundle. Topics like Social Goals, Goal Conversion Rate, Social Traffic can be discussed with this completely editable template. It is available for immediate download depending on the needs and requirements of the user.
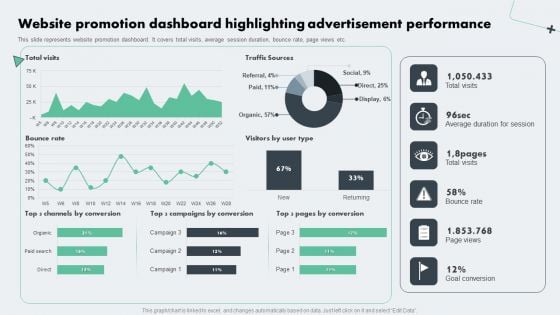
Deploying Online Marketing Website Promotion Dashboard Highlighting Advertisement Themes PDF
This slide represents website promotion dashboard. It covers total visits, average session duration, bounce rate, page views etc. Find a pre-designed and impeccable Deploying Online Marketing Website Promotion Dashboard Highlighting Advertisement Themes PDF. The templates can ace your presentation without additional effort. You can download these easy-to-edit presentation templates to make your presentation stand out from others. So, what are you waiting for Download the template from Slidegeeks today and give a unique touch to your presentation.
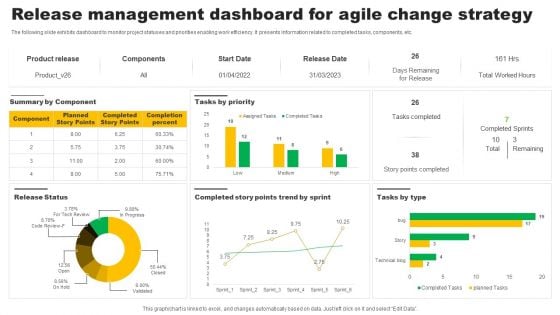
Release Management Dashboard For Agile Change Strategy Professional PDF
The following slide exhibits dashboard to monitor project statuses and priorities enabling work efficiency. It presents information related to completed tasks, components, etc. Showcasing this set of slides titled Release Management Dashboard For Agile Change Strategy Professional PDF. The topics addressed in these templates are Product Release, Components, Start Date. All the content presented in this PPT design is completely editable. Download it and make adjustments in color, background, font etc. as per your unique business setting.
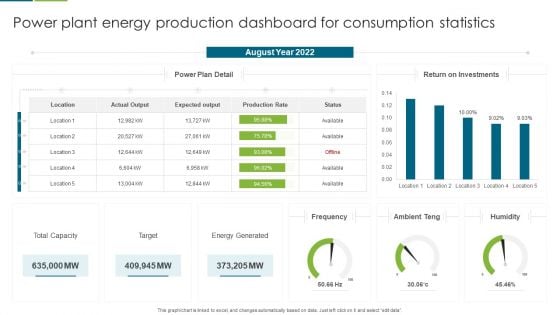
Power Plant Energy Production Dashboard For Consumption Statistics Download PDF
This graph or chart is linked to excel, and changes automatically based on data. Just left click on it and select edit data. Pitch your topic with ease and precision using this Multiple Country Energy Consumption Statistics Comparison Dashboard Formats PDF. This layout presents information on August Year 2022, Return on Investments, Power Plan Detail . It is also available for immediate download and adjustment. So, changes can be made in the color, design, graphics or any other component to create a unique layout.
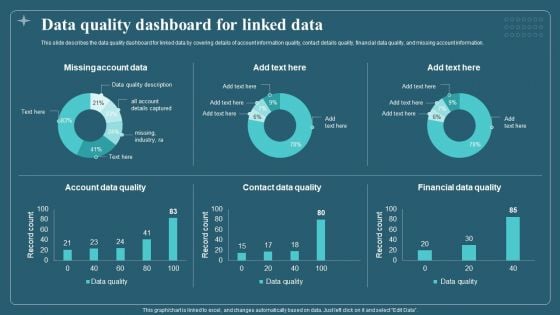
Data Quality Dashboard For Linked Data Download PDF
This slide describes the data quality dashboard for linked data by covering details of account information quality, contact details quality, financial data quality, and missing account information. Deliver an awe inspiring pitch with this creative Data Quality Dashboard For Linked Data Download PDF bundle. Topics like Account Data Quality, Contact Data Quality, Financial Data Quality can be discussed with this completely editable template. It is available for immediate download depending on the needs and requirements of the user.
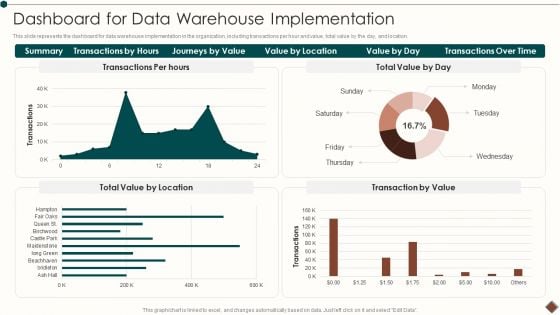
Data Warehouse Implementation Dashboard For Data Warehouse Implementation Microsoft PDF
This slide represents the dashboard for data warehouse implementation in the organization, including transactions per hour and value, total value by the day, and location.Deliver an awe inspiring pitch with this creative Data Warehouse Implementation Dashboard For Data Warehouse Implementation Microsoft PDF bundle. Topics like Transactions Time, Journeys Value, Transactions can be discussed with this completely editable template. It is available for immediate download depending on the needs and requirements of the user.
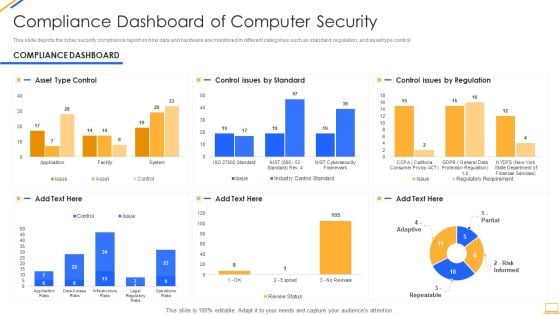
Desktop Security Management Compliance Dashboard Of Computer Security Graphics PDF
This slide depicts the cyber security compliance report on how data and hardware are monitored in different categories such as standard, regulation, and asset type control. Deliver an awe inspiring pitch with this creative desktop security management compliance dashboard of computer security graphics pdf bundle. Topics like compliance dashboard of computer security can be discussed with this completely editable template. It is available for immediate download depending on the needs and requirements of the user.
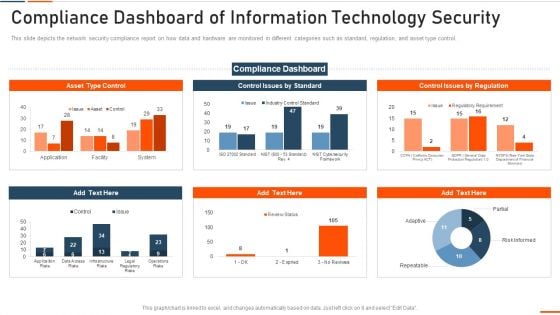
Compliance Dashboard Of Information Technology Security Ppt Inspiration Microsoft PDF
This slide depicts the network security compliance report on how data and hardware are monitored in different categories such as standard, regulation, and asset type control. Deliver an awe inspiring pitch with this creative compliance dashboard of information technology security ppt inspiration microsoft pdf bundle. Topics like compliance dashboard of information technology security can be discussed with this completely editable template. It is available for immediate download depending on the needs and requirements of the user.

KPI Dashboard For Network Asset Monitoring Clipart PDF
This slide covers KPI dashboard of network asset tracking report. It involves details such as audit summary, computers data, software summary, warranty summary and software compliance summary.Showcasing this set of slides titled KPI Dashboard For Network Asset Monitoring Clipart PDF The topics addressed in these templates are Commercial Software, Software Compliance, Warranty Summary All the content presented in this PPT design is completely editable. Download it and make adjustments in color, background, font etc. as per your unique business setting.
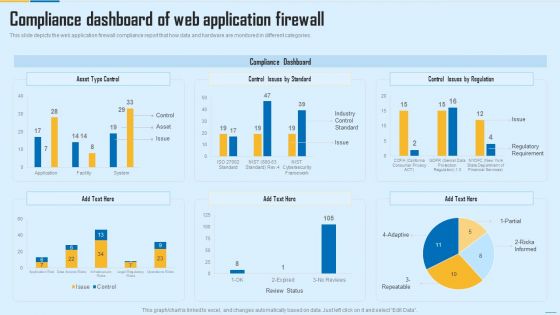
Compliance Dashboard Of Web Application Firewall WAF Platform Topics PDF
This slide depicts the web application firewall compliance report that how data and hardware are monitored in different categories. Deliver and pitch your topic in the best possible manner with this Compliance Dashboard Of Web Application Firewall WAF Platform Topics PDF. Use them to share invaluable insights on Compliance Dashboard, Web Application Firewall and impress your audience. This template can be altered and modified as per your expectations. So, grab it now.
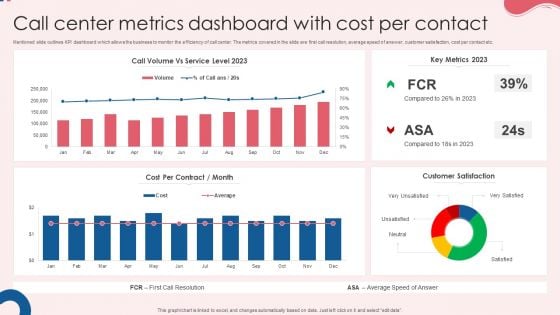
Call Center Metrics Dashboard With Cost Per Contact Rules PDF
Mentioned slide outlines KPI dashboard which allows the business to monitor the efficiency of call center. The metrics covered in the slide are first call resolution, average speed of answer, customer satisfaction, cost per contact etc. Pitch your topic with ease and precision using this Call Center Metrics Dashboard With Cost Per Contact Rules PDF. This layout presents information on Cost Per Contract, Key Metrics, Customer Satisfaction. It is also available for immediate download and adjustment. So, changes can be made in the color, design, graphics or any other component to create a unique layout.
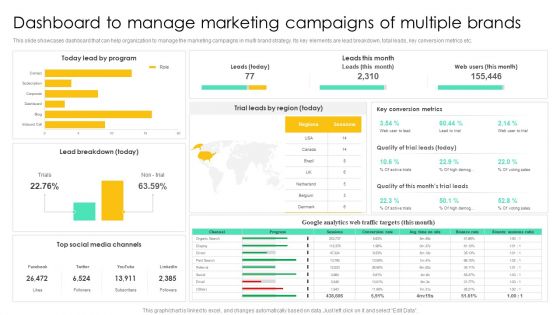
Dashboard To Manage Marketing Campaigns Of Multiple Brands Summary PDF
This slide showcases dashboard that can help organization to manage the marketing campaigns in multi brand strategy. Its key elements are lead breakdown, total leads, key conversion metrics etc. Presenting this PowerPoint presentation, titled Dashboard To Manage Marketing Campaigns Of Multiple Brands Summary PDF, with topics curated by our researchers after extensive research. This editable presentation is available for immediate download and provides attractive features when used. Download now and captivate your audience. Presenting this Dashboard To Manage Marketing Campaigns Of Multiple Brands Summary PDF. Our researchers have carefully researched and created these slides with all aspects taken into consideration. This is a completely customizable Dashboard To Manage Marketing Campaigns Of Multiple Brands Summary PDF that is available for immediate downloading. Download now and make an impact on your audience. Highlight the attractive features available with our PPTs.
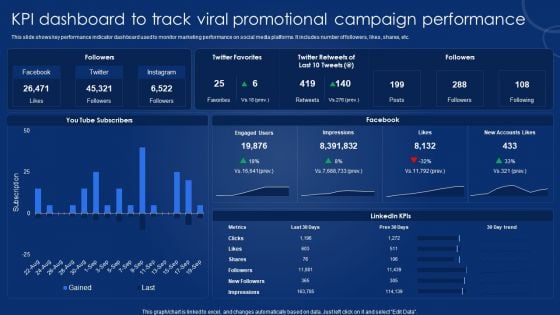
KPI Dashboard To Track Viral Promotional Campaign Performance Icons PDF

Employee Demographics Data And Gender Distribution Dashboard Topics PDF
The purpose of this template is to explain the employee demographics and gender distribution dashboard. The slide provides information about distribution, hire and turnover based gender. Showcasing this set of slides titled Employee Demographics Data And Gender Distribution Dashboard Topics PDF. The topics addressed in these templates are Gender Distribution, Turnover By Gender, Hires By Gender All the content presented in this PPT design is completely editable. Download it and make adjustments in color, background, font etc. as per your unique business setting.
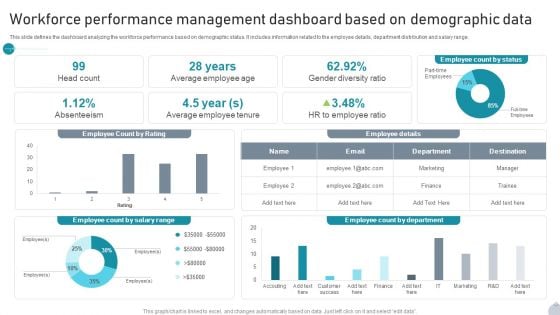
Workforce Performance Management Dashboard Based On Demographic Data Information PDF
This slide defines the dashboard analyzing the workforce performance based on demographic status. It includes information related to the employee details, department distribution and salary range. Showcasing this set of slides titled Workforce Performance Management Dashboard Based On Demographic Data Information PDF. The topics addressed in these templates are Employee Details, Department, Gender Diversity Ratio All the content presented in this PPT design is completely editable. Download it and make adjustments in color, background, font etc. as per your unique business setting.
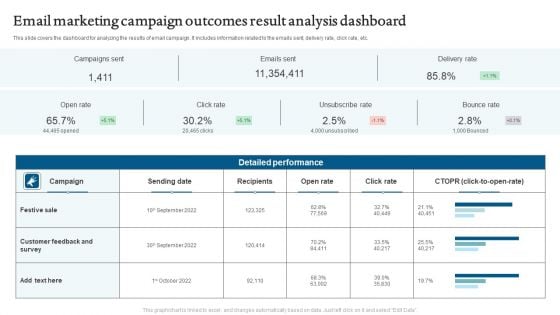
Email Marketing Campaign Outcomes Result Analysis Dashboard Mockup PDF
This slide covers the dashboard for analyzing the email campaign metrics. It includes information related to engagement a key performance indicator KPIs. Pitch your topic with ease and precision using this Email Marketing Campaign Outcomes Result Analysis Dashboard Mockup PDF. This layout presents information on Campaigns Sent, Emails Sent, Delivery Rate. It is also available for immediate download and adjustment. So, changes can be made in the color, design, graphics or any other component to create a unique layout.
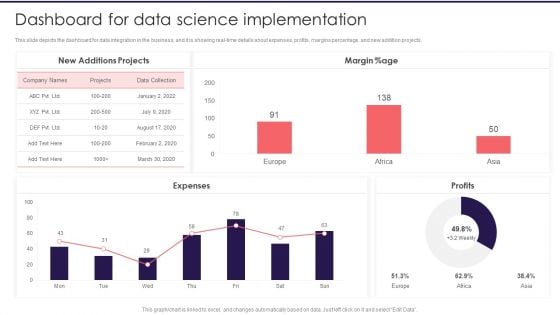
Information Studies Dashboard For Data Science Implementation Structure PDF
This slide depicts the dashboard for data integration in the business, and it is showing real time details about expenses, profits, margins percentage, and new addition projects. Deliver an awe inspiring pitch with this creative Information Studies Dashboard For Data Science Implementation Structure PDF bundle. Topics like New Additions Projects, Margin, Expenses can be discussed with this completely editable template. It is available for immediate download depending on the needs and requirements of the user.


 Continue with Email

 Home
Home


