Investment Dashboard
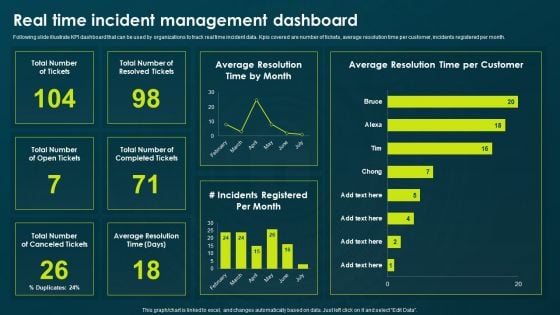
IT Threats Response Playbook Real Time Incident Management Dashboard Formats PDF
Following slide illustrate KPI dashboard that can be used by organizations to track real time incident data. Kpis covered are number of tickets, average resolution time per customer, incidents registered per month. Presenting IT Threats Response Playbook Real Time Incident Management Dashboard Formats PDF to provide visual cues and insights. Share and navigate important information on four stages that need your due attention. This template can be used to pitch topics like Resolved Tickets, Average Resolution, Incidents Registered. In addtion, this PPT design contains high resolution images, graphics, etc, that are easily editable and available for immediate download.
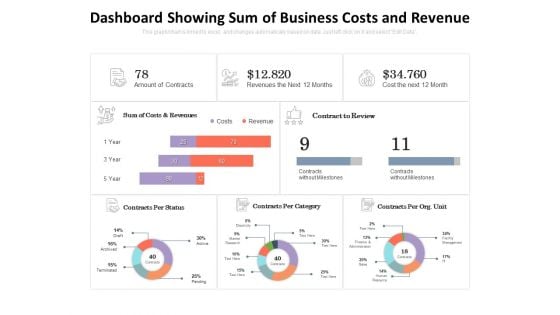
Dashboard Showing Sum Of Business Costs And Revenue Ppt PowerPoint Presentation Inspiration Gallery PDF
Presenting this set of slides with name dashboard showing sum of business costs and revenue ppt powerpoint presentation inspiration gallery pdf. The topics discussed in these slides are sum of costs and revenues, contract to review, contracts per org unit, contracts per category, contracts per status. This is a completely editable PowerPoint presentation and is available for immediate download. Download now and impress your audience.
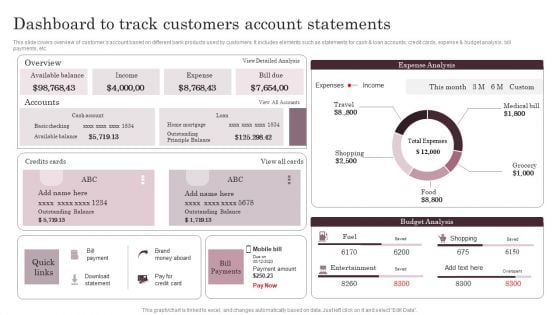
Omnichannel Services Solution In Financial Sector Dashboard To Track Customers Account Statements Guidelines PDF
This slide covers overview of customers account based on different bank products used by customers. It includes elements such as statements for cash and loan accounts, credit cards, expense and budget analysis, bill payments, etc. Create an editable Omnichannel Services Solution In Financial Sector Dashboard To Track Customers Account Statements Guidelines PDF that communicates your idea and engages your audience. Whether you are presenting a business or an educational presentation, pre designed presentation templates help save time. Omnichannel Services Solution In Financial Sector Dashboard To Track Customers Account Statements Guidelines PDF is highly customizable and very easy to edit, covering many different styles from creative to business presentations. Slidegeeks has creative team members who have crafted amazing templates. So, go and get them without any delay.
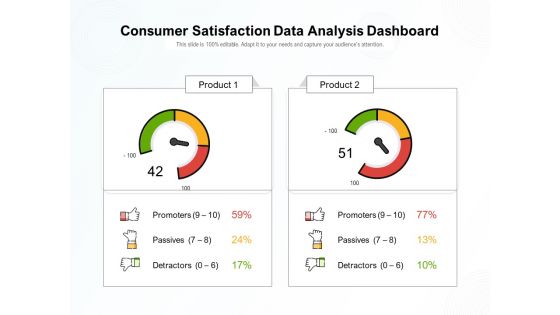
Consumer Satisfaction Data Analysis Dashboard Ppt PowerPoint Presentation Gallery Microsoft PDF
Pitch your topic with ease and precision using this consumer satisfaction data analysis dashboard ppt powerpoint presentation gallery microsoft pdf. This layout presents information on promoters, passives, detractors. It is also available for immediate download and adjustment. So, changes can be made in the color, design, graphics or any other component to create a unique layout.
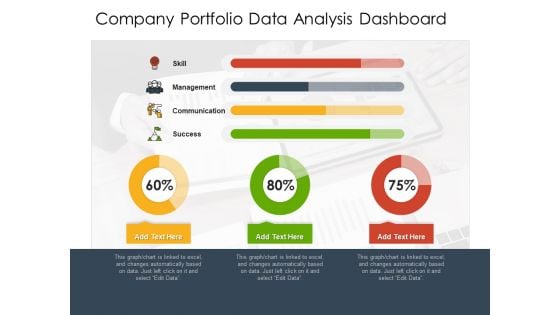
Company Portfolio Data Analysis Dashboard Ppt PowerPoint Presentation File Example Topics PDF
Presenting this set of slides with name company portfolio data analysis dashboard ppt powerpoint presentation file example topics pdf. The topics discussed in these slides are management, communication, success. This is a completely editable PowerPoint presentation and is available for immediate download. Download now and impress your audience.
Finance Metrics Dashboard Illustrating Gross And Operating Profit Margin Icons PDF
This graph or chart is linked to excel, and changes automatically based on data. Just left click on it and select edit data. Showcasing this set of slides titled Finance Metrics Dashboard Illustrating Gross And Operating Profit Margin Icons PDF. The topics addressed in these templates are Gross Profit Margin, Operating Profit Margin, Net Profit Margin. All the content presented in this PPT design is completely editable. Download it and make adjustments in color, background, font etc. as per your unique business setting.
Kpi Dashboard For Tracking Monthly Personal Finances Ppt Outline Graphics Example PDF
This slide shows dashboard which can be used by individuals to track monthly expenses in order to get better understanding of his or her finances. It includes metrics such as users spending, savings, debt, etc. Welcome to our selection of the Kpi Dashboard For Tracking Monthly Personal Finances Ppt Outline Graphics Example PDF. These are designed to help you showcase your creativity and bring your sphere to life. Planning and Innovation are essential for any business that is just starting out. This collection contains the designs that you need for your everyday presentations. All of our PowerPoints are 100 percent editable, so you can customize them to suit your needs. This multi purpose template can be used in various situations. Grab these presentation templates today.
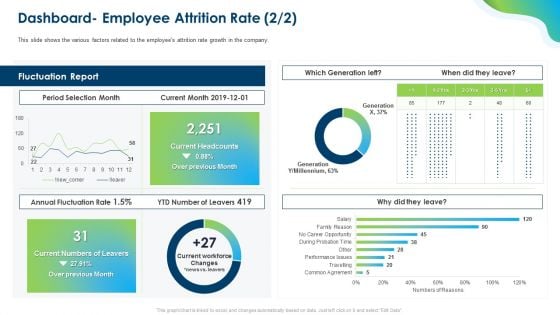
Growing Churn Rate In IT Organization Dashboard Employee Attrition Rate Report Topics PDF
Deliver an awe-inspiring pitch with this creative growing churn rate in it organization dashboard employee attrition rate report topics pdf bundle. Topics like period selection month, current month, annual fluctuation rate can be discussed with this completely editable template. It is available for immediate download depending on the needs and requirements of the user.
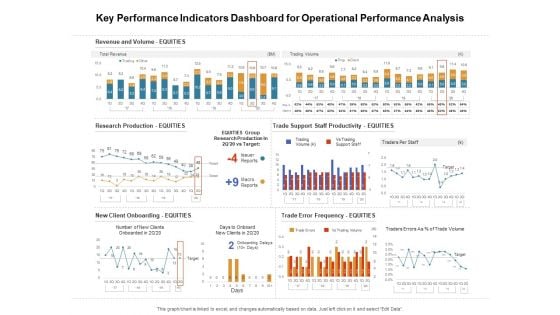
Venture Capitalist Control Board Key Performance Indicators Dashboard For Operational Performance Analysis Formats PDF
Presenting this set of slides with name venture capitalist control board key performance indicators dashboard for operational performance analysis formats pdf. The topics discussed in these slides are revenue and volume, research production, new client onboarding, trade support staff productivity, trade error frequency. This is a completely editable PowerPoint presentation and is available for immediate download. Download now and impress your audience.
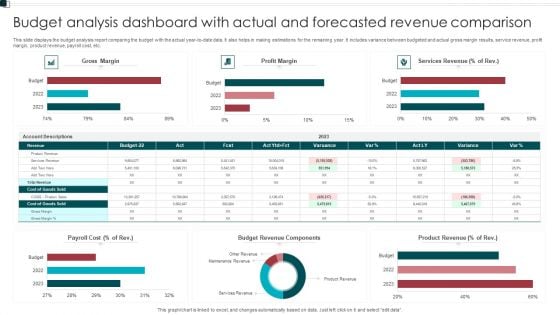
Budget Analysis Dashboard With Actual And Forecasted Revenue Comparison Structure PDF
This slide displays the budget analysis report comparing the budget with the actual year to date data. It also helps in making estimations for the remaining year. It includes variance between budgeted and actual gross margin results, service revenue, profit margin, product revenue, payroll cost, etc. Pitch your topic with ease and precision using this Budget Analysis Dashboard With Actual And Forecasted Revenue Comparison Structure PDF. This layout presents information on Payroll Cost, Budget Revenue Components, Product Revenue. It is also available for immediate download and adjustment. So, changes can be made in the color, design, graphics or any other component to create a unique layout.
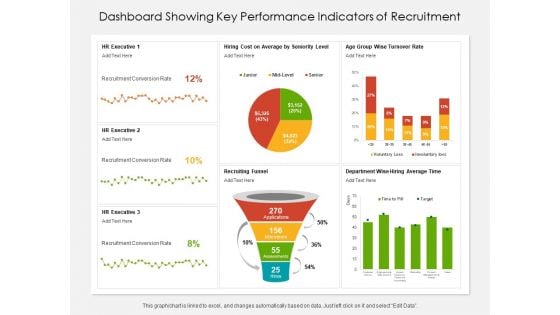
Dashboard Showing Key Performance Indicators Of Recruitment Ppt PowerPoint Presentation File Background Image PDF
Presenting this set of slides with name dashboard showing key performance indicators of recruitment ppt powerpoint presentation file background image pdf. The topics discussed in these slides are executive, funnel, department. This is a completely editable PowerPoint presentation and is available for immediate download. Download now and impress your audience.
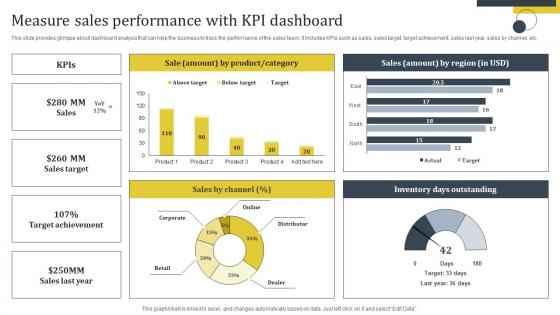
Enhance Customer Retention Measure Sales Performance With Kpi Dashboard Template Pdf
This slide provides glimpse about dashboard analysis that can help the business to track the performance of the sales team. It includes KPIs such as sales, sales target, target achievement, sales last year, sales by channel, etc. Explore a selection of the finest Enhance Customer Retention Measure Sales Performance With Kpi Dashboard Template Pdf here. With a plethora of professionally designed and pre-made slide templates, you can quickly and easily find the right one for your upcoming presentation. You can use our Enhance Customer Retention Measure Sales Performance With Kpi Dashboard Template Pdf to effectively convey your message to a wider audience. Slidegeeks has done a lot of research before preparing these presentation templates. The content can be personalized and the slides are highly editable. Grab templates today from Slidegeeks. This slide provides glimpse about dashboard analysis that can help the business to track the performance of the sales team. It includes KPIs such as sales, sales target, target achievement, sales last year, sales by channel, etc.
Marketing Qualified Leads MQL Performance Measurement Dashboard Ppt Icon Examples PDF
This slide shows dashboard for tracking performance of generated marketing qualified leads. It shows details related to audience, prospects and also shows details related to financial KPIs. Persuade your audience using this Marketing Qualified Leads MQL Performance Measurement Dashboard Ppt Icon Examples PDF. This PPT design covers one stages, thus making it a great tool to use. It also caters to a variety of topics including Audience, Closing Percentage, Per Lead Category, Financial KPIs. Download this PPT design now to present a convincing pitch that not only emphasizes the topic but also showcases your presentation skills.
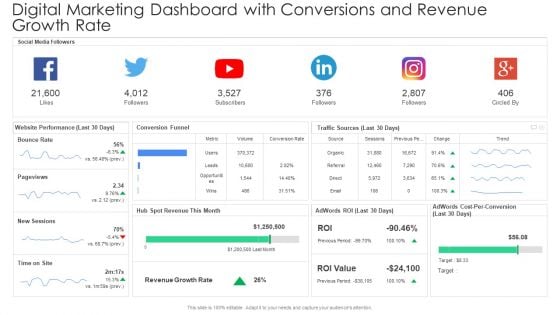
Digital Marketing Dashboard With Conversions And Revenue Growth Rate Template PDF
Deliver and pitch your topic in the best possible manner with this digital marketing dashboard with conversions and revenue growth rate template pdf. Use them to share invaluable insights on bounce rate, pageviews, new sessions and impress your audience. This template can be altered and modified as per your expectations. So, grab it now.
Recruitment Training Enhance Candidate Hiring Process Dashboard For Recruitment Stats Of The Company Icons PDF
This slide shows the. Deliver an awe inspiring pitch with this creative recruitment training enhance candidate hiring process dashboard for recruitment stats of the company icons pdf bundle. Topics like recruitment funnel, application sources, decline reasons can be discussed with this completely editable template. It is available for immediate download depending on the needs and requirements of the user.
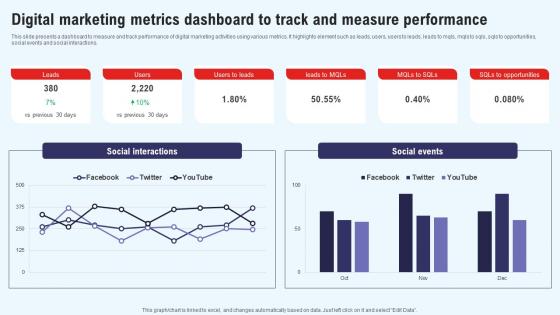
Efficient Marketing Process For Business Digital Marketing Metrics Dashboard To Track Professional Pdf
This slide presents a dashboard to measure and track performance of digital marketing activities using various metrics. It highlights element such as leads, users, users to leads, leads to mqls, mqls to sqls, sqls to opportunities, social events and social interactions. Whether you have daily or monthly meetings, a brilliant presentation is necessary. Efficient Marketing Process For Business Digital Marketing Metrics Dashboard To Track Professional Pdf can be your best option for delivering a presentation. Represent everything in detail using Efficient Marketing Process For Business Digital Marketing Metrics Dashboard To Track Professional Pdf and make yourself stand out in meetings. The template is versatile and follows a structure that will cater to your requirements. All the templates prepared by Slidegeeks are easy to download and edit. Our research experts have taken care of the corporate themes as well. So, give it a try and see the results. This slide presents a dashboard to measure and track performance of digital marketing activities using various metrics. It highlights element such as leads, users, users to leads, leads to mqls, mqls to sqls, sqls to opportunities, social events and social interactions.
Optimizing Client Lead Handling Inbound Lead Performance Tracking Dashboard Pictures Pdf
This slide covers the KPI dashboard for evaluating inbound lead performance. It includes metrics such as lead to opportunity ratio, opportunity to win ratio, lead conversion ratio, inbound leads, and leads in the sales funnel. If you are looking for a format to display your unique thoughts, then the professionally designed Optimizing Client Lead Handling Inbound Lead Performance Tracking Dashboard Pictures Pdf is the one for you. You can use it as a Google Slides template or a PowerPoint template. Incorporate impressive visuals, symbols, images, and other charts. Modify or reorganize the text boxes as you desire. Experiment with shade schemes and font pairings. Alter, share or cooperate with other people on your work. Download Optimizing Client Lead Handling Inbound Lead Performance Tracking Dashboard Pictures Pdf and find out how to give a successful presentation. Present a perfect display to your team and make your presentation unforgettable. This slide covers the KPI dashboard for evaluating inbound lead performance. It includes metrics such as lead to opportunity ratio, opportunity to win ratio, lead conversion ratio, inbound leads, and leads in the sales funnel.
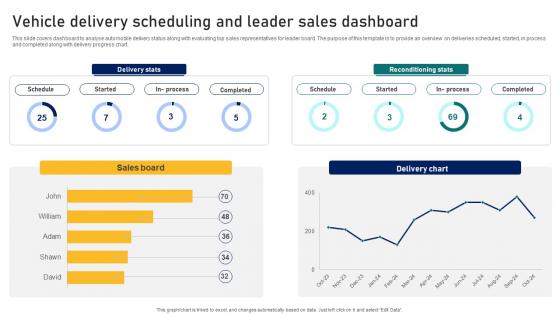
Guide To Building A Successful Vehicle Delivery Scheduling And Leader Sales Dashboard Strategy SS V
This slide covers dashboard to analyse automobile delivery status along with evaluating top sales representatives for leader board. The purpose of this template is to provide an overview on deliveries scheduled, started, in process and completed along with delivery progress chart. Whether you have daily or monthly meetings, a brilliant presentation is necessary. Guide To Building A Successful Vehicle Delivery Scheduling And Leader Sales Dashboard Strategy SS V can be your best option for delivering a presentation. Represent everything in detail using Guide To Building A Successful Vehicle Delivery Scheduling And Leader Sales Dashboard Strategy SS V and make yourself stand out in meetings. The template is versatile and follows a structure that will cater to your requirements. All the templates prepared by Slidegeeks are easy to download and edit. Our research experts have taken care of the corporate themes as well. So, give it a try and see the results. This slide covers dashboard to analyse automobile delivery status along with evaluating top sales representatives for leader board. The purpose of this template is to provide an overview on deliveries scheduled, started, in process and completed along with delivery progress chart.
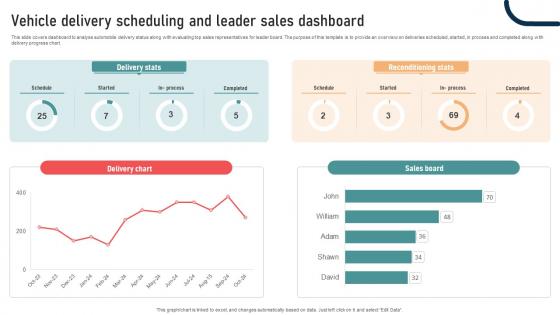
Ultimate Guide To Developing Vehicle Delivery Scheduling And Leader Sales Dashboard Strategy SS V
This slide covers dashboard to analyse automobile delivery status along with evaluating top sales representatives for leader board. The purpose of this template is to provide an overview on deliveries scheduled, started, in process and completed along with delivery progress chart. Whether you have daily or monthly meetings, a brilliant presentation is necessary. Ultimate Guide To Developing Vehicle Delivery Scheduling And Leader Sales Dashboard Strategy SS V can be your best option for delivering a presentation. Represent everything in detail using Ultimate Guide To Developing Vehicle Delivery Scheduling And Leader Sales Dashboard Strategy SS V and make yourself stand out in meetings. The template is versatile and follows a structure that will cater to your requirements. All the templates prepared by Slidegeeks are easy to download and edit. Our research experts have taken care of the corporate themes as well. So, give it a try and see the results. This slide covers dashboard to analyse automobile delivery status along with evaluating top sales representatives for leader board. The purpose of this template is to provide an overview on deliveries scheduled, started, in process and completed along with delivery progress chart.

Marketing And Sales Qualified Lead MQL Dashboard Of Telecom Industry Ppt Outline PDF
This slide represents dashboard showing marketing and sales qualified leads generation for telecom industry. It shows details related to average daily opportunities by role, by representatives etc. Presenting Marketing And Sales Qualified Lead MQL Dashboard Of Telecom Industry Ppt Outline PDF to dispense important information. This template comprises one stages. It also presents valuable insights into the topics including Average Daily, Opportunities By Role, Select Users, Committed Deals. This is a completely customizable PowerPoint theme that can be put to use immediately. So, download it and address the topic impactfully.
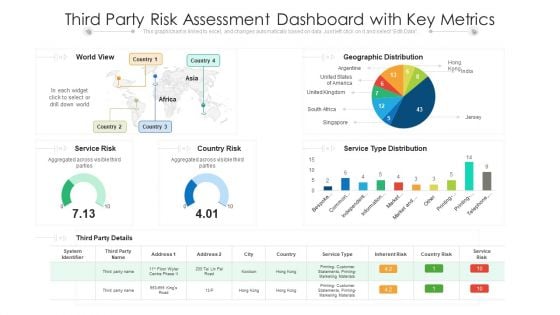
Third Party Risk Assessment Dashboard With Key Metrics Ppt PowerPoint Presentation File Tips PDF
Showcasing this set of slides titled third party risk assessment dashboard with key metrics ppt powerpoint presentation file tips pdf. The topics addressed in these templates are service, geographic, marketing. All the content presented in this PPT design is completely editable. Download it and make adjustments in color, background, font etc. as per your unique business setting.
Annual Financial Performance Administration Dashboard With Key Metrics Ppt PowerPoint Presentation Icon Visual Aids PDF
Showcasing this set of slides titled Annual Financial Performance Administration Dashboard With Key Metrics Ppt PowerPoint Presentation Icon Visual Aids PDF. The topics addressed in these templates are Accounts Receivable, Accounts Payable, Planned Profit Margin. All the content presented in this PPT design is completely editable. Download it and make adjustments in color, background, font etc. as per your unique business setting.
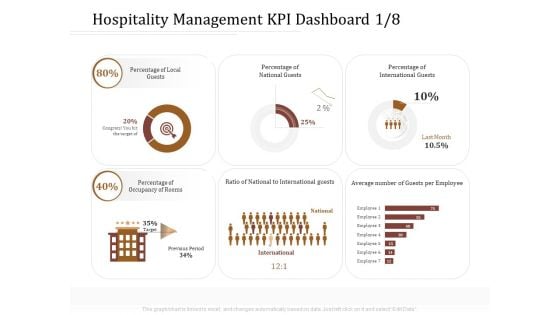
Key Metrics Hotel Administration Management Hospitality Management KPI Dashboard Average Graphics PDF
Presenting this set of slides with name key metrics hotel administration management hospitality management kpi dashboard average graphics pdf. The topics discussed in these slides are local guests, national guests, international guests, occupancy of rooms. This is a completely editable PowerPoint presentation and is available for immediate download. Download now and impress your audience.
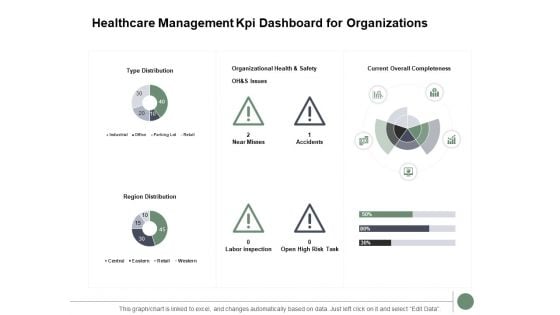
Healthcare Management Kpi Dashboard For Organizations Ppt PowerPoint Presentation Infographics Design Templates
Presenting this set of slides with name healthcare management kpi dashboard for organizations ppt powerpoint presentation infographics design templates. The topics discussed in these slides are providers, facilities, organizations, contributing, insurance. This is a completely editable PowerPoint presentation and is available for immediate download. Download now and impress your audience.
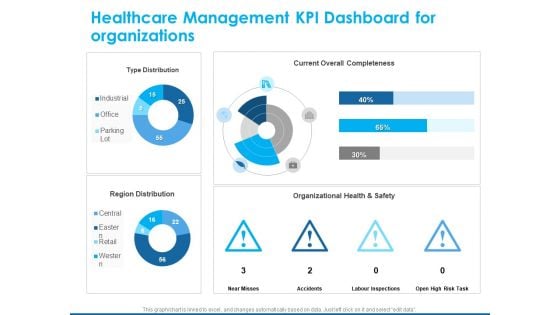
Overview Healthcare Business Management Healthcare Management KPI Dashboard For Organizations Infographics PDF
Presenting this set of slides with name overview healthcare business management healthcare management kpi dashboard for organizations infographics pdf. The topics discussed in these slides are current overall completeness, organizational health and safety, type distribution, region distribution. This is a completely editable PowerPoint presentation and is available for immediate download. Download now and impress your audience.
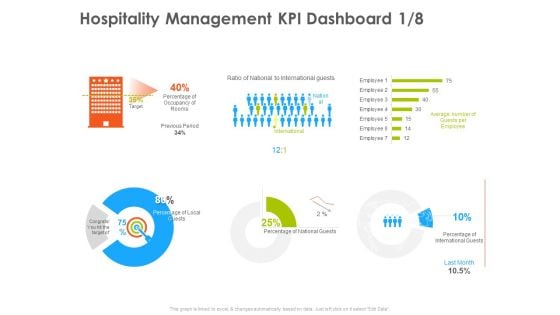
Hotel And Tourism Planning Hospitality Management KPI Dashboard Average Infographics PDF
Deliver and pitch your topic in the best possible manner with this hotel and tourism planning hospitality management kpi dashboard average infographics pdf. Use them to share invaluable insights on local guests, national guests, international guests, occupancy of rooms and impress your audience. This template can be altered and modified as per your expectations. So, grab it now.
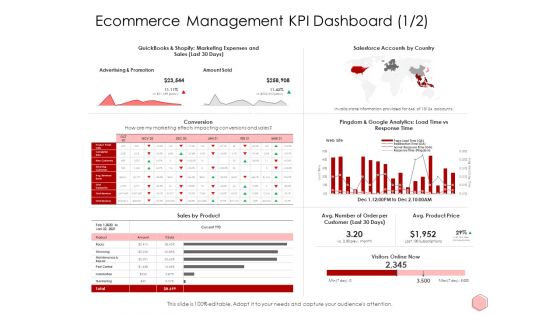
Digitalization Corporate Initiative Ecommerce Management KPI Dashboard Product Price Ppt Infographic Template Examples Pdf
Deliver an awe inspiring pitch with this creative digitalization corporate initiative ecommerce management kpi dashboard product price ppt infographic template examples pdf bundle. Topics like product, sales, marketing, expenses, advertising can be discussed with this completely editable template. It is available for immediate download depending on the needs and requirements of the user.
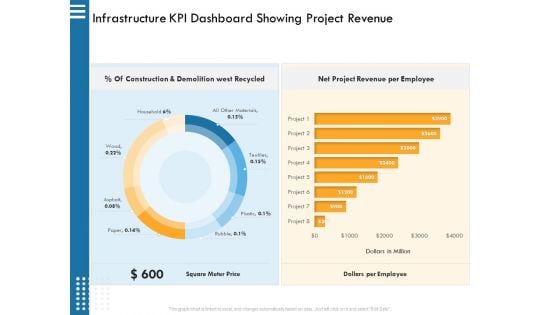
IT Infrastructure Governance Infrastructure KPI Dashboard Showing Project Revenue Ppt Infographic Template Guide PDF
Deliver and pitch your topic in the best possible manner with this it infrastructure governance infrastructure kpi dashboard showing project revenue ppt infographic template guide pdf. Use them to share invaluable insights on employee, revenue, construction, demolition, materials and impress your audience. This template can be altered and modified as per your expectations. So, grab it now.
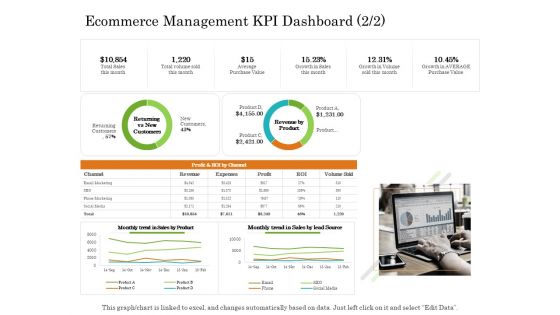
Online Trade Management System Ecommerce Management KPI Dashboard Trend Ppt Infographic Template Guide PDF
Deliver an awe inspiring pitch with this creative online trade management system ecommerce management kpi dashboard trend ppt infographic template guide pdf bundle. Topics like ssales, value, growth, revenue can be discussed with this completely editable template. It is available for immediate download depending on the needs and requirements of the user.
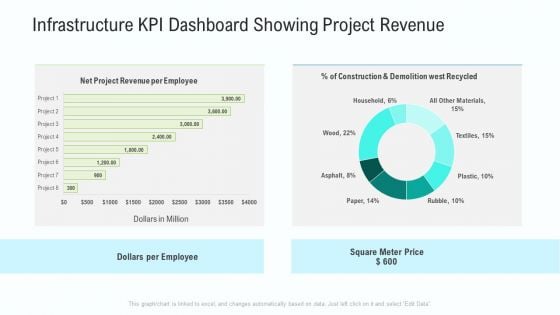
Business Activities Assessment Examples Infrastructure KPI Dashboard Showing Project Revenue Infographics PDF
Deliver an awe inspiring pitch with this creative business activities assessment examples infrastructure kpi dashboard showing project revenue infographics pdf bundle. Topics like net project revenue per employee, construction and demolition west recycled, dollars per employee can be discussed with this completely editable template. It is available for immediate download depending on the needs and requirements of the user.
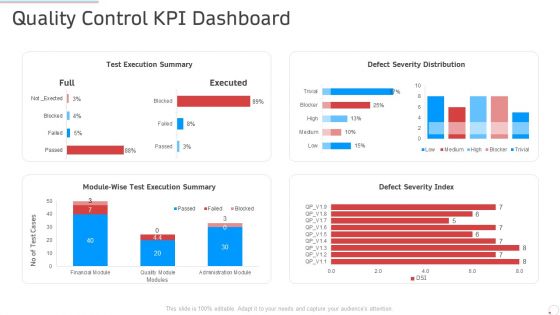
Quality Control Kpi Dashboard Manufacturing Control Ppt Infographics Master Slide PDF
Deliver an awe inspiring pitch with this creative quality control kpi dashboard manufacturing control ppt infographics master slide pdf bundle. Topics like execution, severity, financial can be discussed with this completely editable template. It is available for immediate download depending on the needs and requirements of the user.
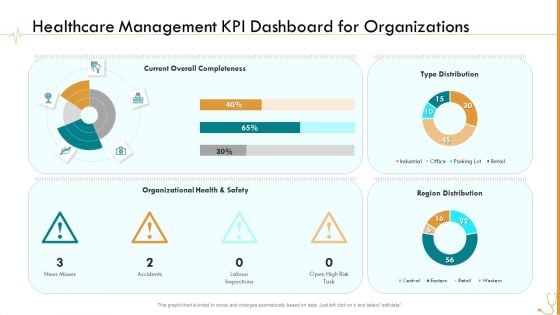
Pharmaceutical Management Healthcare Management KPI Dashboard For Organizations Ppt Infographic Template Slides PDF
Deliver and pitch your topic in the best possible manner with this pharmaceutical management healthcare management kpi dashboard for organizations ppt infographic template slides pdf. Use them to share invaluable insights on current overall completeness, type distribution, region distribution, organizational health and safety and impress your audience. This template can be altered and modified as per your expectations. So, grab it now.
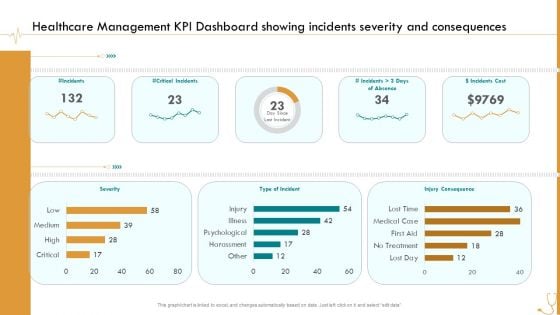
Pharmaceutical Management Healthcare Management KPI Dashboard Showing Incidents Severity And Consequences Ppt Infographic Template Show PDF
Deliver and pitch your topic in the best possible manner with this pharmaceutical management healthcare management kpi dashboard showing incidents severity and consequences ppt infographic template show pdf. Use them to share invaluable insights on severity, type of incident, injury consequence and impress your audience. This template can be altered and modified as per your expectations. So, grab it now.
Dashboard To Measure Performance Of E Commerce Retail Business Growth Marketing Techniques Icons PDF
This following slide displays the key metrics that can help an organization to measure effectiveness of e-commerce strategies. These can be revenue generated using e-commerce platform, conversion rates etc. If your project calls for a presentation, then Slidegeeks is your go to partner because we have professionally designed, easy to edit templates that are perfect for any presentation. After downloading, you can easily edit Dashboard To Measure Performance Of E Commerce Retail Business Growth Marketing Techniques Icons PDF and make the changes accordingly. You can rearrange slides or fill them with different images. Check out all the handy templates
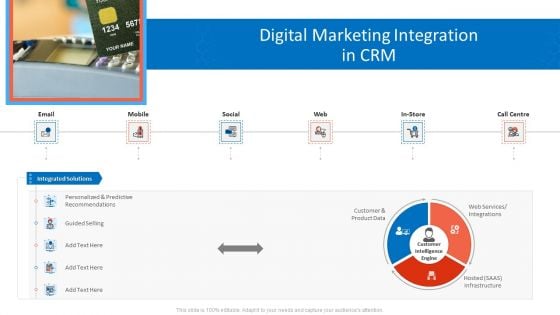
Customer Relationship Management Dashboard Digital Marketing Integration In CRM Diagrams PDF
Deliver and pitch your topic in the best possible manner with this customer relationship management dashboard digital marketing integration in crm diagrams pdf. Use them to share invaluable insights on personalized and predictive recommendations, guided selling, customer and product data and impress your audience. This template can be altered and modified as per your expectations. So, grab it now.
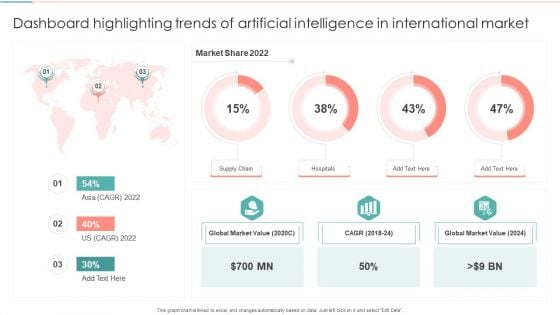
Dashboard Highlighting Trends Of Artificial Intelligence In International Market Inspiration PDF
Showcasing this set of slides titled Dashboard Highlighting Trends Of Artificial Intelligence In International Market Inspiration PDF. The topics addressed in these templates are Global Market, Market Value, Market Share. All the content presented in this PPT design is completely editable. Download it and make adjustments in color, background, font etc. as per your unique business setting.
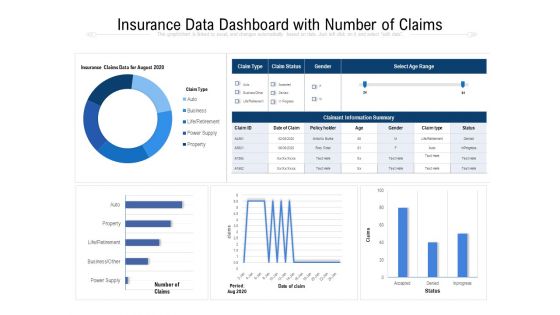
Insurance Data Dashboard With Number Of Claims Ppt PowerPoint Presentation Show Brochure PDF
Pitch your topic with ease and precision using this insurance data dashboard with number of claims ppt powerpoint presentation professional inspiration pdf. This layout presents information on business, power supply, property, accepted, category. It is also available for immediate download and adjustment. So, changes can be made in the color, design, graphics or any other component to create a unique layout.
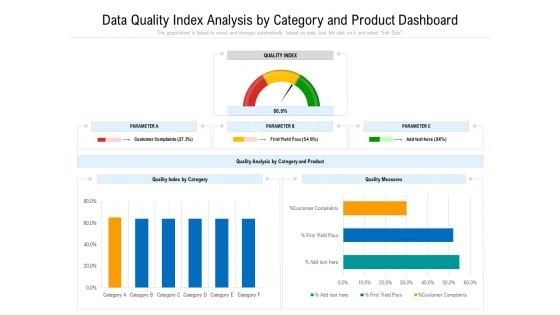
Data Quality Measurement Dashboard With Various Parameters Ppt PowerPoint Presentation Show Smartart PDF
Showcasing this set of slides titled data quality measurement dashboard with various parameters ppt powerpoint presentation show smartart pdf. The topics addressed in these templates are parametera, quality index by category, quality measures, quality index. All the content presented in this PPT design is completely editable. Download it and make adjustments in color, background, font etc. as per your unique business setting.
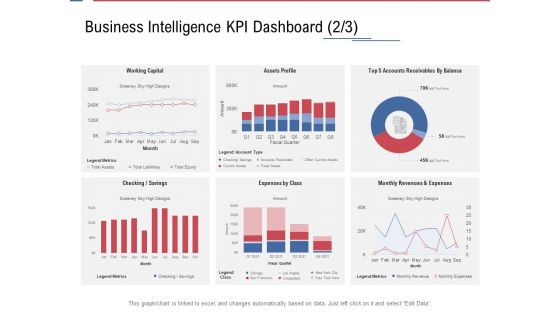
Data Assimilation Business Intelligence KPI Dashboard Sky Ppt Background Images PDF
Deliver an awe inspiring pitch with this creative data assimilation business intelligence kpi dashboard sky ppt background images pdf bundle. Topics like expenses, working capital, checking savings, revenues, assets can be discussed with this completely editable template. It is available for immediate download depending on the needs and requirements of the user.
Information Security Dashboard For Threat Tracking In Data Security Summary PDF
Deliver an awe inspiring pitch with this creative information security dashboard for threat tracking in data security summary pdf bundle. Topics like monthly threat status, current risk status, threats based on role, threats by owners, risk by threats can be discussed with this completely editable template. It is available for immediate download depending on the needs and requirements of the user.
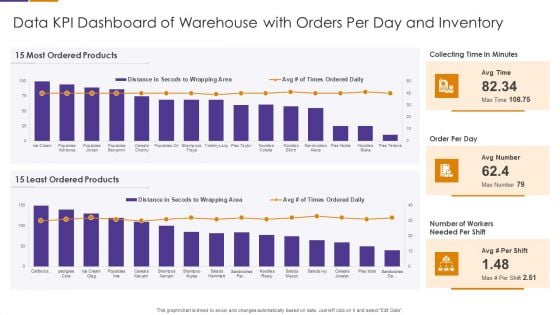
Data KPI Dashboard Of Warehouse With Orders Per Day And Inventory Brochure PDF
Showcasing this set of slides titled Data KPI Dashboard Of Warehouse With Orders Per Day And Inventory Brochure PDF The topics addressed in these templates are Most Ordered Products, Least Ordered Products, Collecting Time In Minutes All the content presented in this PPT design is completely editable. Download it and make adjustments in color, background, font etc. as per your unique business setting.

KPI Dashboard Of Data Warehouse Overview With Delivery Reliability Clipart PDF
Pitch your topic with ease and precision using this KPI Dashboard Of Data Warehouse Overview With Delivery Reliability Clipart PDF This layout presents information on Delivery Reliability, Complaint Reasons, Delivery Reliability Retention And Expansion It is also available for immediate download and adjustment. So, changes can be made in the color, design, graphics or any other component to create a unique layout.

KPI Dashboard Of Data Warehouse With Expansion By Months Themes PDF
Showcasing this set of slides titled KPI Dashboard Of Data Warehouse With Expansion By Months Themes PDF The topics addressed in these templates are Customer Lifetime Value, Salesforce Revenue, Retention And Expansion All the content presented in this PPT design is completely editable. Download it and make adjustments in color, background, font etc. as per your unique business setting.
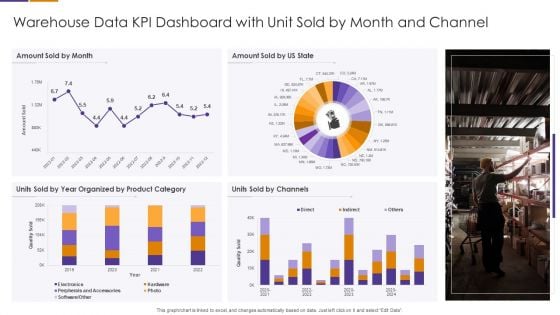
Warehouse Data KPI Dashboard With Unit Sold By Month And Channel Elements PDF
Showcasing this set of slides titled Warehouse Data KPI Dashboard With Unit Sold By Month And Channel Elements PDF The topics addressed in these templates are Organized By Product Category, Units Sold By Channels, Peripherals And Accessories All the content presented in this PPT design is completely editable. Download it and make adjustments in color, background, font etc. as per your unique business setting.
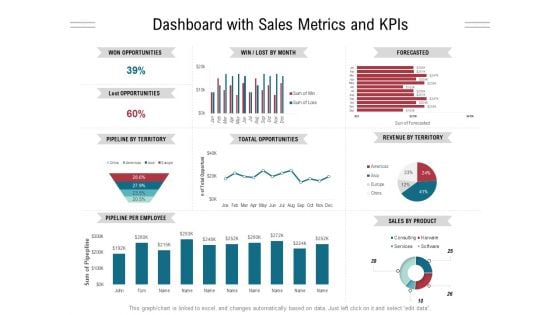
Dashboard With Sales Metrics And Kpis Ppt PowerPoint Presentation Gallery Styles PDF
Presenting this set of slides with name dashboard with sales metrics and kpis ppt powerpoint presentation gallery styles pdf. The topics discussed in these slides are won opportunities, lost opportunities, pipeline by territory, pipeline per employee, forecasted, revenue territory, sales product. This is a completely editable PowerPoint presentation and is available for immediate download. Download now and impress your audience.
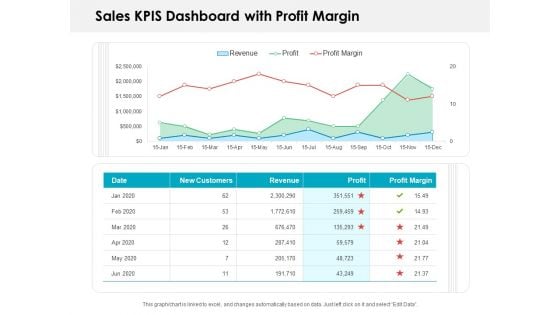
Sales KPIS Dashboard With Profit Margin Ppt PowerPoint Presentation Slides Show PDF
Presenting this set of slides with name sales kpis dashboard with profit margin ppt powerpoint presentation slides show pdf. The topics discussed in these slides are new customers, revenue, profit, profit margin. This is a completely editable PowerPoint presentation and is available for immediate download. Download now and impress your audience.
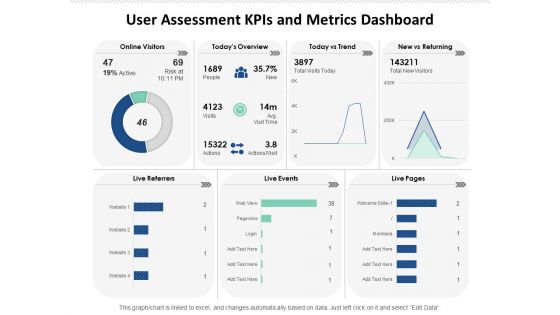
User Assessment Kpis And Metrics Dashboard Ppt PowerPoint Presentation File Infographics PDF
Presenting this set of slides with name user assessment kpis and metrics dashboard ppt powerpoint presentation file infographics pdf. The topics discussed in these slides are online visitors, todays overview, today vs trend, new vs returning. This is a completely editable PowerPoint presentation and is available for immediate download. Download now and impress your audience.
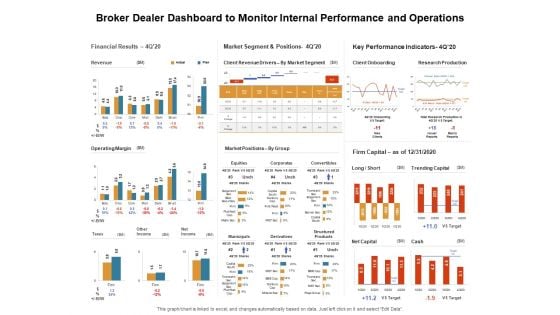
Venture Capitalist Control Board Broker Dealer Dashboard To Monitor Internal Performance And Operations Information PDF
Presenting this set of slides with name venture capitalist control board broker dealer dashboard to monitor internal performance and operations information pdf. The topics discussed in these slides are financial results, market segment and positions, key performance indicators. This is a completely editable PowerPoint presentation and is available for immediate download. Download now and impress your audience.
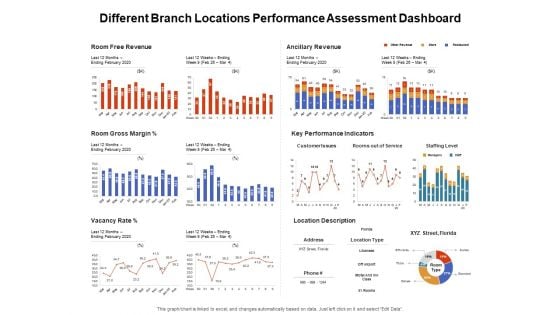
Venture Capitalist Control Board Different Branch Locations Performance Assessment Dashboard Graphics PDF
Presenting this set of slides with name venture capitalist control board different branch locations performance assessment dashboard graphics pdf. The topics discussed in these slides are room free revenue, ancillary revenue, key performance indicators, room gross margin, location description, vacancy rate. This is a completely editable PowerPoint presentation and is available for immediate download. Download now and impress your audience.

Stock Market Research Report Organization Performance Dashboard For Equity Research Slides PDF
Deliver an awe-inspiring pitch with this creative stock market research report organization performance dashboard for equity research slides pdf bundle. Topics like balance sheet, return on assets, working capital ratio, return on equity, debt equity ratio can be discussed with this completely editable template. It is available for immediate download depending on the needs and requirements of the user.
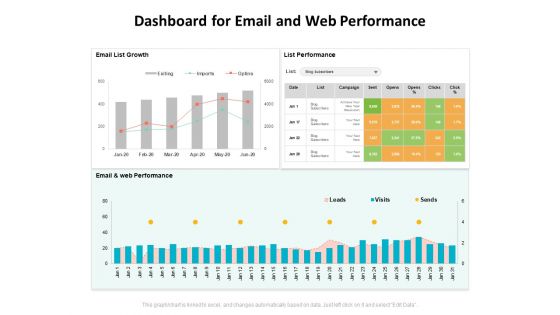
Dashboard For Email And Web Performance Ppt PowerPoint Presentation Infographics Visual Aids PDF
Presenting this set of slides with name dashboard for email and web performance ppt powerpoint presentation infographics visual aids pdf. The topics discussed in these slides are email list growth, list performance, email and web performance. This is a completely editable PowerPoint presentation and is available for immediate download. Download now and impress your audience.
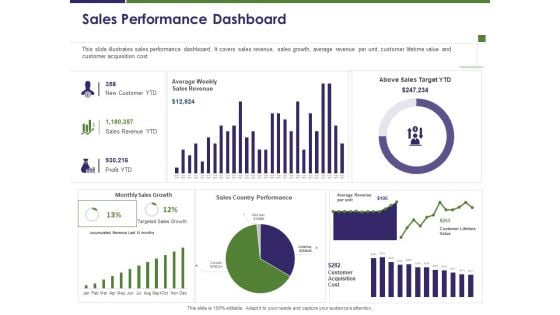
Business Intelligence Report Sales Performance Dashboard Ppt Infographic Template Examples PDF
Presenting this set of slides with name business intelligence report sales performance dashboard ppt infographic template examples pdf. The topics discussed in these slides are new customer, sales revenue, profit, sales target, targeted sales growth. This is a completely editable PowerPoint presentation and is available for immediate download. Download now and impress your audience.
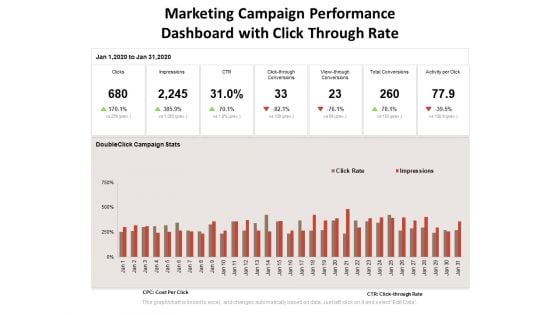
Marketing Campaign Performance Dashboard With Click Through Rate Ppt PowerPoint Presentation Infographics Example File PDF
Presenting this set of slides with name marketing campaign performance dashboard with click through rate ppt powerpoint presentation infographics example file pdf. The topics discussed in these slides are clicks, impressions, ctr, click through, conversions, view through, conversions, total conversions, activity per click. This is a completely editable PowerPoint presentation and is available for immediate download. Download now and impress your audience.
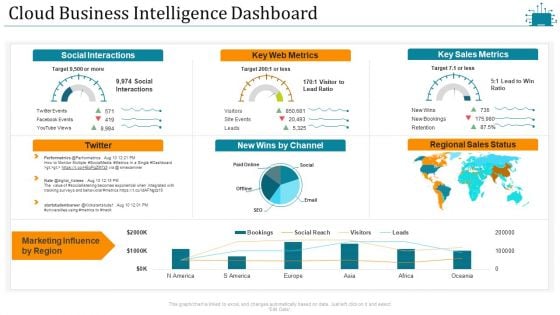
Cloud Intelligence Framework For Application Consumption Cloud Business Intelligence Dashboard Slides PDF
Deliver an awe inspiring pitch with this creative cloud intelligence framework for application consumption cloud business intelligence dashboard slides pdf bundle. Topics like social interactions, key web metrics, key sales metrics, marketing influence by region can be discussed with this completely editable template. It is available for immediate download depending on the needs and requirements of the user.
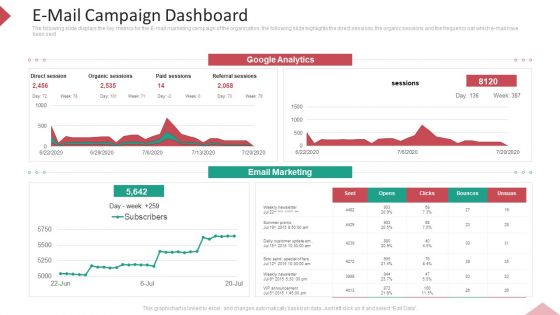
Inbound Interruption Commerce Promotion Practices E Mail Campaign Dashboard Ppt Inspiration Topics PDF
The following slide displays the key metrics for the E-mail marketing campaign of the organization, the following slide highlights the direct sessions, the organic sessions and the frequency oat which e-mail have been sent. Deliver and pitch your topic in the best possible manner with this inbound interruption commerce promotion practices E mail campaign dashboard ppt inspiration topics pdf. Use them to share invaluable insights on organic sessions, email marketing, google analytics and impress your audience. This template can be altered and modified as per your expectations. So, grab it now.
Digital Transformation Strategy Roadmap Digital Vitality Dashboard Ppt PowerPoint Presentation Icon Background Images PDF
Presenting this set of slides with name digital transformation strategy roadmap digital vitality dashboard ppt powerpoint presentation icon background images pdf. The topics discussed in these slides are digital vitality score, strategy, data, organizational alignment, customer experience. This is a completely editable PowerPoint presentation and is available for immediate download. Download now and impress your audience.
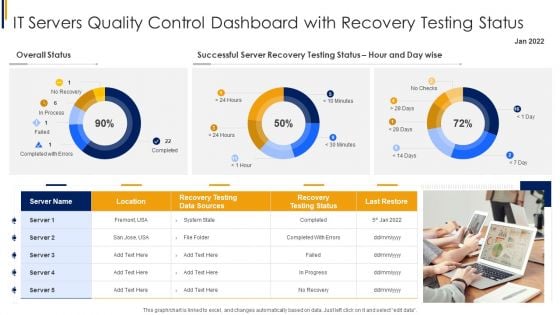
IT Servers Quality Control Dashboard With Recovery Testing Status Introduction PDF
Showcasing this set of slides titled IT Servers Quality Control Dashboard With Recovery Testing Status Introduction PDF. The topics addressed in these templates are Data Sources, Recovery Testing, System State. All the content presented in this PPT design is completely editable. Download it and make adjustments in color, background, font etc. as per your unique business setting.
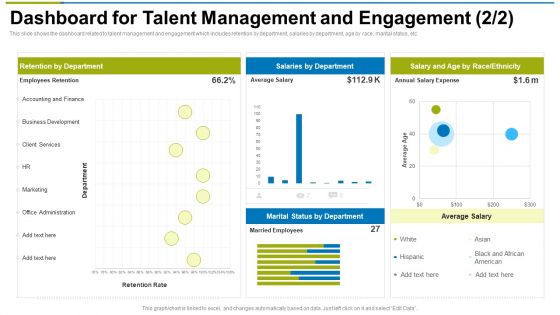
Dashboard For Talent Management And Engagement Average Ppt Styles Infographic Template PDF
Deliver an awe inspiring pitch with this creative dashboard for talent management and engagement average ppt styles infographic template pdf bundle. Topics like finance, retention by department can be discussed with this completely editable template. It is available for immediate download depending on the needs and requirements of the user.
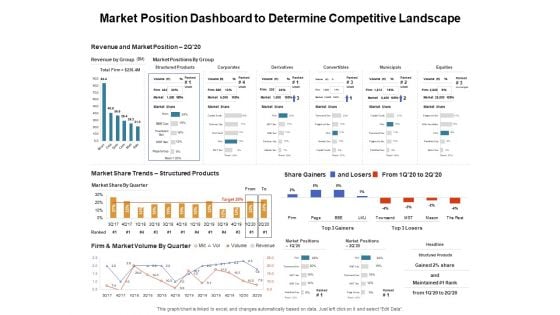
Venture Capitalist Control Board Market Position Dashboard To Determine Competitive Landscape Download PDF
Presenting this set of slides with name venture capitalist control board market position dashboard to determine competitive landscape download pdf. The topics discussed in these slides are revenue and market position, market share trends, firm and market volume by quarter. This is a completely editable PowerPoint presentation and is available for immediate download. Download now and impress your audience.
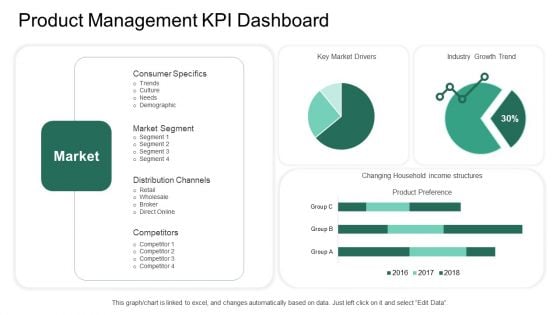
Market Potential Analysis Product Management KPI Dashboard Ppt Professional Inspiration PDF
Deliver an awe inspiring pitch with this creative market potential analysis product management KPI dashboard ppt professional inspiration pdf bundle. Topics like key market drivers, industry growth trend, competitors, market segment, product preference can be discussed with this completely editable template. It is available for immediate download depending on the needs and requirements of the user.


 Continue with Email

 Home
Home


